
Abstract
Interventions are implemented with greater fidelity when their core intent is made explicit. The core intent of this intervention was to increase access to higher order learning opportunities for students with learning disabilities or difficulties in mathematics through use of research and practice from the fields of special education and mathematics education. Four steps undertaken in the development of a Tier II fraction-based mathematics intervention designed to improve the conceptual understanding of students with learning disabilities or difficulties are described in this article: (a) articulation of a logic model, (b) delineation of intervention components, (c) analysis of reliability data related to implementation fidelity, and (d) pilot testing to measure implementation fidelity and student outcomes. Results of the pilot study demonstrated no significant effect for the component of technology; however, significant pre–post differences were found in the performance of all groups on their conceptual understanding of fractions as numbers.
Ensuring fidelity of implementation is critical to an intervention’s success (O’Donnell, 2008). Fidelity of implementation can be measured during one or more stages of intervention development, including (a) development and pilot testing, (b) efficacy trials, (c) research at scale, and (d) application in real-world settings (Smolkowski & Crawford, this issue). This article explores implementation fidelity as related to Stage 1, the design and initial testing of an intervention (Onken, Blaine, & Battjes, 1997). Questions about implementation fidelity at Stage 1 concern themselves with the what, why, and how of an intervention (Hulleman & Cordray, 2009). As an example, Doabler et al. (2015) illustrate this relationship between theory (why), curriculum (what), and practice (how), in their paper on the design and development of a Tier II mathematics intervention. In contrast, implementation fidelity questions asked during other stages of the research process investigate “how much” (e.g., dosage) and “how well” (e.g., integrity; see, for example, Harn, Parisi, & Stoolmiller, 2013; Woodbridge et al., 2014). Answers to all of these questions are important to assuring an intervention’s fidelity of implementation as a necessary component in an evidence-based intervention (Fixsen, Naoom, Blase, Friedman, & Wallace, 2005).
Stage 1 activities undertaken during the design and development of a Tier II fraction-based mathematics intervention (the fractions intervention) are the topic of this article. The intervention focused on developing the fraction number sense (Siegler, Fazio, Bailey, & Zhou, 2013), or fraction-sense, of students with learning disabilities (LD) or difficulties in fifth and sixth grade. Specifically, the intervention prompted students to explore and explain number patterns to better understand fraction magnitude and demonstrate this understanding by comparing and ordering fractions of different sizes through use of traditional paper and pencil tools or various technology-based supports such as audio recording, keyboarding, and drawing tools (all of which were intended to support students’ conceptual understanding).
Four steps undertaken during the design and development of the fractions intervention are detailed in this article: (a) articulation of a logic model influenced by theoretical frames of reference, (b) delineation of the components included in the intervention hypothesized to improve students’ conceptual understanding of fractions as numbers, (c) collection of initial reliability data related to implementation fidelity, and (d) pilot testing to study the effects of technology as a possible core component while measuring implementation fidelity in controlled settings and collecting data on initial student outcomes. These steps align with four of the six guidelines presented by O’Donnell (2008) in her framework for measuring fidelity of implementation in K-12 curriculum interventions. The first two steps are theoretical in nature, more nuanced, and harder to measure than the last two steps. The last two steps are more empirical. In this article, equal weight is given to the work undertaken at all four steps, encompassing both theory and application.
Step 1: Articulation of a Logic Model
The underlying logic behind the creation of any new instructional intervention is fundamentally about making things better than they currently are for students. Intervention, thus, inevitably requires a change in the way things are done. Such change may be big or small, political or bureaucratic, adaptive or technical, but one way or another it means that something will be done differently. The design and development of an instructional intervention—like the design of other educational programs, curricula, and policies—is influenced not only by theories of teaching and learning but also by ethical and philosophical theories, be they explicitly or implicitly held (Freeman, 2012; Hargreaves & Fullan, 2009; Terzi, 2010). The application of a theoretical lens influences the nature of the inquiry, the methodology, the measures used and type of data collected, the kinds of relationships between researchers and participants, and the call for action (Creswell, 2009; Mertens, 2010). Thus, the design of instructional intervention is not value-neutral—nor should it be—especially when the aim of the endeavor is to transform the achievement of students who consistently underperform their grade-level peers (National Assessment of Educational Progress, 2017). How a problem is conceived, what programmatic objectives are agreed upon, what assumptions are taken, which literature is used, what needs to change, which learning paradigm is selected, who is affected, who is involved in the development process, and other such design issues associated with creating a new instructional intervention are value-based judgments (Terzi, 2010). It is important to underscore, however, that the presence of a theoretical lens in no way diminishes the need for intervention development to adhere to a rigorous scientifically based design process and be supported by empirical data (Doabler et al., 2015).
A logic model provides a visual representation of the theoretical and research-based components of an educational program or intervention. In a logic model, outcomes and indicators are specified that are used to measure whether the intervention was successful, how it worked, and where it broke down (Glennerster & Takavarasha, 2013). The construction of a logic model takes place, as general practice, at the forefront of a new intervention. It is grounded in theory and informed by empirical evidence. Communicating the theory behind an intervention’s logic model is suggested as a first step toward achieving its fidelity of implementation (O’Donnell, 2008). This is particularly important for “unprescribed” interventions, such as the one described herein, that require teachers to implement different steps in response to students’ displayed understanding (Munter, Wilhelm, Cobb, & Cordray, 2014). In the absence of a standardized instructional script or a set of predetermined teacher responses, fidelity of implementation relies on the alignment of instructional decisions in accordance with an intervention’s theoretical framework (Munter et al., 2014). Logic models operationalize the theory underlying an intervention, thus strengthening its fidelity of implementation.
Logic Model of the Fractions Intervention
The theoretical frame of reference for the fractions intervention was informed by both the fields of mathematics education and special education, and the merging of theory and practice from both fields is made explicit through the inclusion of its varied components (as discussed in Step 2 below). Members of the development team agreed that improving students’ understanding of fractions as numbers is an important precursor to learning more advanced mathematical concepts (Bailey, Hoard, Nugent, & Geary, 2012). The team also acknowledged the importance of providing equitable access to learning opportunities that promote higher order thinking (Bryant & Bryant, 2008), also known as the “equity principle” according to the National Council of Teachers of Mathematics (NCTM; 2000). But, Woodward and Brown (2006, p. 151) stated, “One of the most difficult arenas for the equity principle involves students at risk for special education or students with learning disabilities,” as access to similar opportunities does not always result in similar outcomes for students in general and special education.
Although the development team shared the core value of equitable opportunities to access higher order learning opportunities, they did express theoretical and methodological differences similar to those reported by Hudson, Miller, and Butler (2006) and differed in their ideas about the most effective instructional methods for teaching mathematics to students with LD or difficulties. The resulting logic model is, thus, an amalgamation of components, some of which align more closely with adopted learning theories in the field of mathematics education (e.g., constructivism) and others aligning more closely with theories associated with the field of special education (e.g., behaviorism). In combining research and theory from both of these fields, the team attempted to design an intervention with the power to engage students as independent learners who were capable of bringing their own problem-solving strategies to the table while not losing sight of what we know about effective instruction for students with LD. The team agreed that “. . . stronger and more productive collaborations between the special education and mathematics education communities could result in models of instruction that better serve all students but particularly those who are low performing” (Ochsendorf, 2016, p. 574).
The logic model created for this intervention, thus, consisted of advancing students through increasingly sophisticated levels of carefully sequenced content related to fractions as numbers. Drawing on instructional practices from mathematics and special education, students engaged in socially mediated, small-group learning as guided by a detailed instructional protocol (not script). The core intent of the fractions intervention, providing equitable access to higher order learning opportunities designed to improve fraction-sense, was supported through both the use of technology and the incorporation of an instructional protocol that allowed for teacher adaptations based on student responses to instruction. The immediate goal of the intervention was to improve students’ conceptual understanding of the magnitude of fractions (proximal outcome). Two distal outcomes, not measured directly in this study, were to increase students’ engagement in, and communication about, mathematics and improve their overall mathematics achievement. See Figure 1 for the logic model used in the fractions intervention.
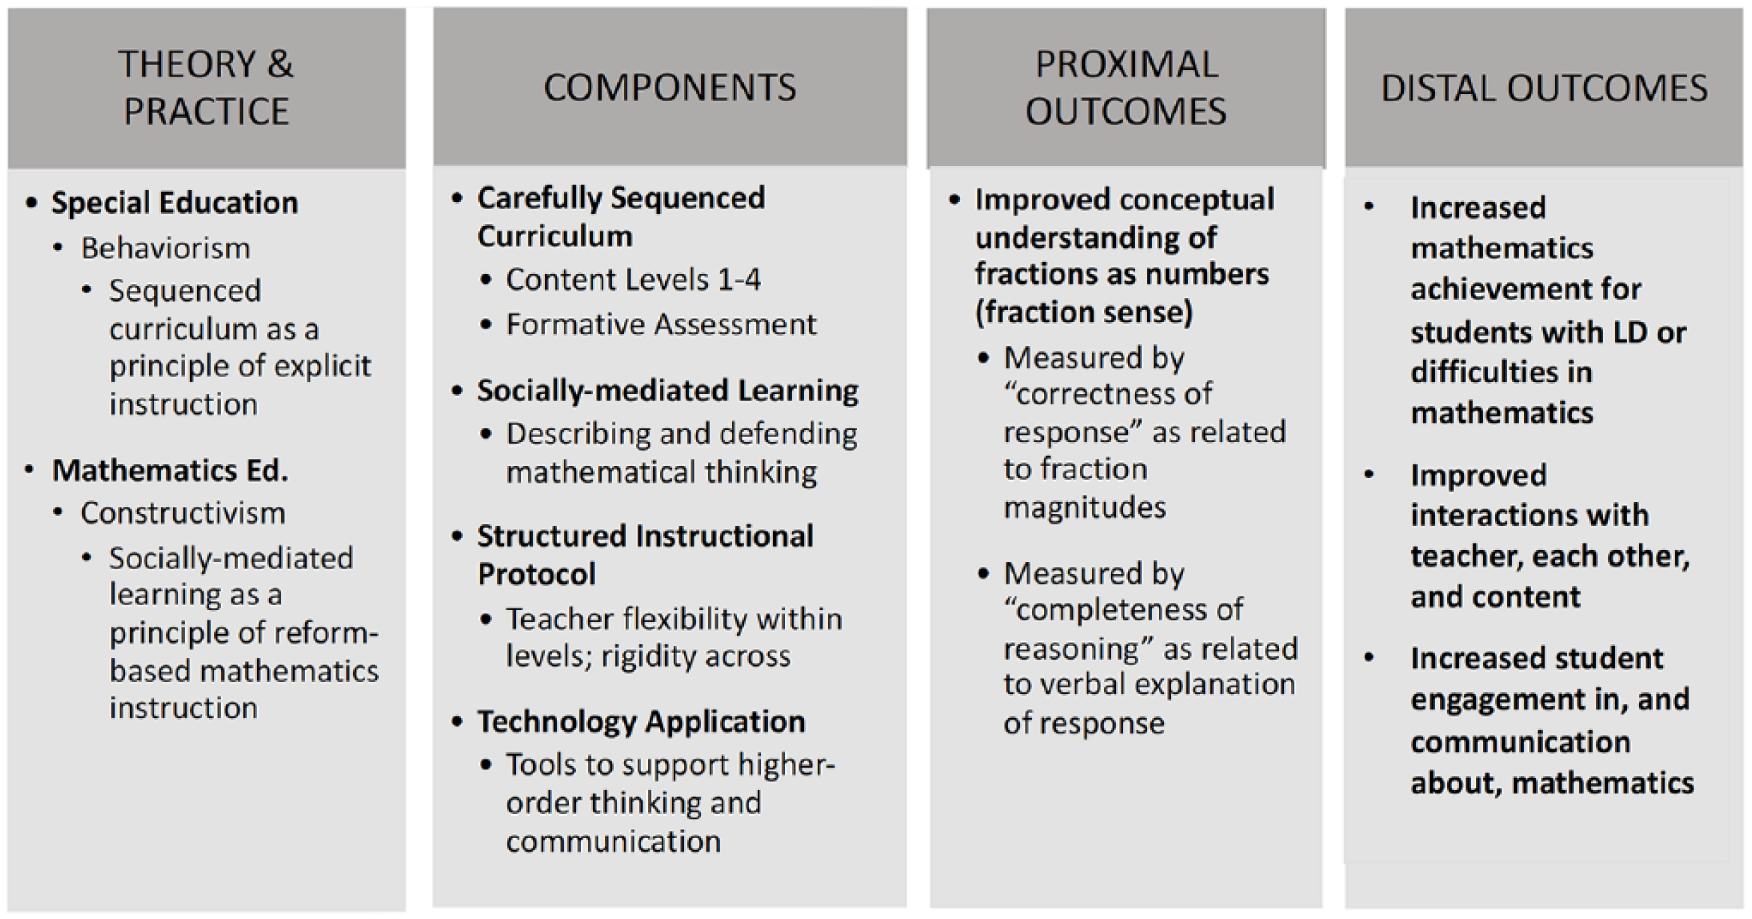
Logic model used in the fractions intervention.
Step 2: Delineation of Intervention’s Components
Core components refer to the “most essential and indispensable components of an intervention practice or program” (Fixsen et al., 2005, p. 24). Identifying components of an intervention separating it from business-as-usual conditions is a critical step toward ensuring its fidelity of implementation (Century, Rudnick, & Freeman, 2010), including the firmness or flexibility associated with implementation of its different parts (Fixsen et al., 2005; Harn et al., 2013). This step also provides a context for interpreting student outcomes attributed to the intervention (Dusenbury, Brannigan, Falco, & Hansen, 2003). The four components contained in the fractions intervention were as follows: (a) inclusion of carefully sequenced content based on increasingly sophisticated fraction concepts; (b) use of socially mediated, small-group instruction; (c) employment of a structured instructional protocol; and (d) incorporation of technology tools to facilitate conceptual understanding. This study’s sample size limited the number of components (i.e., treatments) that could be studied independently; therefore, only the use of technology tools was measured in isolation, extending previous research on the contribution of technology in the learning of mathematics (Crawford, Higgins, Huscroft-D’Angelo, & Hall, 2016; Huscroft-D’Angelo, Higgins, & Crawford, 2014).
Carefully Sequenced Content
Students in this study were asked to compare two fractions or order three or more fractions by size, and explain the reasoning behind their responses. Fraction knowledge has been identified as a precursor to achievement in more advanced mathematics such as algebra (National Mathematics Advisory Panel, 2008; Siegler et al., 2012). Accurate representation of fraction magnitude is foundational to conceptual understanding of, and procedural fluency with, fraction problems (Siegler et al., 2013). More specifically, Fuchs and colleagues (Fuchs et al., 2016) have reported positive effects for student explanation (specifically, supported explanations), on both accuracy and quality of answers as related to fraction magnitude comparison problems.
Carefully sequenced introduction of content is an important principle in special education curriculum design (Stein, Carnine, & Dixon, 1998); thus, fraction magnitude comparison problems were arranged into four content levels, each building on students’ conceptual understanding established at prior levels. Research and recommendations from the field of mathematics education informed the types of fraction problems contained in each level (Clarke & Roche, 2009; Cramer, 2003; Cramer, Wyberg, & Leavitt, 2009). More specifically, Content Level 1 involved comparing and ordering unit fractions (i.e., fractions with 1 as a numerator). Content Level 2 engaged students in comparing and ordering non-unit fractions with the same numerator. Content Level 3 focused on student comparison of fractions using the transitive property (in this case, comparing with the benchmark fraction of ½ as contained in all problem sets). Finally, Content Level 4 continued a focus on the transitive property to compare the size of two fractions, but did not include ½ in the problem set, and advanced from even to odd denominators. The curriculum was sequenced in this way so that students could leverage the knowledge learned at each level (as formatively assessed through use of checkout [CO] problems), to engage with more advanced concepts presented in subsequent levels. See Figure 2 for an overview.
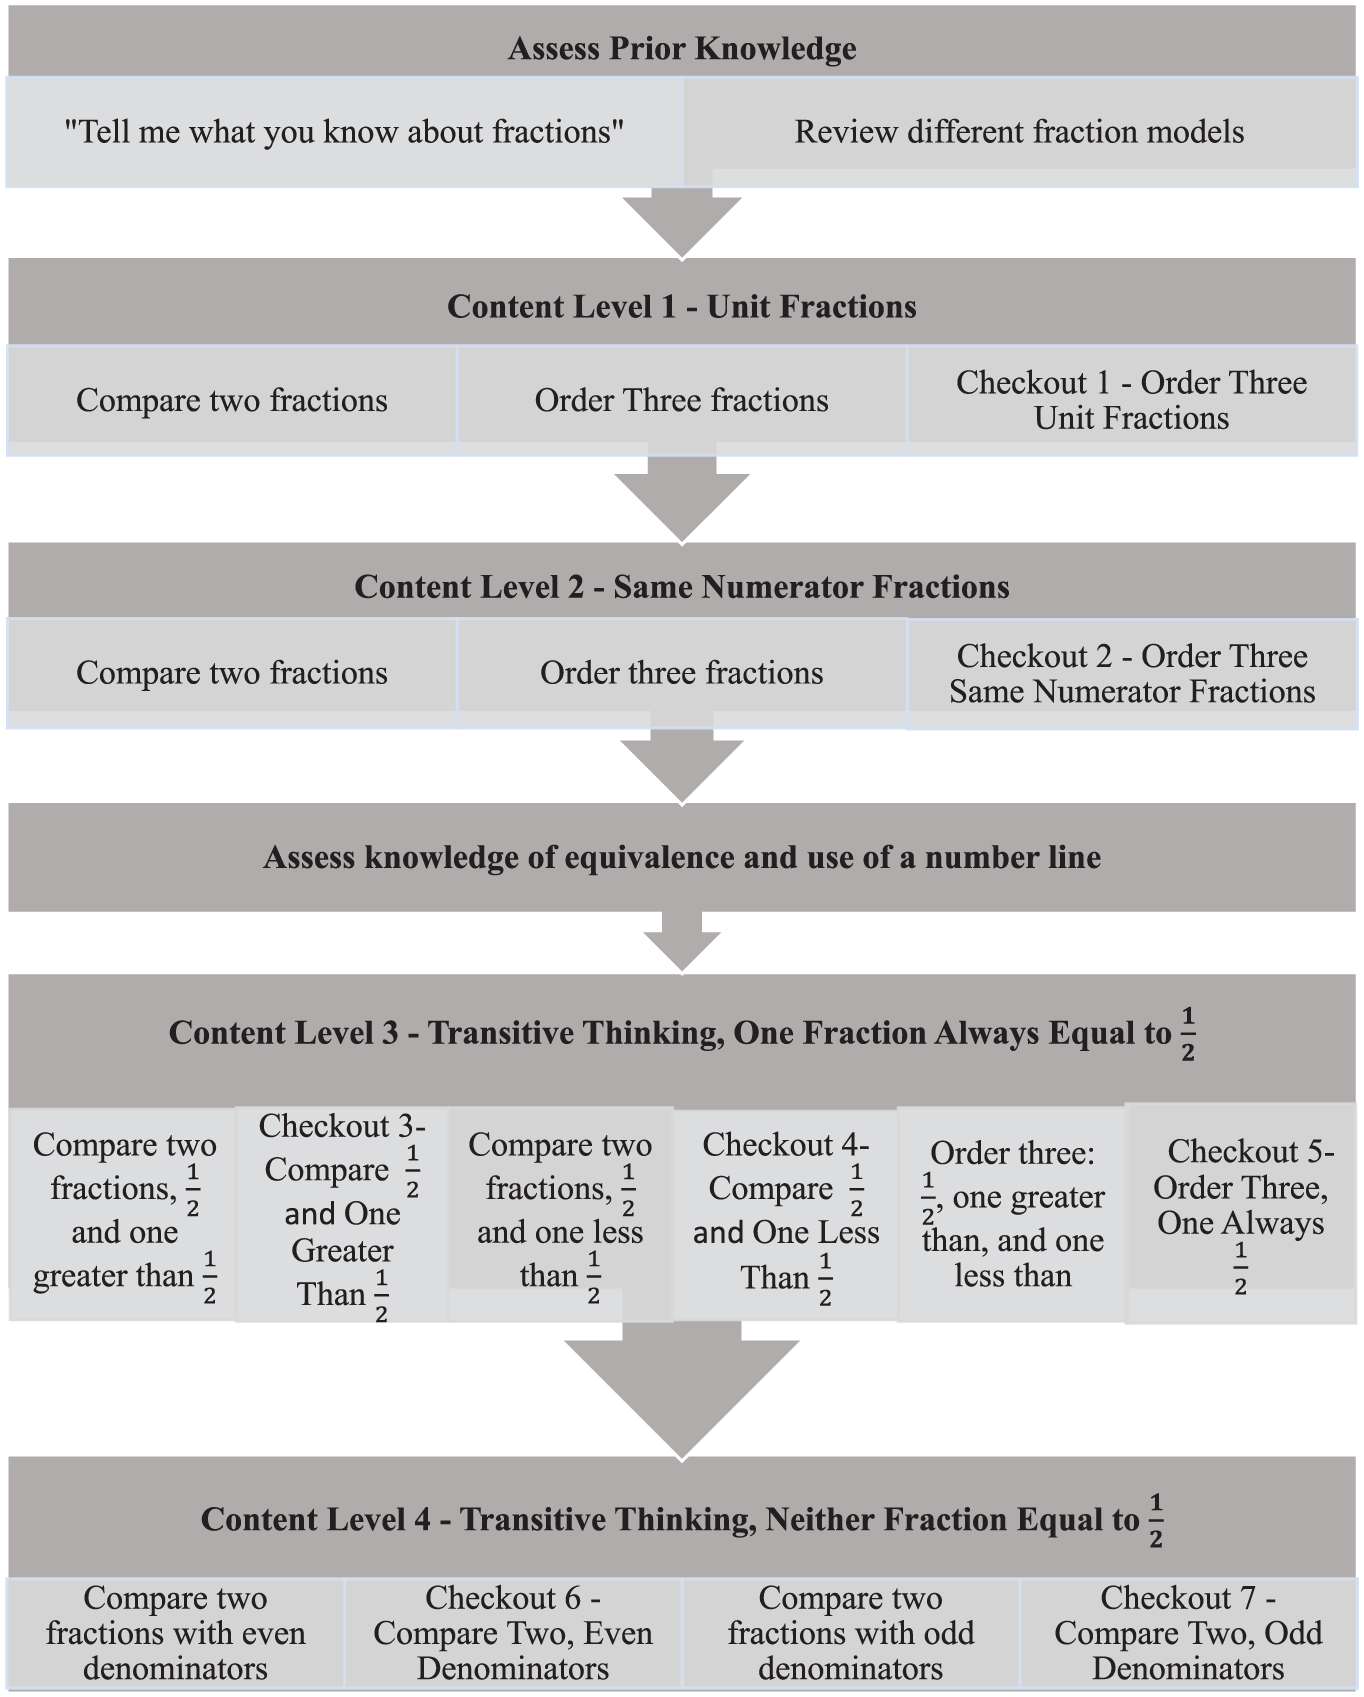
Fractions intervention framework.
Socially Mediated, Small-Group Instruction
The second component of the intervention was the use of socially mediated, small-group instruction. Learning as a socially mediated phenomenon is more closely associated with general mathematics education than with special education (van Garderen, Scheuermann, Jackson, & Hampton, 2009). In a socially mediated approach, students learn to solve problems and test the viability of their understanding through working with others (Rorty, 1991; Von Glaserfeld, 1989). This model of teaching and learning, or “learning and teaching” (Clements & Sarama, 2004, p. 81), gives attention to the interplay between teachers, the curriculum, and the learners that allows some freedom for movement within the instructional activities. Past research has shown that this model of instruction (student-led as opposed to teacher-directed) produces desired change when used with typical learners (Clements, Sarama, Spitler, Lange, & Wolfe, 2011; Szilágyi, Clements, & Sarama, 2013). Socially mediated instruction, however, has been found to be less effective than direct instruction models for teaching students with LD, although these findings have been based on far more research conducted on the teaching of basic skills (where direct instruction makes sense), than on mathematical problem solving (Kroesbergen & VanLuit, 2003). We concur with Gersten et al. (2009), acknowledging that although “explicit instruction is an important tool for teaching mathematics to students with learning disabilities, it is important to note that there is no evidence supporting explicit instruction as the only mode of instruction for these students” (p. 1229; emphasis added) Explicit teacher-directed instruction was not a critical component of the fractions intervention, at least not in the strict sense, as defined by a teacher providing one method for solving a problem with students prompted to apply the same steps. Instead, the intervention was unprescribed (Munter et al., 2014), in that interventionists were allowed flexibility in their responses to student answers in scaffolding the learning of the small group. The model was, thus, more “student-centric” than “teacher-centric” (Woodward, 2016, p. 681).
The use of small groups allowed for the provision of targeted, Tier II interventions to as many students as possible without compromising the quality of instruction (Ochsendorf, 2016) while encouraging collaborative learning through peer-to-peer communication of mathematical thinking. By holding students accountable to each other, the small-group structure provided a context for addressing three of the top 10 mathematics difficulties researchers identified and teachers of students with LD confirmed (Bryant, Bryant, & Hammill, 2000): difficulties with the language of mathematics, sticking with the first answer and not verifying its accuracy, and reaching “unreasonable” answers.
Nonetheless, in designing this intervention emphasizing socially mediated, small-group instruction, it remained vital to embed validated design principles specifically for students with LD (Doabler et al., 2015). Therefore, early in the fractions intervention design process, the development team drew on decades of research in the field of special education providing empirical evidence for what works when teaching students with LD (Archer & Hughes, 2011). In mathematics, providing students with instructional examples, use of visual representations, and encouraging students to verbalize the mathematical strategies they use to solve problems have all resulted in positive effect sizes for students with LD (Gersten et al., 2009). Thus, by incorporating evidence-based elements from the field of special education and mathematics education into the fractions intervention, the team created a supportive, yet challenging learning environment, recognizing the capacity of all children to outperform adult expectations (Ginsburg & Pappas, 2007; Papert, 1980).
Instructional Protocol
The third core component of the intervention was an instructional protocol that contained a series of steps for teachers to follow, including embedded opportunities for students to engage frequently with the content and with each other. Students were prompted to make their thought processes public, allowing them opportunities to differ in the way they made sense of the mathematics content being taught. Designed in this way, the protocol also allowed for teacher scaffolding of student understanding. Flexibility within each of four content levels included in the intervention allowed interventionists to “adjust tasks based on their pedagogical content knowledge and close observations of student performance” (Woodward, 2016, p. 681). Movement upward through content levels, however, was more formulaic, with the use of formative assessment tasks (i.e., “check-out” problems), that ensured students’ displayed mastery of each problem type before moving forward. This combination of teacher decision making based on peer interactions (within levels), and adherence to an instructional protocol (across levels), was intended to provide a balance between access to higher order thinking opportunities and reliable implementation of proven instructional strategies.
As alluded to previously, instructional delivery models, such as explicit instruction or socially mediated learning, are rooted in theoretical frameworks; therefore, the components of the protocol were influenced by the theoretical frames of reference held by its developers. Seven different researchers composed the development team, and each member valued the incorporation of diverse features into the protocol. For example, the methodologist was concerned with reliability and consistency of delivery, while the special education researchers were focused on teacher behaviors known to facilitate learning of students with LD. The mathematics educator, however, was concerned with flexibility of the delivery model to allow students the “space” needed to construct and build upon their “funds of knowledge” (Moll & Greenberg, 1990), which can be interpreted loosely as “prior knowledge” in the field of special education. Finally, a flowchart guided teacher decision making within and across content levels (see Figure 3).
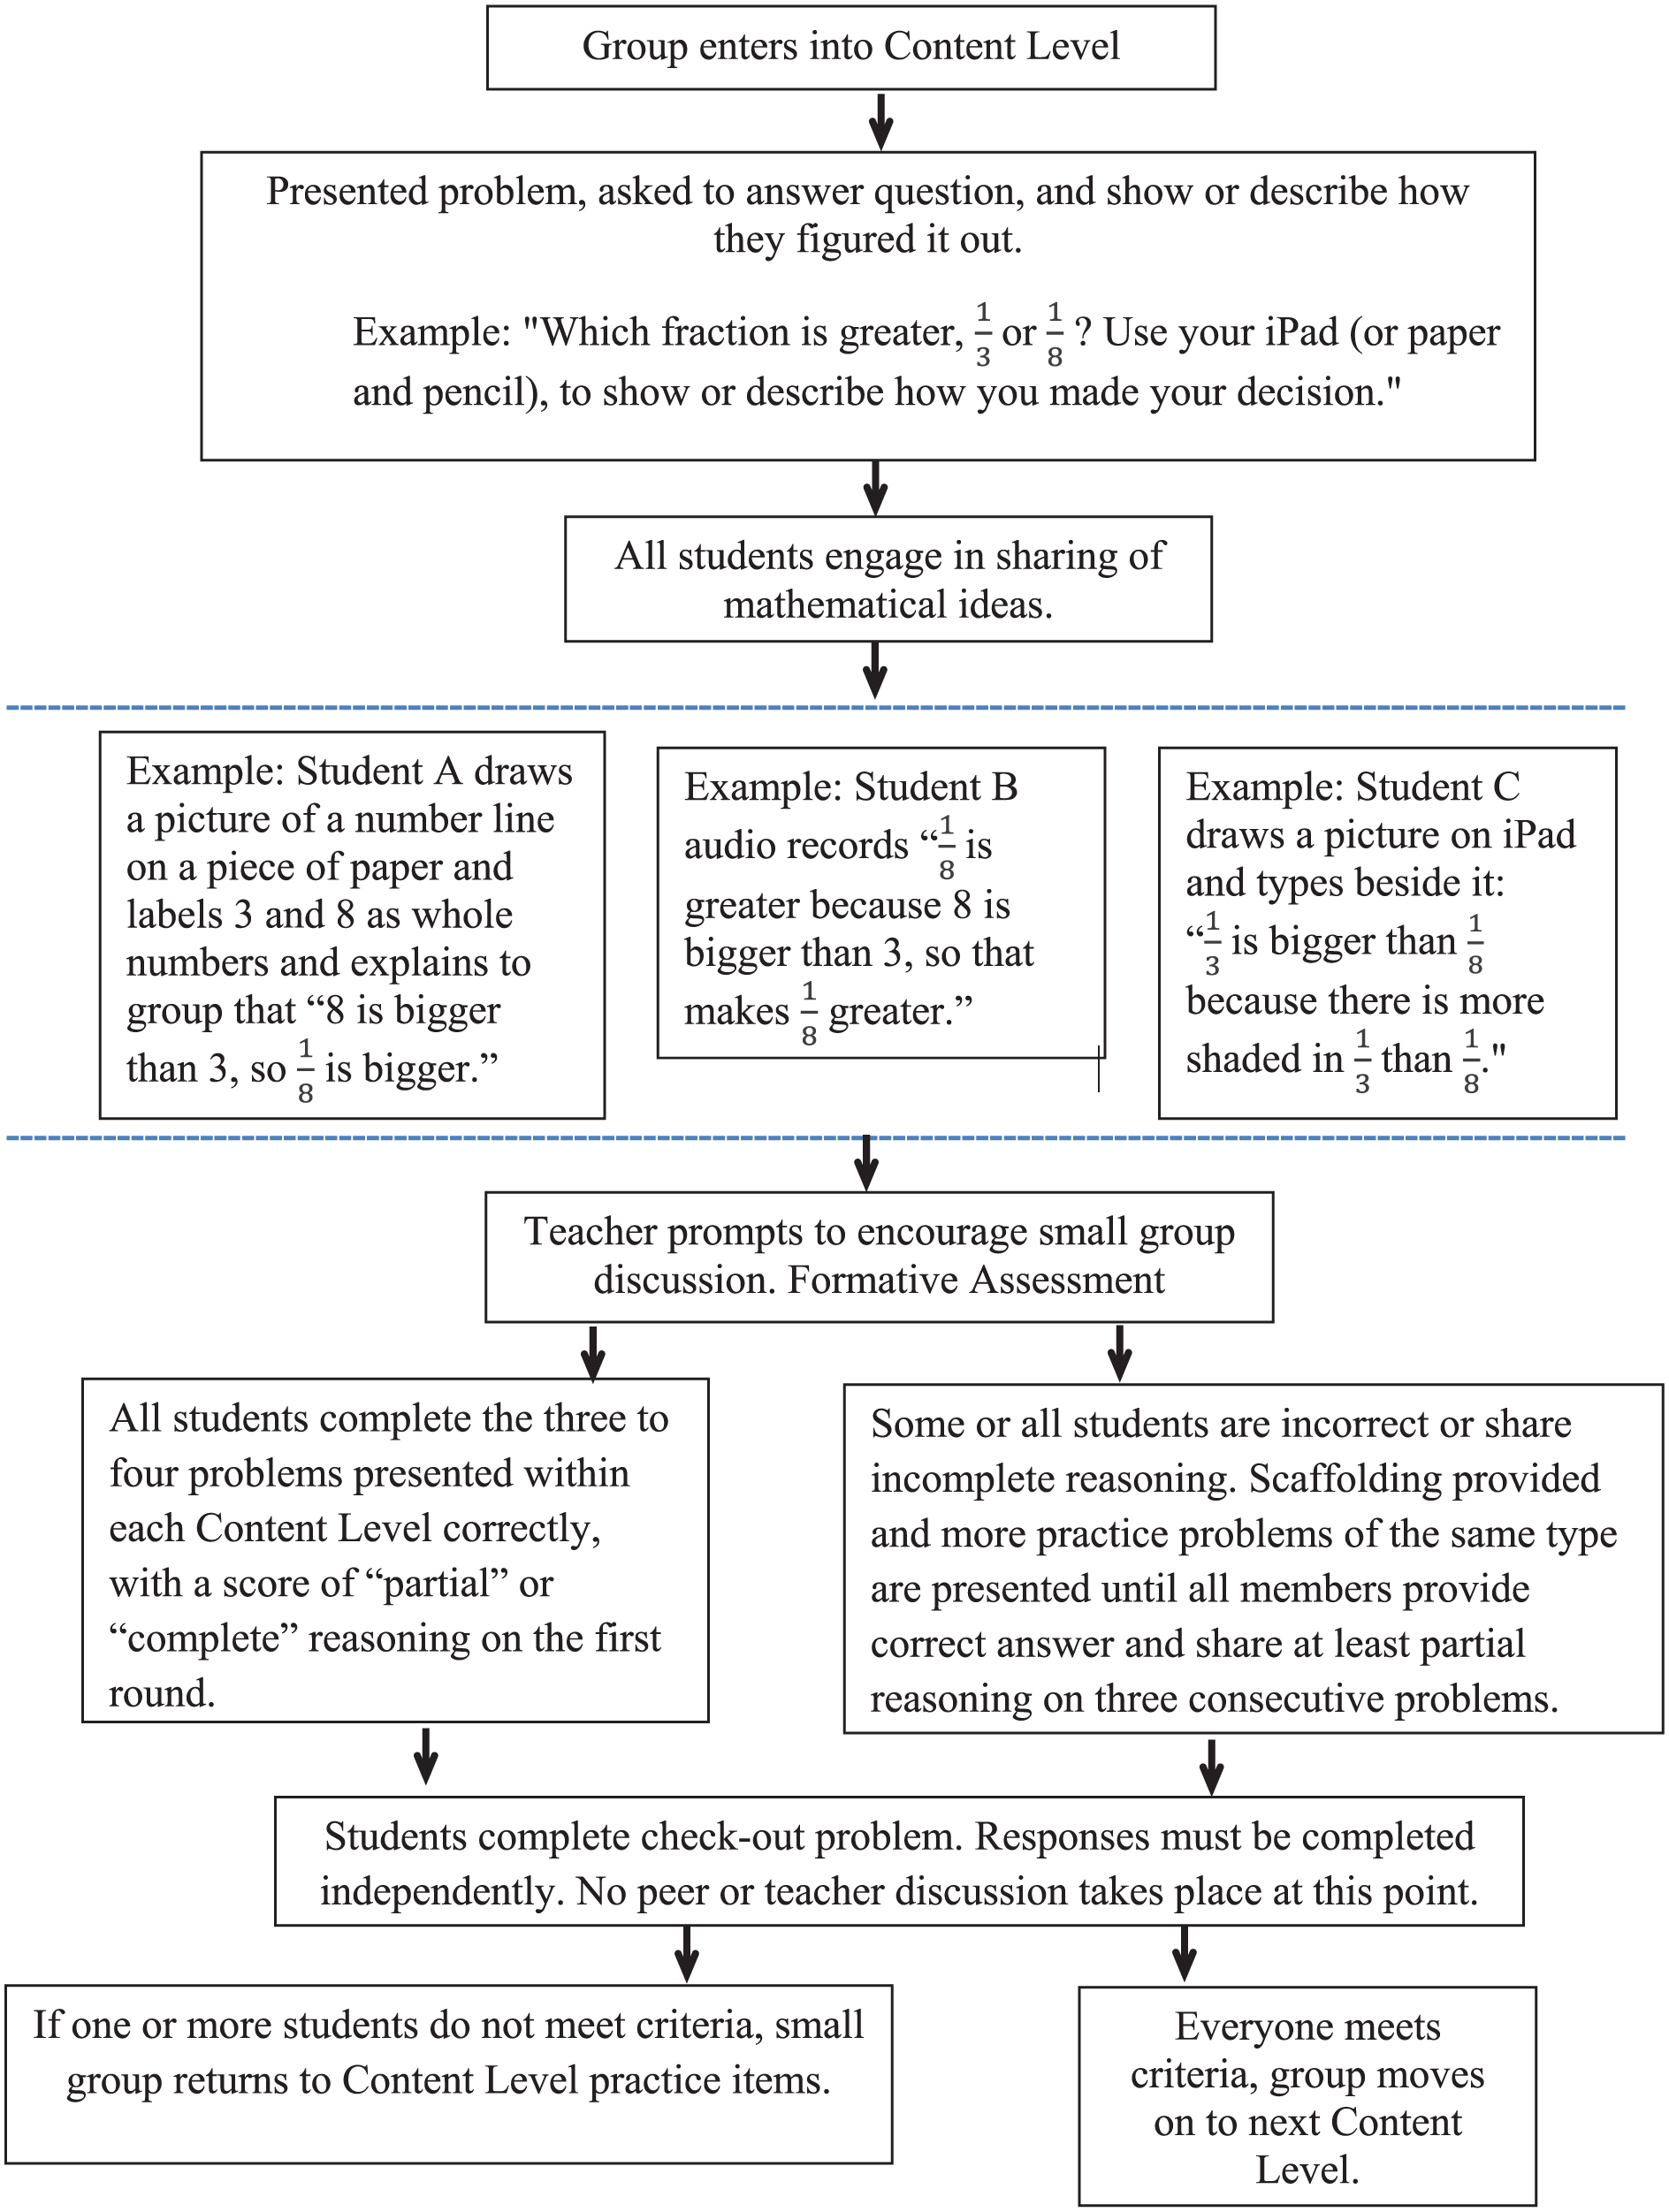
Instructional flowchart for fractions intervention.
Technology
Stakeholders’ (represented as teachers and students in this study) engagement level with an intervention contributes to its fidelity of implementation (Fixsen et al., 2005). Technology, as a means for promoting engagement, as well as supporting full and equitable access to challenging mathematical content, was identified as the fourth component in the fractions intervention. Specifically, the treatment group used iPads in this study. The use of iPads provided interventionists the flexibility to move from school to school, create additional practice opportunities for students as needed, and download student work to a university server at the end of each day. Two iPad applications were selected purposefully to assist with both the teaching and learning of fraction magnitudes. First, Flashcards++® is an iPad application that allows teachers to create electronic flashcards containing original content (e.g., a set of three different fractions). Second, Notability® is designed to support student learning through the integration of handwriting, typing, drawing, and audio recording.
One prominent example of how the field of special education is attempting to ensure access through technology, during initial design and development work, is the use of universal design for learning (UDL; Meyer, Rose, & Gordon, 2014). UDL acknowledges and accommodates individual differences during the design of instruction, increasing access to higher order thinking opportunities for all learners. Technology is an often-cited tool in UDL and has the potential to improve academic outcomes for students with LD or difficulties (Kiru, Doabler, Sorrells, & Cooc, 2017). At the foundation of UDL is the incorporation of three principles of teaching and learning: (a) engagement, (b) representation, and (c) action and expression (CAST, 2019). The treatment group’s use of an iPad application was hypothesized to promote student engagement (Principle 1) and expression (Principle 3). Specifically, features included in the Notability application allowed students an opportunity to record a verbal explanation of their understanding of fraction size, use a drawing tool to represent different fraction magnitudes, and word-process or write their answers directly on the iPad. Students then shared their understanding with the small group by showing and explaining their drawings to their peers, reading their word-processed or handwritten explanations, and/or playing back the audio of their explanations. These features prompted students to reflect on the answers they provided.
On a larger scale, technology has become a regular aspect of daily instructional practices and offers potential benefits to educational settings, including the personalization of student learning (U.S. Department of Education, Office of Educational Technology, 2017) and the leveling of the playing field, particularly across racial, gender, and geographic divides (Noeth & Volkov, 2004). Use of technology also has the potential to promote critical, analytic, and higher order thinking skills and engage students in real-world problem solving (Nat, Walker, Bacon, Dastbaz, & Flynn, 2011). The design of technology-based educational tools or programs, coupled with the principles of UDL, have made content more accessible for students with disabilities (Meyer et al., 2014) and has provided them opportunities to more easily demonstrate their knowledge and skills (Meyen, Poggio, Seok, & Smith, 2006). The development team, therefore, incorporated use of an iPad application in the intervention, hypothesizing that the application’s supports would result in better student outcomes (as measured by improved conceptual understanding of fractions as numbers).
Step 3: Collection of Initial Reliability Data Related to Implementation Fidelity
Step 3 consisted of a series of activities undertaken to inform protocol development and develop training regimens to improve fidelity of implementation. These activities are labeled as a “field study” to differentiate them from the pilot study undertaken in Step 4.
Refining the Instructional Protocol
Once the draft protocol for the intervention was developed, a field study was conducted with sixth-grade students with identified LD (N = 10). The intervention was delivered to students in groups of three or four by one interventionist (i.e., someone from the development team), with the remaining members of the team observing the session (either live or via video-recording). Multiple groups allowed researchers to take turns delivering the intervention to informally evaluate its clarity and ease of use and for each team member to engage in observation of the intervention being implemented. Both activities, using a protocol and observing its use, provide information on its usability (Doabler et al., 2015).
Each session of the 3-day field test was video-recorded, and anecdotal observations were documented by team members. At the conclusion of each day, all members of the development team debriefed to discuss the intervention’s usability. When it was possible to make small changes before the next day of field testing, they were made; when it was not, they were noted for later. Too lengthy to describe here, several amendments were made to the protocol related to the consistency of its language and the clarity of its decision-making flowchart.
Materials and Measures to Support Implementation Fidelity
Materials
At the conclusion of the field testing, a comprehensive training manual was created. The manual consisted of eight sections (training agenda, pilot study details, information on the research sites, the pilot study schedule, Notability training, Flashcards++ training, the instructional protocol, and a Fidelity Checklist). The manual was developed for use with a new, core group of interventionists for the purpose of establishing adequate fidelity regimens. This was extremely important for the fractions intervention given the somewhat complex decision-making process used to move students through each content level of the intervention, and the evaluation of student work at critical junctures across content levels.
Implementation fidelity checklist
The implementation Fidelity Checklist was written based on the work of Dane and Schneider (1998). A total of 12 items formed three separate implementation fidelity domains: (a) four items on fluency with technology components of the intervention, (b) five items on adherence to the steps of the instructional protocol, and (c) three items on quality of instructional delivery. Two separate checklists were created, one for the technology-based group and one for the pencil–paper group due to slight variations across the first five items related to tool use. (See the Appendix for the Checklist used with the iPad group.)
Reliability measure
Items required students to identify the greater of two fractions or order three fractions from least to greatest, followed by an explanation of the reasoning behind their response (see Crawford, Quebec Fuentes, Huscroft-D’Angelo, & Higgins, 2018, for a more thorough discussion of student responses). A rubric was developed to ensure interventionists’ consistency of decision making related to the correctness of student response (correct, conceptually correct, or incorrect) and the completeness of reasoning shared (no reasoning, guess attempt, incomplete, partial, or complete) to fraction problems either within content levels (practice items) or across content levels (CO items).
Interventionist Training
Four interventionists, who would deliver the intervention to both the experimental (iPad) and the control group (paper and pencil), participated in training sessions for 3 hr each day over the course of 2 weeks. On the first day, interventionists became familiar with the purpose of the study, the target student population, the logic model, and the content levels. On Days 2 and 3, interventionists received training on the two iPad applications.
Over the next 5 days, each content level was introduced, discussed, and role-played. First, the lead trainer introduced the problems presented at each content level as well as provided examples through videos collected during the field testing. Second, videos were revisited and used to highlight teacher decision making related to different types of student responses. Third, interventionists practiced using the protocol through role-plays. They taught the content within each level to other interventionists as their “students,” who responded by using scripts of possible answers. These role-plays were video-recorded. Fourth and finally, interventionists independently practiced evaluating responses to decide whether or not to move a small group forward to the next problem or continue instruction with the problem at hand. Each person then described and defended their scoring decisions.
The final 2 days of training were used to evaluate fidelity of implementation. First, each interventionist delivered the intervention to a peer, while the other interventionists served as evaluators. Interrater reliability among the four interventionists was calculated using kappa as a measure of agreement on categorical data (Landis & Koch, 1977) and ranged from κ = .54 to κ = .94 (see Table 1). These can be interpreted as moderate to very good (Landis & Koch). Second, each interventionist was observed once by the two lead researchers using the Fidelity Checklist. All interventionists were required to score a minimum of 90% on each of the three domains and the checklist as a whole, and this requirement was met. Third, interventionists were evaluated on their decisions to move their small group upward through content levels. At this stage, actual responses from the field study conducted with sixth-grade students were placed into 17 groups of three responses each (representing small groups of students). Interventionists applied the rubric described previously to decide whether or not each of the 17 groups should remain in that content level and be provided with additional opportunities to practice problems of a similar nature or be moved up to the next, more challenging, content level. Overall agreement across the four interventionists was 88% for correctness of response and 84% for completeness of student reasoning. Agreement on the decisions made by interventionists was also 84%.
Interrater Agreement Among Interventionists During Training (N = 4).
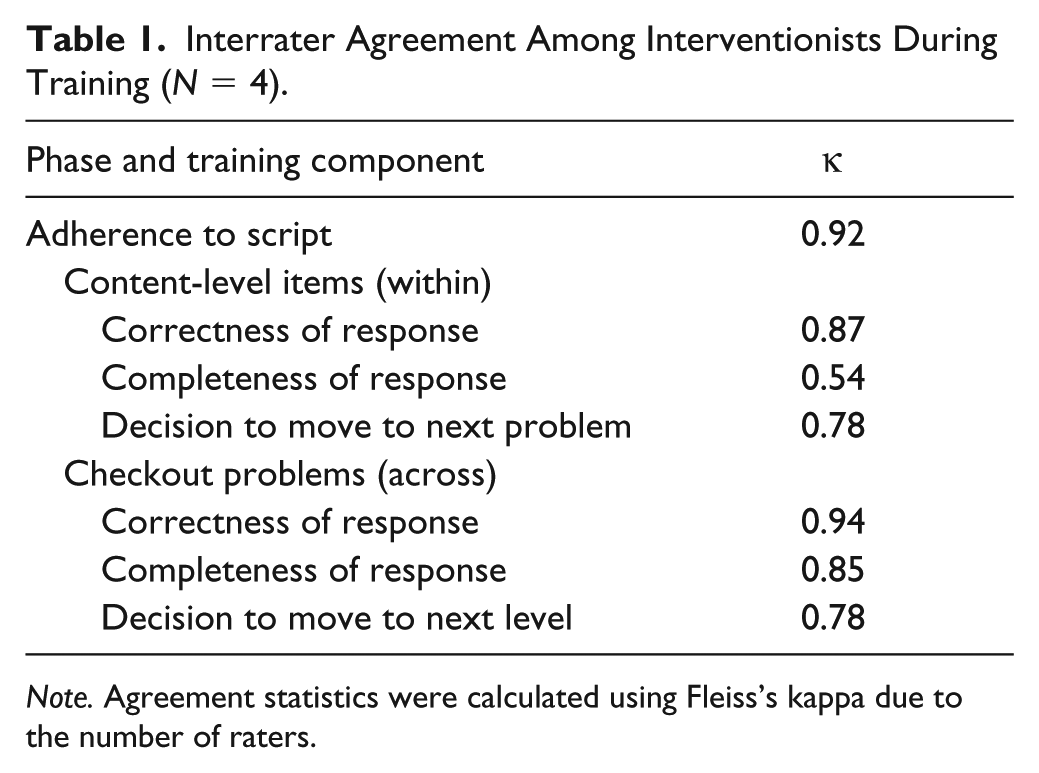
Note. Agreement statistics were calculated using Fleiss’s kappa due to the number of raters.
Step 4: Pilot Study
Pilot studies contribute data related to the analysis of an intervention’s implementation fidelity, its overall effects, and the validation of its core components.
Research Design
The research question for the pilot study was as follows: Does the use of an iPad application, with embedded writing, typing, drawing, and audio-recording tools, improve students’ conceptual understanding of fractions as numbers and the communication of this understanding? The pilot study for the fractions intervention employed a quasi-experimental research design consisting of a treatment group (i.e., students who were provided use of the iPad Notability application) and a control group (i.e., students who employed only paper and pencil tools). Students were matched on various target skills (see below) and then randomly assigned to condition. All students received the fractions intervention during the regular school day. It consisted of small-group instruction delivered in 30-min sessions, 4 days a week for 5 weeks in a setting outside of the general education classroom, such as a library.
Participants and Setting
Two criteria were established for study participation: (a) students had to be previously identified as requiring Tier II mathematics intervention in response to low performance and poor progress on grade-level curriculum, and (b) identified students needed to score below the 35th percentile on the Math Computation subtest of the Wide Range Achievement Test–IV (α = .87–.96; Wilkinson & Robertson, 2006). Using these two criteria, 30 fifth- and sixth-grade students, drawn from public (n = 19) and private schools (n = 11) in Texas, qualified for the pilot study. Although having an identified LD was not a prerequisite for study participation, eight students had a documented LD. The 20 males and 10 females ranged from 10.0 to 12.0 years old at the beginning of the school year, and all spoke English as their first language.
Measures
Students completed several pretests. First, they completed a technology questionnaire, containing items from three subscales previously validated as part of a larger questionnaire on the use of tablets in education (Moran, Hawkes, & Gayar, 2010). The internal consistency of each subscale was reported as “Attitude Toward Using Technology” (α = .89), “Effort Expectancy” (α = .89), and “Anxiety” (α = .84; Moran et al.). Second, students completed a researcher-constructed, 2-min timed assessment of basic fractions knowledge. The measure included an item related to basic understanding of a fraction’s parts (identify the numerator and denominator), fraction equivalence (identify pairs of fractions that are equal), and knowledge of fraction magnitude (order three fractions by size). Third, students completed six whole number and four fraction items on the Math Reasoning Inventory (MRI; Burns, 2012). The reliability for the individual questions selected from the Whole Numbers test and the Fraction test have reported Point-Biserial correlation coefficients ranging from .38 to .61 (Bernbaum-Wilmot, 2012). Scores from these measures were used to match students by content knowledge and comfort with technology before random assignment into condition.
Fidelity of Implementation
Interventionists changed groups weekly in an attempt to mitigate teacher differences on student outcomes. Also, to maintain consistency, any CO problems that had been completed at the end of each week were rescored by the new interventionist, and when differences existed, a joint decision was made as to the “readiness” of the group to move to the next content level.
The two lead researchers conducted four random fidelity checks on each interventionist (two for each condition) and measured their integrity to the intervention through use of the Fidelity Checklist (see the Appendix). Interrater agreement between the two lead researchers was considered very good (κ = .90). As noted earlier, 12 items formed three separate implementation fidelity domains: (a) fluency, (b) adherence, and (c) quality. Average interventionist integrity scores across these domains never fell below 94.5% for the control group and 100% for the treatment group. The lowest within-domain percentage was recorded at 83.5%, indicating acceptable levels of implementation fidelity.
Student Outcomes and Measurement of the Technology Component
Use of generalized linear modeling (GLM) to measure the between-group difference in performance across the seven CO problems indicated no significant difference on correctness or completeness of reasoning. This somewhat similar pattern of performance for the treatment and control group is illustrated in Figure 4. Finding no significant differences between groups, data were analyzed for the whole group. Specifically, the main effect for the within-subjects variable, correctness of responses, was significant for both conditions, F(1, 6) = 4.76, p = .038, as was the main effect for completeness of reasoning, F(1, 6) = 4.90, p = .035, as can be seen in the upward trend achieved by both groups in Figure 4. Effect sizes were not calculated due to transformation of the data into small group averages at seven different time periods.
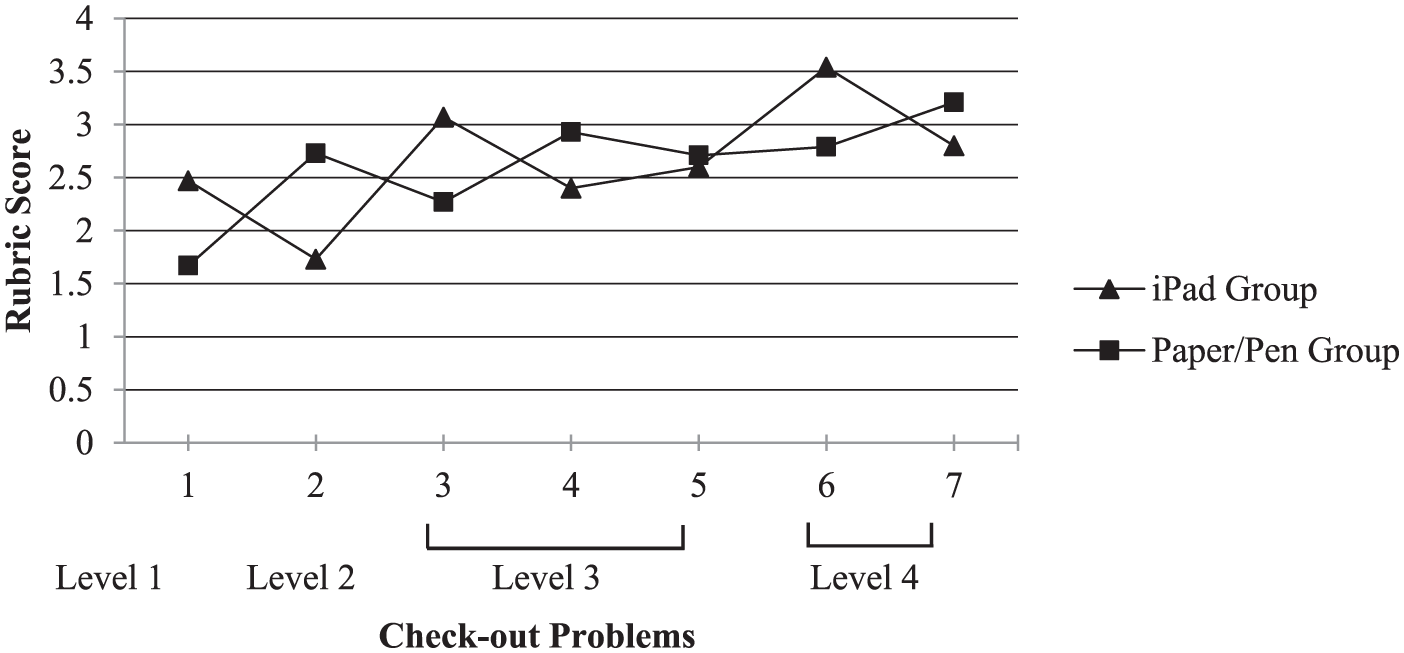
Students’ mean completeness of reasoning on seven checkout problems.
Discussion
The intervention was designed to promote students’ fraction-sense through socially mediated, small-group instruction while isolating the effects of technology tools on student learning. Yet, as stated in the Introduction to this special series, Not every feature of an intervention is likely to produce the intended effect. Determining which of the components have the greatest impact, or which features represent core components, can be challenging, but the development stage often offers an ideal opportunity to investigate. (Smolkowski & Crawford, current issue, p. xxx)
This observation rang true in the results of the pilot test for the fractions intervention. What was initially believed to be one core component—the use of technology—did not make a difference in student outcomes. In other words, the traditional mode of using paper and pencil to compare and order fractions resulted in gains similar to those posted by students who used audio, text, and drawing features as provided through an iPad application. Carr (2012) reported a similar finding on the lack of an effect for use of iPads in fifth-grade mathematics.
Limitations Related to Intervention Design and Pilot Study
In development of the fractions intervention, the team addressed the construct of implementation fidelity through a number of different steps, including, but not limited to, the consideration of theory and values in the articulation of a logic model, definition of specific components, creation of a comprehensive training manual and Fidelity Checklist, use of an instructional protocol, and the analyses of both reliability and student outcome data. Yet, these steps also posed some limitations. Two of the most significant limitations to this study included use of a convenience sample (although students were matched by academic and affective variables and then randomly assigned to treatment) and the use of researcher-developed assessment items when measuring student outcomes. These limitations reduced the internal validity of the study’s findings. Other limitations included no formal measurement of distal outcomes, complicated training regimens, and a detailed instructional protocol. The complexity of training and the lengthy protocol, as attempts at increasing implementation fidelity, may decrease the intervention’s usability in classrooms. It is common, however, for new interventions to undergo numerous iterations as protocols are refined and improved (Doabler et al., 2015).
Implications for Practice
In this article, the design and development of the fractions intervention was shared to illustrate the initial steps taken by researchers concerned with both access to, and implementation fidelity of, instructional interventions designed for students with LD or difficulties. The intervention discussed in this article is still in the development stage; thus, the implications for teachers of students with LD are limited. Perhaps the main implication of this work is to illustrate how decisions made during the initial design and development of an instructional intervention are, at least partially, influenced by the theory and values embraced by its developers. As previously discussed, by making the theories and values associated with intervention development transparent, researchers provide stakeholders with information about its core intent. When implementing interventions defined as unprescribed (Munter et al., 2014), this transparency should result in improved fidelity of implementation in applied settings. A delineation of fidelity to process as separate from fidelity to structure provides one way for considering implementation fidelity of unprescribed interventions (Mowbray, Holter, Teague, & Bybee, 2003). If core tenets are understood by stakeholders, fidelity to process can be observed through teaching behaviors that support the model as well as teaching behaviors that contradict the model’s core intent (Munter et al., 2014).
A clear understanding of an intervention’s core intent, along with the developers’ theoretical frame of reference, may also assist stakeholders in making decisions about the types of interventions they adopt and how well they align with the philosophies held by teachers, schools, or districts. The alignment of teacher beliefs with new instructional innovations (along with deep knowledge of the curriculum and reflective practice) has been identified as a critical factor in both the adoption of, and necessary modifications to, instructional innovations (Brownell, Adams, Sindelar, Waldron, & Vanhover, 2006).
Implications for Research
The intervention’s worth may reside in the what and how of the teaching and learning, not in the platform used (iPad or paper and pencil), for instruction. However, until the components of this instructional format are isolated (particularly, the component of socially mediated, small-group instruction and the use of an iPad application to facilitate student learning) and studied through use of an experimental design, statements about its efficacy cannot be made. Future studies should compare the outcomes of students with LD who learn through use of the fractions intervention to the outcomes of a similar group of students who are provided the same content using a previously validated model of instruction, such as direct instruction. Future research also needs to isolate and study the impact of the other three components hypothesized as being essential to the intervention, as a means for establishing program differentiation (a critical step in establishing implementation fidelity). One possible design for a future study is a 2 × 2 design including technology (iPad or paper and pencil) and small-group instruction (socially mediated or teacher-directed instruction).
Conclusion
In the five decades since the passage of the Individuals with Disabilities Education Act, the field of special education has made much progress. Research syntheses and meta-analyses particular to mathematics instruction for students with LD are a testament to this progress (Gersten et al., 2009; Swanson & Jerman, 2006). Juxtaposed to this progress, however, are longitudinal data that show an ever-present achievement gap between students labeled as having LD and their peers (Judge & Watson, 2011).
The fractions intervention was developed in response to the mathematics underachievement of students with LD or difficulties. Poor mathematics outcomes for students with LD continue to inspire researchers to study processes that may result in equitable outcomes, realizing that equal access does not automatically result in equitable outcomes, as has been found with the use of technology in this and other studies. Reviews of the literature on the use of technology to improve the mathematics performance of students with LD have been mixed, with some reporting improved outcomes (Kiru et al., 2017) and others reporting mixed (Stultz, 2017), or negligible (Kroesbergen & VanLuit, 2003), outcomes. Yet, we maintain that a focus on incorporation of features hypothesized to support equitable opportunities, and a commitment to collecting and analyzing fidelity data related to these opportunities, represents another step toward closing the achievement gap for students with LD.
Educational researchers embrace different theories based on different values that, in turn, generate different lines of research. These different lines of research result in different kinds of innovations. This point cannot be overlooked and must be considered in the context of efforts made to close the achievement gap. One perspective on special education research is that it is scientifically based and uses empirical methods to answer applied questions about instruction for students with LD or difficulties. This focus on student outcomes through empirical research is necessary and important. In contrast, mathematics educators speak often of values in their discussions of mathematical equity and opportunity (NCTM, 2000)—values that cannot get lost in our continuing quest for scientifically based programs—but that arguably lack the support of large-scale, empirical studies. Initial design and development work that supports fidelity of implementation requires both—an articulation of values and engagement in empirical research. We maintain that those values held by both special educators and mathematics educators should contribute to the development of interventions that are scientifically based as well as innovative.
Footnotes
Appendix
Date:__________ Interventionist:___________________ Observer:_______________ Content Level:_____________________
Declaration of Conflicting Interests
The author(s) declared no potential conflicts of interest with respect to the research, authorship, and/or publication of this article.
Funding
The author(s) disclosed receipt of the following financial support for the research, authorship, and/or publication of this article: The research conducted for this manuscript was funded through the Mathematics eText Research Center at the University of Oregon.