
Abstract
Accurately measuring high-leverage practices (e.g., HLP 16: explicit instruction) within multitiered system of support (MTSS) instruction is imperative for assessing the efficacy of teacher efforts designed to improve it, yet intricacies associated with assessing such instruction make it difficult. In response to the need for assessments for this purpose, we modified a researcher-developed observation protocol to measure general and special educators’ implementation of HLPs in tiered instruction and explored how teachers implement HLPs across Tiers 1, 2, and 3 using generalizability theory and multifaceted Rasch model analyses. Our results indicate that there was some variability in teaching quality between teachers across tier settings. These findings illustrate how the observation tool and procedures can inform future professional development (PD) research by identifying (a) which HLPs require greater emphasis in PD sessions and (b) how the observation protocol can be improved to better achieve its intended purpose.
Keywords
Introduction
To improve teaching for students with specific learning disabilities (SWSLDs) and other learners in a multitiered system of support (MTSS) instruction, researchers need to identify effective professional development (PD) interventions for improving teachers’ instructional practices. Central to this aim is the ability to create measures that can assess changes that teachers make in instructional practices, targeted by specific PD interventions, at each tier. Furthermore, to refine PD interventions, researchers need to identify those instructional practices that require the most support to change. Finally, to compare among PD interventions and identify those that are most effective, researchers need a common metric of instruction. Common measures allow them to comparatively evaluate the effectiveness of PD interventions focused on MTSS instruction in different content areas and at different grade levels (Jones, 2023). Also, common metrics of instruction are necessary tools for developing a science of teacher learning (Brownell et al., 2020).
Assessing Tiered Instruction: The Challenges
Developing observation protocols to assess tiered instruction involves common and unique measurement challenges. Evaluation of teachers’ instruction requires researchers to develop observation protocols that capture teaching practices that are common across lessons. In addition, if the instrument is to be used widely for PD studies, researchers must be able to capture behaviors that can be observed across content areas, such as reading and mathematics, and types of students being taught. Prior literature also examines how differences in lessons, students, content, and raters influence teachers’ scores on observation protocols. For example, teachers tended to receive lower ratings on teaching quality when they taught students with disabilities or low-performing students (Campbell & Ronfeldt, 2018; Cohen & Goldhaber, 2016), or when they were evaluated by severe raters (Johnson et al., 2020; Styck et al., 2021). Thus, any common metric of instruction must be able to distinguish teacher performance after accounting for these sources of variability (Hill et al., 2012; Liu et al., 2019).
The development of observation protocols for tiered instruction, however, is further complicated by the fact that an instructional tier may introduce an additional source of variance. Teachers may choose different evidence-based practices (EBPs) at each tier, and the timing and methods of teaching those EBPs may vary depending on the specific student needs being addressed. Tier 1 teachers (i.e., general education teachers, sometimes with the support of co-teachers or paraprofessionals) often provide the full complement of content area instruction, whereas teachers in Tiers 2 and 3 have limited time and are likely to focus on targeted areas. For example, in reading, Tier 1 teachers often address multiple reading skills (e.g., comprehension, decoding, phonological awareness, spelling, fluency, and vocabulary) depending on the grade level taught. Teachers providing Tiers 2 and 3 instruction, however, might target only one or two skills (e.g., multisyllabic decoding and fluency). In addition, teachers might provide instruction in EBPs that complement each other rather than teaching the same EBP. To illustrate, a Tier 3 teacher might provide explicit instruction in basic decoding patterns, whereas the Tier 1 teacher might explicitly teach a multisyllabic word-solving strategy. Finally, teachers provide more intensive instruction (e.g., more modeling, practice opportunities, and feedback) to small groups of students in Tiers 2 and 3. Teachers in Tier 1, however, often provide large-group instruction (Carlisle et al., 2013) to students with a wider range of abilities; thus, teacher–student interactions may be different for Tiers 2 and 3 than they are in Tier 1.
Our Study
In this study, we collected data on teachers’ tiered instruction using an observation protocol originally designed by Pua and colleagues (2021), adapted for our PD Development and Innovation study (Benedict et al., 2025) funded by the Institute for Education Sciences (IES). We wanted to determine whether data collected using the adapted protocol could be used to (a) distinguish teachers’ instruction at each tier and (b) improve our instrument and observation training procedures before using the protocol in our PD intervention pilot study. To address challenges associated with measuring tiered instruction, we focused on instructional practices common to the effective implementation of EBPs. We examined specific HLPs that have been associated with student achievement (Nelson et al., 2022). These high-leverage practices (HLPs) define a broad set of practices that are foundational to the implementation of effective instruction for students with disabilities and to the practice of special education (Aceves & Kennedy, 2024). In this study, we focused on those HLPs that are essential to the effective implementation of EBPs, including explicit instruction, effective classroom management strategies, and responsiveness to students—the latter defined by specific feedback to students, monitoring student learning, and scaffolding or support for student learning (Nelson et al., 2022). These behaviors were found to distinguish the performance of special education teacher candidates providing small-group reading intervention instruction to first-grade students with reading difficulties (Pua et al., 2021).
Previous Attempts to Measure Tiered Instruction
Prior observation studies of tiered and intervention instruction focused primarily on assessing teachers’ performance at one or two instructional tiers (Brownell et al., 2017; Ciullo et al., 2019; Doabler et al., 2021), whereas only four studies examined instruction across two tiers (Al Otaiba et al., 2025; Carlisle et al., 2013; Kent et al., 2017; Solis & McKenna, 2025). Studies of tiered instruction assessed the use of content-specific practices employed mostly in Tier 1 reading instruction and the use of HLPs provided in Tiers 1, 2, or 3 instruction.
Content-Specific Measures
Multiple studies assessed Tier 1 reading instruction using interval recording methods. In one set of studies, researchers used the individualizing student instruction (ISI) classroom observation system to assess teachers’ use of instructional practices in code-focused (i.e., decoding, phonological awareness), fluency, vocabulary, and comprehension content, and the degree to which Tier 1 teachers used teacher-directed or student-managed instruction in each of these areas (Al Otaiba et al., 2016; Connor et al., 2009, 2011, 2014). These researchers showed moderate to high inter-rater reliability across multiple samples (Cohen’s κ = .80; Intraclass Correlation Coefficent [ICC] range: .61–.81). In addition, they found that providing teacher-directed instruction in code-focused, vocabulary, and comprehension instruction predicted the reading achievement in decoding and comprehension of lower-achieving students compared with higher-achieving students. They did not, however, provide information about the degree to which teachers’ ratings were stable across lessons taught and raters.
Other researchers used a similar observation protocol—the Instructional Content Emphasis–Revised (ICE-R; Edmonds & Briggs, 2003)—to examine instruction at different tiers. Teachers are scored, using interval recording methods, on time spent: (a) on specific content (e.g., decoding, fluency, vocabulary) and (b) in instructional groupings used to teach content (e.g., whole class, small group). Likert scales have also been employed to score the overall level of student engagement and teaching quality. We were able to identify only three studies that compared instruction across multiple tiers (Al Otaiba et al., 2025; Kent et al., 2017; Solis & McKenna, 2025). For these studies, inter-rater agreement was established before conducting and scoring observations; additional training or reliability checks were provided in two studies to avoid rater drift (Al Otaiba et al., 2025; Kent et al., 2017). Only Solis and McKenna provided inter-rater agreement for scores based on observation field notes compared with scores for live observations during the course of the study. None of the researchers assessed the variability in teachers’ scores attributed to lesson, tier, or rater, although two of the studies’ results suggested that tier may contribute variance to teachers’ scores. In the Solis and McKenna study, teachers provided somewhat different proportions of content instruction in literacy according to tier (e.g., Tier 1 teachers spent more time on writing than Tiers 2 and 3 combined). Furthermore, Al Otaiba and colleagues found that teachers provided more code-focused than meaning-focused instruction in Tier 3 compared with Tier 1, and this difference was more pronounced for first-grade teachers than third-grade teachers. These findings suggest observation protocols focused on content-specific strategies may have limitations when used in PD studies where researchers compare treatment teachers providing multiple tiers of instruction to what teachers provide to those in control groups (Sohn, 2023; Charalambous & Kyriakides, 2017).
High-Leverage Practice Measures
Researchers have also examined general and special educators’ use of HLPs in tiered instruction or special education instruction using a combination of frequency, interval, and Likert rating scales. HLPs are strategies essential to the implementation of effective instruction for students with disabilities or the implementation of the Individuals with Disabilities Education Improvement Act (IDEA, 2004); they represent foundational teaching practices that can be explicitly taught in classroom settings across four key domains (i.e., collaboration, data-driven planning, instruction, and intensive intervention; Aceves & Kennedy, 2024; Nelson et al., 2022).
General Education
Doabler and colleagues (2019, 2021) created instrumentation (i.e., the Classroom Observations of Student-Teacher Interactions–Mathematics [COSTI-M]) to observe how frequently teachers used components of what they described as explicit instruction, such as modeling, practice opportunities, and academic feedback (HLP 16: explicit instruction, HLP 18: promote student engagement, and HLP 22: provide academic feedback), when implementing an evidence-based mathematics curriculum in Tier 1 or 2 instruction. They reported moderate to high levels of inter-rater reliability across domains, with ICCs ranging from .61 to .99. Findings showed that teachers who demonstrated more frequent use of explicit instruction practices achieved higher student outcomes in mathematics in either Tier 1 (Doabler et al., 2019) or Tier 2 (Doabler et al., 2021) settings, suggesting that explicit instruction can distinguish teaching quality in mathematics. The researchers, however, did not assess instruction across tiers, so they could not determine the variance attributed to tier, lesson, or rater to teachers’ scores.
Doabler and colleagues (2021) also employed a Likert rating measure to assess the quality of explicit instruction in Tier 2 instruction. Explicit instruction was defined as encompassing HLPs identified by Aceves and Kennedy (2024) (e.g., HLP 16: teacher modeling embedded in explicit instruction, HLP 18: promote student engagement, HLP 22: academic feedback, HLP 15: instructional scaffolding). They found weak-to-moderate relationships between quantity and quality indicators of explicit instruction (range: r = .06–.33), suggesting quantity of instruction does not represent quality. They also showed that frequent use of explicit instruction behaviors was negatively correlated with some student outcomes, whereas instructional quality consistently predicted positive gains across all student outcome measures. These authors demonstrated that quality ratings of explicit instruction might be more robust predictors of student achievement; however, they only assessed instruction at Tier 2.
Carlisle and colleagues examined general education teachers’ use of explicit instruction and found that use was affected by content area and instructional group. Kelcey and Carlisle (2013) found that general education teachers used explicit instruction less in fluency compared with comprehension instruction in Tier 1 instruction. Teachers used explicit instruction (i.e., explanation and modeling) 44% and 38% of the time in fluency, compared to 67% and 82% in comprehension. Furthermore, Carlisle and colleagues (2013) showed that teachers who taught reading lessons in small groups (similar to Tier 2 instruction) implemented explanation and modeling for 52.1% of their time compared to 45.2% in Tier 1 instruction.
Tier 3 or Special Education
Other researchers have shown that observation protocols assessing HLP implementation in Tier 3 or special education instruction (which in many states is Tier 3 instruction) are useful tools for differentiating teacher quality (Johnson et al., 2021; Pua et al., 2021). Johnson and colleagues developed an observation protocol to capture special education teachers’ implementation of explicit, systematic instruction on a 3-point Likert scale. Explicit, systematic instruction was broadly defined and included behaviors identified in the work by Aceves and Kennedy’s (2024) consensus document on HLPs (e.g., HLPs 12 and 13: identifying and communicating lesson goals, HLP 15: systematically faded support, HLP 16: modeling embedded in explicit instruction, HLP 22: constructive feedback, HLP 7: responsive learning environment, HLP 18: promoting student engagement, HLP 20: intensive instruction). Using multifaceted Rasch model (MFRM) analysis, they demonstrated that teachers’ ability to implement explicit, systematic instruction can be distinguished on a common metric across different content areas (i.e., reading, mathematics), and that certain aspects of explicit instruction were more difficult for teachers to implement than others. In their generalizability study (G-study) based on reading and mathematics lessons, the proportion of variation accounted for was as follows: 7.5% by teachers, 12.3% by items, 4.5% by raters, and 3.3% by the interaction between lessons and teachers (Johnson et al., 2020). They did find that explicit instruction partially predicted student growth if specific elements of this instruction (e.g., reviewing prior knowledge, modeling, and providing specific feedback) were well-implemented.
Pua and colleagues (2021) developed the Preservice Observation Instrument for Special Education (POISE) to assess the quality of special education preservice teachers’ Tier 3 reading instruction in a structured curriculum for first-grade students. Although the researchers studied teachers providing reading instruction, they designed POISE with the intention of using it across content areas and grade levels. Preservice Observation Instrument for Special Education consists of 12 items, rated on a 5-point Likert scale, that represent different HLPs and align with three instructional domains: (a) classroom management (CM; HLP 7: responsive learning environment, HLP 8: constructive behavioral feedback, HLP 18: promote student engagement); (b) explicit and systematic instruction (ESI; HLPs 12 and 13: identifying and communicating lesson goals, HLP 15: systematically faded support, HLP 16: explicit instruction); and (c) responsiveness to individual student learning (RISL; HLP 20: intensive instruction and HLP 22: constructive academic feedback). To provide evidence of content validity for these instructional domains, they reviewed the literature, interviewed scholars with expertise in effective special education instruction, and conducted a Q-sort with special education practitioners that involved sorting items into the three identified instructional domains. Finally, they conducted a G-study analysis to determine whether scores on POISE could distinguish the behaviors of teachers. They found that POISE had promising psychometric properties, such as moderate to high reliability coefficients (Weighted κ = .28–.53; α = .87–.93) and moderate-to-large variance (21%–38%) attributable to the teacher facet from a G-study. Raters only accounted for 6% of the variance, and lessons accounted for 5%. These findings indicated that POISE could successfully differentiate among levels of teacher proficiency after controlling for multiple sources of variance (e.g., rater, lesson).
Summary
Findings from these studies suggest that scores on measures of content-specific practices and HLPs can differentiate effective teaching in different content areas and at different grade levels. It should be noted that researchers’ definitions of explicit instruction and other HLPs varied across studies, and their approach to measurement (e.g., Likert vs. interval) varied, making it difficult to compare findings across studies. Researchers also do not know if the different approaches to assessing HLPs yield data that are comparable across tiers. In fact, findings from Al Otaiba and colleagues (2025), Solis and McKenna (2025), and Kelcey and Carlisle’s (2013) studies suggest that interval measures of HLPs and content-specific practices do not yield comparable data. Perhaps, the nature of Likert ratings makes them less sensitive to differences in how instruction is enacted at different tiers and with different content than interval and frequency ratings, as Likert ratings assess quality of implementation, which may be less sensitive to the frequency or time teachers spend using different practices in different content or at different tiers. This needs to be assessed in future studies.
Purpose of This Study and Research Questions
We explored general and special education teachers’ use of HLPs across Tiers 1, 2, and 3 using the Tiered Instruction Rating Scale (TIERS) protocol, a modified version of the POISE. Using a 7-point Likert scale, teachers’ quality implementation of HLPs was assessed on three constructs previously mentioned that are important for effective instruction of SWSLDs: (a) CM (HLP 7: responsive learning environment, HLP 8: constructive behavioral feedback, HLP 18: promote student engagement); (b) ESI (HLPs 12 and 13: identifying and communicating lesson goals, HLP 15: systematically faded support, HLP 16: explicit instruction); and (c) RISL (HLP 20: intensive instruction and HLP 22: constructive academic feedback).
We wanted to determine if (a) TIERS could distinguish the performance of teachers providing instruction at each instructional tier, (b) raters could successfully apply scores on the Likert scale, and (c) specific items were more difficult than others for teachers. To accomplish these goals, we used G-study and MFRM analyses to answer the following research questions:
Findings from our study would show if TIERS could isolate the variance unique to teaching quality for each tier of instruction and if raters could successfully apply scoring rules, or if additional rating support was needed. These findings would allow us to determine whether TIERS could be used in our IES professional development (PD) study. In addition, findings from the MFRM analysis would help us identify instructional practices in tiered instruction that require greater teacher support in our PD intervention and in future PD studies. Previous literature has demonstrated (Johnson et al., 2020; Styck et al., 2021) that instructional practices do not present an even level of difficulty.
Method
Participants
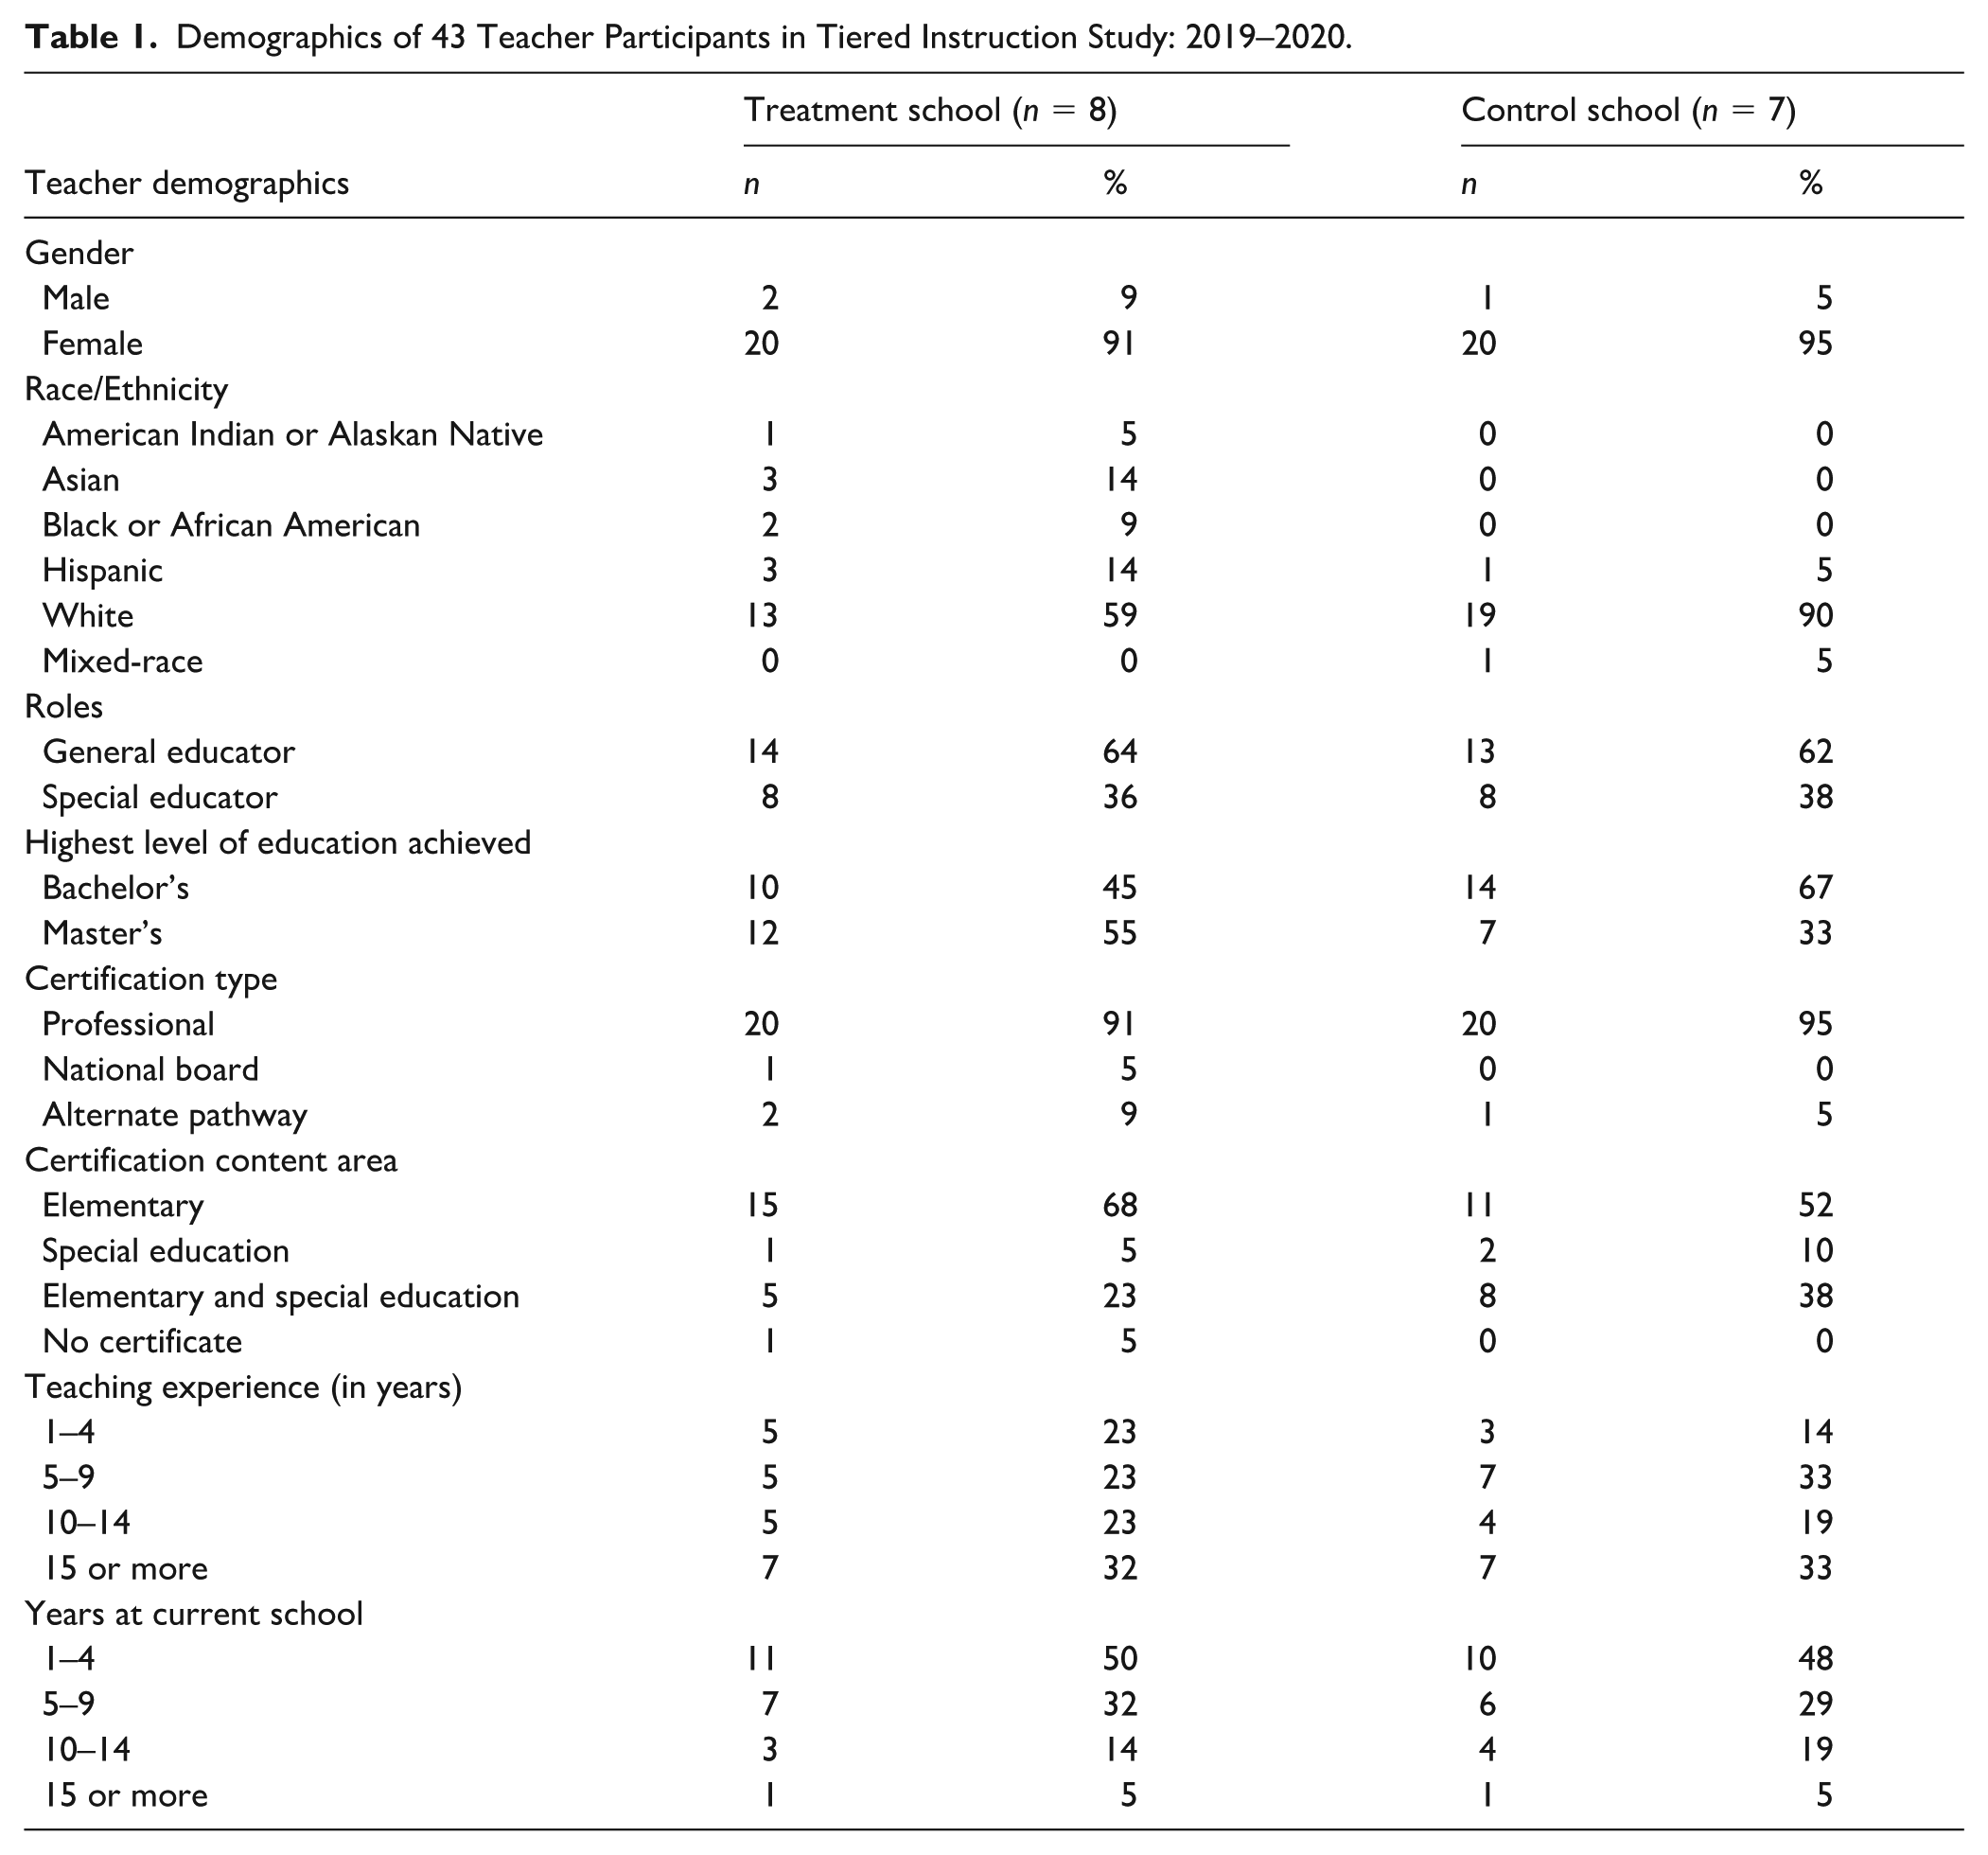
Forty-three fourth-grade general and special education teachers from 15 schools (8 treatment, 7 control) in the Southwestern United States participated in the larger PD project (Benedict et al., 2025). These teachers were included in this study (see Table 1). Teachers came from schools housed in four separate school districts; individual schools had free and reduced-price lunch rates that ranged from 10% to 98%, with an average of 56%. These schools varied considerably in terms of the ethnic and linguistic backgrounds of students; overall, approximately 55% of students were White, and 45% were non-White; the majority of the latter were Hispanic (33%). Sixty-three percent of the teachers were general education, and 37% were special education. Approximately 74% of teacher participants were White, and most non-White teachers were Hispanic (9%). Most teachers (60%) had elementary education certificates, 30% had both elementary and special education certificates, and 7% had special education certificates. The range of teaching experience varied from 1 to 15 years.
Demographics of 43 Teacher Participants in Tiered Instruction Study: 2019–2020.
Observation Protocol: TIERS
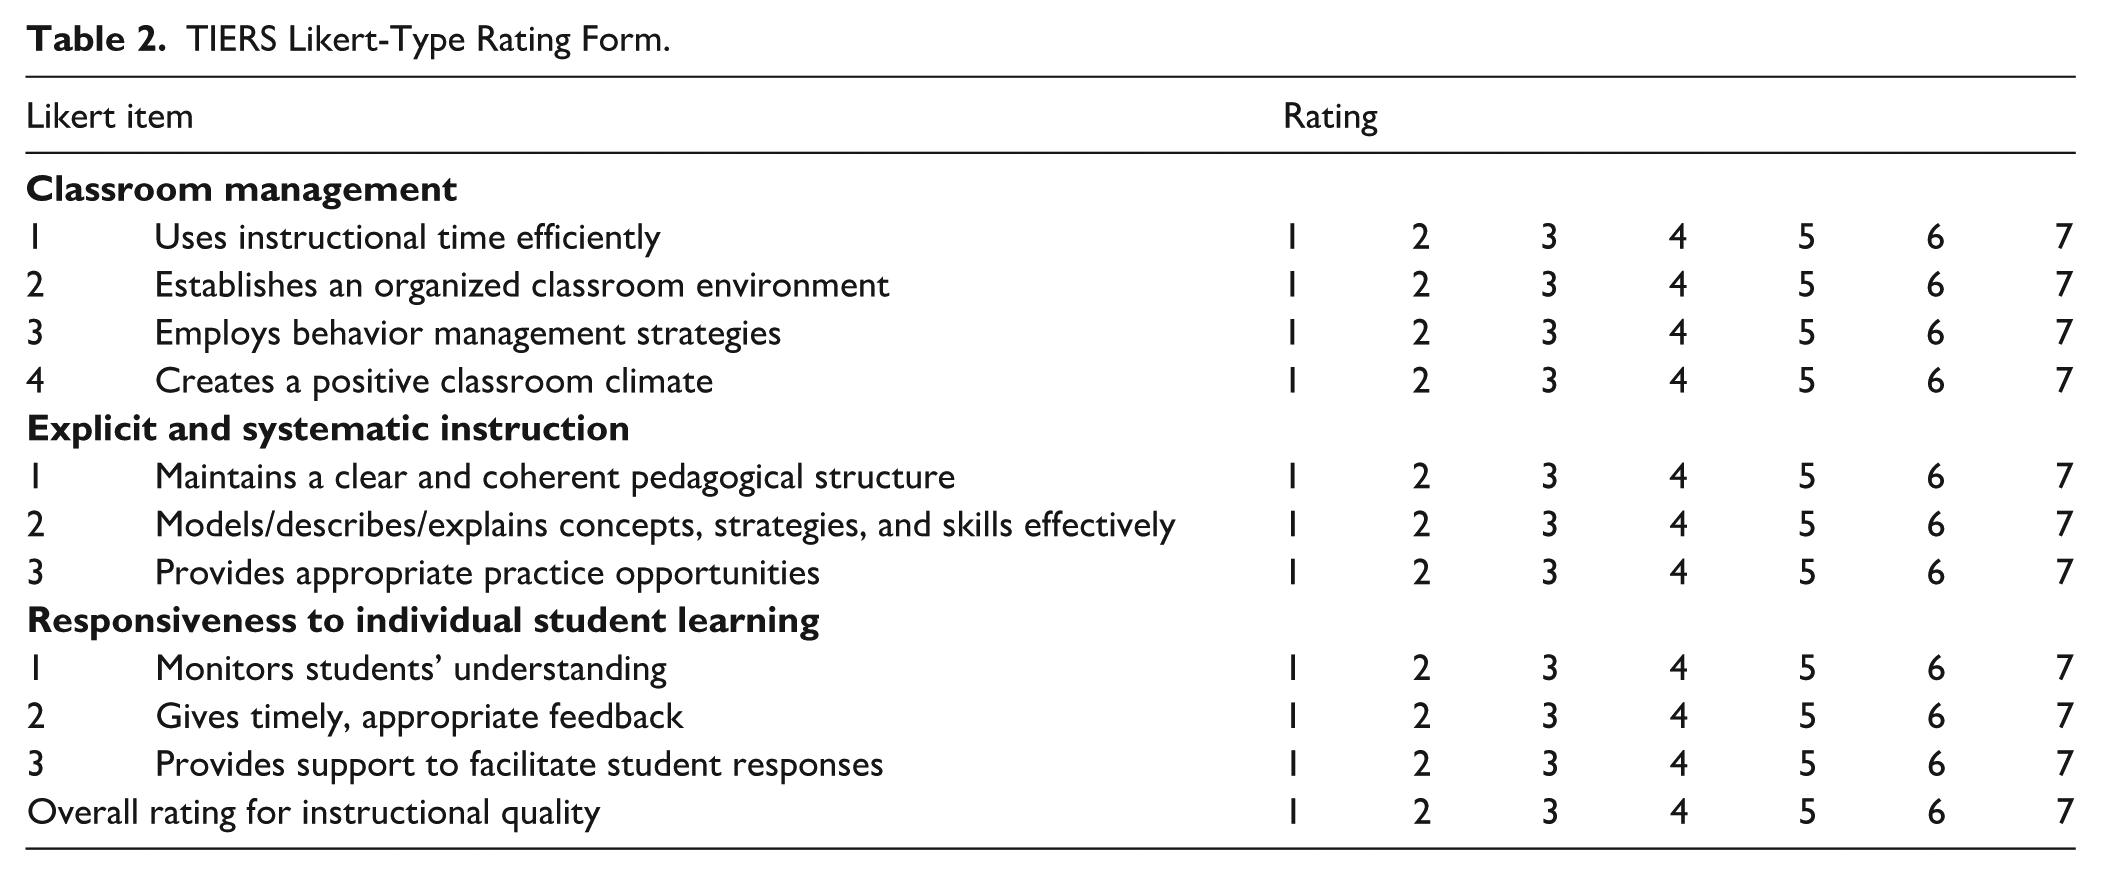
Tiered Instruction Rating Scale represents a modified version of the POISE; Pua et al., 2021) and consists of two components. First, raters use the interval component of TIERS to record the occurrence of effective core instructional behaviors (e.g., modeling, feedback) and content-specific practices (e.g., cognitive strategy for decoding words, summarization strategy) in 30-second segments. The latter were used by researchers in a larger PD study funded by the IES (Benedict et al., 2025) to determine whether teachers were using the EBPs learned. Once raters completed the first component, they used interval data and field notes recorded about implementation of the core instructional behaviors to rate the quality of teachers’ instruction, using a 7-point Likert scale, on CM, ESI, and RISL (see Table 2). TIERS’ Likert items were adapted from POISE to better address general and special education instruction in the three domains of core instruction, and to adjust for problems we experienced scoring the protocol in this study. Teachers were scored using a 7-point scale on 10 items within the three domains of instruction (i.e., CM, ESI, and RISL, see Table 2) rather than 5-point scales like POISE. The scale was expanded to allow researchers in the IES PD study to obtain more useful and discriminating information about teaching performance (Hill & Grossman, 2013).
TIERS Likert-Type Rating Form.
Our study focuses on data generated from the Part II Likert scale. We wanted to assess validity evidence for the Likert scale as it provides a common metric of instruction across tiers and content areas. If data collected in our study provided evidence that TIERS can effectively distinguish teacher performance, it could be used in the IES PD study (Benedict et al., 2025) to validly assess teachers’ tiered literacy instruction and potentially be used in other studies of tiered instruction in different subject areas, such as a study of tiered mathematics instruction.
Procedures for Collecting and Rating Observation Data
Observation data were collected and rated according to the procedures described below.
Video-Recorded Lessons
The research team for the larger study collected two to five pre-intervention lessons, with an average of four videos per teacher, in fall 2019 using a recording system called Swivl. Researchers commonly recommend using multiple observations per teacher to achieve a reliable estimate of a teacher’s instructional quality across various instructional contexts (Johnson et al., 2018; Johnson et al., 2021). We used data collected during pretest observations, since those lessons best represent teachers’ naturally occurring reading instruction. Our PD intervention may have changed the variability of teachers’ scores on the observation protocol during the implementation phase.
Each video was rated using an online rating application created for the POISE (Pua et al., 2021) and modified for our study. There were 176 pre-intervention videos rated, 30% (n = 53) of which were double-rated using TIERS. A total of 61 videos were collected from Tier 1 settings, 54 from Tier 2 settings, and 61 from Tier 3 settings (i.e., special education). Length of videos averaged 20 min, and the range was 10 to 60 min. Percentage adjacent agreement on the pre-Likert scores was 46.7%; scores within a particular category were considered adjacent (e.g., Levels 1 and 2 are adjacent within the unsatisfactory category). A quadratic weighted kappa score of 0.42 indicated a moderate level of inter-rater reliability (Cicchetti, 1994). However, prior large, widely cited studies, such as the Measures of Effective Teaching (MET) project, demonstrate that 80% benchmarks are often statistically impractical due to the inherent, irreducible volatility of instruction across different lessons (Ho & Kane, 2013; Kane & Staiger, 2012). Consequently, to move beyond simple consensus in scoring, we utilized a G-study and MFRM analysis to dissect the underlying score structures and identify detectable teacher signals (Hill et al., 2012; Johnson et al., 2020).
Rater Training
Four anchor raters provided 4 days of training for the interval (Part I) and Likert (Part II) portions of the TIERS to 19 raters who varied in educational background and teaching experience. The four anchor raters included the principal investigator (PI) and Co-PI of our larger IES PD study, who had extensive teacher-training experience, as well as two doctoral students who had 5–13 years of Grades K–12 teaching experience and had received rater training from the PI. Each training session took approximately 2 hr and included the following components to help raters standardize application of scoring rules: (a) definition of each interval and Likert item, (b) discussions of examples and non-examples for each item, and (c) example videos representing target practices. After the training sessions, raters received weekly group and/or one-on-one training until they reached a percentage agreement of 80% with anchor raters on three calibration videos (Graham et al., 2012; Pua et al., 2021). We used percentage agreement to estimate inter-rater reliability, defined as the proportion of rating decisions on which the anchor rater and an individual rater made the same decision. We selected this method because it is easy to calculate and provides an intuitive and efficient way to determine how closely individual raters matched the anchor rater. (Lombard et al., 2002). After raters were trained to 80% mastery, they received randomly assigned videos, balanced by length of recording, schools (e.g., district), content (e.g., decoding, summarization), and teacher role (i.e., general or special education teacher).
Data Analysis
To explore which facets (e.g., teacher, rater, tier) explain variability in performance scores, we conducted a G-study and Multi-faceted Rasch Model (MFRM) analysis for the Likert scale (Hill et al., 2012; Johnson et al., 2020). These analyses identify the variance different facets contribute to the observed variance in teacher performance, whereas traditional reliability statistics (e.g., percentage agreement, Cronbach’s alpha) assume that all the variance is attributed to differences among raters, ignoring other sources of variance (e.g., teacher, item, domain, tier, lesson) that contribute to the final performance scores (Hill et al., 2012).
The G-study allowed us to detect variance components attributable to multiple facets (e.g., teacher, rater, lesson, tier, domain) and interactions among facets for the TIERS Likert scores. We employed a partially nested mixed design with lessons l within teachers t within tiers i crossed with domains d and raters r. In this (l:t:i)dr design, teachers t, lessons l, and raters r are treated as random, while tiers i and domains d are treated as fixed. We selected these conditions because elements are not interchangeable with others within tiers (i.e., Tiers 1, 2, 3) and domain facets (i.e., CM, ESI, RISL). In other words, it is theoretically unreasonable to generalize beyond fixed levels of tier and domain facets in the universe, as each element represents unique constructs of teaching quality (domains d) or instructional settings (tiers i) (Shavelson & Webb, 1991). Meanwhile, we were interested in estimating random effects for other facets to determine whether the rater population can consistently apply the scoring rules to identify different levels of teacher proficiency on the TIERS Likert scale. The G-study model in this study is notated as

where X(l:t:i)dr is the observed rating for one lesson (l) nested within one teacher (t) nested within a tier (i), crossed with domains (d) and raters (r), μ is the grand mean, ν t is the teacher main effect, ν l:t is the interaction effect for the lessons nested within the teachers, ν r is the rater main effect, ν t×r is the interaction effect for the teacher by rater, ν l×r is the interaction effect for the lesson by rater, and ε (l:t:i)dr is the residual effect (Brennan, 2003; Huebner & Lucht, 2019). We used Moore’s (2022) gtheory package in R (R Core Team, 2024) to conduct the analysis.
The MFRM study allowed us to analyze TIERS Likert scores, including multiple facets (e.g., teacher, item, domain, rater, tier, lesson) and calibrate interactions among elements within each facet onto a common scale (Wolfe & Dobria, 2008). MFRM is an extended version of the family of Rasch models; it models the item-level scores and offers different psychometric information as compared to the G-study, which models test-level scores. The MFRM provides, among other things, estimates of logit-scale location (e.g., indicators of identifying severe raters), separation statistics to investigate variation between each element, and model fit statistics. Our MFRM model is defined as
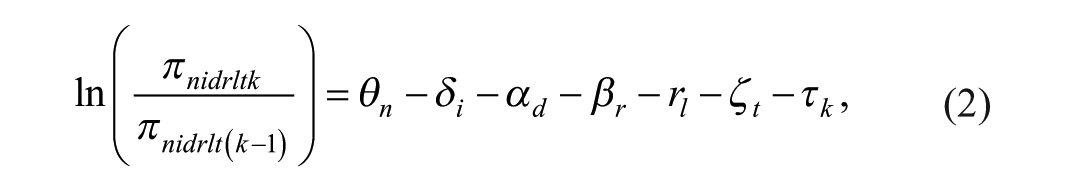
where teacher n is rated by rater r on item i within domain d within lesson l within tier t.
Results
Generalizability Study Findings
We conducted a G-study to detect the variance components attributable to multiple facets (e.g., teacher, rater, tier, domain) and interactions between each facet (e.g., teacher × rater) for TIERS Likert scores (see Table 3). Analyses of ratings by teacher role and tier, controlling for the domain effect, demonstrate that a larger proportion of the variance was attributed to special education teachers (27.3%) than general education teachers (13.7%); general educators showed similar levels of variability in the quality of instruction in Tiers 1 and 2 settings (9.3%,
Variance Decomposition in the TIERS Likert Scores.
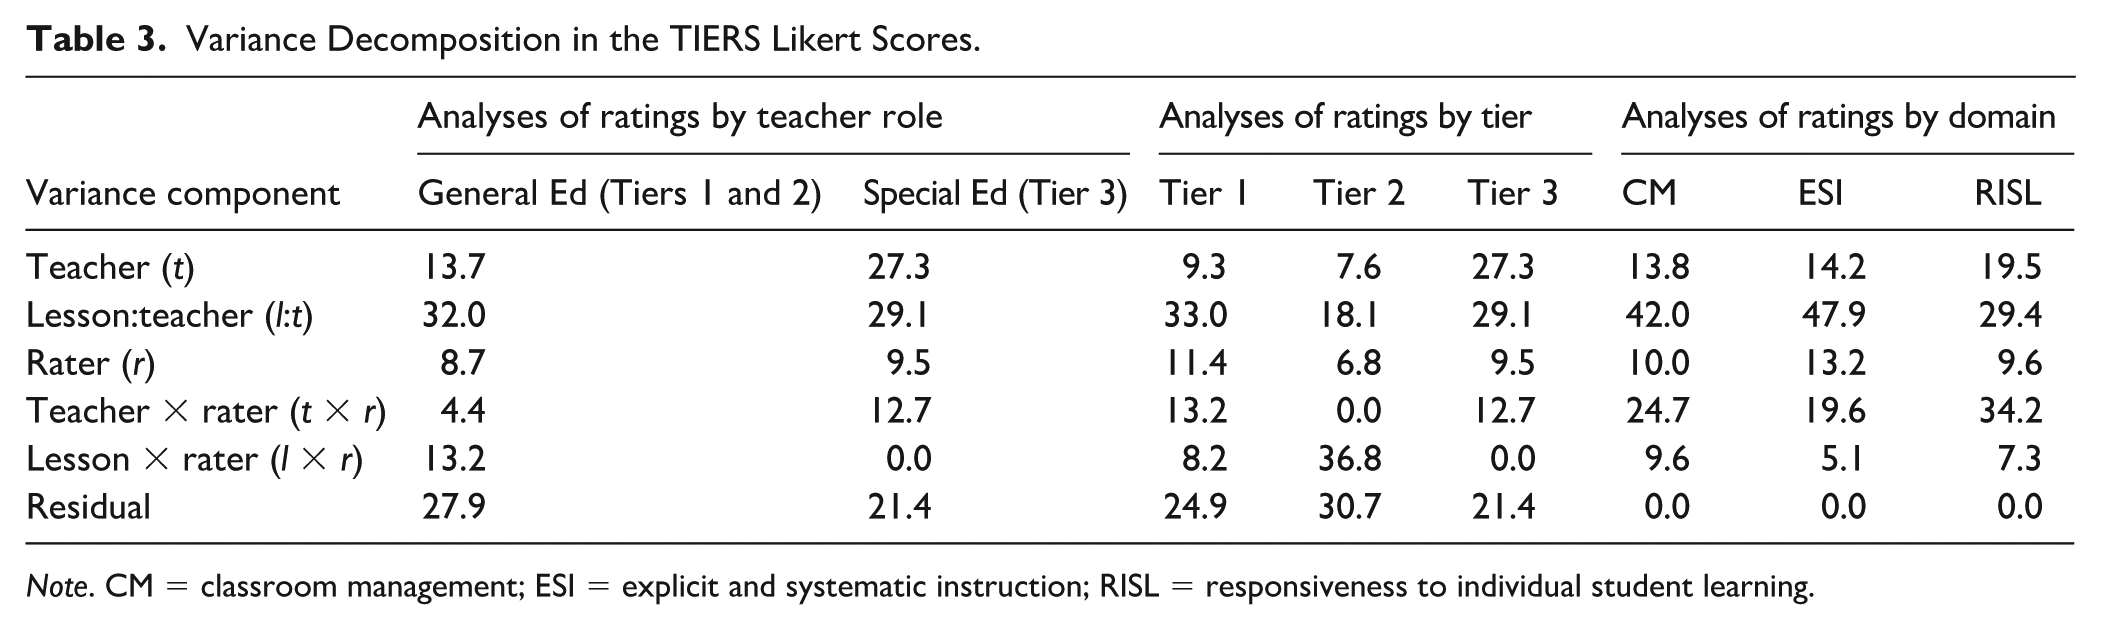
Note. CM = classroom management; ESI = explicit and systematic instruction; RISL = responsiveness to individual student learning.
Variance attributable to a teacher-by-rater interaction in Tier 2 (0.0%) was negligible, whereas in Tiers 1% and 3 (
We also controlled for the tier effect in separate analyses of ratings by domain. A considerable amount of variance associated with the teacher main effect was detected across domains (CM: 13.8%, ESI: 14.2%, RISL: 19.5%), suggesting that raters were able to differentiate between various levels of teacher proficiency within each construct. Lesson–teacher interaction accounted for the largest portion of variance in TIERS (CM: 42.0%, ESI: 47.9%, RISL: 29.4%), which means teachers demonstrate different levels of domain-related behaviors based on the lesson taught. ESI and CM were more lesson-dependent than RISL.
Multifaceted Rasch Model Study Findings
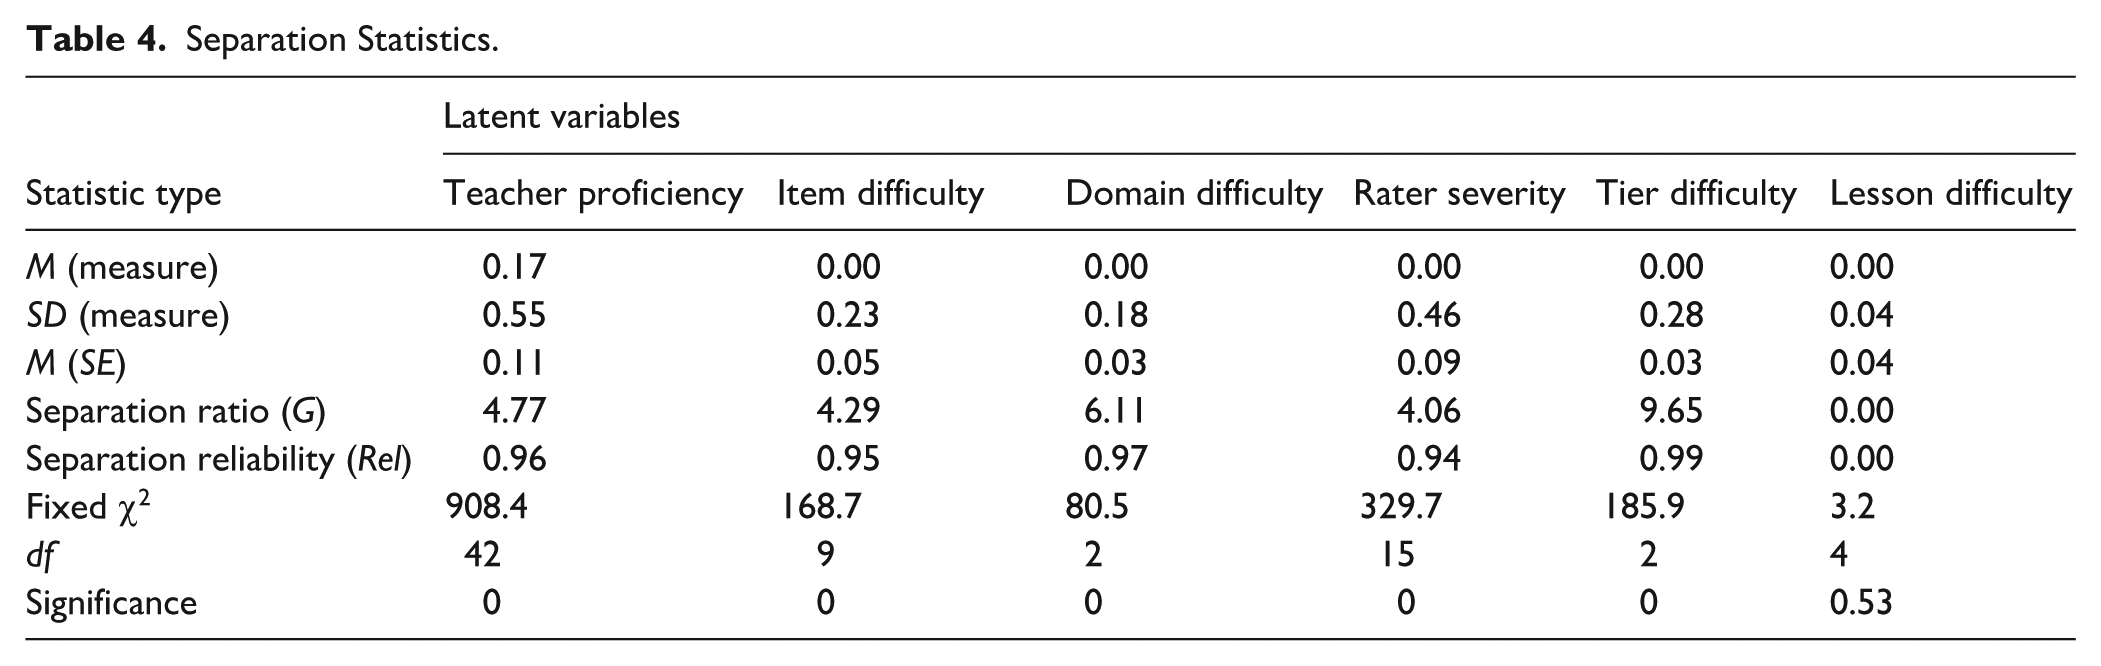
In addition to the G-study, we also conducted the MFRM analysis to obtain further information on psychometric properties of the TIERS Likert scores, such as the Wright map and logit-scale locations, separation statistics, and model fit statistics (see Table 4 and Figure 1). The Wright map in Figure 1 plots the location estimates of individual elements within five latent variables (i.e., teacher, item, domain, rater, tier, lesson). On the logit scale, more difficult elements (e.g., more proficient teachers, more severe raters, more difficult domains) are situated in higher locations.
Separation Statistics.
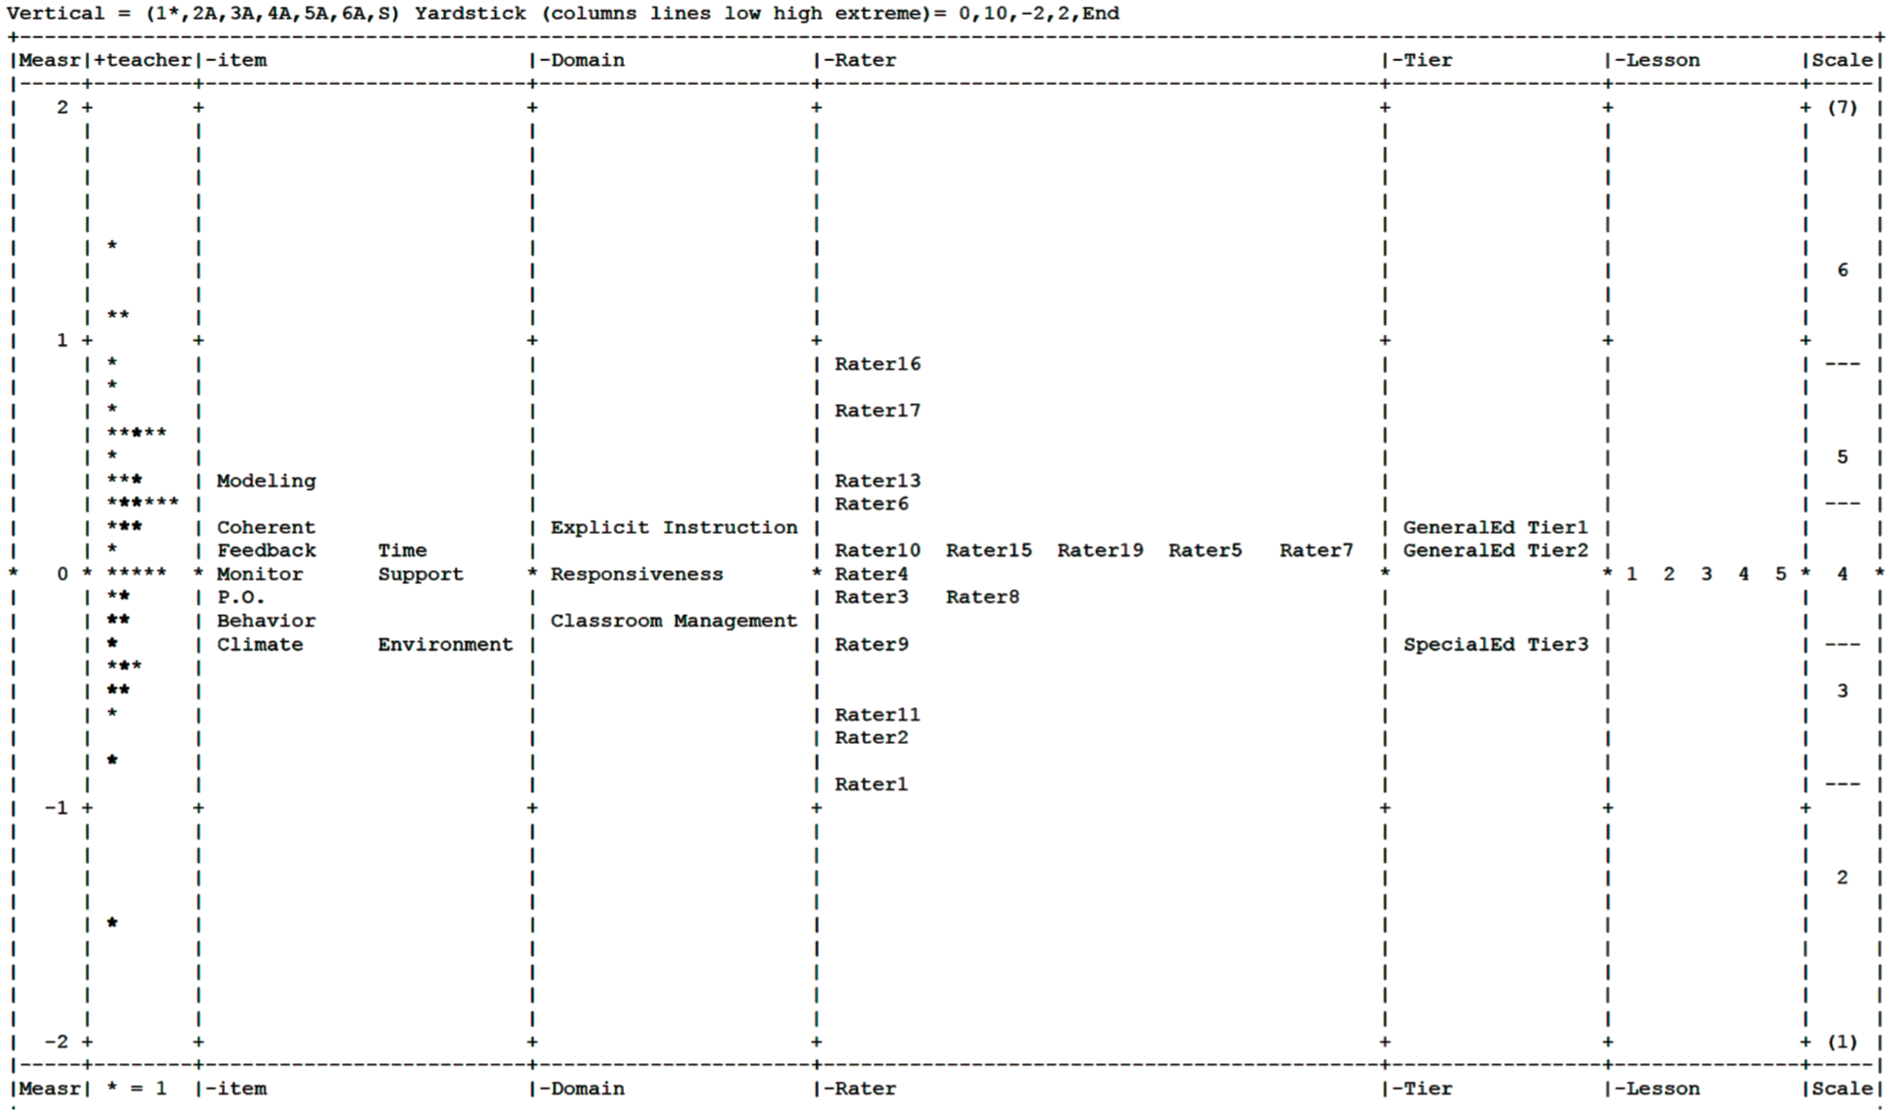
The Wright map displays the estimated locations of individual elements within each of the six latent variables.
The good fit statistics for all facets (e.g., teacher, item, domain, rater, tier, lesson) indicate that the model parameters reported below represent the patterns in the underlying data. For the teacher facet, the separation ratio was 4.77, and the Rel statistic was high and statistically significant: Rel = 0.96, fixed χ2(42) = 908.4, p < .001, indicating that the various levels of teacher proficiency were reliably distinguished. For the item facet, ESI 2 (models concepts effectively) with 0.45 logits was the most difficult item (i.e., the hardest for a teacher to receive a high rating), while CM 4 (creates positive classroom climates) with −0.32 logits was the easiest item. Separation statistics indicate that locations of items were reliably and significantly differentiated, separation ratio: 4.29, Rel = 0.95, fixed χ2(9) = 168.7, p < .001. Separation statistics for the domain facet indicate a substantial amount of difference in domain variance, as the separation ratio was 6.11, and the Rel statistic was 0.97: fixed χ2(2) = 80.5, p < .001. Explicit and systematic instruction was located at the highest logit value of 0.15, suggesting that teachers might receive lower scores in ESI than in other domains. For the rater facet, Rater 16 with 0.89 logits was the most stringent rater, whereas Rater 1 with −0.88 logits was the most lenient rater. A total of 16 raters had distinct levels of severity, separation ratio: 4.06, Rel = 0.94, fixed χ2(15) = 329.7, p < .001. The tier facet also exhibits significantly distinct levels of difficulty; the separation ratio was 9.65, and the Rel statistic was 0.99: fixed χ2(2) = 185.9, p < .001. Tier 1 had the highest logit value of 0.21, implying that teachers who taught in Tier 1 settings received higher scores than teachers who taught in Tier 2 or 3 settings. For the lesson facet, separation statistics indicate lesson elements did not show distinct levels of difficulty (separation ratio <1.00), and the different locations of lesson elements were not distinguished: Rel = 0.0, fixed χ2(4) = 3.2, p = .53; this suggests that teachers’ scores were stable across lessons when controlling for other variables (e.g., rater severity, tier difficulty).
Discussion
To improve MTSS instruction, researchers need assessments that can validly measure the effect of PD on changes in teachers’ instruction at each tier. These assessments should generate data that allow researchers to compare treatment and control groups of teachers providing instruction at different tiers. Without this capacity, researchers cannot judge the efficacy of PD efforts. We developed the TIERS protocol to assess common features of effective MTSS instruction (e.g., HLP 16: explicit instruction) regardless of content taught (e.g., word decoding strategies) across instructional tiers. Our observation study focused on evaluating the portion of TIERS that uses Likert rating scales to assess three domains of instruction: CM, ESI, and RISL. G-study and MFRM analyses generated data that showed TIERS’s Likert scales can assess teachers’ use of these HLPs at Tiers 1, 2, and 3. The information provided will allow us to improve the TIERs’ observation rating process and PD for our IES study. In addition, the information provided suggests that with further study, the TIERS observation protocol could be a viable protocol for assessing MTSS instruction in other PD studies.
Scores on TIERS, according to our results, can identify differences in teaching proficiency for general and special education teachers and thus should be able to distinguish between teachers who make changes and those who make little progress in a PD effort focused on MTSS instruction. There are, however, some complexities in our findings worth considering. G-study findings indicated TIERS scores distinguished the instructional performance of special education teachers better than general education teachers. The amount of variance attributed to special education teachers was 27.3%, which is within the range of variance captured in other studies attempting to assess the instruction of special education teachers (Semmelroth & Johnson, 2014: 14.8%–21.3%; Peyton, 2019: 13%–33%; Pua et al., 2021: 21%–35%). Meanwhile, the variance attributed to general education teachers was 13.7%, which is comparable to the lower range of score variance identified for other observation tools designed to assess general education instruction (e.g., the Classroom Assessment Scoring System [Mantzicopoulos et al., 2018: 10.9%–44.5%; Mashburn et al., 2014: 16.9%–37.4%] and the Framework For Teaching [Kane & Staiger, 2012: 15.0%–33.0%; Mantzicopoulos et al., 2018: 16.2%–36.4%]). In our study, special education teachers varied more in instructional quality than did general education teachers. The MFRM analysis showed high separation statistics for the instructional tier. Furthermore, the Wright map generated for this analysis shows that general education teachers providing instruction in Tiers 1 and 2 settings scored similarly on the TIERS Likert scale, whereas special education teachers in Tier 3 settings scored lower. The two lowest-scoring teachers in our study were special education teachers, and they were notable outliers in the distribution of scores (see Figure 1). We do not know if future studies of special and general education teachers would produce similar results.
Our findings regarding the variability associated with each facet are also complex. Findings from the G-study showed considerable variation in a lesson: teacher interaction for each instructional tier (Tier 1: 33.0%, Tier 2: 18.1%, Tier 3: 29.1%), indicating that individual teachers respond differently to each lesson. These findings align with those from previous research (Mantzicopoulos et al., 2018: 18.2%–30.2%; Semmelroth & Johnson, 2014: 9.5%–14.9%). Interestingly, however, results of the MFRM analysis show there was no variability in the lesson facet, suggesting lessons are of uniform quality after accounting for the effects of other facets (e.g., teacher, rater, domain, tier). Findings from the G-study and MFRM analyses combined suggest that teachers might perform differently across lessons depending on other confounding factors, particularly the tier of instruction.
Results of our analyses also suggest that domains of instruction assessed by TIERS are distinct. The MFRM analysis generated high separation statistics for the domain, suggesting that CM, ESI, and RISL are distinct constructs. In addition, evidence from the G-study shows that raters assign scores in ways that distinguish teachers’ performance at each domain, and that teachers perform more similarly on certain domains than others (CM: 13.8%, ESI: 14.2%, RISL: 19.5%). Furthermore, teachers demonstrated the highest scores on CM and the lowest on ESI, suggesting that teachers may need more support in PD studies for learning how to implement explicit systematic instruction effectively.
In addition, findings from the MFRM analyses provide some insight into those behaviors for which teachers may need robust PD support. Separation statistics for the item facet were high, indicating that teachers demonstrated different levels of quality for individual practices. Teachers had the highest scores on the CM items (e.g., creates positive classroom climates) but displayed the most difficulty with modeling (HLP 16: explicit instruction), followed by coherent pedagogical structure (HLPs 12 and 13: identifying and communicating lesson goals), timely appropriate feedback (HLP 22: constructive academic feedback), and other instructional practices (e.g., HLP 7: responsive learning environment and HLP 8: constructive behavioral feedback). These findings are supported by previous studies using the MFRM analyses; Johnson and colleagues (2020, 2021) found that explaining (defined partly as modeling in HLP 16) and systematically withdrawing support (HLP 15) were the most difficult indicators of explicit instruction for special education teachers to demonstrate. Similarly, general education teachers showed the lowest scores for language modeling and quality of feedback on the Classroom Assessment Scoring System (Styck et al., 2021). We intend to use these results to improve our PD. Researchers and teacher educators can also use results from our study and similarly designed studies to identify HLPs in tiered instruction that may require more time and support to develop.
Raters were also capable of applying TIERS scoring rules, although results seem more nuanced and potentially complicated by the effect of the tier. The variance attributed to the rater main effect in the G-study was within the range (general education settings: 8.7%, special education settings: 9.5%) of rater variance identified in other G-studies of observation protocols (Hill et al., 2012: 6.2%–28.6%; Jones et al., 2022: 1%–17%; Semmelroth & Johnson, 2014: 1.8%–15.9%). In contrast, findings from the MFRM analysis showed a high level of separation statistics for raters, indicating there was variability in the raters’ ability to apply TIERS scoring rules consistently. Interestingly, a modestly higher amount of variance was due to the teacher × rater (general education settings: 4.4%, special education settings: 12.7%) and lesson × rater (general education settings: 13.2%, special education settings: 0.0%) interactions. Moreover, variance attributable to a teacher-by-rater interaction in Tier 2 (0.0%) was negligible, whereas in Tiers 1 and 3 (13.5%, 12.8%) it was moderate. These findings reinforce the fact that interactions between teacher × rater and lesson × rater might be confounded by the effect of Tier, as teachers did not provide lessons at each Tier. In this study, general education teachers taught Tiers 1 and 2 lessons, but special education teachers only taught Tier 3 lessons.
Limitations
Findings from our study provide some evidence supporting the effectiveness of TIERS for assessing tiered instruction. There are, however, limitations to consider. First, our partially nested design makes it difficult to disentangle confounding interactions (e.g., lesson:teacher) or facets (e.g., tier, teacher, lesson). In this study, only 30% of lessons were double-coded. By not double-coding all lessons, we could not account for a greater portion of rater variance that may have been associated with teachers or lessons in our study (Shavelson et al., 1989). However, we should note that this percentage is high compared with that of other studies (Kane & Staiger, 2012; Kent et al., 2017). Furthermore, double-coding all videos would be challenging to implement due to the costs associated with rating videos. In addition, the tier facet is fully confounded with the teacher facet, as special education teachers taught only Tier 3 instruction. Using a fully crossed design, in which teachers provide lessons at each tier, and every rater scores every lesson, would help researchers provide a more precise analysis of variance decomposition in the TIERS scores. Such a design, however, is likely unrealistic and even impossible. Special educators nearly always provide Tier 3 instruction, and never or rarely provide Tiers 1 and 2 instruction.
Second, the data included in our study were constrained to fourth-grade teachers providing naturally occurring reading instruction. Validity evidence from our study could change if TIERS is applied to other instructional contexts, such as different subjects (e.g., mathematics, science), grade levels (e.g., secondary students), or larger populations of teachers. Future research should include a larger and more heterogeneous sample of teachers to better support the generalizability of the TIERS Likert scores and confirm whether this common measure can function as intended with teachers in a variety of instructional settings (e.g., different content areas, grade levels).
Implications for Future Research
Our study provides initial evidence that HLPs represented in TIERS can be used as a common metric of general and special education teachers’ MTSS instruction and may be used to assess the efficacy of MTSS-focused PD interventions in our IES study and those of other researchers. Furthermore, findings from our study complement and expand on those examining observation protocols that assess HLPs (e.g., HLP 7: responsive learning environment, HLP 15: systematically faded support, HLP 16: explicit instruction) for general and special education teachers (Doabler et al., 2021; Johnson et al., 2020; Pua et al., 2021). Taken together, results suggest observation protocols can be constructed to assess certain HLPs, known to be effective for teaching students with disabilities regardless of instructional tier. Moreover, findings from our G-study and MFRM analyses demonstrate that using these two approaches to analyze variance in classroom observations can help researchers identify areas of instruction that may be targeted for additional support in PD efforts and improve observation protocols, including procedures for training raters. To fully examine the potential of TIERS and similar observation protocols for use in PD, however, more research is needed.
To fully validate TIERS (and other similar instruments), future research should employ designs where every lesson is coded by at least two different raters. Doing so will allow researchers to more precisely estimate rater effects for TIERS scores. Second, researchers need to analyze the relationship between TIERS scores and student outcomes, such as engagement and academic achievement, which represent important external indicators of teaching quality. Thus, it is imperative to determine whether TIERS scores can be extrapolated to outcomes for students, particularly those served in Tiers 2 and 3, who are most vulnerable to academic failure. Finally, since the TIERS Likert scale is intended to provide a common metric of HLPs within MTSS settings, more research is needed to confirm whether this tool can be used to assess tiered instruction for teachers at different grade levels and in other content (e.g., mathematics, primary reading, writing). This research will add to researchers’ understanding of the generalizability of TIERS.
In conclusion, findings from our study provide some initial understanding about how a common metric of HLPs, like TIERS, can be developed to assess general and special education teachers’ tiered instruction. The evidence generated in this study will be used to enhance rater training for our PD study, enhance the support we provide to teachers, and assess changes in teachers’ practice as a result of our PD intervention. Moreover, other researchers could use analyses similar to those used in this study to further develop TIERS or similar instruments to assess the efficacy of MTSS-focused PD interventions. If our field wants to improve PD for MTSS instruction, researchers need valid assessments of general and special education teachers’ HLPs in tiered instruction; these measures should provide a common metric of instructional practice that can be used to compare results across PD studies. Such assessments ultimately will also be crucial for use by practitioners in schools and districts, as they need to know whether their efforts to improve MTSS instruction are effective.
Footnotes
Authors’ Note
The content and opinions expressed do not represent those of IES.
Funding
The authors disclosed receipt of the following financial support for the research, authorship, and/or publication of this article: This study was funded by the United States Department of Education, Institute for Education Sciences (IES) and National Center for Special Education Research (R324A170135).
Declaration of Conflicting Interests
The authors declared no potential conflicts of interest with respect to the research, authorship, and/or publication of this article.