
Abstract
The Centers for Medicare & Medicaid Services’ Financial Alignment Initiative conducted its demonstration across multiple states to test the impact of integrating care and financing for medical, behavioral, and long-term services and supports (LTSS) for dually eligible Medicare-Medicaid beneficiaries. We analyzed the demonstration’s impact on long-stay nursing facility (NF) use in eight states. All states implemented approaches to improve integration and reduce NF use but only five states favorably impacted long-stay NF utilization. Ohio, Washington, Texas, South Carolina, and Colorado had a 4.22, 3.50, 1.82, 1.46, and 1.30 percentage point decrease in the annual probability of long-stay NF use, respectively, relative to each state’s comparison group. Effective approaches to integration included robust connections between health care systems and LTSS providers, leveraging existing state LTSS infrastructure, and utilizing Area Agencies on Aging for care coordination. Barriers to effective integration included complex waiver programs, service carve outs, and weak collaborative relationships.
Keywords
• Shows that efforts to integrate care and financing for dually eligible Medicare-Medicaid beneficiaries can decrease long-stay nursing facility use. • Indicates these efforts may improve the alignment of long-term services and supports (LTSS) with individual preferences to stay living in the community. • Provides evidence that states’ prior experience with managed LTSS or utilizing an established LTSS provider network was a key to successful integration of LTSS with other health care services.
• Policymakers implementing or planning to implement integrated care models can learn from states that made progress toward keeping people out of nursing homes or returning nursing home residents to the community. • Interested parties should consider lessons learned, including barriers to successful LTSS integration, when working toward alignment between Medicare-Medicaid financing. • Researchers studying integrated care models for dually eligible beneficiaries should identify variation in implementation and design factors in developing their approach and to understand their quantitative findings.What this paper adds
Applications of study findings
Introduction
The delivery system for long-term services and supports (LTSS) in the United States is fragmented and unintegrated with medical care (Werner & Konetzka, 2022). This is particularly true for the approximately 12.5 million people dually eligible for Medicare and Medicaid services (Peña et al., 2023). In 2021, 52% of the dually eligible full-benefit fee-for-service population used Medicaid-provided LTSS services (MACPAC & MedPAC, 2024); 13% lived in a nursing facility (KFF, 2023). About 82% of long-stay nursing facility residents are dually eligible, in line with Medicaid’s role as the predominant payer for nursing homes (MedPAC, 2025). Enormous variation exists in the provision of LTSS, due in part to the Medicaid programs’ federated governance structure and the varying policy choices and demographics of each state (O’Malley Watts et al., 2021; Thach & Weiner, 2018). While nursing facility and home health services must be provided by state Medicaid programs, states have discretion in service delivery and in providing optional services including health homes for individuals with chronic conditions and rehabilitation needs (MACPAC, n.d). Medicare and Medicaid remain largely separate programs that do not coordinate LTSS, funding, or enrollment resulting in challenges such as cost-shifting across programs and settings, disincentivizing coordinated care within or across programs and settings, and deterring the medical system from providing interventions to reduce the risk of institutionalization (Anderson et al., 2016; Bubolz et al., 2012; Centers for Medicare & Medicaid Services, 2021; Fox & Reichard, 2013; Grabowski, 2007; Young et al., 2013). The complex system of LTSS experienced by dually eligible beneficiaries leads to poorer health outcomes including preventable hospitalizations and greater Medicare spending compared to non-dually eligible beneficiaries (Wysocki et al., 2014; Young et al., 2013). Furthermore, literature indicates dually eligible beneficiaries receive lower quality care in nursing facilities and are more likely to be admitted to low-quality facilities compared to non-dually eligible beneficiaries (Rahman et al., 2014; Sharma et al., 2020).
In 2011, the Centers for Medicare & Medicaid Services (CMS) launched the Financial Alignment Initiative (FAI) to address these disconnects and financial misalignments across the medical and LTSS systems experienced by the dually eligible population. Since then, the number of dually eligible nursing facility residents enrolled in various managed care plans, such as the FAI, continues to increase (Roberts et al., 2024). In this article, we present the FAI’s impact on long-stay nursing facility use among dually eligible beneficiaries. Based on data availability, we include results from eight participating states: Colorado, Illinois, Michigan, Ohio, Rhode Island, South Carolina, Texas, and Washington.
The Financial Alignment Initiative
The FAI demonstration corresponds with larger shifts in the U.S. policy landscape towards promoting community-based provision of LTSS outside of institutional settings, enhancing the capacity of residential settings to meet LTSS needs, and the subsequent decline in the proportion of adults aged 65 and older residing in nursing facilities (Toth et al., 2022). The goals of the FAI were to improve service utilization and quality of care outcomes, improve beneficiaries’ experience, and reduce or control costs to the Medicare and Medicaid programs. The demonstration presented an opportunity to develop person-centered care delivery models that integrate medical care, behavioral care, and LTSS for Medicare-Medicaid enrollees and then test approaches to care coordination and aligning financial incentives between the two programs. Though CMS announced the opportunity in July 2011, the start of each state’s FAI demonstration occurred sometime between 2013 and 2016 (i.e., Michigan and Washington began in 2013; Colorado, Illinois, and Ohio in 2014; South Carolina and Texas in 2015; Rhode Island in 2016). Most states employed a managed care model providing capitated rates for both Medicare and Medicaid services. Two states (Colorado and Washington) implemented managed fee-for-service (FFS) models, adding care coordination paid for by Medicaid to the existing Medicare and Medicaid FFS systems. Approximately 257,000 dually eligible beneficiaries were enrolled in an FAI demonstration across seven of the participating states in this study by 2020 (MACPAC, 2020). All demonstrations are ongoing and set to end by 2025, except for Colorado’s demonstration which ended in 2017. Colorado had enrolled 28,175 beneficiaries by December 2017 (Centers for Medicare & Medicaid Services, n.d).
The FAI supported appropriate home and community-based services and reductions in nursing facility use as part of the goal to develop a person-centered care approach and align beneficiary care plans with their preferences. To stay in the community or to return home after a nursing facility stay, individuals require a supportive environment where most of their personal care needs are adequately met. Care coordination, the primary tool used by Medicare Medicaid Plans (MMPs), can provide support, education, and training to paid and unpaid family caregivers to enable beneficiaries to stay at home longer. In the FAI, care coordination included coordinating access to appropriate services, integrating them into overall individual care plans, and supporting dually eligible beneficiaries and their caregivers via multi-disciplinary care teams. Care coordinators can also actively manage care transitions at the point of hospital or skilled nursing facility discharge making sure that beneficiaries receive adequate post-discharge support, including physical or occupational therapy, follow-up appointments, and adherence to post-discharge instructions.
MMPs had the flexibility to provide additional supportive services to community residents to attempt to delay institutionalization or to enable placement in an assisted living setting. For example, some MMPs leveraged states’ Money Follows the Person programs or implemented their own nursing home diversion efforts, thereby providing housing assistance, case management, and home and community-based services beyond the standard service plans authorized in their state. MMPs implemented programs and activities designed to prevent and reduce potentially avoidable hospitalizations, which may interrupt a common pathway to nursing home placement. Effective discharge planning after any hospitalization or post-acute care stay was also utilized by MMPs (Walsh et al., 2012). Depending on the managed care products offered by the MMPs parent companies, participating MMPs joined the FAI with various levels of LTSS knowledge and experience. For example, MMPs whose parent companies had previously been limited to Medicare Advantage products were significantly less experienced than MMPs whose parent companies had worked with Medicaid managed LTSS plans, Fully Integrated Special Needs Plans, Dual Eligible Special Needs Plans, or Institutional Special Needs Plans.
Methods
Data Sources
We used Medicare enrollment data (2013–2020) for beneficiaries’ characteristics and eligibility information, state provided finder files to identify the eligible population for the demonstration group and those enrolled in the state’s demonstration, the Minimum Data Set (MDS 3.0) to identify long-stay nursing facility use, the American Community Survey and the Area Health and Resources Files to capture area-level information, and the Medicaid enrollment and eligibility files to apply Medicaid specific exclusion criteria.
Study Population
Areas covered by the demonstration ranged from select counties to statewide coverage. Inclusion into the study population was for full-benefit Medicare-Medicaid dually eligible beneficiaries who resided in these geographic areas and met demonstration-specific eligibility criteria. Enrollment was voluntary and beneficiaries were free to enroll or disenroll monthly. We applied a common set of exclusion criteria across all states and applied the same set of demonstration eligibility criteria to identify those comparison group beneficiaries. For the Washington demonstration, cumulative estimates are for the 4th through 6th (2017–2019) demonstration years since the demonstration was extended statewide in 2017 and subsequently the comparison group methodology changed. Information is available upon request for further detail on state-specific coverage areas, eligibility criteria, and exclusion criteria or readers can review each state’s evaluation report on the CMS website: https://www.cms.gov/medicaid-chip/medicare-coordination/financial-alignment.
Sample Characteristics
As states varied in population size, eligibility criteria for Medicaid, and eligibility for the state FAI demonstrations, the demonstration groups ranged from 15,035 beneficiaries in South Carolina to 105,093 beneficiaries in Illinois as of the last demonstration year evaluated in this paper. Summary characteristics for each state’s eligible population are available upon request. While in most states, individuals under 65 years old made up a larger proportion of the three age groups (i.e., 0 to 64, 65 to 74, and 75+), the average age of FAI demonstration group beneficiaries ranged from age 61 in Colorado and Michigan to age 75 in South Carolina (and similar average ages among comparison group beneficiaries; data available upon request). The average Hierarchical Condition Category risk score was similar between the demonstration and comparison groups in each state and ranged from 1.1 in several states to 2.0 in Washington. The proportion of beneficiaries who had a disability (rather than age) as the original reason for Medicare entitlement varied considerably by state demonstration and ranged from 61.5% in Rhode Island to 15.0% in South Carolina, with each state’s comparison group closely resembling the demonstration group population (e.g., Rhode Island comparison group: 62.1%, South Carolina comparison group: 15.0%).
Comparison Group Methodology
This study used the intent-to-treat (ITT) approach that includes all Medicare-Medicaid beneficiaries eligible for the demonstration, not just those enrolled in the MMPs, and compares each state’s eligible population with a similar population that is not affected by the demonstration (i.e., a comparison group). Beneficiaries may voluntarily enroll in the FAI demonstration; therefore, selection-bias may impact our evaluation results if our analysis is based only on FAI demonstration enrollees. An ITT framework addresses this concern and improves the generalizability of the results across the demonstration eligible population by emulating the real-world implementation of the demonstration.
We identified the comparison population in two stages. First, we identified similar metropolitan statistical areas (MSA) based on baseline market and area level characteristics using a Mahalanobis distance score model. Among MSAs with similar characteristics to the demonstration MSAs, we identified all full-benefit dually eligible beneficiaries in those areas and excluded beneficiaries based on the study exclusion criteria. We then calculated a propensity score to create an inverse propensity weight based on a set of observable health, demographic, and area-level covariates, examined the distribution of propensity scores between the demonstration group and comparison group, and calculated inverse probability weights for the comparison group to help improve the comparability of characteristics between the groups (data available upon request).
Analytic Approach
This study’s use of the ITT approach mimics the real-world implementation of the demonstration and minimizes the concern of selection bias due to voluntary participation in the demonstration (Frank et al., 2022). We used a quasi-experimental difference-in-differences (DiD) regression analysis using a two-stage propensity score weighting approach that identified the comparison population specific to each state demonstration. For each state, we estimated the impact of the demonstration on the change in the probability of long-stay nursing facility use, relative to the comparison group. Additional details are available in each state-specific, publicly available report (Centers for Medicare & Medicaid Services, n.d).
Long-Stay Nursing Facility Outcome Definition
We defined long-stay nursing facility use as any nursing facility stay greater than 100 days as of the last quarter of demonstration eligibility during the year. This definition is based on Medicare policy and payment as the 100 days cut off is a formal CMS definition for long-term institutional status and is used in CMS risk adjustment and payment calculations. Medicare only covers up to 100 days of care in a skilled nursing facility. If the resident remains in the facility 101 days or longer, we considered them a long-stay resident. The outcome includes both nursing facility admissions that occur during the year and long-stay nursing facility use among beneficiaries continuing to reside in a nursing facility.
Covariates
A full list of the sample characteristics and a detailed description of each is available upon request. The characteristics include demographic information (e.g., age, sex, MSA residence, and Hierarchical Condition Category score), market characteristics (e.g., Medicare spending per dually eligible adult (age 19+)), and area-level information (e.g., percentage of the population living in married households and Pandemic Vulnerability Index) and are used as model covariates in the analyses (Marvel et al., 2020).
Statistical Analysis
The DiD regression analysis estimates the impact of the demonstration on the change in the probability of any long-stay nursing facility use for each of the eight FAI states. We ran a generalized linear model with a log-link and a binomial distribution. The model included an indicator of whether the observation was after the demonstration start, an indicator of whether the beneficiary was in the demonstration group, and an interaction term between these two indicators to measure the demonstration effect on the outcome. Demographics and market variables as described above represent beneficiary and market characteristics, respectively. We calculated and presented the marginal effect of the demonstration that estimates the change in percentage points in the probability of long-stay nursing facility use in the demonstration group relative to the comparison group. We present the cumulative impact estimates observed in each state over all the demonstration years included in this analysis. The FAI demonstration impact by year by state are available upon request.
Qualitative Context
We use state-specific qualitative data collected during the evaluation to contextualize our interpretation and discussion of the DiD results. State evaluation teams analyzed qualitative data from publicly available three-way contracts, semi-structured interviews with federal, state, and MMP officials working on their state’s demonstration and semi-structured interviews with providers and beneficiary advocacy groups. All interview protocol were approved by CMS and state evaluation teams performed thematic analysis of the interview data collected for each state from 2014 to 2022 as part of the larger evaluation. For this study, we focused on the LTSS polices, issues, and interventions gleaned from those state-level thematic analyses and conducted additional thematic analysis to identify cross-state patterns. We note that this study was exempted by RTI International’s Institutional Review Board under Exemption Category 5.
Results
Long-Stay Nursing Facility Use by State
Before presenting the multivariate DiD regression results, here we report unadjusted descriptive information about long-stay nursing facility users as a percentage of all beneficiaries eligible for the demonstration among the demonstration group and comparison group (Figure 1). A core assumption of DiD is that there are parallel trends among the demonstration group and the comparison group such that, in the absence of the Financial Alignment Initiative, they would have followed similar trajectories in long-stay nursing facility use. In Figure 1, we note that the data points as plotted on the graph reflect period estimates, not point-in-time estimates. Thus, to clarify, the label 0 on the graphic represents the first year of the state demonstration, with −1 being 1 year prior to the first year of the demonstration, +1 being 1 year after the first year of the demonstration, and so on. By the end of the first demonstration year (DY1) observable changes emerge: in some states, there is a steeper decline in long-stay use among the demonstration groups (e.g., OH, TX, and WA) while other states show similar trends among the demonstration and comparison groups, or a steeper decline for the comparison groups (e.g., MI and RI). Illinois expanded Medicaid on January 1, 2014, to provide full-benefit coverage. This resulted in many individuals who were previously classified as medically needy moving over to regular Medicaid with full benefits which could explain the notable jump among the demonstration group from the pre-demonstration to the demonstration period (Holladay et al., 2022). In the final demonstration years included in this study, the percentage of long-stay nursing facility users ranged from 4.2% in South Carolina to 11.9% in Ohio among the eligible demonstration group beneficiaries whereas the long-stay nursing facility rates in the comparison group ranged from 6.0% to 24.9%, depending on the demonstration state. Long-Stay Nursing Facility Users as a Percentage of All Eligible Beneficiaries in Each States’ FAI Demonstration (Weighted and Unadjusted). SOURCE: Authors’ Analysis of MDS (Minimum Data Set) Nursing Home Data and Medicare Data. Note. Across All States, the Data Cover the Period From July 2013–December 2020. The Years of Data Differ by State Reflecting Their Varied Start and End Dates. The Data Presented Are Weighted and Unadjusted (Observed) Annual Averages of Long-Stay Nursing Facility Use, With the Vertical Line Highlighting the First Demonstration Year. 0 = First Year of Demonstration; −1 and −2 = One Year and Two Years Prior to the First Year of Demonstration, Respectively; +1, +2, +3, +4, and +5 = One, Two, Three, Four, and Five Years after the First Year of Demonstration, Respectively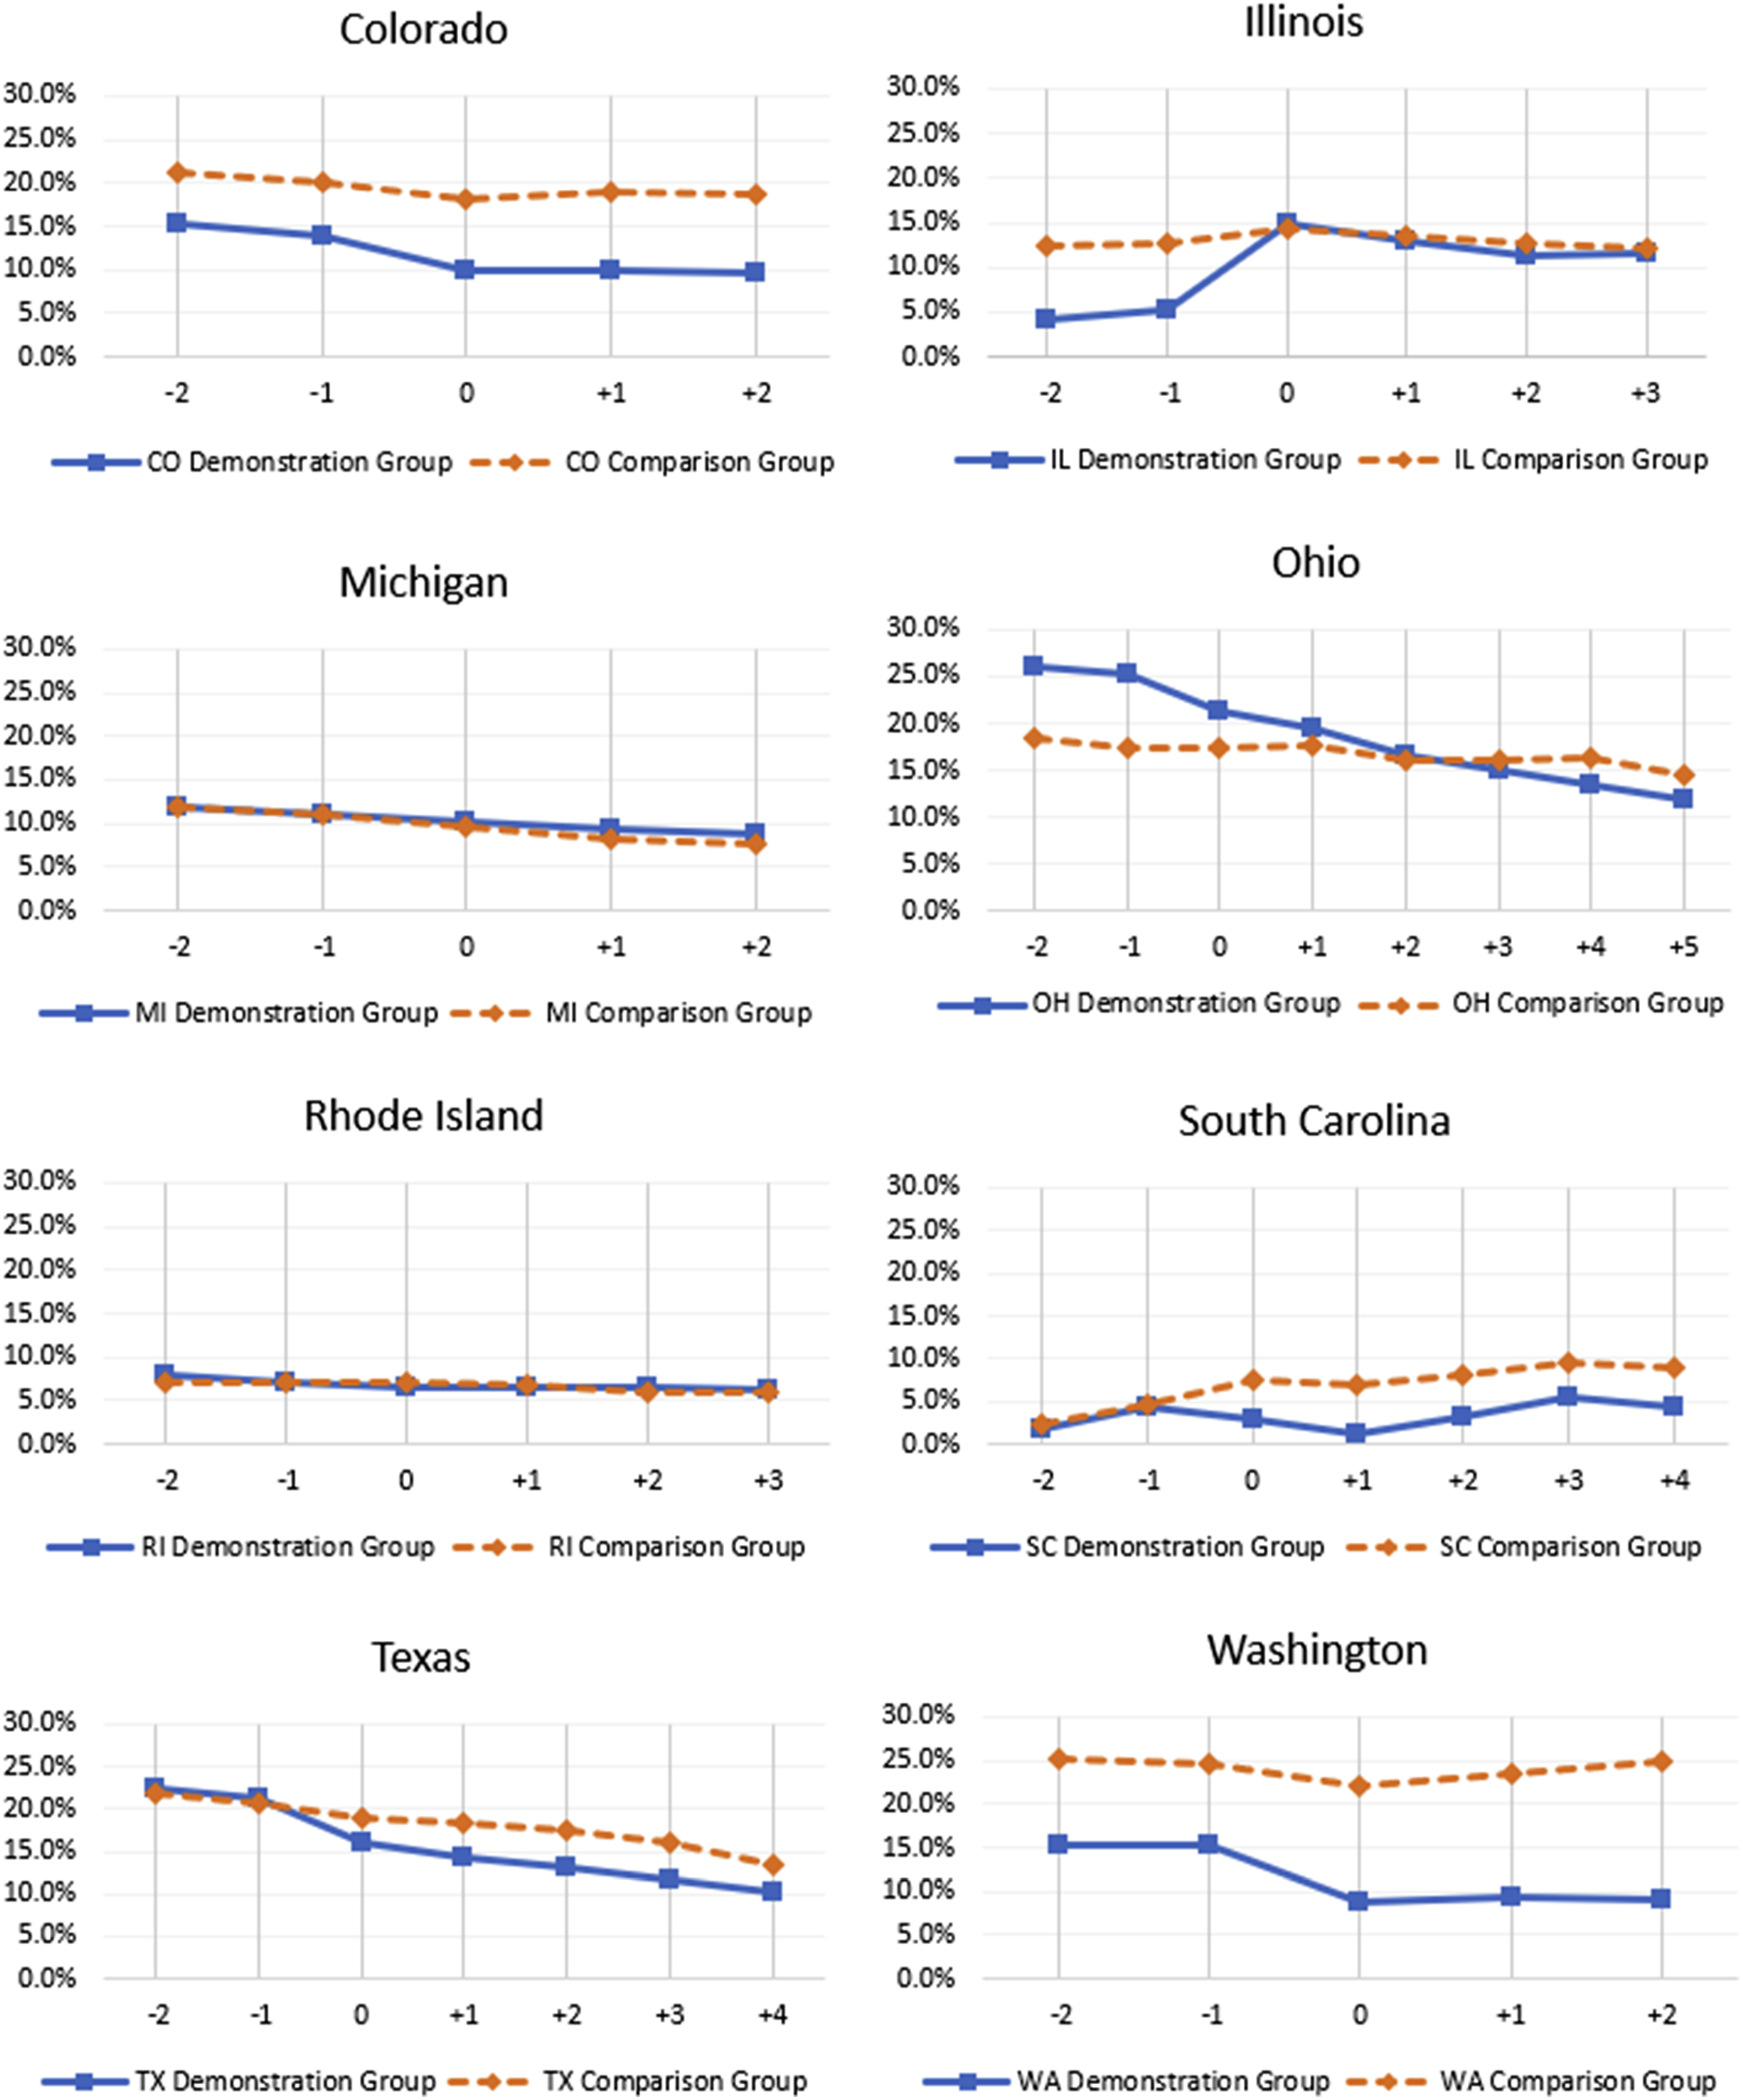
Demonstration Impact on Long-Stay Nursing Facility Use
We present the cumulative DiD impacts of each state’s demonstration on long-stay nursing facility use for demonstration eligible beneficiaries, adjusted for sample characteristics described above. Figure 2 shows that demonstration effects were mixed, with five states observing a decrease in the probability of any long-stay nursing facility use and three states observing an increase or no effect, relative to the state’s specific comparison group. Specifically, in Colorado, Ohio, South Carolina, Texas, and Washington there was a significant decrease in the annual probability of any long-stay nursing facility use. The decrease ranged from −4.22 (p < .001) percentage points in Ohio to −1.30 (p < .001) percentage points in Colorado, relative to the comparison group. The probability of any long-stay nursing facility use in states such as Illinois and Michigan, however, increased relative to the comparison group by 3.78 (p < .001) and 1.42 (p < .001) percentage points, respectively. There was no significant demonstration effect on long-stay nursing facility use in Rhode Island. Cumulative Difference-In-Difference Estimates on the Annual Probability of Any Long-Stay Nursing Facility Use, by FAI Demonstration State. SOURCE: Authors’ Analysis of Medicare Data. Note. Across All States, the Data Cover the Period From July 2013–December 2020. The Years of Data Differ by State Reflecting Their Varied Start Dates. DY = Demonstration Year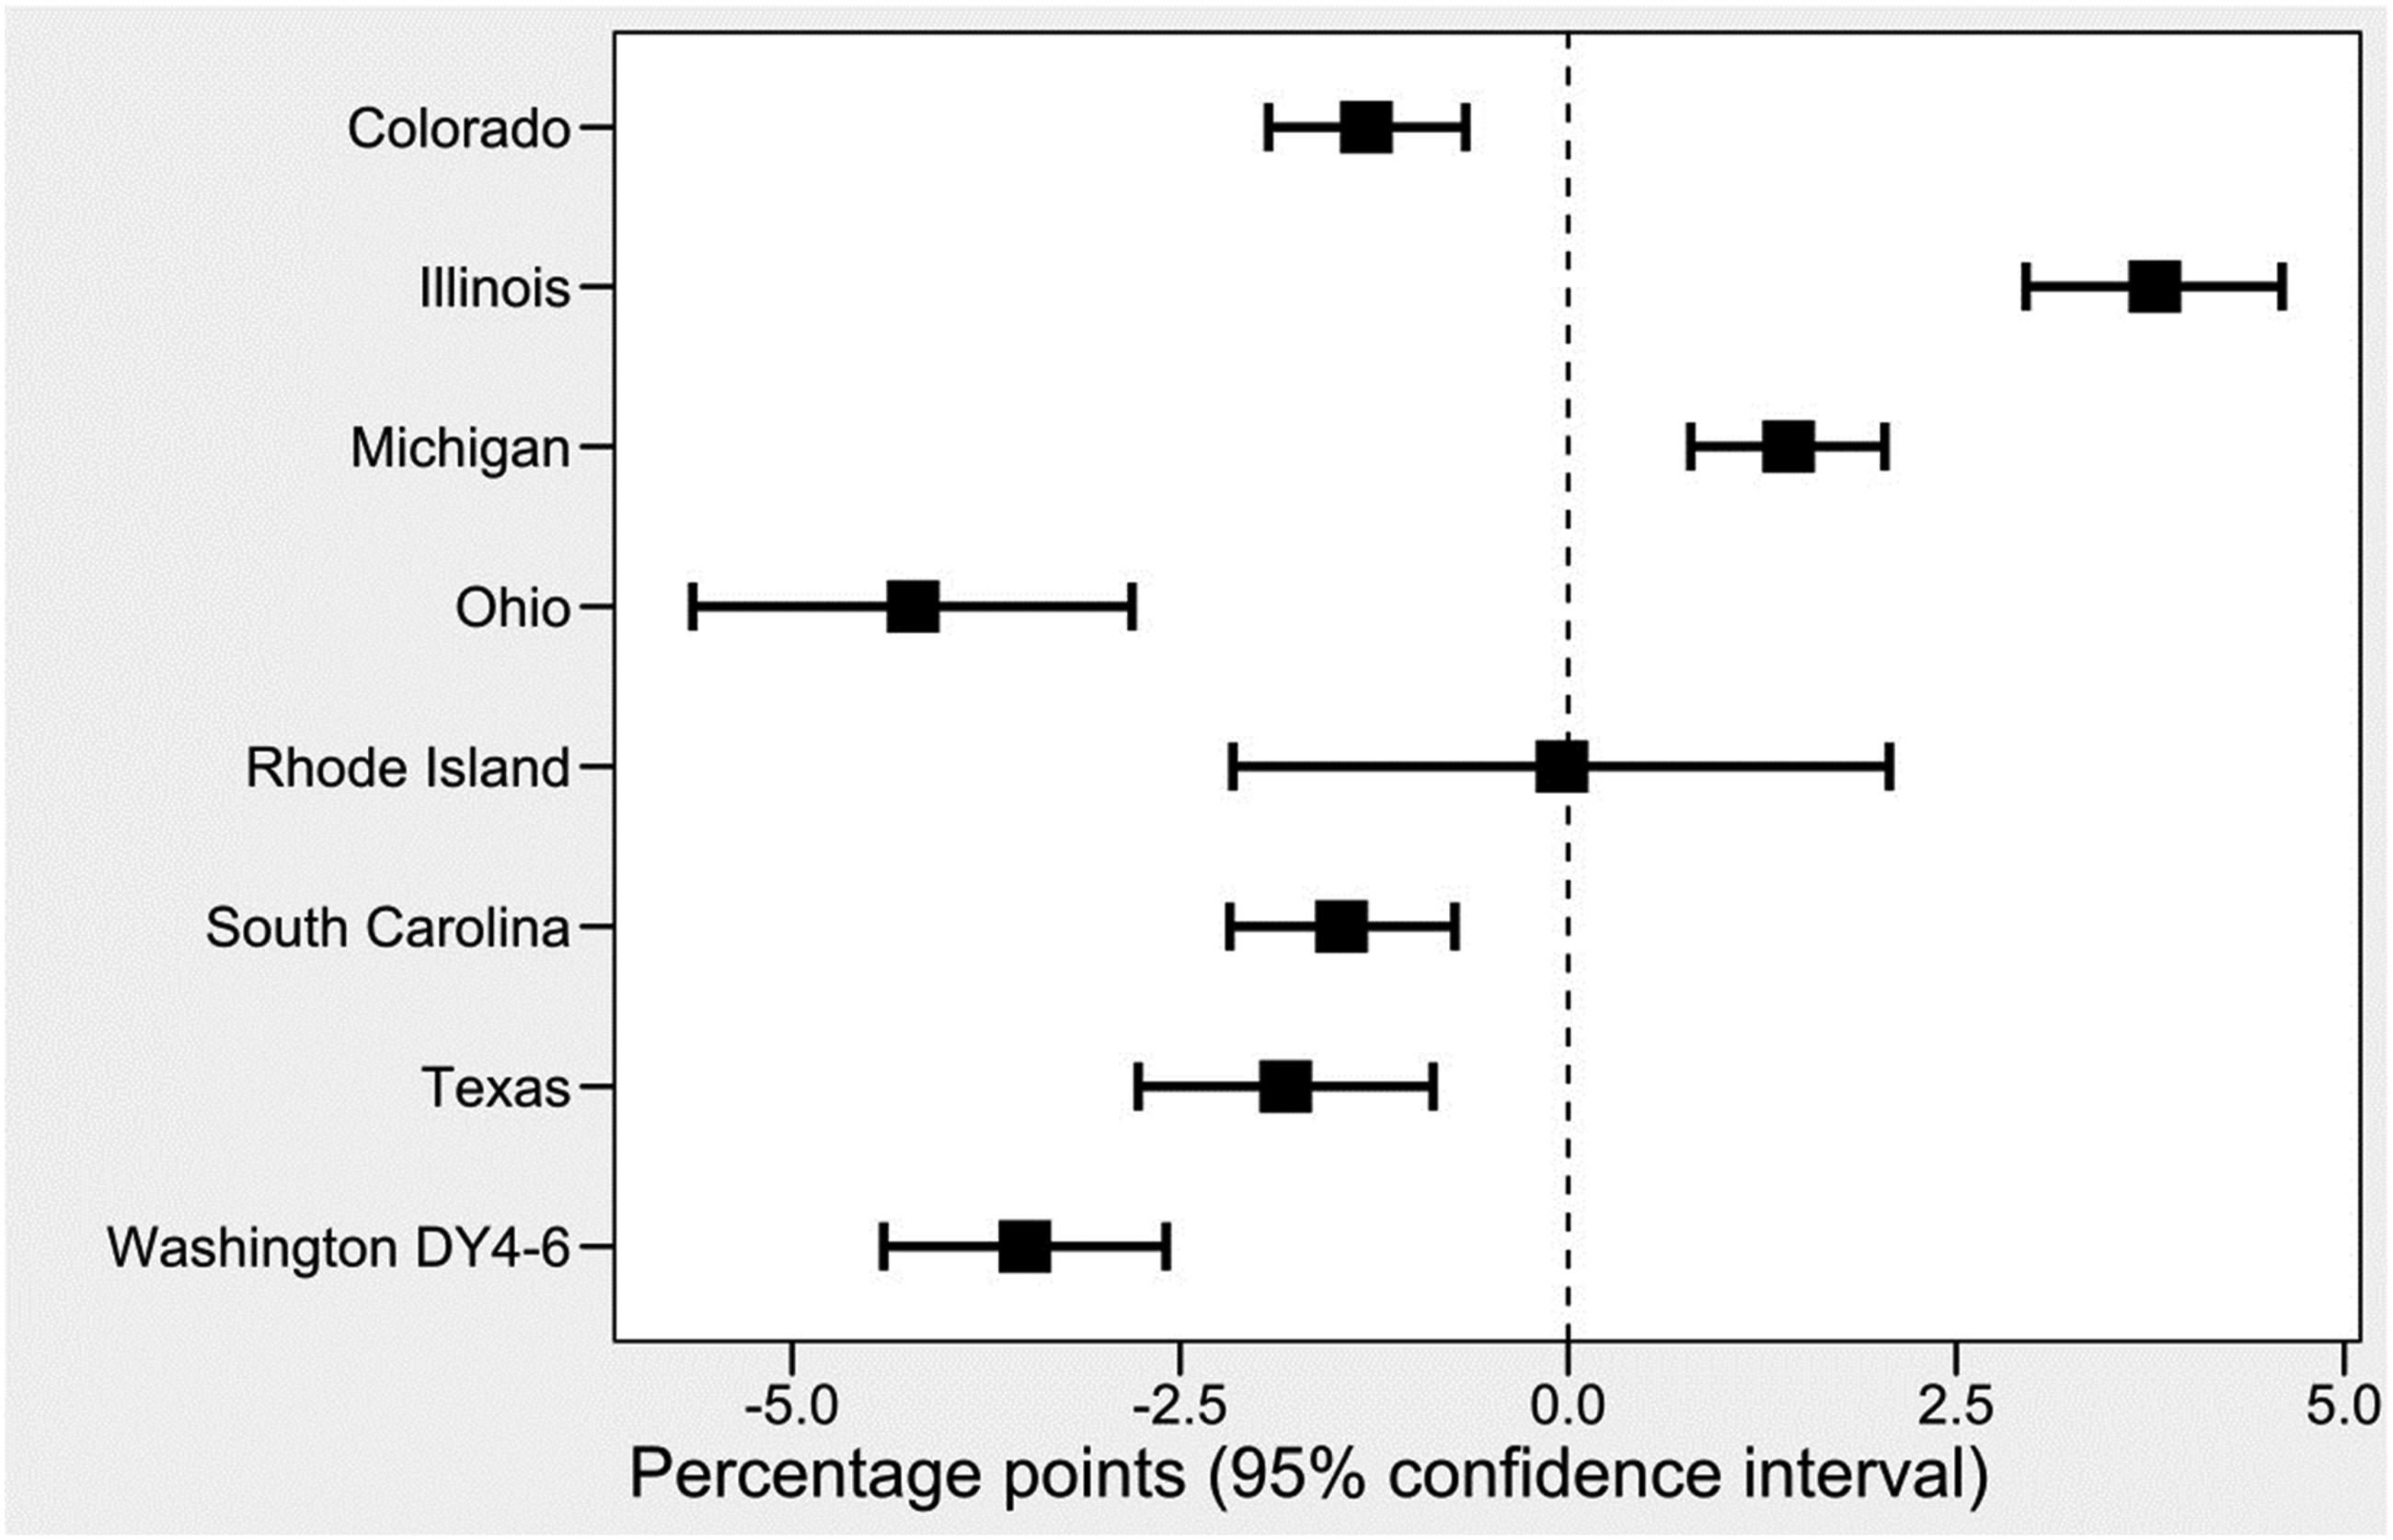
State-Level Context on LTSS Implementation for the FAI
FAI Demonstration States: LTSS Arrangements, Demonstration Enrollment, and Impact on Long-Stay NF Use
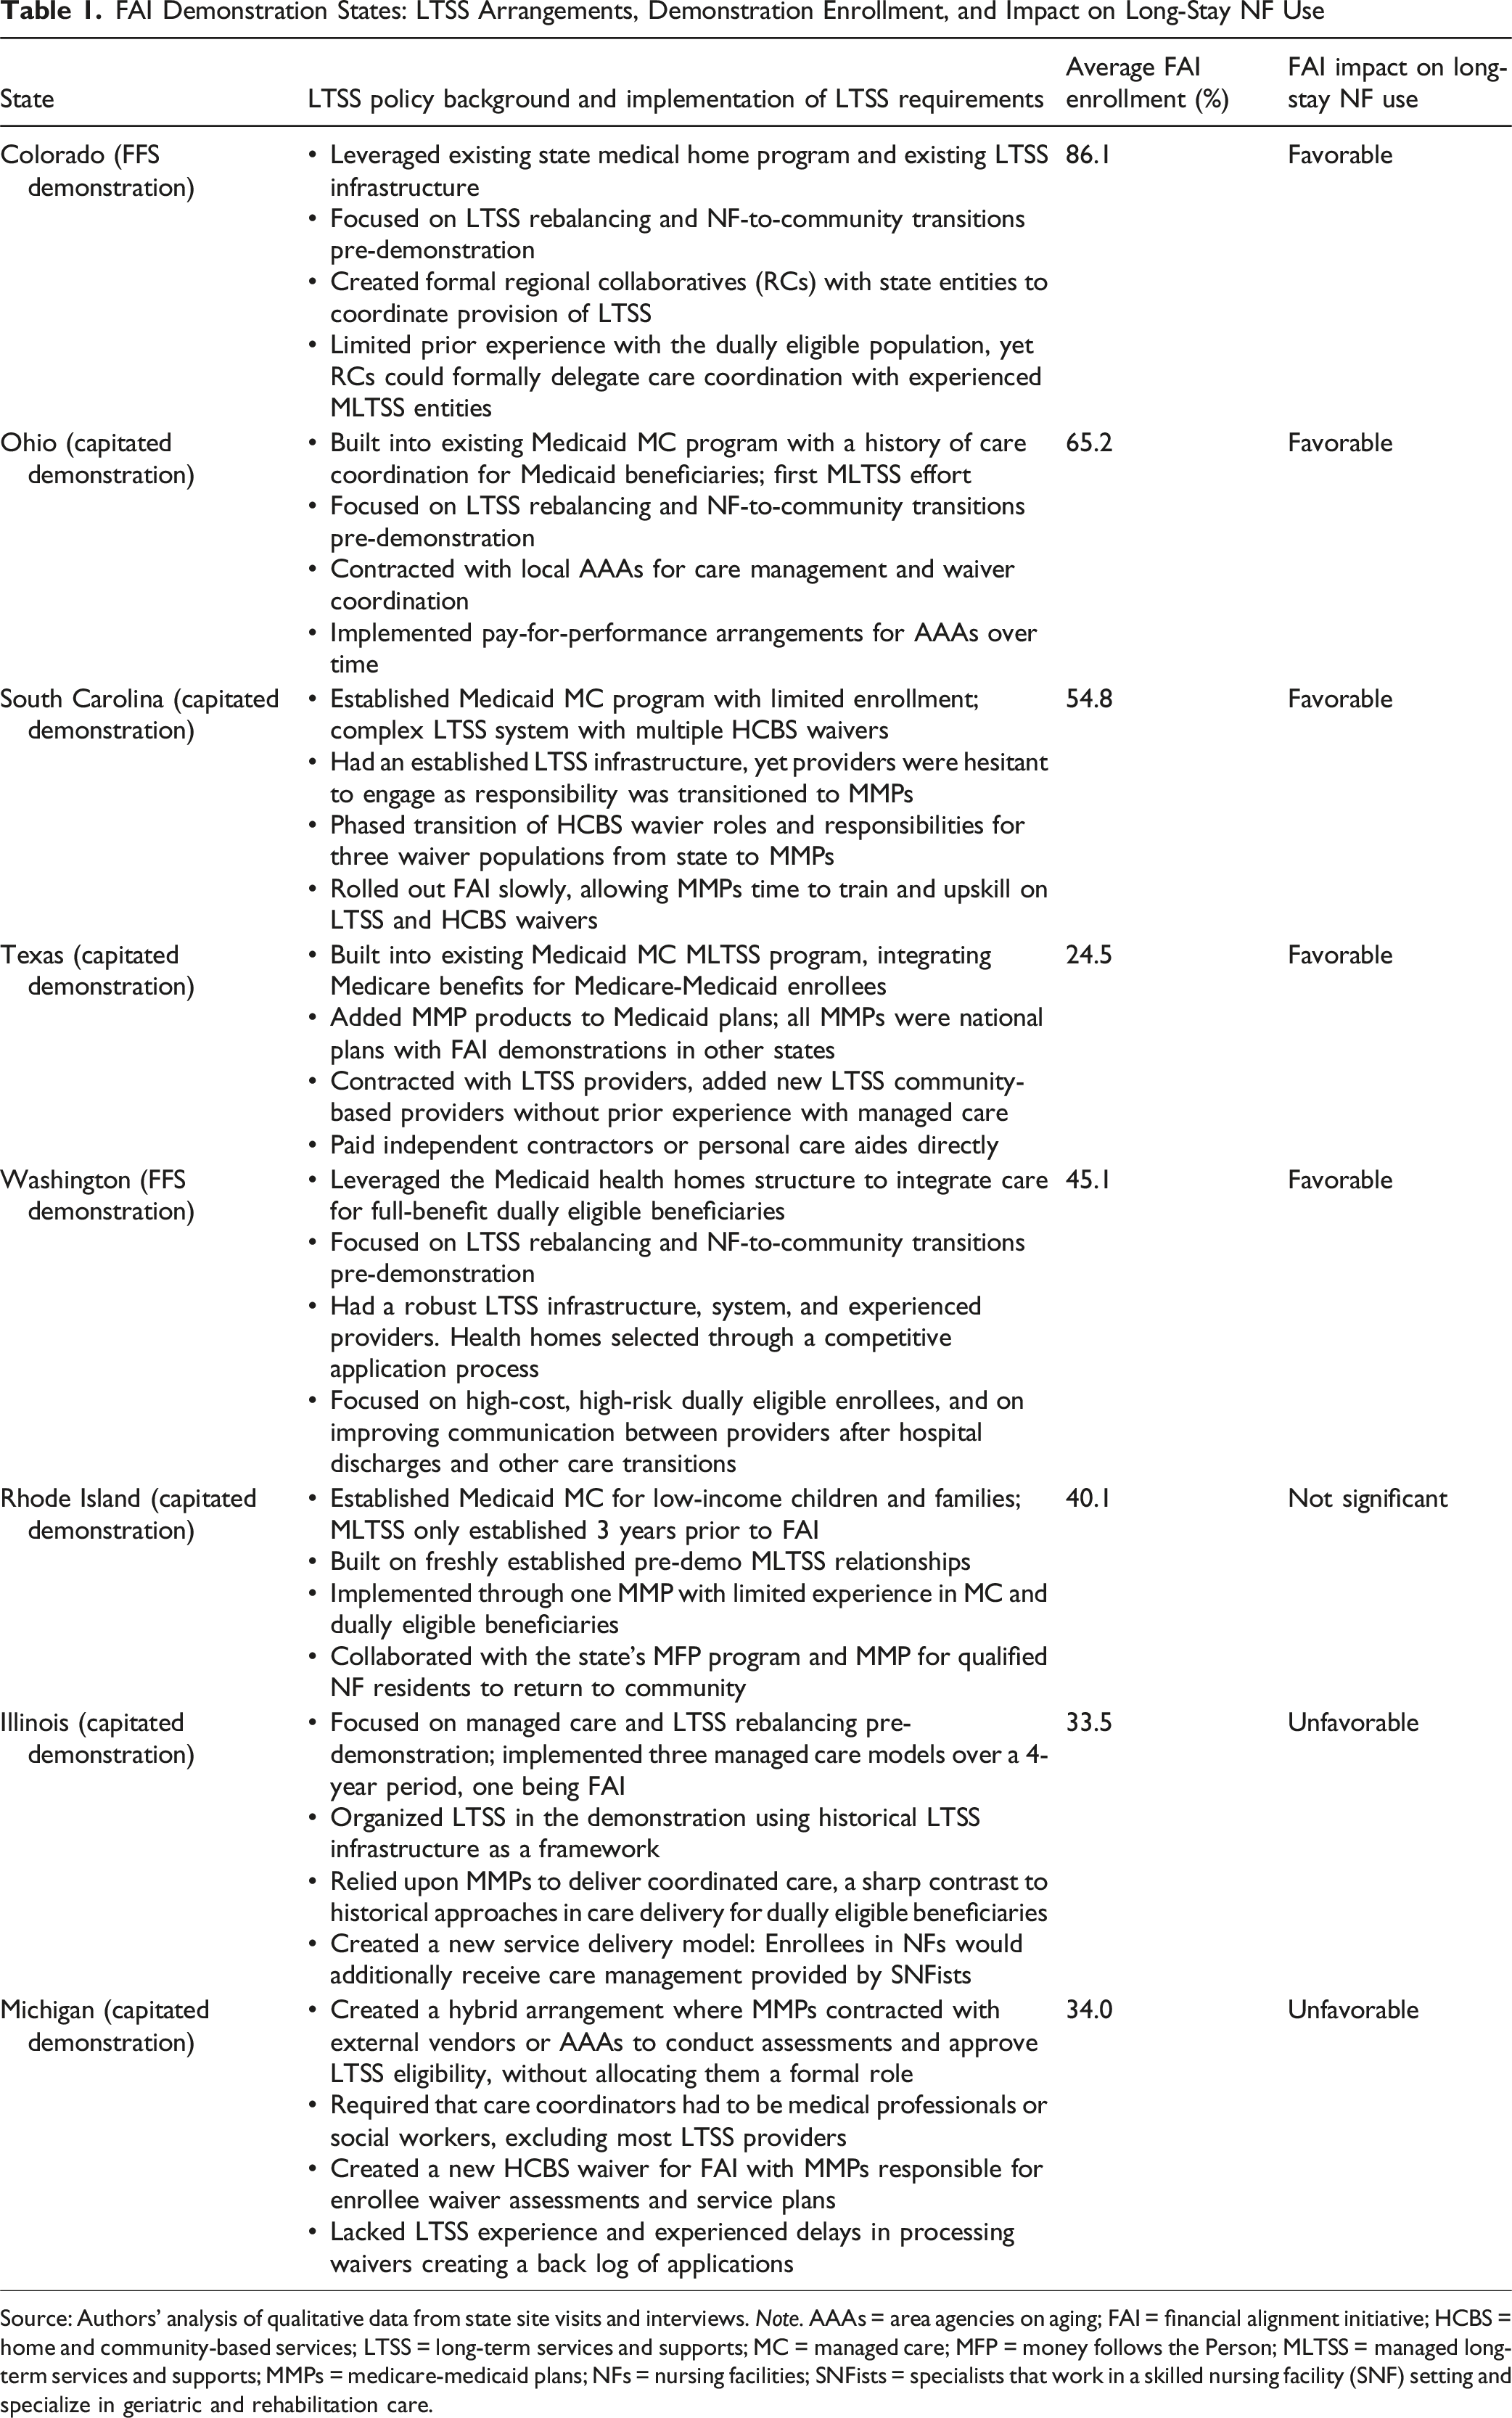
Source: Authors’ analysis of qualitative data from state site visits and interviews. Note. AAAs = area agencies on aging; FAI = financial alignment initiative; HCBS = home and community-based services; LTSS = long-term services and supports; MC = managed care; MFP = money follows the Person; MLTSS = managed long-term services and supports; MMPs = medicare-medicaid plans; NFs = nursing facilities; SNFists = specialists that work in a skilled nursing facility (SNF) setting and specialize in geriatric and rehabilitation care.
The Washington demonstration provides an example of a state that consistently reduced the probability of long-stay nursing facility utilization over the course of the demonstration (Stockdale et al., 2022). This FFS demonstration model focused on using primary-care practice-centered health homes and introducing care coordination and integrative LTSS efforts to reduce nursing facility institutionalization and keep beneficiaries living in the community. The state also focused efforts on high-cost, high-risk dually eligible enrollees and on attempts to impact care transitions such as hospital discharges and improve communication between care coordinators, LTSS case managers, and hospitals. State officials reported that these efforts contributed to the Washington demonstration’s success in nursing facility utilization and Medicare savings. Moreover, Washington has one of the most developed, sophisticated, and generous LTSS systems in the US, making it easier for care coordinators to line up needed services (AARP, 2023b).
The state officials and MMPs in Ohio stated, during interviews, that significant improvements were made over the demonstration period to deliver and coordinate LTSS services, resulting in more beneficiaries transitioning from nursing homes back into the community setting. For example, Ohio MMPs explored using value-based purchasing payments with LTSS providers (rewards for meeting care coordination contract requirements). MMPs also continued to make strides in completing care plans with their beneficiaries as the demonstration progressed; the completion rate increased from less than a quarter in 2014 to over 80% in 2017. Additional factors noted by interviewees included focusing on training care coordinators and managing turnover rates, improving care management services, streamlining health information exchanges, and fostering relationships between interested parties.
Rhode Island and Michigan provide two examples of a state demonstration that did not have favorable impacts on long-stay nursing facility use. Though Rhode Island built the FAI demonstration’s LTSS requirements into an existing Managed LTSS (MLTSS) program, this MLTSS program was developed and implemented just 3 years prior to the start of the FAI demonstration. Although LTSS was a key area of focus for the state, the MMP admitted having limited experience in administering LTSS, with the dually eligible population, and with Medicaid more generally. The steep learning curve paired with a large volume of enrollment early in the demonstration resulted in significant operational challenges.
In Michigan, the annual probability of any long-stay nursing facility use increased, relative to the comparison group. One of the features of the Michigan demonstration was a hybrid arrangement, where MMPs had delegated LTSS assessment and eligibility determination to other organizations but did not give them formal roles in the FAI. This potentially complicated communication efforts and therefore decreased MMPs’ ability to coordinate care quickly and effectively.
Data presented in Table 1 also indicates that the reach of the FAI among the eligible populations in the eight study states, defined as the proportion of eligibles who are enrolled, varied widely and ranged from 24.5 to 86.1%. This may affect the strength of the demonstration effect. We observe a relationship between higher percentages of average enrollment into the demonstration among the eligible population and favorable change in long-stay nursing facility use, with Texas being the exception. For information about the states beyond what is provided in Table 1, consult the RTI evaluation reports available on CMS’s FAI website (https://www.cms.gov/medicaid-chip/medicare-coordination/financial-alignment) which detail each state’s implementation of the LTSS requirements of the demonstration, enrollment over time, and challenges faced early in the demonstration.
Discussion
The goal of the study was to examine whether the Financial Alignment Initiative, by providing focused assessment for LTSS need, care coordination services, appropriate care planning, and other supports to increase a focus on person-centered care, could reduce nursing facility use more than what could be observed in a comparison population. We found that in five of eight study states, beneficiaries eligible for the FAI demonstration experienced a significant decrease in the annual probability of any long-stay nursing facility use relative to the comparison group, indicating that the FAI may have improved the alignment of LTSS with individuals’ preferences to stay in the community. The general preference of individuals is to stay in their home and community and avoid institutionalization as much as possible (Binette & Vasold, 2018).
Difference-in-difference results require caution when interpreting. Favorable results generally indicate that the decrease in the annual probability of any long-stay nursing facility use is steeper in the demonstration group than in the comparison group. This steeper decline could be attributed to the demonstration’s interventions. However, in this study, states with neutral or unfavorable results also experienced a decrease in the annual probability of any long-stay nursing facility use (see Figure 1), but the trend in the demonstration group failed to exceed that of the comparison group. Our general findings are consistent with the overall trend of declining nursing facility utilization widely reported elsewhere (Toth et al., 2022).
Nursing facilities and the long-term custodial care they provide are part of the LTSS continuum. It is generally accepted that increased availability and access to LTSS services in the community allows people to stay in the community longer, delay institutionalization, or return to the community via Money Follows the Person or similar nursing home diversion programs. Rebalancing efforts shift the delivery of LTSS from institutional settings, such as nursing homes, to home and community-based services (HCBS), aiming to provide individuals with the necessary support and care to live independently in their homes or communities, rather than relying solely on institutional care. In reviewing the findings of this study, which combined results from eight FAI demonstration states, it is important to take into consideration states’ rebalancing efforts as well as where these states are in general in their LTSS system development. Since our analyses were conducted on the state level, not the individual MMP level, and model implementation characteristics are only available for the demonstration group, we did not include MMPs’ prior experience with LTSS as a covariate in the DiD models. Our qualitative analysis performed over the course of each state’s demonstration, included tracking changes to states’ policies and learning about differences in LTSS experience from participating MMPs and state administrators. Integration of these qualitative findings supported our interpretation of the DiD results and enhanced the discussion.
The effectiveness of LTSS systems is measured on several dimensions. One approach to illustrate the multiple dimensions of LTSS system performance is known as the LTSS Scorecard: (1) Affordability and Access, (2) Ability to Choose a Setting and Provider, (3) Quality of Life and Quality of Care, 4) Support for Family Caregivers, and (5) Effective Transitions (AARP, 2023a). Dimensions 2, 4, and 5 are particularly relevant to this study. Among the states with favorable results in this study, Washington and Colorado have consistently received top rankings on all five LTSS scorecard dimensions, indicating a well-developed LTSS system predating the demonstration. Moreover, except for South Carolina at 49%, states with favorable results spent above 50% on Medicaid HCBS expenditures as a percentage of total Medicaid LTSS expenditures in fiscal year 2019 (Murray et al., 2021). Although the study compares LTSS outcomes among demonstration eligibles with other comparison group beneficiaries with similar characteristics, it appears that overall, demonstrations in states with favorable results had a better LTSS infrastructure to rely on for their efforts to reduce nursing home utilization, potentially making their efforts more effective. Specifically, the way LTSS services, including Medicaid HCBS state plan and waiver services, are organized in each state directly affects how care coordination is provided in the FAI demonstration.
Some LTSS structures and relationships between MMPs, the MFFS demonstrations and the LTSS system promote better integration and coordination, and some hinder effective coordination, affecting LTSS outcomes. Interviews with state officials, MMPs representatives, and local beneficiary advocacy groups (e.g., Ombudsman) suggest the major challenges that impeded progress in keeping people out of nursing facilities or returning residents to the community included complex LTSS waiver programs, service carve outs, and weak MMP and LTSS provider relationships. However, qualitative data collected during evaluation site visits, focus groups, and interviews revealed that states’ efforts, including care coordination approaches and flexible spending allocations, were inconsistent across participating states and across MMPs within a state (Walsh et al., 2012). This variation makes it difficult to tie these activities directly to nursing home utilization rates, however, this study sheds light on the ways different states implemented the FAI demonstration and integrated LTSS with other health care services, with some states achieving a reduction in long-stay nursing facility use.
Our overall FAI evaluation work from analyzing data from all participating states over time found that in the capitated model demonstration, learning about and integrating LTSS was a major task for MMPs joining the demonstration due to their lack of prior experience with these services and the populations that use them. For example, MMPs whose parent companies did not have any experience providing or arranging LTSS services to their members prior to the demonstration were unfamiliar with the range of LTSS available or needed by their demonstration enrollees. In other states, MMPs’ parent companies sometimes had some Medicaid or LTSS experience but had no authority to get their enrollees assessed and authorized for LTSS. This was particularly challenging if the state had complex waiver programs or assessment/eligibility backlogs. In contrast, the MFFS demonstrations utilized the existing LTSS system and had close relationships or delegated care coordination for enrollees with LTSS needs to experienced MLTSS organizations, earning consistently high scores for their LTSS rebalancing efforts. Thus, we found that implementation challenges or other inhibiting factors may have impacted the way states integrated their LTSS and resulted in barriers to further decreasing long-stay nursing facility use. Several states, however, did implement FAI LTSS requirements in ways that favorably impacted long-stay nursing facility use for dually eligible Medicare-Medicaid beneficiaries.
Limitations
First, the ITT analysis used in this study includes both eligible beneficiaries enrolled and those not enrolled in the demonstration, and enrollment varied significantly among states (Centers for Medicare & Medicaid Services, n.d). Low enrollment in the demonstration may affect meaningful detection of any demonstration-related changes in long-stay nursing facility use. Furthermore, while we would expect those enrolled in the demonstration to be different than the unenrolled population, favorable selection into the program by some MMPs limits generalizability. Second, states submitted eligibility and enrollment data to identify eligibility and exclusion criteria for the demonstration and comparison groups. Although we applied these criteria consistently across groups and time periods, unobservable factors associated with identifying eligibility, such as differences in sources of eligibility determination between CMS data and state’s data, may introduce bias. Additionally, since state Medicaid programs have different income thresholds and eligibility criteria which can change over time, there may be unobservable differences in the composition of the comparison group and demonstration group. Finally, our summary of each state’s LTSS context and arrangements includes information for the eight demonstration states and not for any of the comparison states. Thus, we are unable to contrast a state’s LTSS system against that of its comparison states.
Conclusion
Nursing facility use generally declined over time in both the demonstration and comparison populations, consistent with broader national trends moving toward community-based LTSS (Stockdale et al., 2022). However, the relatively larger reduction observed among the demonstration eligible population in most FAI states is likely the result of integrative care planning, care coordination, or targeted efforts by the states to transition beneficiaries from hospitals or nursing homes back into community settings. By better understanding and meeting the LTSS needs of beneficiaries, the FAI states helped beneficiaries gain access to LTSS to live more independently.
Footnotes
Acknowledgments
We would like to thank the State officials, managed care plan staff, consumer advocates, and other interested parties who contributed information reflected in this paper. We gratefully acknowledge the many contributions from staff at the Centers for Medicare & Medicaid Services (CMS), especially our federal project officers over the years. This work was supported by the CMS under contract number HHSM-500-2014-00037i. The opinions and statements expressed in this paper are those of the authors. They do not reflect the views or policies of the contractor, the Department of Health and Human Services (HHS), or any HHS agencies.
Funding
The authors disclosed receipt of the following financial support for the research, authorship, and/or publication of this article: This work was supported by the Centers for Medicare & Medicaid Services under contract number HHSM-500-2014-00037i.
Declaration of Conflicting Interests
The authors declared no potential conflicts of interest with respect to the research, authorship, and/or publication of this article.
Ethics and Informed Consent Statement
This study was exempted by RTI International’s Institutional Review Board (IRB ID Number: 14060) on September 24, 2012 under Exemption Category 5.
IRB Protocol Approval Number
Study Exemption, RTI International IRB ID Number: 14060.