
Abstract
Falls and physical inactivity are major public health concerns affecting older adults’ well-being. Regular physical activity (PA) can reduce fall risk, yet extreme heat and poor walkability may limit activity. Using data from 250 low-income older adults (LOAs) in Orlando, Florida, we examined how PA and community environmental factors (CEFs) influence fall risk and how CEFs affect PA. Fall risk was measured with the Stopping Elderly Accidents, Deaths, and Injuries (STEADI) fall risk checklist. PA was monitored continuously with FitBit devices for 6 months. CEFs included urban heat island (UHI), walk score, and social vulnerability index. Results indicate physically active LOAs had lower fall risk than inactive counterparts. Higher walkability was linked to lower fall risk, while UHI was not significantly related. LOAs in socially vulnerable communities had lower PA levels. Findings suggest promoting PA and improving senior community environment may help reduce fall risk and enhance LOAs’ health.
• By integrating community physical and social environmental data and device-measured physical activity with the comprehensive fall-prevention framework—STEADI, this paper contributes to a more holistic understanding of the key community-level risk factors for falls among low-income older adults. • This study offers novel insights, from both spatial and socioenvironmental perspectives, into how temperature variations influence older adults’ engagement in physical activity and fall risk.
• The findings suggest that senior communities can promote older adults’ engagement in physical activity and reduce their fall risk by organizing intervention programs and offering more structured exercise opportunities during hotter and cooler months, when their activity levels tend to be lower. • The findings also underscore the importance of policy makers paying greater attention to socially vulnerable senior communities and comprehensively enhancing their physical and social environments.What This Paper Adds
Applications of Study Findings
Introduction
Falls among older adults remain a global public health concern, contributing to morbidity, mortality, and health-related costs (Montero-Odasso et al., 2022). About 684,000 fatal falls occur worldwide each year, and fall-related injuries represent a leading cause of disability among older adults across all major global regions (Salari et al., 2022; World Health Organization, 2024). In the United States, an older adult falls every second, resulting in about 37 million falls and 9 million fall-related injuries each year (U.S. Centers for Disease Control and Prevention, 2024a). The etiology of falling in older adults is multifactorial, involving age-related physiological decline, environmental challenges such as extreme heat and limited walkability, and behavioral aspects like physical inactivity (Li et al., 2024; Nguyen et al., 2025).
Physical inactivity is prevalent among older adults, especially those with low incomes, and is a significant risk factor for falls (Cunningham et al., 2020). Physical inactivity is defined as failing to meet the WHO guideline of at least 150 minutes of moderate-intensity or 75 minutes of vigorous-intensity physical activity per week (World Health Organization, 2020). Low income refers to an annual family income at or below 200% of the federal poverty level (U.S. National Institute of Health, 2026). The National Institute on Aging (2022) and the U.S. Centers for Disease Control and Prevention (2024b) both emphasize that regular physical activity, particularly exercises that improve muscle strength, balance, and coordination, can significantly reduce fall risk among older adults. Reviews of randomized controlled trials show that physical activity is the most frequently tested fall-prevention intervention (Sherrington et al., 2020) and that older adults who participate in structured exercise programs experience fewer falls than those who do not (Papalia et al., 2020).
Although physical activity reduces fall risk and supports overall health in older adults, extreme heat and severe weather can limit their participation. Extreme heat is a prolonged period, typically lasting two to 3 days or more, of high temperatures (above 90°F) and humidity that can pose serious, even deadly, health risks (U.S. Department of Homeland Security, 2025). Research shows that physical activity tends to increase during warmer periods in cold-climate regions (Viken et al., 2016), whereas in warm-climate areas, higher temperatures are associated with reduced physical activity and increased sedentary behavior, as observed in Houston, Texas (Cheong & Gaynanova, 2024). Furthermore, urban residents face greater health risks during hot weather conditions than suburban and rural populations due to the urban heat island effect (UHI) (Heaviside et al., 2017), whereby urban areas experience higher temperatures and more intense heat extremes (Yin et al., 2023). This phenomenon was first proved in New York City, and since then, numerous empirical studies have examined UHI characteristics, supported by advances in remote sensing and geographic information system technology in UHI research (Almeida et al., 2022; Yin et al., 2023).
In addition to temperature, other community environmental factors, such as community walkability and social vulnerability, also play a crucial role in influencing older adults’ physical activity and fall risk. Studies show that older adults walk more frequently in highly walkable neighborhoods with dense development, mixed land use, and good street connectivity, and that greater walkability and recreation access generally increase physical activity (Kwon & Akar, 2025; Todd et al., 2016). However, not all high-walkability environments lead to greater physical activity levels, as community social vulnerability can limit individuals’ access to recreational sites or comfort in otherwise walkable environments. Bereitschaft (2023) conducted a nationwide analysis of U.S. metropolitan areas and found that socially vulnerable populations, including low-income, racially marginalized, and aging residents, often face reduced access to supportive infrastructure, and factors like high crime or unaffordable housing can further diminish their usability.
Although older adults’ fall risk is influenced by multiple factors, particularly in the context of global warming, few studies have integrated behavioral and multifaceted environmental factors into a unified framework to better understand this pressing geriatric health issue. In addition, although the association between physical activity and community environmental factors is well documented, the findings are not universally conclusive for older adults. To fill the gaps, this study aims to (1) assess the association between physical activity and fall risk among low-income older adults and (2) examine how community environmental factors, such as the UHI effect, walkability, and social vulnerability, influence their physical activity engagement and fall risk.
Methods
Participants
Data were collected from low-income older adults who were engaged in various activities, including physical activity, across 13 senior centers in Orlando, Florida. Operated primarily by city or county parks and recreation departments, these facilities serve as community hubs for adults aged 55 and older, providing supportive spaces for fitness, education, and social engagement while promoting active, healthy, and socially connected lifestyles through targeted programs and resources (City of Orlando, 2026; Orange County, 2026). A purposive, site-based sampling strategy was used to recruit participants directly from senior center activity groups in low-income communities or from centers that regularly serve low-income older adults. This approach was selected to ensure adequate representation of individuals who utilize community-based services and who meet the eligibility criteria. Recruitment occurred on-site through staff announcements and researcher-led information sessions, allowing potential participants to ask questions and enroll during regular scheduled activities.
The study protocol was approved by the Institutional Review Board at the corresponding author’s institution. Before data collection, participants signed informed consent forms. To be eligible for the program, participants had to be aged 60 or older, achieve a score above 22 on the Rowland Universal Dementia Assessment Scale: Multicultural Cognitive Assessment Scale (Storey et al., 2004), and be able to stand unassisted on a scale. Individuals were excluded if they reported experiencing shortness of breath, were undergoing treatment at rehabilitation facilities, planned to relocate within a year, or had been hospitalized four or more times in the previous year. A total of 250 community-dwelling older adults were enrolled during the months between April 2023 and February 2025 and were included in the analysis for this study.
Measurements
Participants’ fall risk was assessed by our research team with the Stopping Elderly Accidents, Deaths, and Injuries (STEADI) fall risk checklist (Rubenstein et al., 2011). The checklist includes 12 items that describe common fall-related situations experienced by older adults. Two items were scored using a yes (2) or no (0) format, while the remaining 10 items were scored uniformly as yes (1) or no (0). A total fall risk score was obtained by summing the responses across all items, with higher scores reflecting a higher self-perceived risk of fall. A total score of 4 or higher indicated a participant’s elevated risk of falls (Rubenstein et al., 2011). In this study, the measure showed strong reliability, with a Cronbach’s alpha of 0.81. Fall risk was assessed along with the demographic surveys at the entry into the study.
Following the collection of fall risk data, physical activities data were obtained from May 2023 to February 2025 using FitBit, a wearable activity-monitoring device. In the original Study protocol, participants were provided with Fitbit devices and instructed to wear them daily under free-living conditions. They were encouraged to wear the devices continuously, including during both daytime and nighttime hours, removing them only as needed for charging or personal comfort. Participants received standardized instructions from the original study team regarding device wear, charging procedures, and synchronization with the study platform. The present analysis utilized de-identified, Fitbit-derived physical activity data collected as part of the original study and made available to the investigators through the dataset. The current study team had no direct contact with participants and did not provide additional training or monitoring.
Data were obtained through routine synchronization of Fitbit devices with the study database; therefore, data availability reflects participants’ adherence to device wear and synchronization procedures. Continuous, uninterrupted 24-hour data capture is not feasible due to necessary charging periods and intermittent non-wear time. Adherence to Fitbit wear instructions and data completeness were inherently limited by free-living monitoring conditions of the original study. Among participants who remained enrolled and continued synchronizing their devices, physical activity data were available whenever synchronization occurred. Accordingly, analyses were restricted to valid, available Fitbit data. Missing data reflects real-world variation in device adherence and study attrition, rather than systematic data loss during the secondary analysis.
Participants in this study wore Fitbit devices, which are non-invasive and considered low risk. To monitor potential adverse events, participants were instructed to report any discomfort or issues related to device use to study staff. According to the original Study documentation available to the authors, no device-related adverse events were reported. The secondary dataset does not include detailed logs of minor issues (e.g., skin irritation), and thus adverse events related to Fitbit use could not be systematically evaluated in the present analysis.
Participants were instructed to wear the device continuously for 6 months, encompassing both the summer months (May to September) and non-summer months (October through April) in Central Florida. During this period, the average daytime high temperature ranged from 62°F in January 2025 to 92°F in July 2024, with an average of 74°F in the winter months and 89°F in the summer months (World Weather Info, 2025). Based on the recorded data, the average daily light active minutes, fair (moderate-intensity) active minutes, and very (vigorous-intensity) active minutes were calculated to assess participants’ engagement in physical activity. Participants were classified as physically active (1) if they met the WHO guideline, or physically inactive (0) if they did not.
The UHI effect was assessed using the Heat Island Severity layer created by Environmental Systems Research Institute, Inc. (ESRI, 2023). This ArcGIS Online layer visualizes urban areas with elevated temperatures relative to their surrounding environments using a 1–5 severity scale, where 1 indicates mild heat and 5 indicates severe heat. The dataset is primarily derived from Landsat 8 thermal imagery (Band 10) collected during summer months and classifies 30-m pixels based on their deviation from the citywide mean temperature using Jenks Natural Breaks optimization. It provides coverage for thousands of cities across the United States (ESRI, 2023). The 13 senior centers were categorized into three levels of heat exposure using ArcGIS Pro 3.5: mild (1), mild to moderate (2), and moderate (3). None were located in areas with moderate-to-high or severe heat.
Walk scores were obtained from the Walk Score website (Walk Score, 2025). Walk score measures the walkability of a location based on proximity to amenities, walking times, and street design factors such as block length. Scores range from 0 to 100 and are calculated using a methodology developed by urban planning and environmental experts, validated by researchers in urban planning, real estate, and public health (Li et al., 2016). The average walk score for the 13 senior centers was 49.8. Senior centers were classified as less walkable (1) if the walk scores were below 49.8 and as walkable (2) if the scores were 49.8 or higher.
Social vulnerability refers to how socioeconomic factors, such as poverty, age, disability, race/ethnicity, access to resources, and housing quality, affect a community’s ability to respond to adverse events like natural disasters and environmental stressors (U.S. Centers for Disease Control and Prevention, 2024c). The social vulnerability index (SVI), obtained from the CDC (U.S. Centers for Disease Control and Prevention, 2024d), was used to assess community social vulnerability. The index ranges between 0 and 1, with higher values indicating greater social vulnerability. In this study, the average SVI for the communities surrounding the 13 senior centers was 0.73. Centers were classified as less socially vulnerable (1) if their community SVI was below the average and as more socially vulnerable (2) otherwise.
Statistical Analysis
Descriptive statistics and frequency analyses were conducted to summarize the research variables and participants’ demographic characteristics. A two-sample t-test was used to compare fall risk between physically active and inactive participants. Two-sample t-test and Analysis of Variance (ANOVA) were performed to examine differences in fall risk and physical activity levels based on UHI severity, walkability, and SVI. Furthermore, an ordinary least squares (OLS) regression model was conducted to assess the associations between fall risk as response variable and predictors physical activity, UHI, walkability, and SVI, controlling for participants’ age, race/ethnicity, and gender. Finally, three OLS regression models were constructed separately to examine the influence of UHI, walkability, and SVI on participants’ engagement in physical activity, measured in light, fair, and very active minutes, with participants’ age, race/ethnicity, and gender as control variables. In this study, results with p < 0.05 were considered statistically significant, while those with p < 0.10 were interpreted as marginally significant. These analyses were conducted using SPSS 30.0 and STATA 19.
Results
Descriptive Characteristics
Summary Statistics (N = 250)
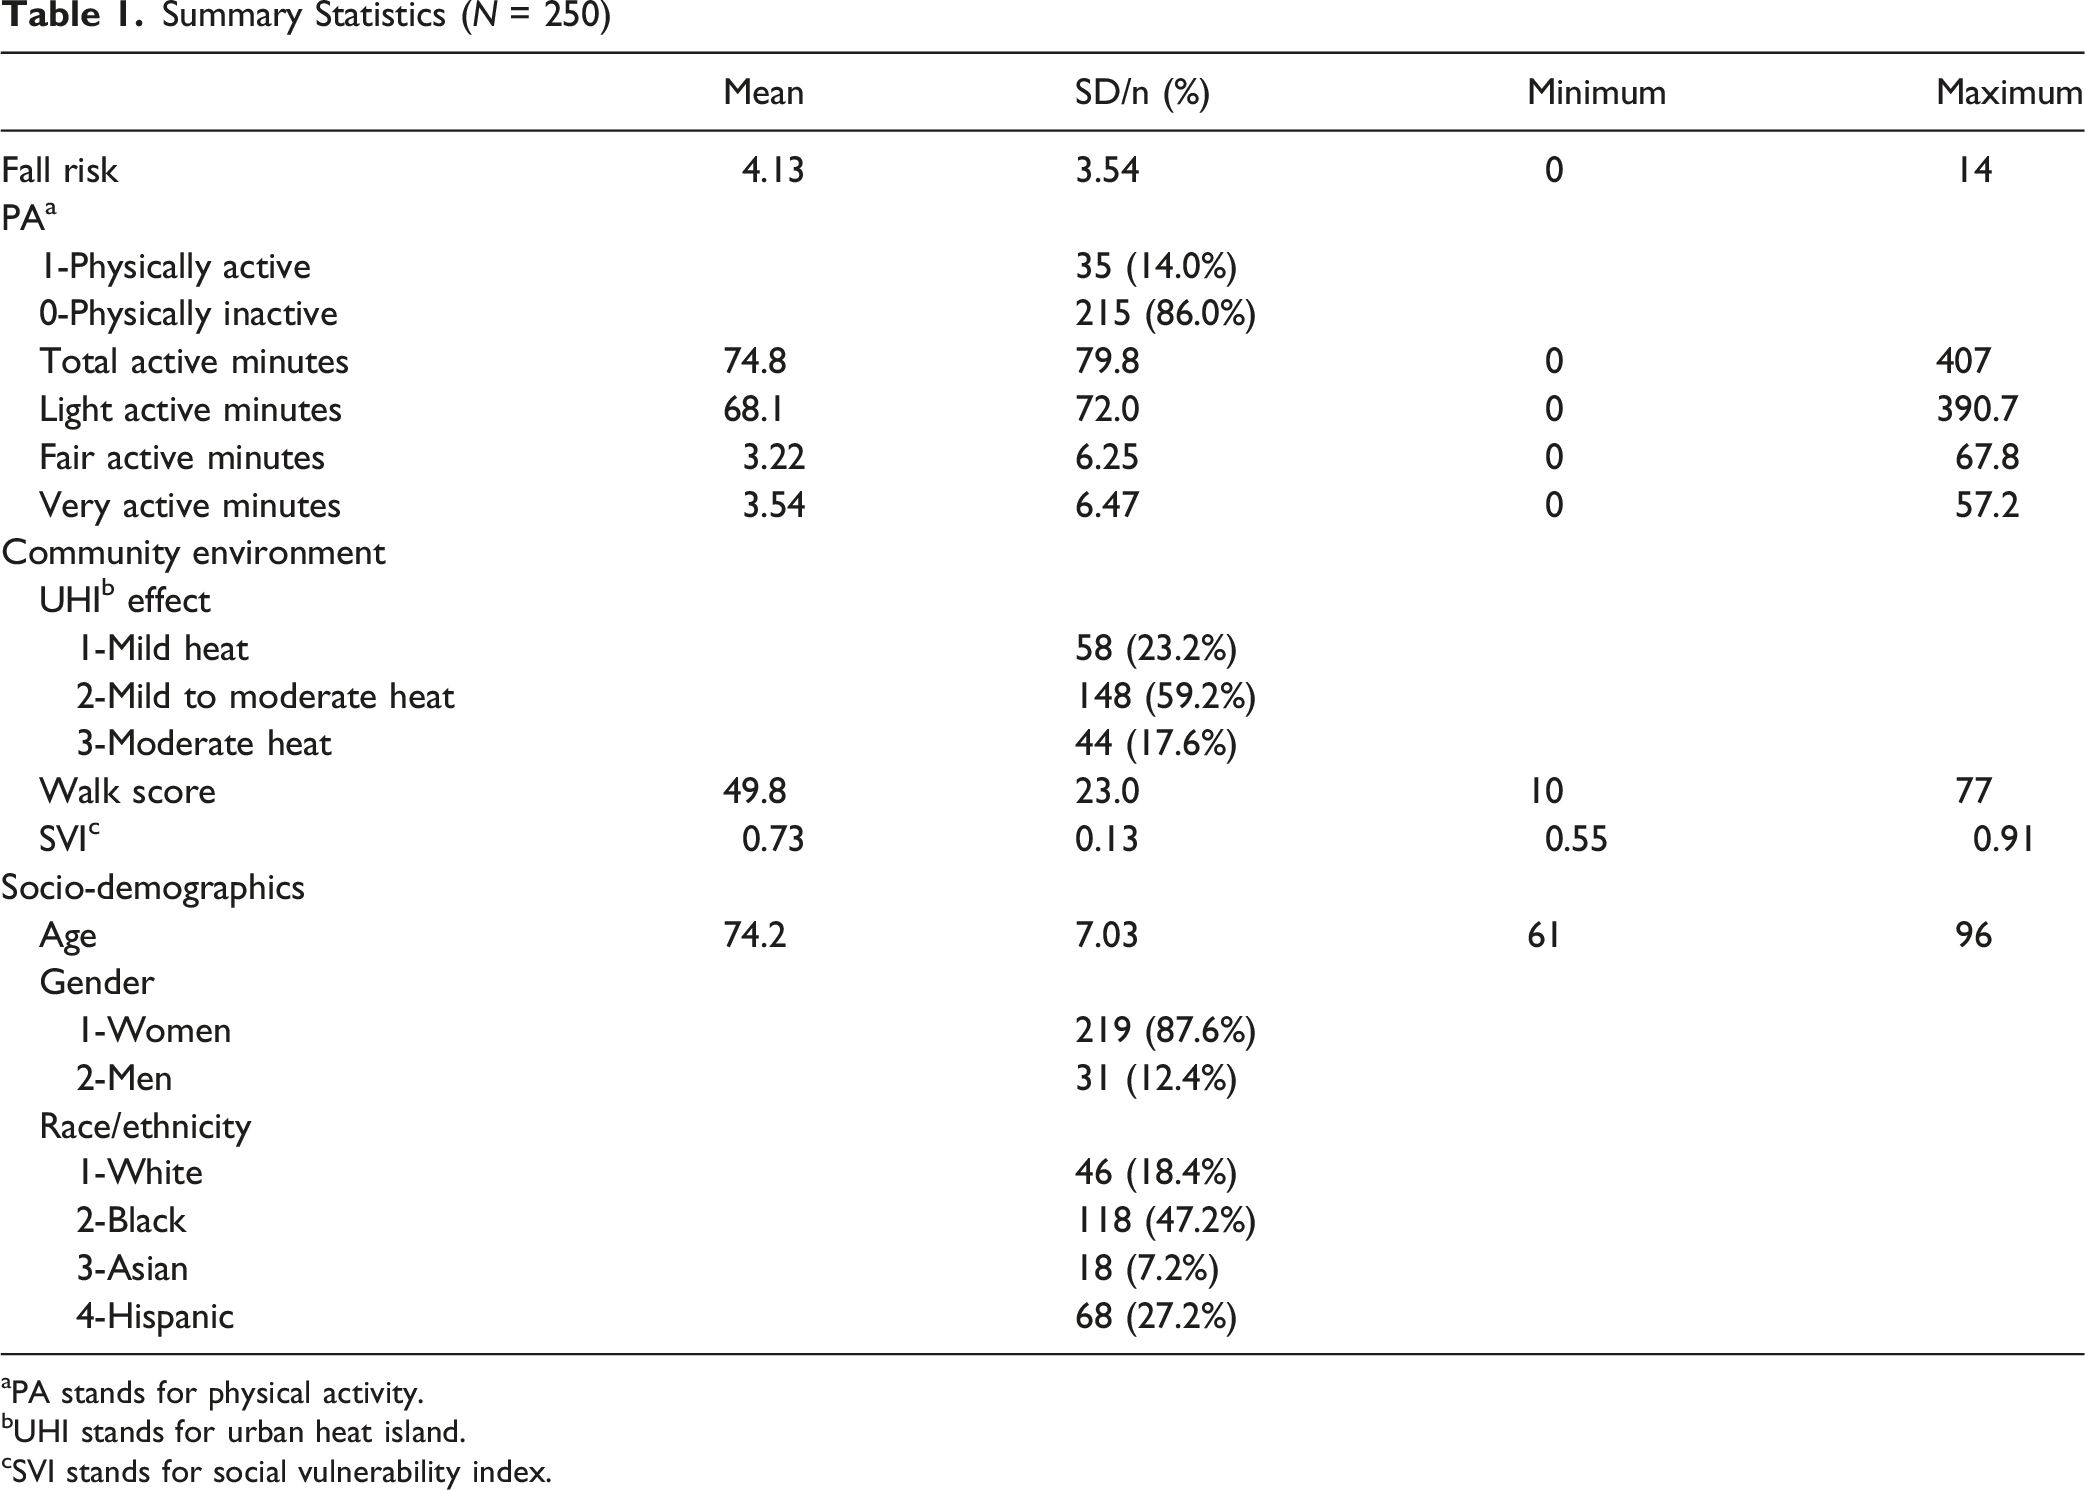
aPA stands for physical activity.
bUHI stands for urban heat island.
cSVI stands for social vulnerability index.
About 23.2% (n = 58) of the participants lived in areas with mild heat, while 59.2% (n = 148) lived in areas with mild to moderate heat, and 17.6% (n = 44) in areas with moderate heat. Walk scores ranged from 10 to 77, with an average score of 49.8 (SD = 23.0). SVI values ranged from 0.55 to 0.91, with an average value of 0.73 (SD = 0.13). Approximately 44.0% (n = 110) of the participants lived in less walkable areas, and 52.0% (n = 130) lived in more socially vulnerable areas.
Comparisons of Fall Risk and Physical Activity
LOAs’ Fall Risk in Relation to Their Engagement in PA and Their Surrounding Community Environment (N = 250)
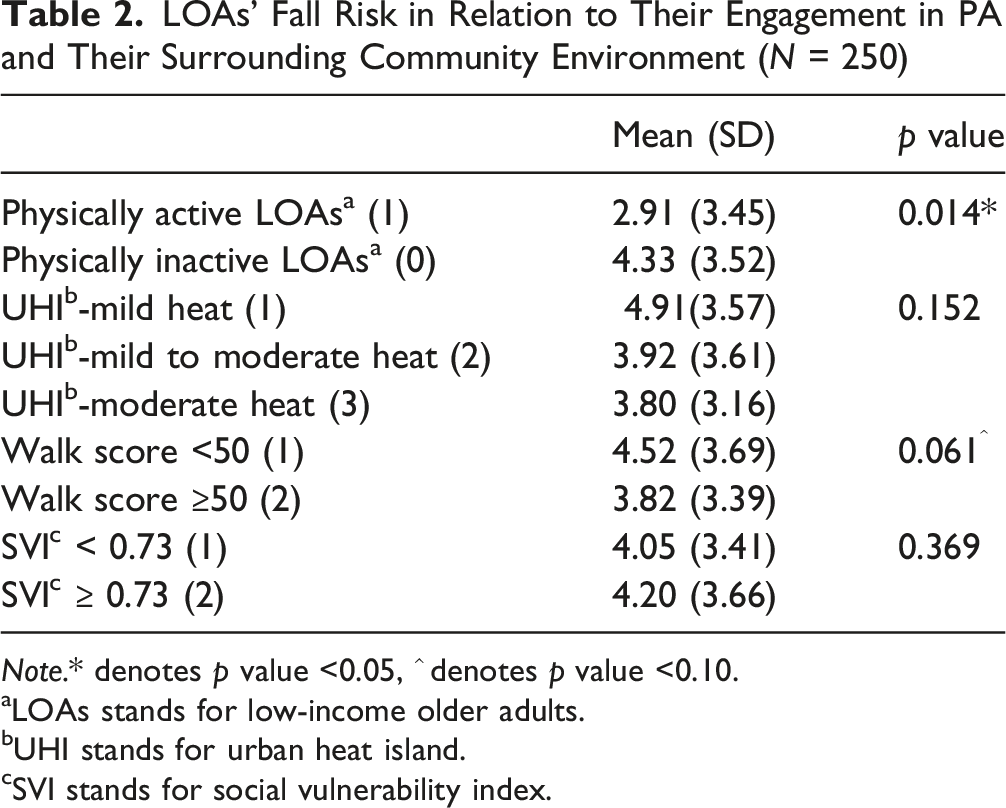
Note.* denotes p value <0.05, ^ denotes p value <0.10.
aLOAs stands for low-income older adults.
bUHI stands for urban heat island.
cSVI stands for social vulnerability index.
LOAs’ Participation in Physical Activity in Relation to Their Surrounding Community Environment (N = 250)
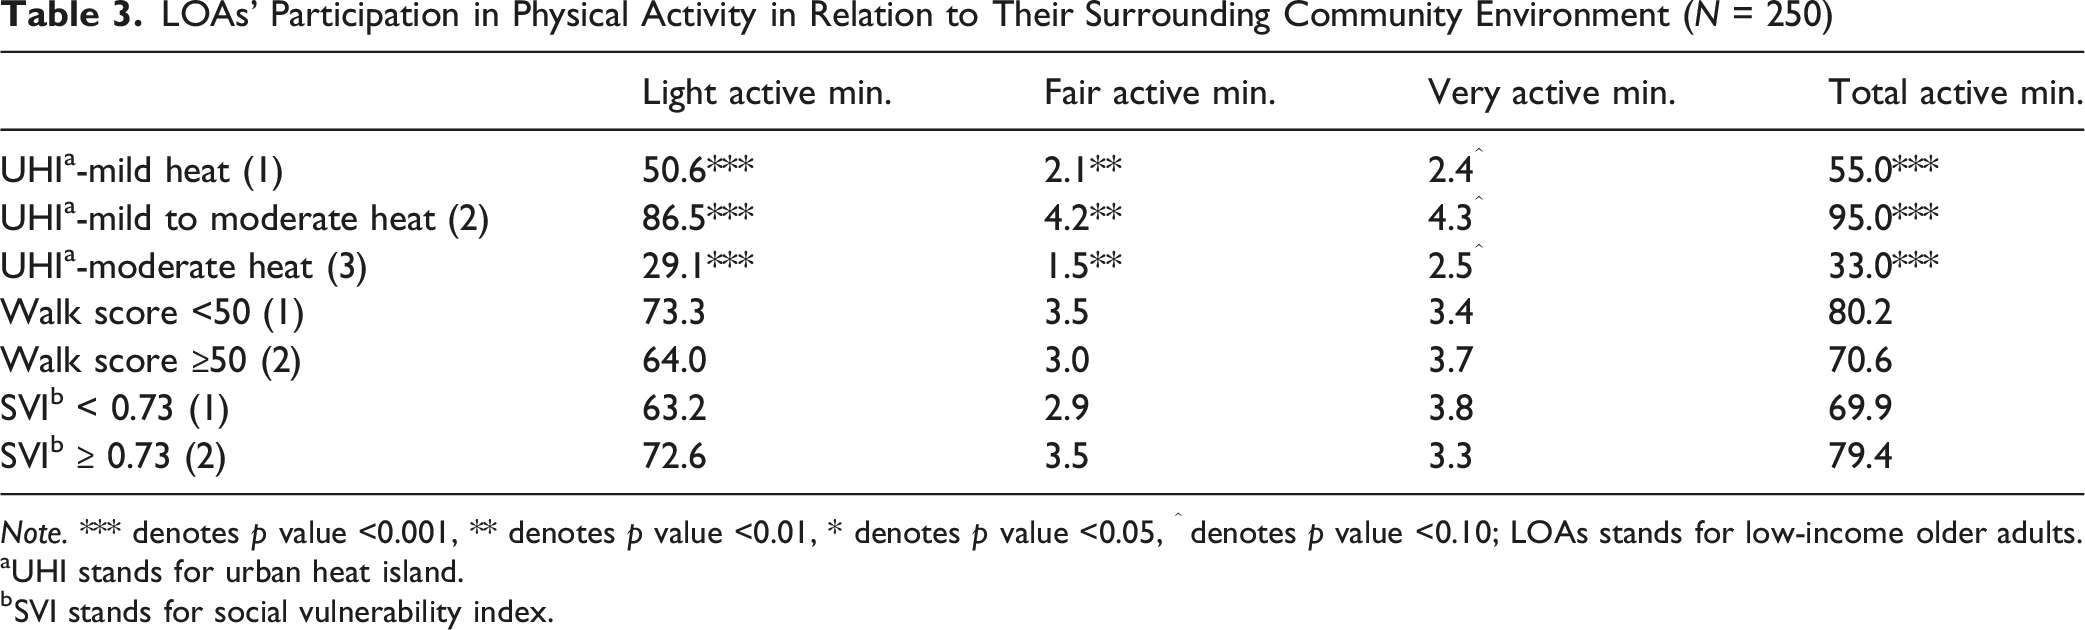
Note. *** denotes p value <0.001, ** denotes p value <0.01, * denotes p value <0.05, ^ denotes p value <0.10; LOAs stands for low-income older adults.
aUHI stands for urban heat island.
bSVI stands for social vulnerability index.
Monthly trends were further examined descriptively to illustrate seasonal patterns in physical activity. Figure 1 shows the percentage of physically active participants for each month in relation to the average daytime high temperature for that month. Higher rates of physical inactivity were observed at temperatures below 71 °F or above 89 °F. Notably, the percentage of physically active low-income older adults was lower in December and January, but the pattern was not consistent in other winter months. The percentage of physically active LOAs in relation to the average daytime high temperature (F°) for each month (note: LOAs stands for low-income older adults)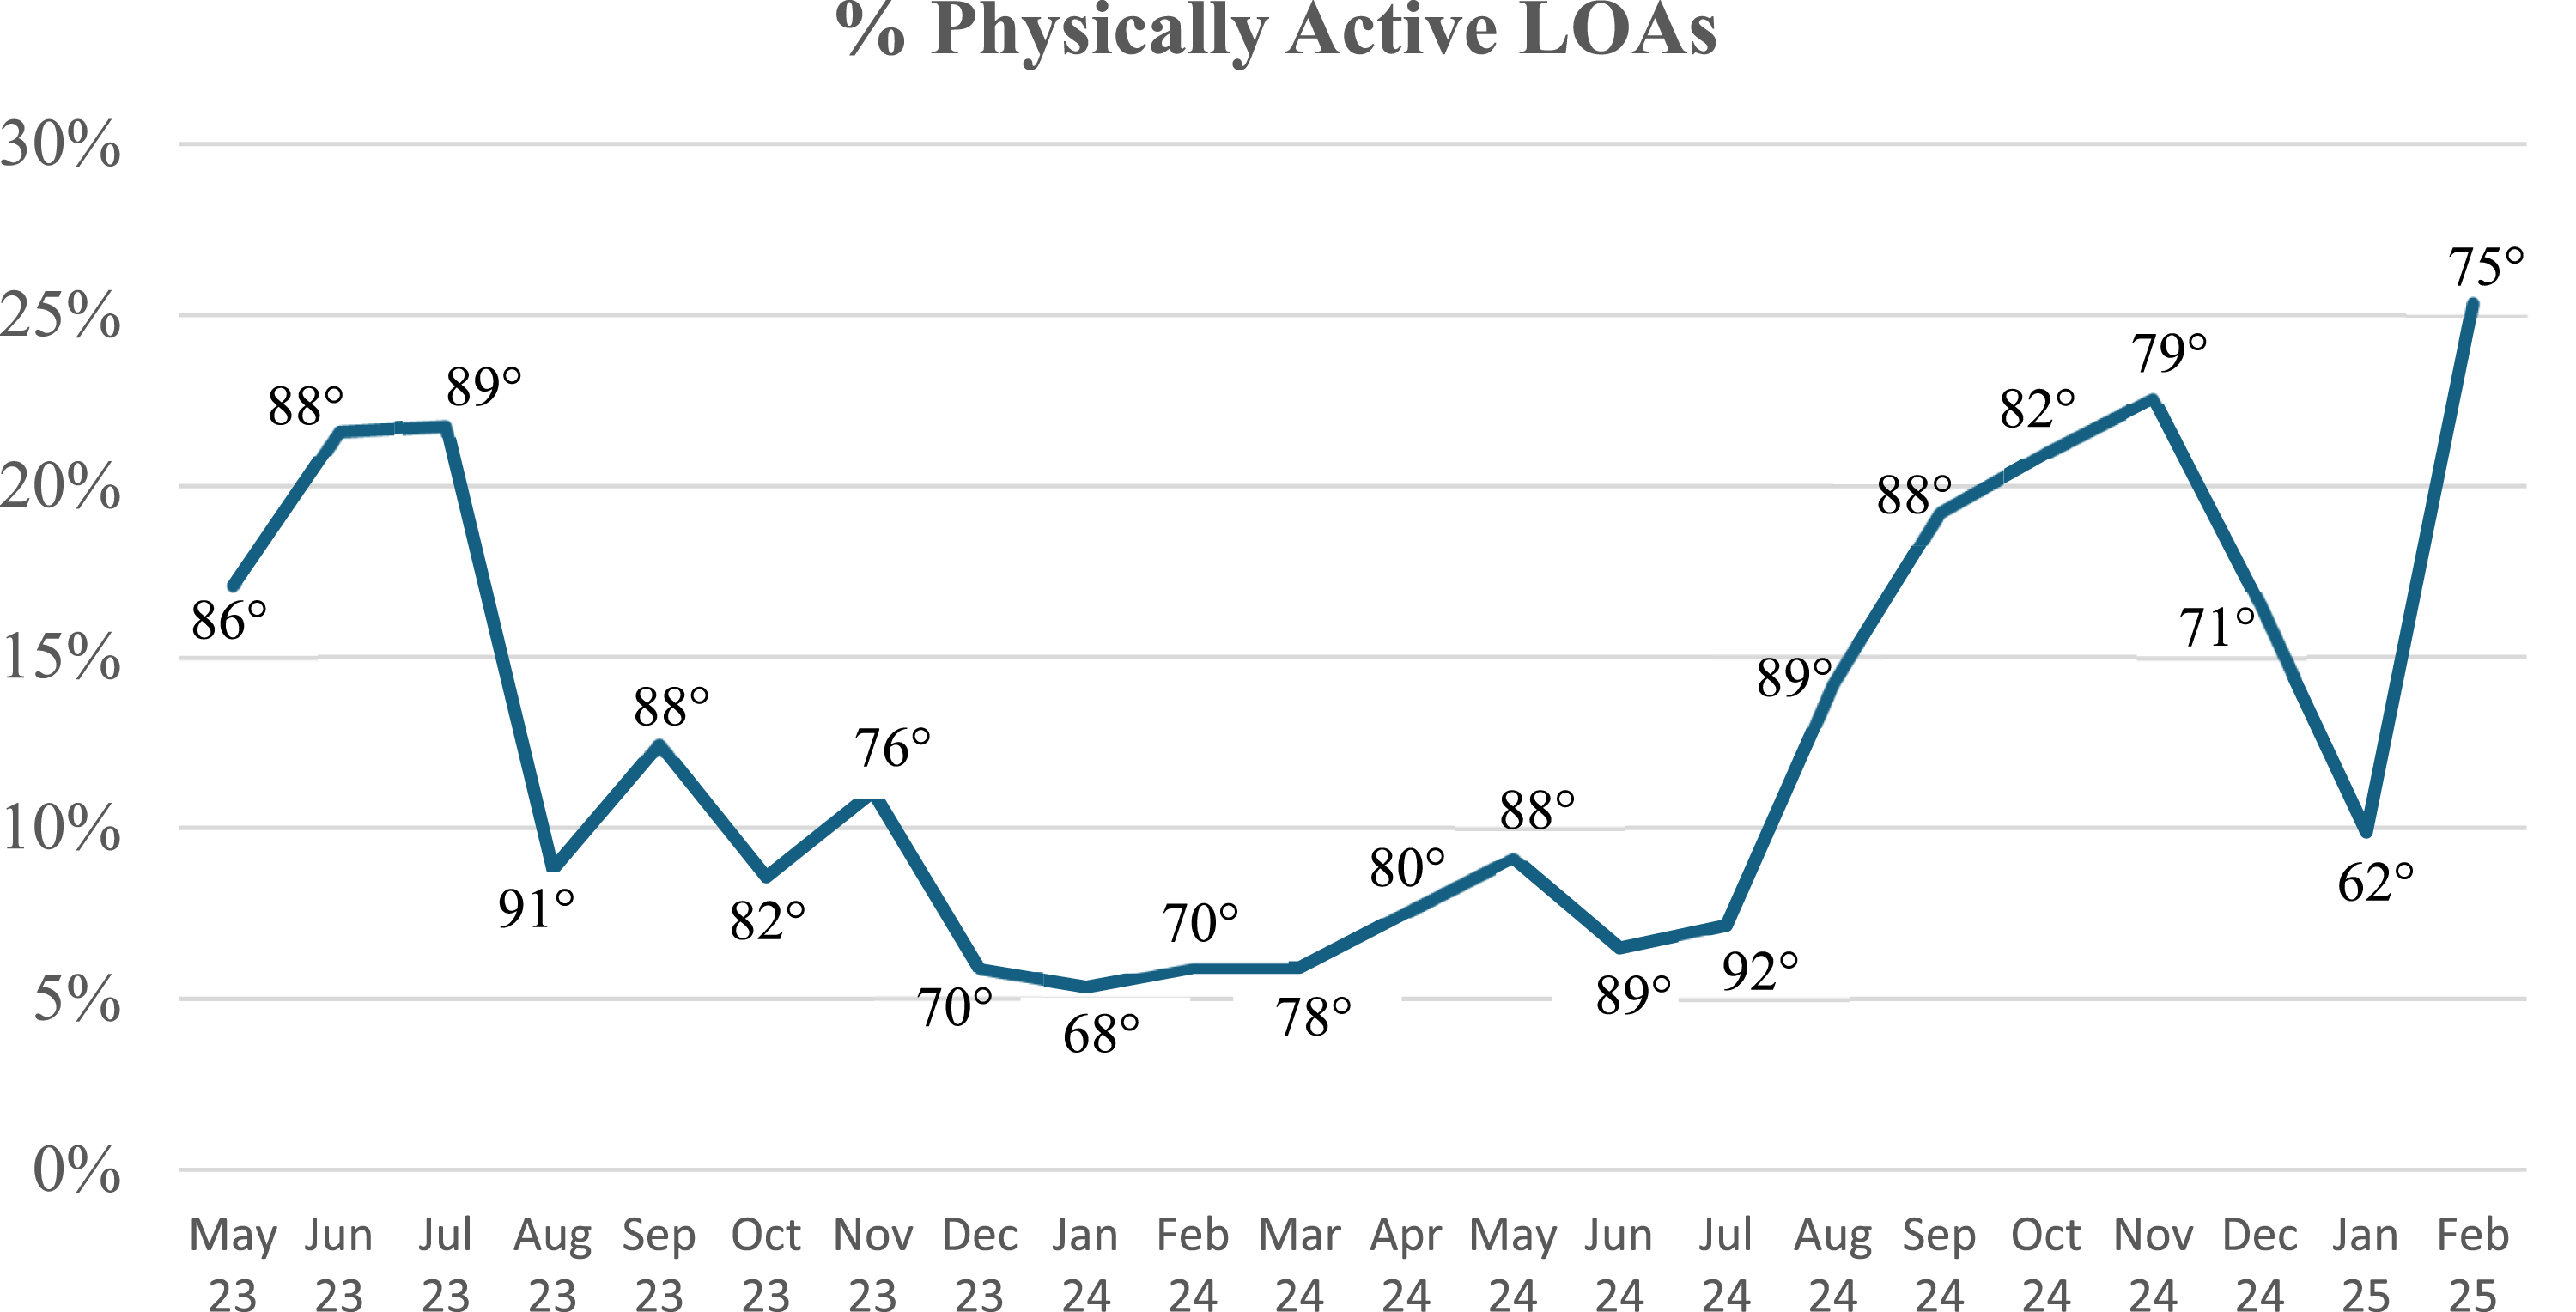
Results of Regression Models
Results of Regression Models (N = 250)
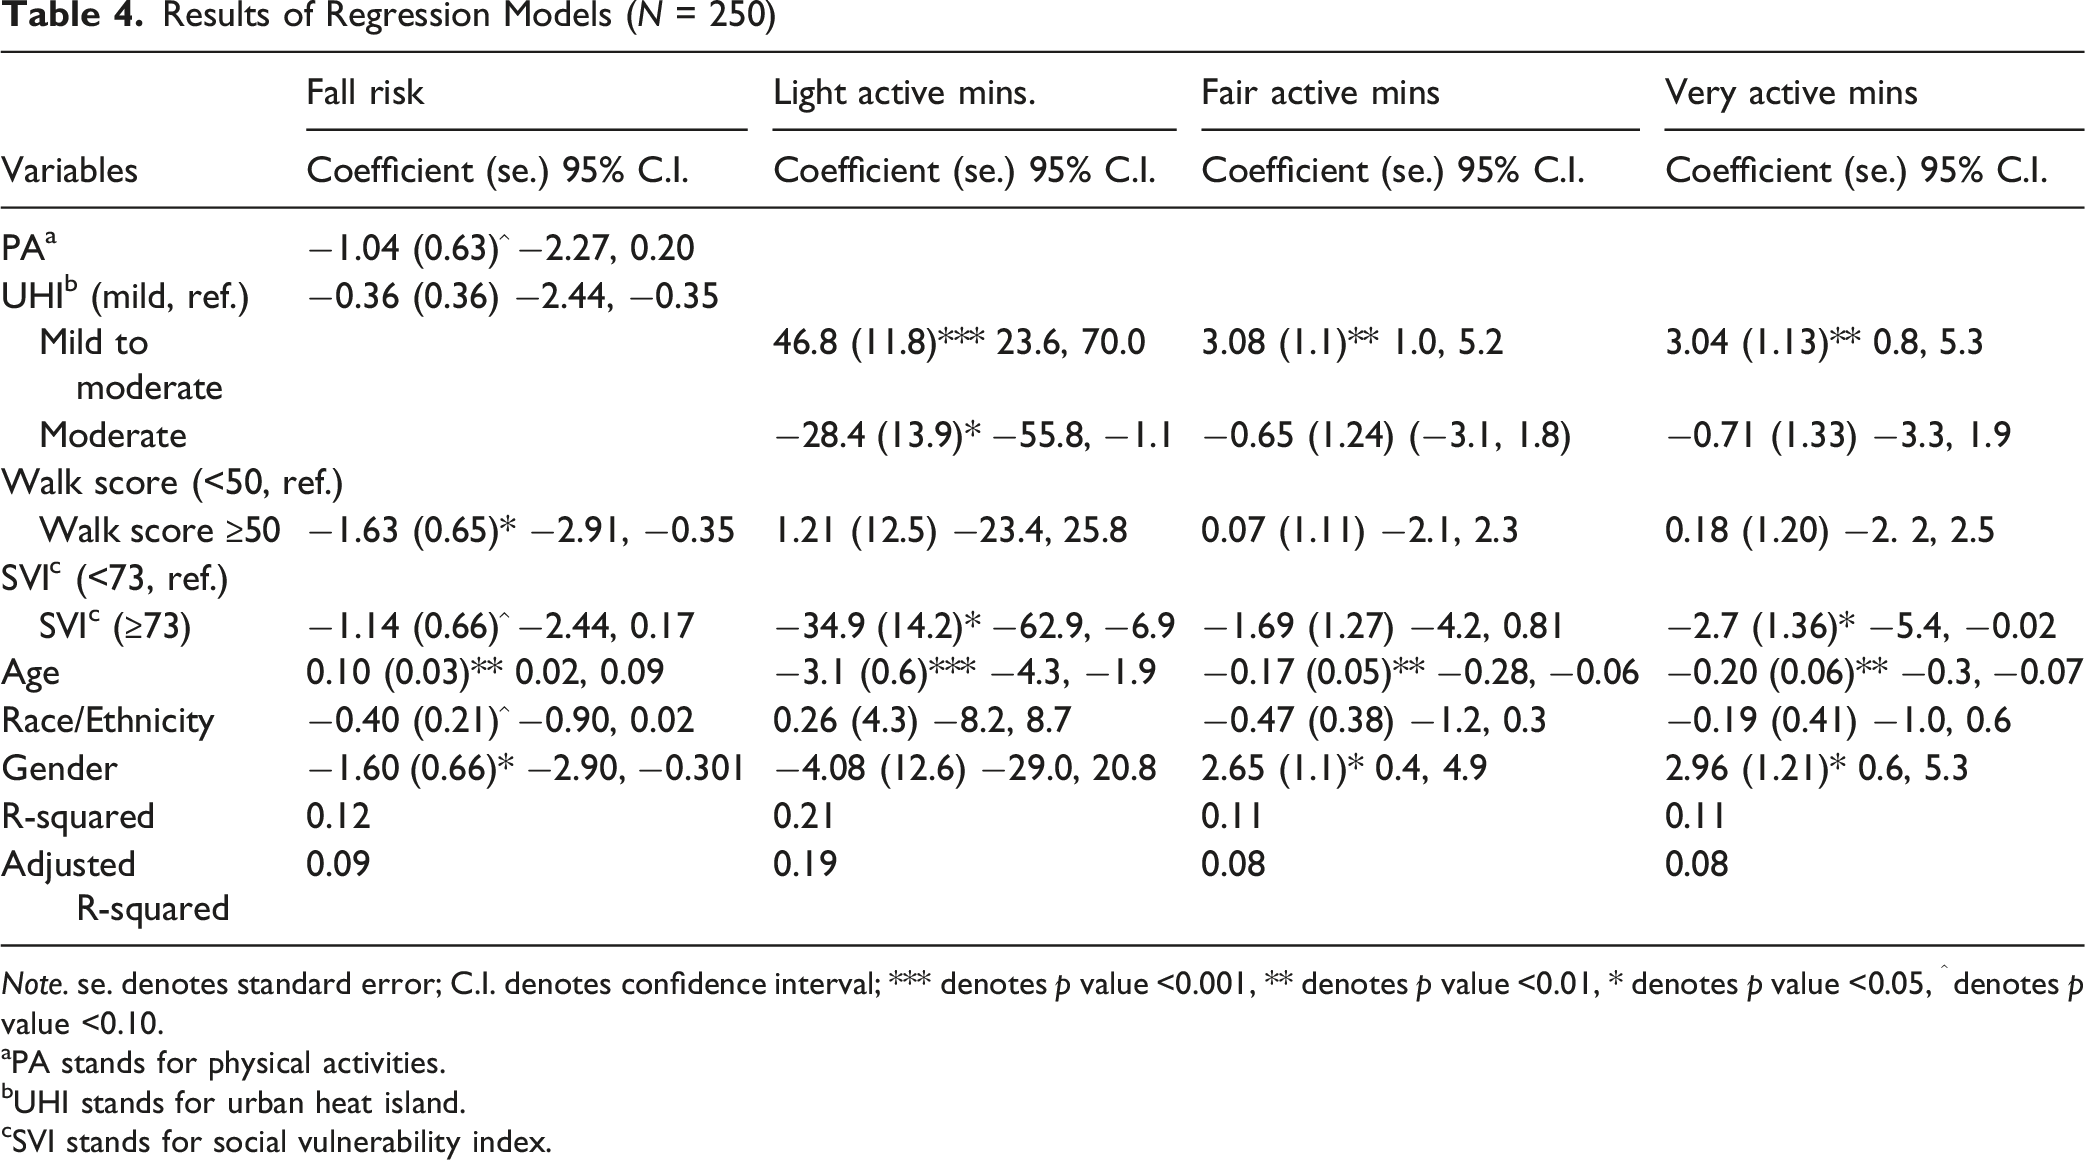
Note. se. denotes standard error; C.I. denotes confidence interval; *** denotes p value <0.001, ** denotes p value <0.01, * denotes p value <0.05, ^ denotes p value <0.10.
aPA stands for physical activities.
bUHI stands for urban heat island.
cSVI stands for social vulnerability index.
Regarding physical activity, UHI severity was a significant factor across all three models. Compared to low-income older adults living in areas with mild heat, those in moderate heat areas had significantly lower light active minutes (β = −28.4; p < 0.05). In contrast, participants residing in areas with mild to moderate heat were more likely to engage in higher levels of physical activity than those in mildly hot areas, as reflected by light (β = 46.8; p < 0.001), fair (β = 3.08; p < 0.01), and very active minutes (β = 3.04; p < 0.01). In addition, older adults living in more socially vulnerable areas had significantly lower levels of light (β = −34.9; p < 0.05) and very active minutes (β = −2.7; p < 0.05). Walkability was not significantly associated with physical activity in any of the three models. Among the control variables, age was significantly associated with physical activity, with older participants engaging in lower light (β = −3.1; p < 0.001), fair (β = −0.17; p < 0.01), and very active minutes (β = −0.20; p < 0.01). Gender was significantly associated with fair (β = 2.65; p < 0.05) and very active minutes (β = 2.96; p < 0.05). Race/ethnicity was not significantly associated with physical activity.
Discussion
This study contributes to the literature by highlighting key associations between fall risk, physical activity, community environmental factors, and aging. These findings underscore the complex, multidimensional nature of fall risk among older adults, echoing global guidance that emphasizes comprehensive risk assessment and the implementation of multidomain interventions (Montero-Odasso et al., 2022).
More specifically, our analysis supports that physically active older adults had a significantly lower fall risk than their inactive counterparts. This aligns with the physical activity recommendations of the National Institute on Aging (2022), the U.S. Centers for Disease Control and Prevention (2024b), and previous studies (Colón-Emeric et al., 2024; Tsai et al., 2024). However, in our study, the vast majority were physically inactive, which may have contributed to their elevated fall risk, emphasizing the urgent need to promote appropriately prescribed intensity and duration of physical activity within this demographic group.
Regarding the influence of community environmental factors, we did not observe an increased fall risk associated with the UHI effect, contrary to our expectations. Although direct evidence on the UHI effect is limited, a recent study found that older adults were highly sensitive to extreme heat, and that longer duration and greater intensity of heat exposure significantly increased fall-related mortality (Xie et al., 2025). An empirical study indicated that higher temperatures were significantly associated with elevated fall risks (Shen et al., 2025). The inconsistency between our results and the existing literature may be due to the limited variation in heat exposure, as none of our study sites were in areas with moderate-to-high or severe heat. In addition, aligning with the literature (Dunlap et al., 2025), our data show that older adults living in more walkable communities had a lower risk of falling.
Although this study reveals a complex effect of the UHI effect on physical activity, older adults living in more severely affected areas are generally engaged in less activity. This echoes a study showing that older adults, as the most vulnerable group to extreme heat, experienced increased sedentary time and decreased participation in physical activity as ambient temperatures rose (Cheong & Gaynanova, 2024). However, our analysis also revealed lower levels of physical activity during winter, contributing to the literature that, even in warm-climate areas like Orlando, older adults’ physical activity can be hindered by relatively low local temperatures (e.g., 65 °F to 70 °F). We hypothesize that both absolute ambient temperature and older adults’ perception of it influences their participation in physical activity.
Furthermore, community SVI was negatively associated with older adults’ physical activity, consistent with previous research on adults (Arena et al., 2024), although evidence specific to older adults remains limited. Contrary to prior studies, walkability, measured with walk scores, was not significantly related to older adults’ physical activity (Kwon & Akar, 2025). Walk scores primarily capture macro-level features like street connectivity and proximity to amenities, whereas older adults’ physical activity is often more influenced by micro-level factors such as sidewalk quality and the availability of seating facilities (Arias-Fernández et al., 2025; Cerin et al., 2017).
This study is not without limitations. First, variations in community environmental factors were relatively limited because data were collected from participants living near the 13 senior centers in Orlando. For example, all these centers are located within only three categories of UHI areas, which made it impossible to examine fall risk and physical activity among low-income older adults in areas with moderate-to-high and severe heat exposure. Second, micro-level environmental factors, such as age-friendly pedestrian infrastructure (e.g., sidewalk evenness and flatness) and indoor features (e.g., stairs and air conditioning), were not considered in this study, despite their potential contribution to older adults’ fall risk and physical activity levels. Third, although we collected longitudinal data on older adults’ physical activity, data limitations prevented us from accounting for seasonal or temperature-related variations in fall risk that were concurrent or following measured levels of activity. Another limitation is that community factors were assessed based on senior center locations rather than participants’ home addresses due to lack of data. Although these senior centers are generally close to low-income older adults’ homes, these measures may not fully reflect the environment in which participants actually live and are active. Additionally, the R-squared values in our models are low because only a limited set of factors related to the outcomes (fall risk and physical activity) were included, while many other potential confounders were not measured or accounted for.
The findings of this study have potential policy and practical implications. First, it is crucial to promote physical activity among older adults through intervention programs. These programs can combine health education on the importance of physical activity with structured exercises that strengthen muscles and improve balance to reduce fall risk (See et al., 2021). Second, considering the impact of community UHI on older adults’ well-being, it is urgent that policymakers and communities take proactive measures to mitigate these adverse effects. For example, efforts should include increasing green space and shade infrastructure in senior communities, improving access to and use of climate-controlled facilities, especially during hot weather, and implementing targeted interventions in areas with severe heat exposure.
In conclusion, this study demonstrates that physical activity is inversely associated with fall risk among low-income older adults, while community environmental factors shape both physical activity levels and vulnerability to falls. Future studies that cover larger study areas to capture more sufficient variation in community environments and incorporate micro-level environmental factors are needed. Nevertheless, this research offers valuable insights for policymakers to consider multidomain interventions that combine exercise promotion with environmental improvements to support healthy aging.
Footnotes
Ethical Considerations
The study protocol was approved by the institutional review board at the University of Central Florida (MOD00005745). Before data collection, all participants signed the informed consent.
Author Contributions
Yingru Li—conceptualization, investigation, formal analysis, writing-original draft preparation, writing-review and editing, and supervision; Evansha Andre—data curation, writing-original draft preparation, and writing-review and editing; Adeline Agnew—data curation, formal analysis, and writing-review and editing; Dahee Kim—data curation, investigation, and writing-review and editing; Rui Xie—investigation, writing-review and editing, and funding acquisition; Dapeng Li—investigation, and writing-review and editing; Boon Peng Ng—investigation, and writing-review and editing; Ladda Thiamwong—project administration, funding acquisition, supervision, and writing-review and editing.
Funding
The authors disclosed receipt of the following financial support for the research, authorship, and/or publication of this article: This work was supported by the National Institute on Minority Health and Health Disparities under Grant R01MD018025 and the Office of the Director, Chief Officer for Scientific Workforce Diversity, Office the National Institutes of Health under supplemental Grant number 3R01MD018025-02S1, and the UCF Department of Sociology Seed Grant.
Declaration of Conflicting Interests
The authors declared no potential conflicts of interest with respect to the research, authorship, and/or publication of this article.
Data Availability Statement
The data presented in this study are available on reasonable request.