






Abstract
Background
Frailty is dynamic and potentially reversible, but the prognostic significance of sustained frailty remission remains unclear.
Objective
To examine associations of sustained frailty remission with all-cause and cause-specific mortality.
Methods
We analyzed 4,580 SHARE participants aged 50 years or older. Frailty trajectories across Waves 1, 2, and 4 were classified as remain pre-frail/frail, remain robust, or sustained remission. Cox models estimated associations with all-cause, cardiovascular disease (CVD), and cancer mortality.
Results
During a median follow-up of 100 months, 831 deaths occurred. Compared with remain pre-frail/frail, sustained remission was associated with lower all-cause mortality (HR = 0.81, 95% CI = 0.66–0.99) and cancer mortality (HR = 0.61, 95% CI = 0.41–0.91), but not significantly with CVD mortality (HR = 0.73, 95% CI = 0.50–1.07). Remain robust showed the lowest all-cause mortality risk (HR = 0.52, 95% CI = 0.43–0.63).
• Provides longitudinal evidence that sustained frailty remission, assessed across three waves, is associated with lower all-cause and cancer mortality. • Distinguishes sustained remission from short-term fluctuation by requiring maintained improvement across consecutive transitions. • Shows a graded association in all-cause mortality across frailty trajectories, with the remain robust group having the lowest risk and the sustained remission group showing an intermediate risk profile.
• Supports the use of longitudinal frailty assessment to improve risk stratification in ageing populations. • Suggests that monitoring frailty transitions may help identify individuals at higher risk of adverse outcomes. • Provides evidence to inform clinical and public health strategies focusing on frailty dynamics rather than single-time-point assessment.What This Paper Adds
Applications of Study Findings
Introduction
Frailty is a condition characterized by diminished physiological reserve, leading to increased vulnerability to adverse health outcomes (Fried et al., 2001). A systematic review of 21 community-based cohorts involving approximately 61,500 adults aged 65 years or older from multiple countries and regions estimated that, on average, 10.7% of community-dwelling older persons were frail and 41.6% were pre-frail (Collard et al., 2012). Frailty is commonly assessed using two major conceptual approaches: the frailty index of cumulative deficits (Rockwood & Mitnitski, 2007, 2011) and the frailty phenotype (Fried et al., 2001), with the latter focusing on physical characteristics such as gait speed and grip strength.
The relationship between frailty and mortality is well-documented, with frail individuals exhibiting a significantly higher risk of death compared to their non-frail counterparts (Chang & Lin, 2015; Ekram et al., 2021; Kojima et al., 2018; Peng et al., 2022; Shamliyan et al., 2013; Vermeiren et al., 2016). This risk is particularly elevated for cardiovascular diseases (CVD) and cancer-related mortality (Peng et al., 2022). Studies from diverse populations, such as in Japan (Matsuo et al., 2023) and China (Fan et al., 2020), have shown that frailty status is strongly associated with both all-cause mortality and cause-specific mortality. Recent large-scale cohort studies, such as those using UK Biobank data (Hanlon et al., 2018), have shown that even in middle-aged populations, frailty is independently associated with mortality, after adjusting for multimorbidity, sociodemographics, and lifestyle factors. Notably, pre-frail individuals also face an increased mortality risk, emphasizing the need to address frailty at earlier stages of its development (Shi et al., 2021).
Frailty is not a static condition but rather a dynamic process. Individuals may transition from a robust state to a frail state or experience fluctuations between different frailty states over time (Gill et al., 2006). Nearly all prior studies demonstrated that transitions to greater frailty (i.e., “deterioration”) were more common than transitions to lesser frailty (i.e., “remission”) (Bentur et al., 2016; Espinoza et al., 2012; Lee et al., 2014). Although frailty has traditionally been viewed as a progressive decline, there is growing evidence that frailty can be reversed (Lang et al., 2009). Interventions, such as exercise or physical reconditioning (Churchward-Venne et al., 2015), have shown promise in improving frailty status. However, there is limited research on whether improvements in frailty, particularly sustained remission, are associated with better health outcomes, particularly lower mortality risk. While some studies (Kojima et al., 2019) have explored changes in frailty status over time, more research is needed to understand how sustained improvements in frailty relate to mortality outcomes. This is particularly important given that frailty may be linked to mortality through multiple pathways (Clegg et al., 2013), including CVD and cancer.
This study aims to explore how changes in frailty phenotype over time, particularly sustained remission of frailty, are associated with mortality risk, with a focus on CVD- and cancer-related deaths. By examining frailty as a dynamic process, we seek to provide insights into how frailty transitions, especially sustained remission, relate to mortality outcomes in older adults. These findings may contribute to a better understanding of frailty dynamics and may help inform future clinical and public health research on ageing populations.
Methods
Study Population
This study was designed as a prospective longitudinal cohort analysis using data from the Survey of Health, Ageing and Retirement in Europe (SHARE), a multicountry interdisciplinary panel study that examines health, socioeconomic circumstances, and social and family networks among ageing populations in Europe (Börsch-Supan et al., 2013). SHARE collects data at approximately two-year intervals through face-to-face interviews and standardized assessments. Since Wave 1 in 2004, SHARE has enrolled 158,764 participants overall. For the present study, we restricted the sample to participants aged 50 years or older, yielding an initial study population of 157,502 individuals.
To examine longitudinal frailty trajectories, we used repeated frailty measurements from Waves 1, 2, and 4, with Wave 4 serving as the baseline for subsequent mortality follow-up. Wave 3 was not used because it primarily focused on retrospective life-history information and did not provide the core indicators required for consistent frailty phenotype classification. As shown in Figure 1, participants were then sequentially screened according to frailty data completeness, frailty transition pattern, and mortality follow-up availability. Ultimately, 4,580 participants met the inclusion criteria for the present analysis (Table S1). Flowchart of participant selection. SHARE included 158,764 participants overall. For the present study, the sample was first restricted to participants aged 50 years or older (n = 157,502). Participants were then sequentially screened based on complete frailty data across Waves 1, 2, and 4, prespecified frailty transition patterns, and mortality follow-up availability, resulting in a final analytic sample of 4,580 participants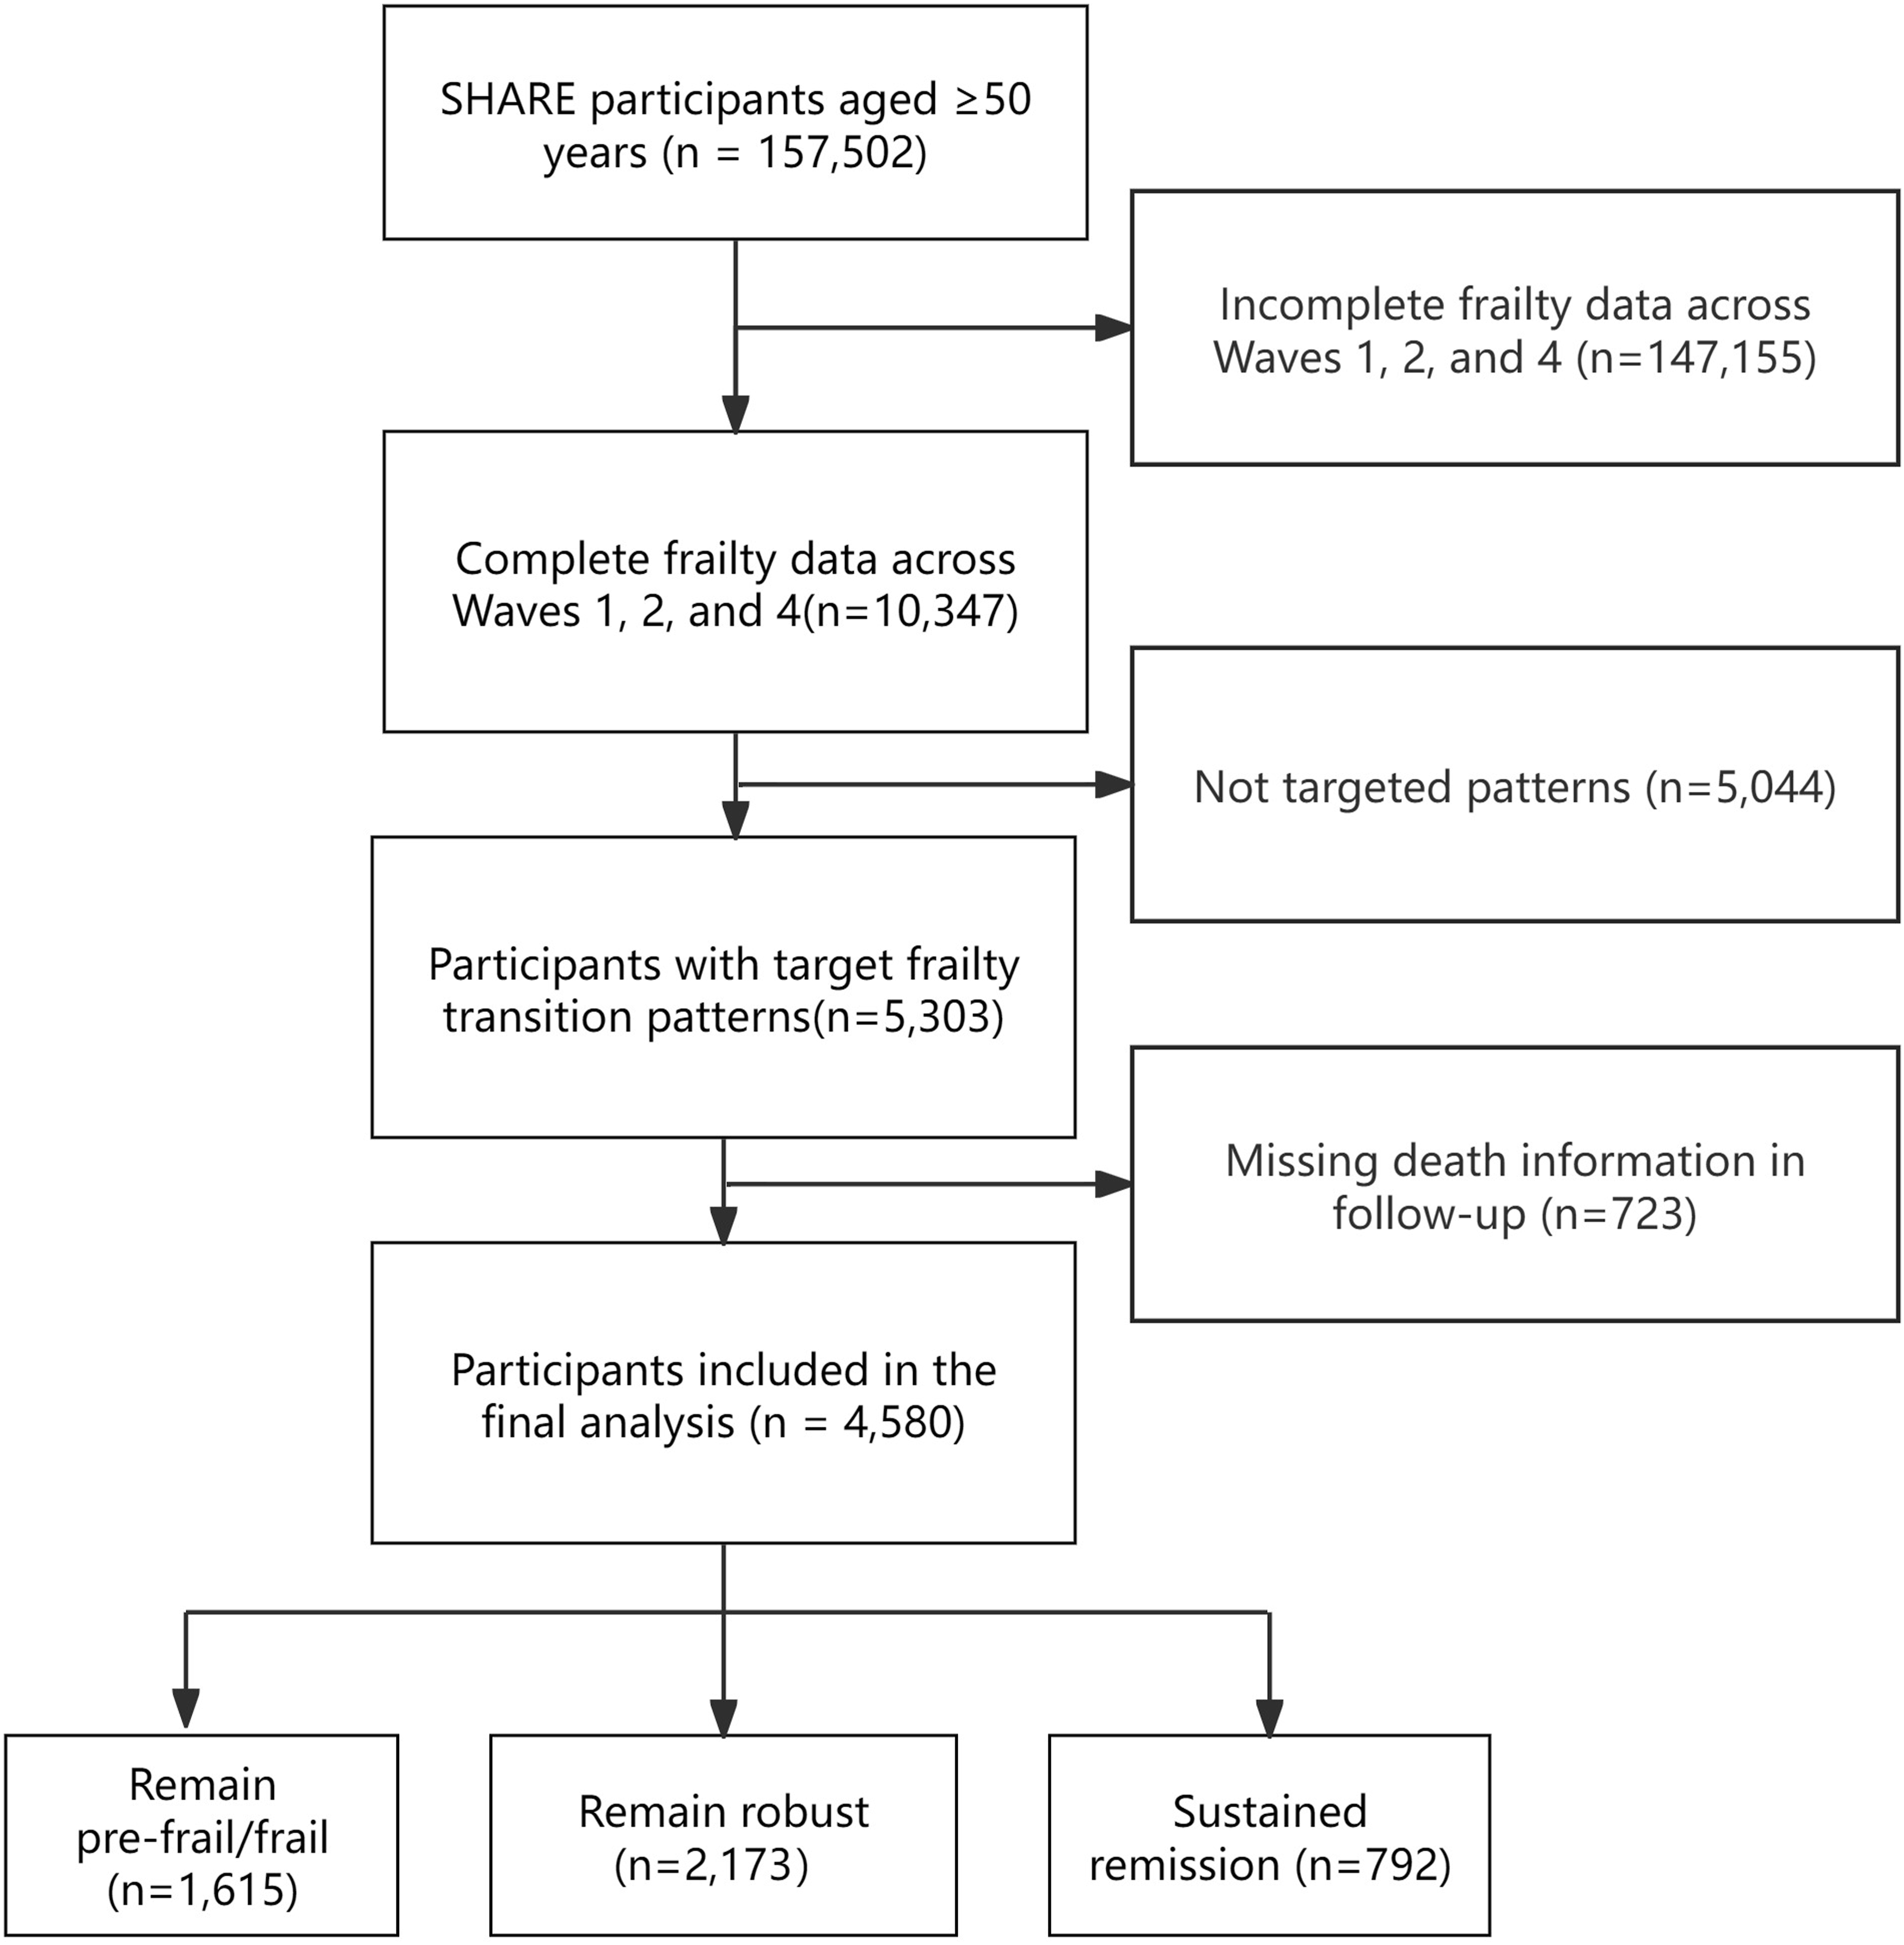
This study was a secondary analysis of de-identified data from the Survey of Health, Ageing and Retirement in Europe (SHARE). SHARE Waves 1–4 were reviewed and approved by the Ethics Committee of the University of Mannheim, while Wave 4 and the continuation of the project were reviewed and approved by the Ethics Council of the Max Planck Society. Country-specific implementations were additionally reviewed and approved by the relevant ethics committees or institutional review boards where required. The present study involved no direct contact with participants and used only de-identified data.
Frailty Transition
Frailty status was assessed at Waves 1, 2, and 4 using the Fried frailty phenotype, operationalized in SHARE based on five domains: exhaustion, low physical activity, shrinking, weakness, and slowness (Fried et al., 2001; Theou et al., 2015). Briefly, exhaustion was defined as self-reported low energy during the past month; low physical activity was defined as engaging in low- or moderate-energy activities only one to three times per month or hardly ever/never; shrinking was defined on the basis of reduced appetite or eating less than usual; weakness was defined as grip strength at or below the sex- and BMI-specific 20th percentile; and slowness was defined as reported difficulty walking 100 meters or needing to stop when climbing one flight of stairs because of health problems. Detailed operational definitions are provided in Table S2. Participants meeting 0 criteria were classified as robust, those meeting 1–2 criteria as pre-frail, and those meeting ≥3 criteria as frail (Bandeen-Roche et al., 2015).
Based on previous studies (Davies et al., 2023; Jin et al., 2026; Wang et al., 2024), the primary analysis focused on three prespecified longitudinal frailty trajectories across Waves 1, 2, and 4: (1) remain pre-frail/frail, defined as persistent pre-frail or frail status across all three waves; (2) remain robust, defined as robust status across all three waves; and (3) sustained remission, defined as improvement by at least one frailty category from Wave 1 to Wave 2, followed by maintenance of the improved status or further improvement at Wave 4. In robustness analyses, we extended the primary three-group frailty classification to a six-group trajectory framework across Waves 1, 2, and 4. In addition to the three primary trajectories (remain pre-frail/frail, remain robust, and sustained remission), three additional transition patterns were included: (1) deterioration after frailty improvement, defined as improvement from Wave 1 to Wave 2 followed by deterioration at Wave 4; (2) frailty improvement after deterioration, defined as worsening from Wave 1 to Wave 2 followed by improvement at Wave 4; and (3) sustained deterioration, defined as worsening from Wave 1 to Wave 2 followed by persistent or further deterioration at Wave 4. This extended classification was used to examine whether the main pattern of associations remained stable under a broader characterization of frailty trajectories.
Mortality Outcomes
The primary outcome of this study was all-cause mortality, and the secondary outcomes were cause-specific mortality due to cardiovascular disease (CVD) and cancer. Mortality information was obtained from the SHARE end-of-life module, which is administered when a participant dies between survey waves and collects proxy-reported information from relatives, friends, or other knowledgeable informants regarding the timing and circumstances of death. This module provides information on the year and month of death and includes cause-of-death data, allowing deaths to be classified as cancer, CVD, or other causes (Börsch-Supan et al., 2013).
For the present analyses, Wave 4 was defined as baseline. Follow-up time was calculated prospectively from the date of the Wave 4 interview until death or censoring. For participants who died during follow-up, survival time was calculated from the Wave 4 interview date to the recorded year and month of death from the end-of-life module. For participants who remained alive, survival time was calculated from the Wave 4 interview date to the last available follow-up contact or the end of follow-up, whichever came first. All survival times were calculated in months.
Covariates
Based on previous literature, potential confounders were grouped into sociodemographic, health behavior-related, and baseline health status covariates. Sociodemographic covariates included age (continuous, in years), sex (male or female), residential area (urban or rural), living arrangement (with spouse/partner vs alone), educational attainment (less than upper secondary, primary, lower secondary, upper secondary/vocational, and tertiary education), country of residence (Austria, Germany, Sweden, the Netherlands, Spain, Italy, France, Denmark, Switzerland, and Belgium), and household income quartile (Q1 lowest to Q4 highest). Health behavior-related covariates included smoking status (ever vs never), drinking status (ever vs never), and body mass index (BMI), calculated as weight in kilograms divided by height in meters squared (kg/m2). Baseline health status was additionally captured by multimorbidity, defined as the number of physician-diagnosed chronic conditions. Fourteen chronic conditions were considered, including hypertension, diabetes, hypercholesterolemia, cancer, heart disease, stroke, respiratory disease, arthritis, osteoporosis, affective disorders, dementia, Parkinson’s disease, peptic ulcer disease, and cataracts. Participants were categorized into three groups according to disease burden (0–1, 2, and ≥3 chronic conditions).
Statistical Analysis
Statistical analyses were conducted in several steps. First, descriptive statistics were used to summarize baseline characteristics. Continuous variables were presented as mean ± standard deviation (SD), and categorical variables as frequencies and percentages. Differences across frailty trajectory groups were assessed using one-way analysis of variance (ANOVA) for continuous variables and chi-square tests for categorical variables.
To examine the association between frailty trajectories and mortality, Nelson–Aalen cumulative hazard curves were constructed for visual comparison, and overall group differences were assessed using log-rank tests. Pairwise comparisons were further conducted with Bonferroni correction. Cox proportional hazards regression models were then fitted to estimate hazard ratios (HRs) and 95% confidence intervals (CIs) for all-cause mortality, cardiovascular disease (CVD) mortality, and cancer mortality, with Wave 4 defined as the baseline for survival analyses. The proportional hazards assumption was evaluated using Schoenfeld residual tests.
We fitted sequentially adjusted models. Model 1 was unadjusted. Model 2 adjusted for sociodemographic covariates, including age, sex, residential area, living arrangement, educational attainment, country of residence, and household income. Model 3 further adjusted for smoking, drinking, body mass index (BMI), and baseline chronic disease burden.
Missing values in Wave 4 covariates were handled using multiple imputation by chained equations with the mice package in R. Twenty imputed datasets were generated, with 10 iterations per chain, and estimates were combined using Rubin’s rules. In addition, subgroup analyses by sex and age (50–64 years and ≥65 years) group were performed, and formal interaction tests were conducted to assess potential effect modification.
Additional analyses were conducted to assess the robustness of the primary findings under a broader frailty trajectory framework and to evaluate potential selection bias. First, we performed robustness analyses by extending the primary three-group frailty classification to include additional transition patterns across waves, in order to assess whether the main associations remained stable under a broader trajectory framework. Second, to evaluate potential selection bias, we conducted a non-response analysis comparing participants included in the final analytic sample with those excluded from the main analysis.
Results
Baseline Characteristics
Baseline characteristics of study population by frailty transition patterns (N = 4580)
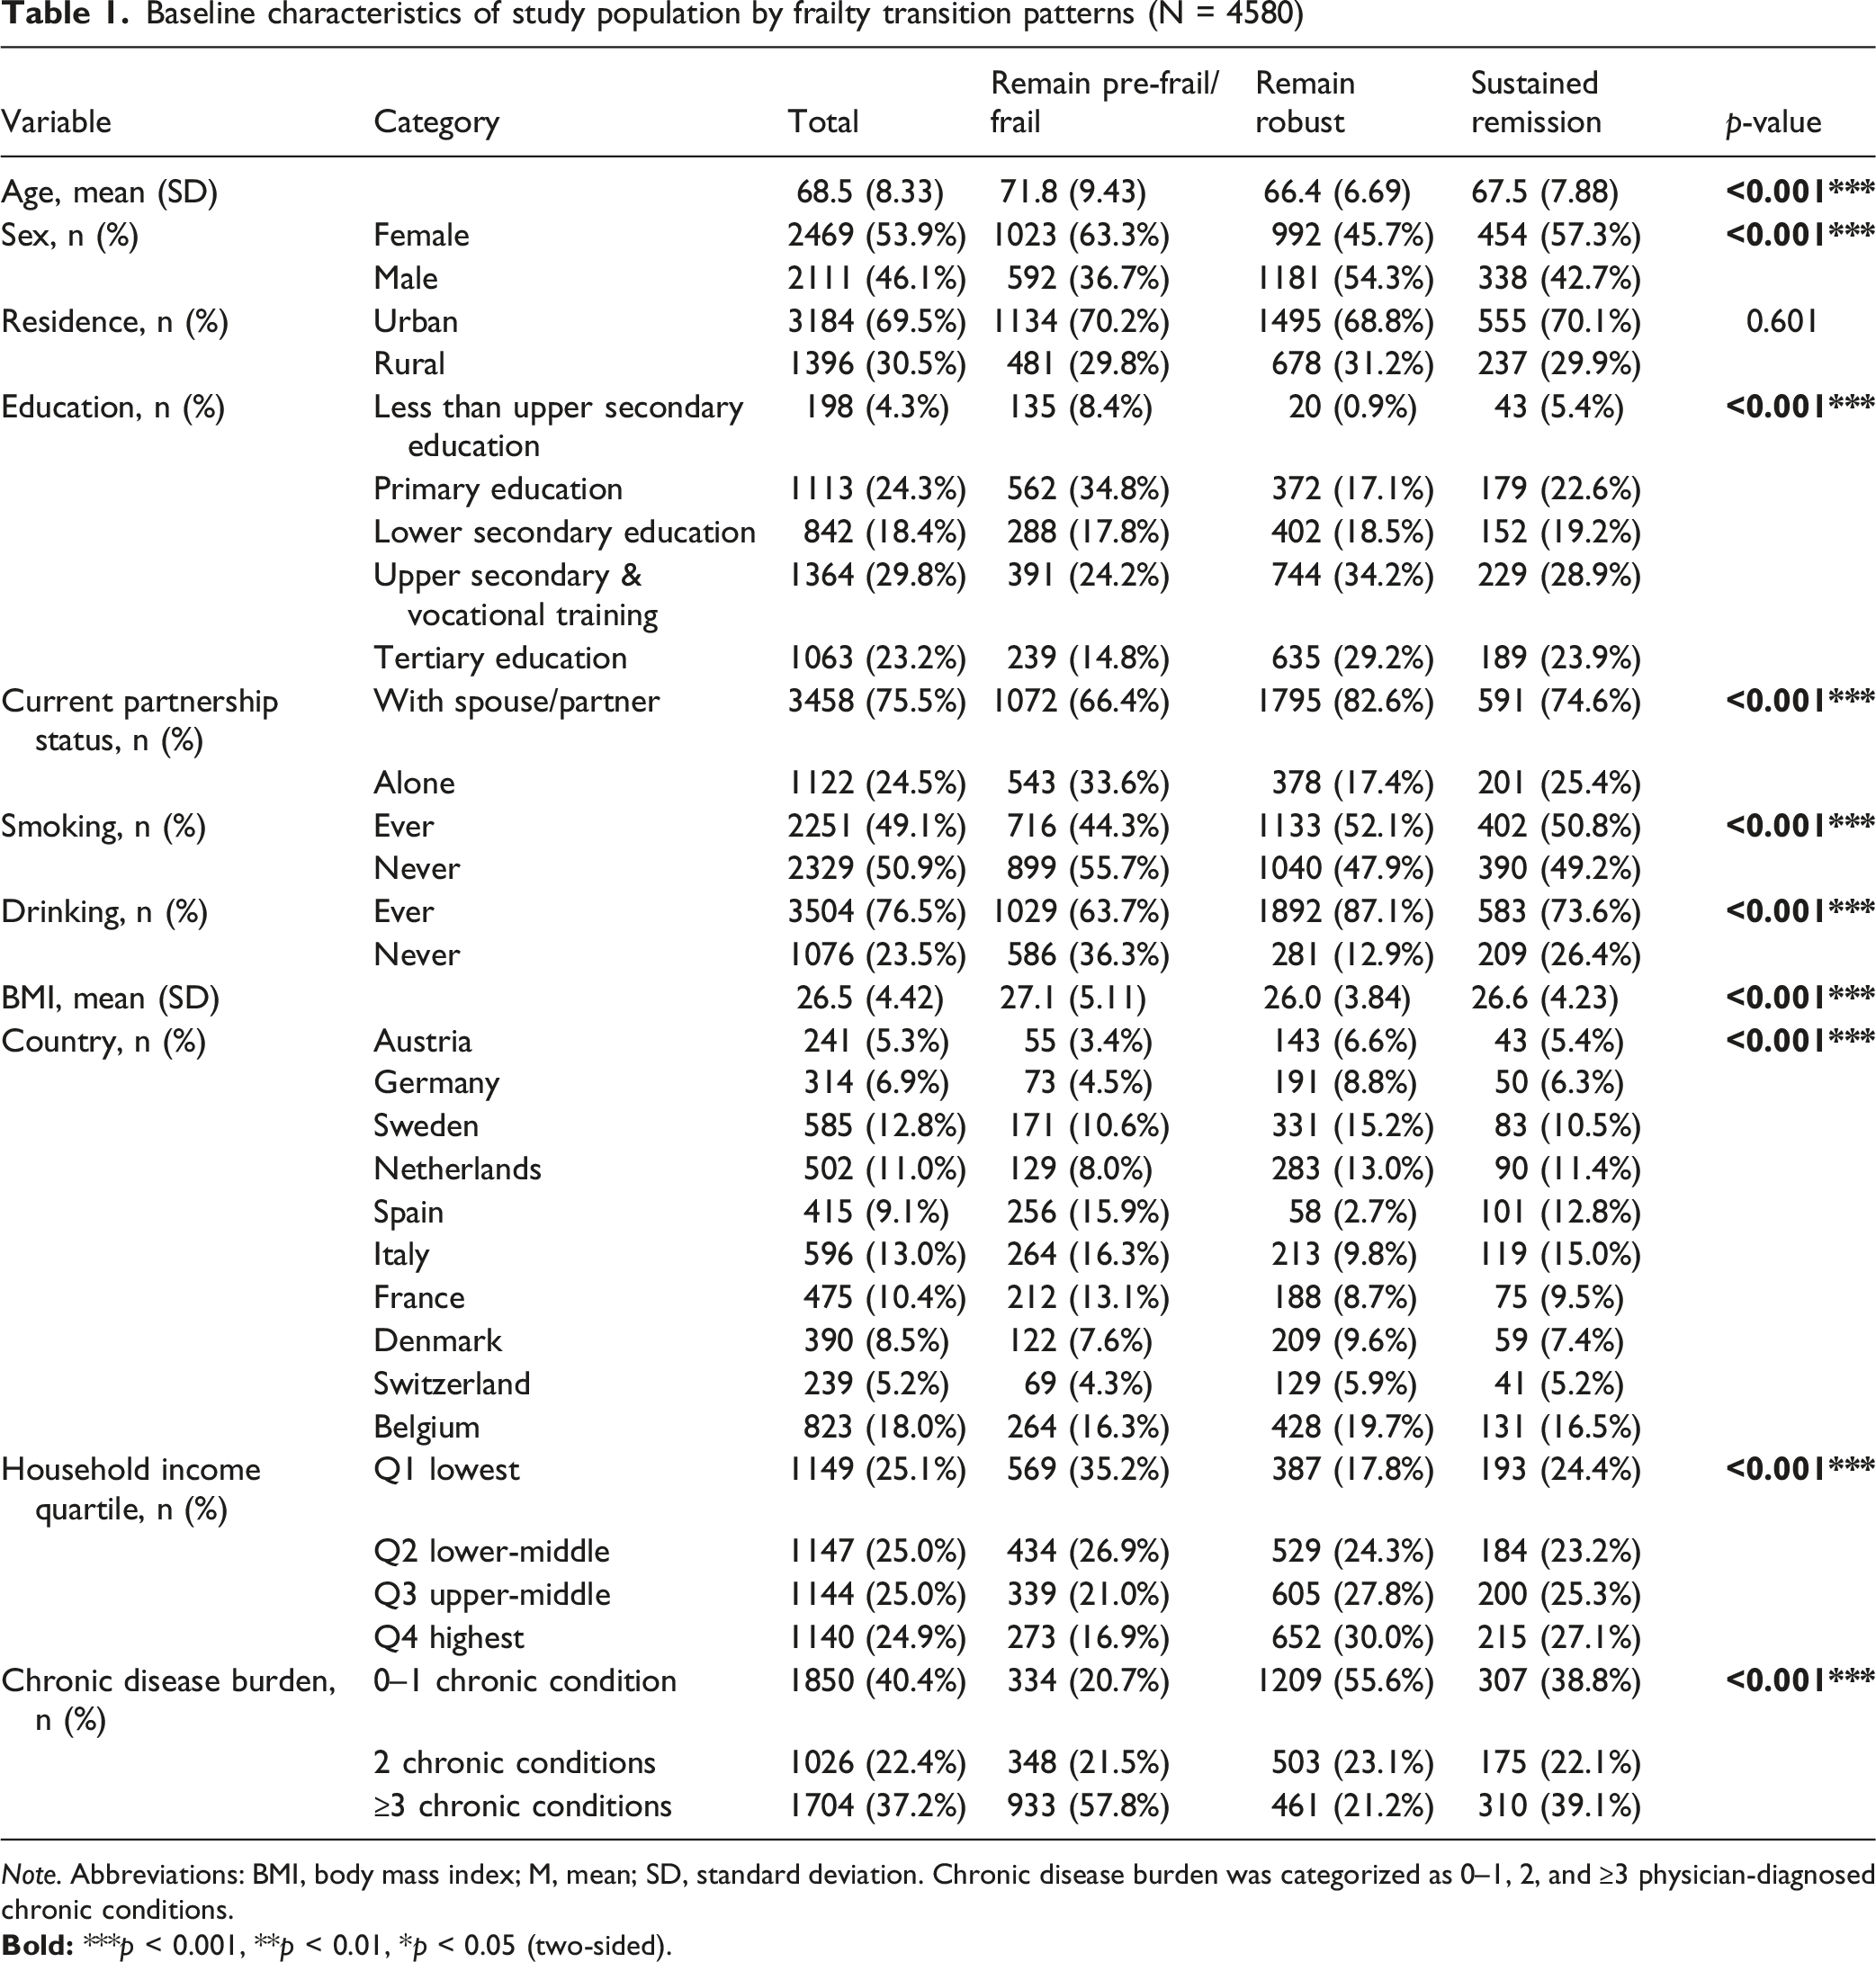
Note. Abbreviations: BMI, body mass index; M, mean; SD, standard deviation. Chronic disease burden was categorized as 0–1, 2, and ≥3 physician-diagnosed chronic conditions.
Baseline characteristics differed significantly across the three frailty trajectory groups (all P < 0.001, except residential area). Participants in the remain pre-frail/frail group were older and more likely to be female, live alone, have lower educational attainment and household income, and have a higher chronic disease burden. They were also more likely to report smoking and drinking histories. Compared with the remain pre-frail/frail group, participants in the remain robust group differed across multiple sociodemographic and health-related characteristics. The sustained remission group generally showed an intermediate pattern between the other two groups across several baseline characteristics, although this pattern was not consistent for every variable.
Frailty Trajectories and All-Cause Mortality
During a median follow-up of 100 months (maximum 138 months), 831 deaths occurred among the 4,580 participants. Nelson–Aalen cumulative hazard curves (Figure 2) showed clear separation across the three frailty trajectory groups, and the overall log-rank test indicated significant differences in mortality risk (P < 0.001). Bonferroni-adjusted pairwise comparisons confirmed significant differences between all groups (Table S3). Nelson–Aalen cumulative hazard estimates of mortality risk by frailty transition patterns. Figure 2 presents Nelson–Aalen cumulative hazard curves demonstrating death incidence among three distinct frailty transition patterns (Remain pre-frail/frail, remain robust, sustained frailty remission) across Waves 1, 2, and 4. The log-rank test revealed statistically significant between-group differences (p < 0.001)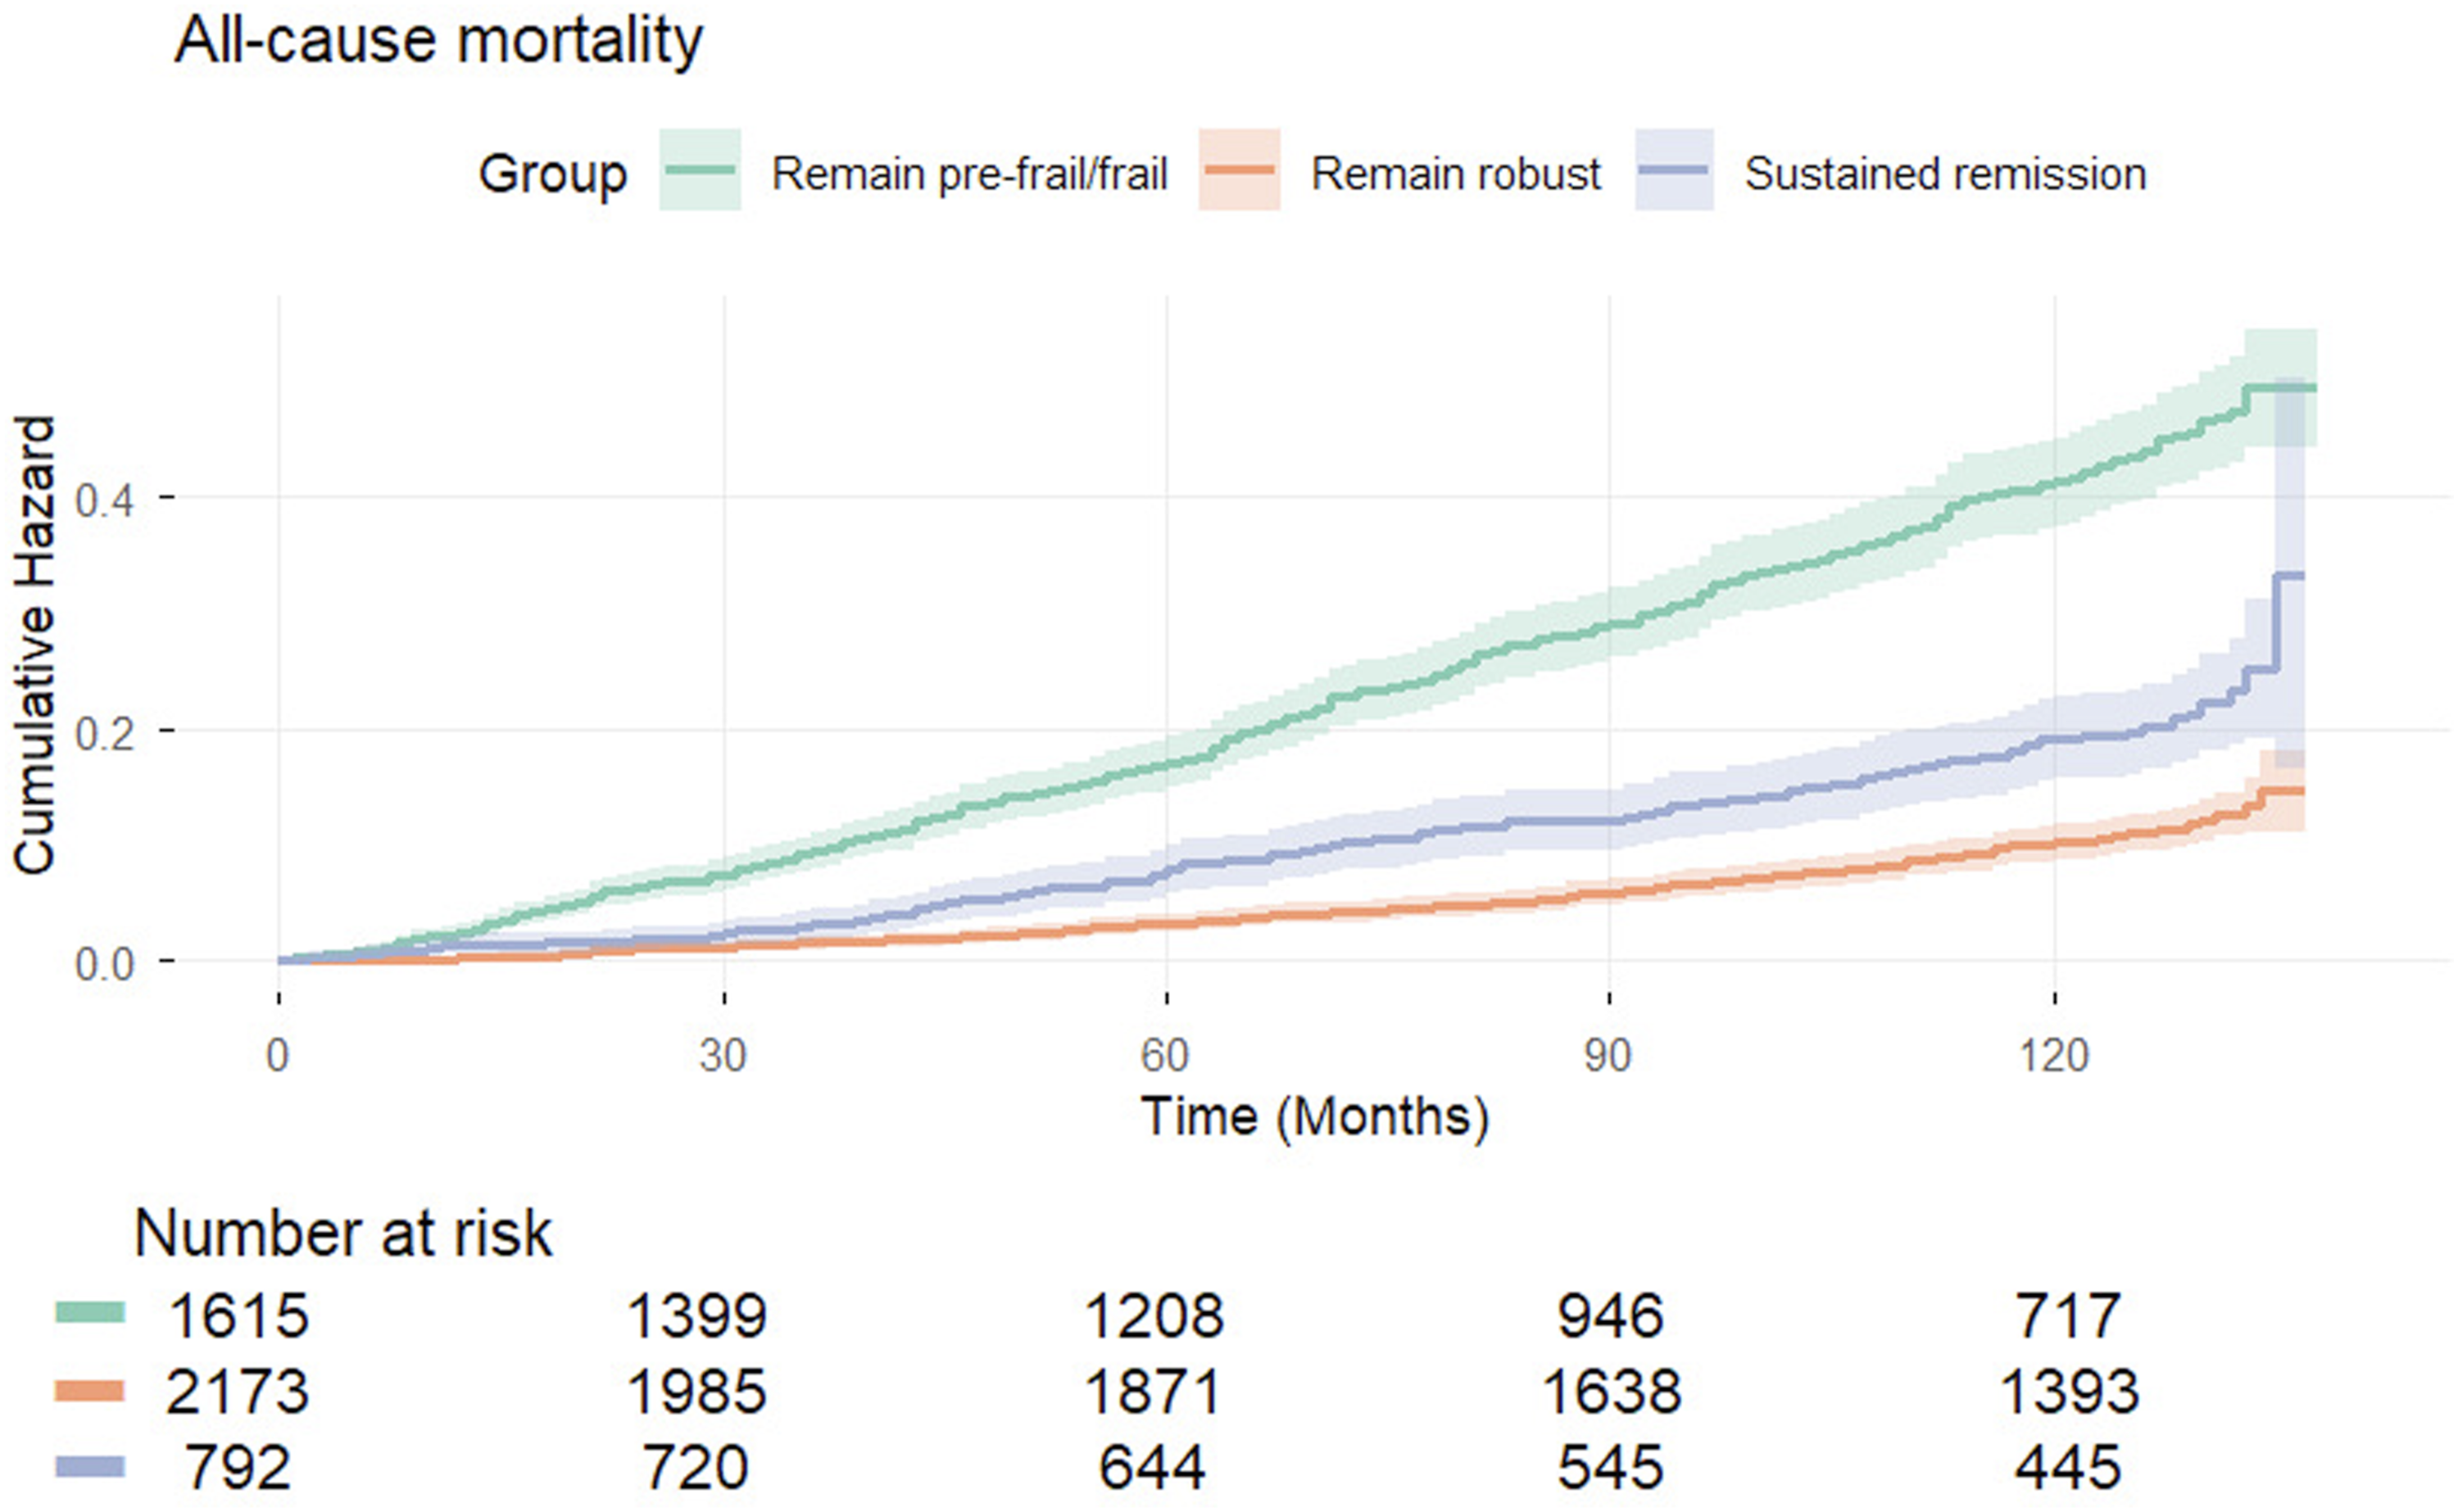
Hazard ratios (HRs) with 95% confidence intervals (CIs) for all-cause mortality by frailty transition patterns (N = 4,580; events = 831)
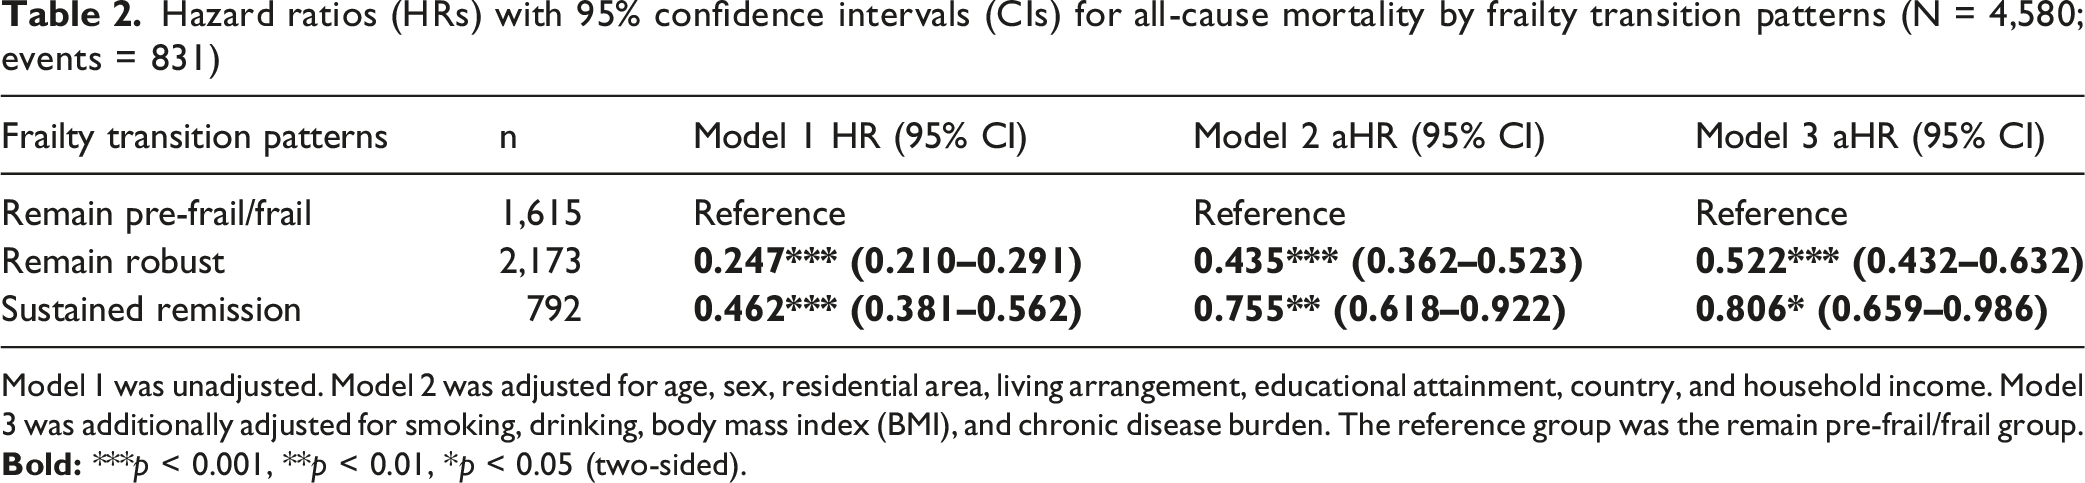
Model 1 was unadjusted. Model 2 was adjusted for age, sex, residential area, living arrangement, educational attainment, country, and household income. Model 3 was additionally adjusted for smoking, drinking, body mass index (BMI), and chronic disease burden. The reference group was the remain pre-frail/frail group.
Frailty Trajectories and Cause-specific Mortality
Hazard ratios (HRs) with 95% confidence intervals (CIs) for cause-specific mortality by frailty transition patterns
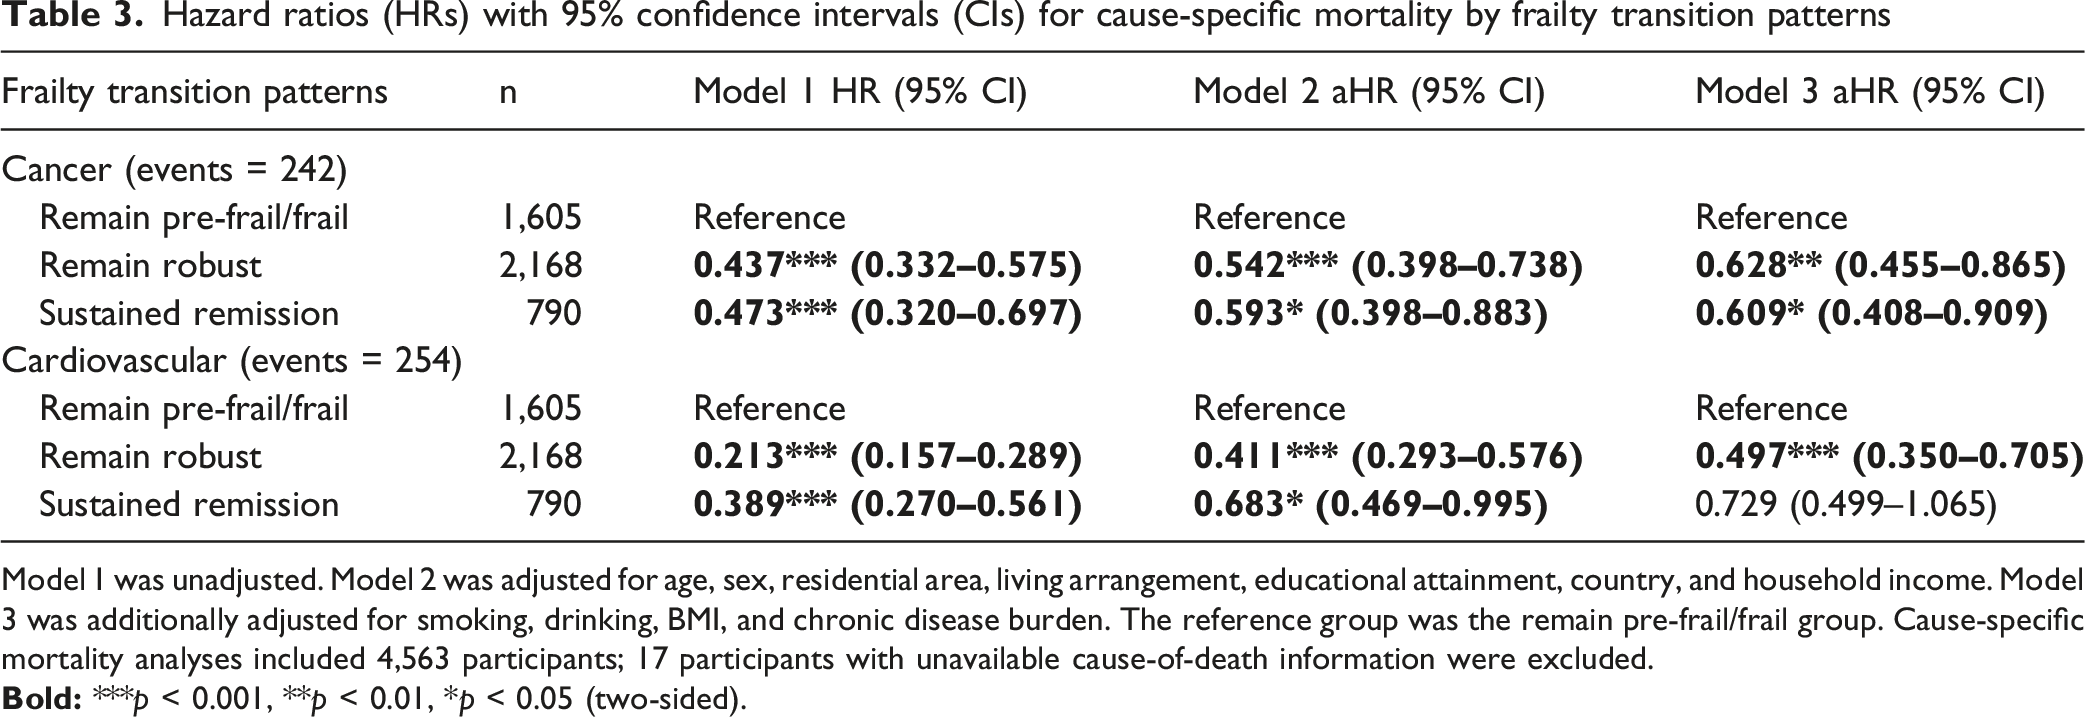
Model 1 was unadjusted. Model 2 was adjusted for age, sex, residential area, living arrangement, educational attainment, country, and household income. Model 3 was additionally adjusted for smoking, drinking, BMI, and chronic disease burden. The reference group was the remain pre-frail/frail group. Cause-specific mortality analyses included 4,563 participants; 17 participants with unavailable cause-of-death information were excluded.
For the cardiovascular disease (CVD) mortality, in the fully adjusted model, remain robust was associated with a significantly lower CVD mortality risk than remain pre-frail/frail (HR = 0.497, 95% CI: 0.350–0.705). Sustained remission showed a lower point estimate, although the confidence interval included the null (HR = 0.729, 95% CI: 0.499–1.065) (Table 3).
Supplementary Analyses
Subgroup-specific estimates are presented in Table S5. Formal interaction tests did not indicate significant effect modification by sex or age (Table S6).
In a robustness analysis using an extended six-group frailty trajectory classification, the main pattern of association remained broadly unchanged (Table S7). In the fully adjusted Cox model, participants who remained robust continued to show the lowest mortality risk compared with the remain pre-frail/frail group, whereas those with sustained remission also retained a lower mortality risk. By contrast, the additional non-primary trajectories showed less favorable risk profiles and were generally closer to the remain pre-frail/frail group. Overall, these findings indicate that the graded association observed in the primary analysis was robust to a broader characterization of frailty trajectories.
A non-response analysis comparing included participants with those excluded from the main analysis revealed differences in several baseline characteristics, including age, country, educational attainment, health behaviors, and chronic disease burden (Table S8).
Discussion
Using three waves of data from the SHARE study, we found that both sustained frailty remission and remaining robust were associated with reduced mortality risk. Notably, individuals who remained robust exhibited the lowest risk, while those with sustained remission showed an intermediate reduction in risk. Similar patterns were observed for cancer mortality, whereas the association with cardiovascular mortality did not remain statistically significant after full adjustment.
This study provides longitudinal evidence on the association between sustained frailty remission and mortality. A Taiwanese study (Hwang et al., 2023) simultaneously tracked changes in both the frailty phenotype and the frailty index, and reported that frailty remission was associated with lower risk of certain cause-specific deaths, such as organ failure. However, that study was based on only two waves of data, which limited its ability to distinguish sustained improvement from short-term fluctuation. In contrast, our study incorporated three waves of phenotype-based assessment and applied a stricter definition of sustained remission, requiring improvement followed by maintenance of the improved state. This design allowed us to better capture more stable frailty recovery over time, rather than temporary fluctuation in frailty status, and thereby adds longitudinal evidence on the prognostic relevance of sustained frailty remission.
Several mechanisms may underlie the observed associations. Frailty remission may reflect partial restoration of physiological reserve, including improvements in inflammatory regulation, muscle strength, and overall functional capacity. Chronic inflammation and immune dysregulation are important features of frailty and have been linked to adverse outcomes such as infection, cardiovascular events, and cancer progression (Liu et al., 2023; Pandey et al., 2019; Soysal et al., 2016). Improvements in these domains may therefore contribute to lower mortality risk. In addition, remission of frailty may be accompanied by better mobility and activity capacity, which could promote greater physical and social engagement (Holt-Lunstad et al., 2010; Izquierdo et al., 2021). At the same time, the remain robust group consistently showed the lowest mortality risk, suggesting that maintaining physiological resilience over time may confer greater survival advantages than recovery after decline. Even when frailty is reversed, individuals may not fully return to the physiological state of those who remain robust throughout, as prior frailty may have already resulted in cumulative depletion or damage. This may help explain why the sustained remission group showed an intermediate risk profile rather than reaching the level of those who remained robust. Taken together, these findings underscore the importance of not only promoting frailty remission, but also maintaining robustness and preventing frailty from developing in the first place.
Additional analyses further supported the stability of the main findings. Formal interaction tests did not provide evidence that the association between frailty trajectories and mortality differed by sex or age group, including between participants aged 50–64 years and those aged 65 years or older. Although the frailty phenotype was originally developed in older adults, recent evidence suggests that frailty can also be meaningfully examined in adults younger than 65 years, with early-life and late-life frailty sharing broadly comparable risk-factor profiles despite some differences in clinical characteristics (Bai et al., 2023; Hanlon et al., 2018). These findings support the use of the SHARE age framework in the present study, while also indicating that the interpretation of frailty measures across age groups should remain cautious. Moreover, when we expanded the primary three-group framework to include additional deterioration-related trajectories, the overall gradient in risk remained largely unchanged: participants who remained robust continued to show the lowest mortality risk, whereas deterioration-related trajectories were generally closer to the remain pre-frail/frail group. This suggests that the main findings were not simply an artifact of how the primary trajectory groups were defined, but instead reflected a more general pattern across a broader range of frailty transitions.
Frailty can be assessed using several tools (Dent et al., 2026), among which Fried’s frailty phenotype and the frailty index (FI) of cumulative deficits (FI-CD) are the two most widely used approaches. The FI-CD reflects the accumulation of multidimensional health deficits across physiological systems (Mitnitski & Rockwood, 2015; Rockwood & Mitnitski, 2011) and is sensitive to small changes over time (Dent et al., 2026), but it depends heavily on the selection and availability of variables and may be less specific to the physical manifestations of frailty (Searle et al., 2008; Theou et al., 2023). In contrast, Fried’s frailty phenotype conceptualizes frailty as a clinical syndrome defined by key physical domains and is more directly linked to functional reserve and observable functional decline (Fried et al., 2001). In the context of the present study, where the primary aim was to characterize longitudinal frailty trajectories, particularly sustained remission, the phenotype-based approach offers a practical advantage. By categorically distinguishing robustness from frailty using clinically recognizable functional components, it is readily applicable to clinical practice and can help identify individuals who may benefit from adapted care or targeted interventions (Cesari et al., 2014; Fried et al., 2001). Moreover, by requiring consistency across repeated waves, it allows for a clearer distinction between stable improvement and short-term fluctuation. This makes it particularly suitable for examining the prognostic relevance of frailty remission over time.
This study has several strengths. First, the longitudinal design enabled us to identify longitudinal transition patterns rather than relying on a single baseline measure, and allowed us to distinguish sustained remission from short-term fluctuation. Second, mortality was ascertained through the SHARE end-of-life module, which provided month- and year-level death information as well as cause-of-death data, allowing us to examine both all-cause and cause-specific mortality. Third, the consistency of the main pattern in the extended trajectory analysis supported the robustness of our primary findings.
Several limitations should also be acknowledged. First, as with all observational studies, residual confounding cannot be completely excluded, even after adjustment for sociodemographic characteristics, health behaviors, country, income, and baseline chronic disease burden. Although the associations between frailty trajectories and mortality remained generally consistent after adjustment for chronic disease burden, unmeasured factors such as nutritional status, disease severity, and other health indicators may still have influenced the observed associations. Second, cause-specific mortality analyses were based on fewer events than the all-cause mortality analysis, which may have reduced statistical power, especially for cardiovascular mortality. Third, the non-response analysis showed that included and excluded participants differed in several baseline characteristics, suggesting the possibility of selection bias and limiting the generalizability of the findings. Finally, although SHARE is a major strength because of its multicountry design, heterogeneity in healthcare systems, social conditions, and population structure may still have influenced the results despite adjustment for country. Therefore, the findings should be interpreted cautiously and validated in other settings.
Conclusion
In conclusion, frailty trajectories were strongly associated with mortality risk in older adults. Both remaining robust and achieving sustained remission were associated with lower all-cause mortality, with the remain robust group showing the most favorable risk profile. Similar patterns were observed for cancer mortality, whereas the evidence for cardiovascular mortality was less consistent. These findings highlight the value of considering frailty as a dynamic process and suggest that sustained changes in frailty status may provide important prognostic information in ageing populations.
Supplemental Material
Supplemental Material - Association Between Sustained Frailty Remission and All-Cause and Cause-Specific Mortality: A Prospective Cohort Study
Supplemental Material for Association Between Sustained Frailty Remission and All-Cause and Cause-Specific Mortality: A Prospective Cohort Study by Yonghao Xiao, Ziwang Zhou, Min Jin, Congdi Wang, Xiaoyu Qian, and Feifei Jia in Journal of Applied Gerontology
Footnotes
Acknowledgments
The authors thank the participants and the original data collectors, depositors, copyright holders, and funders of the Survey of Health, Ageing and Retirement in Europe for making the data available for research.

Ethical Considerations
The SHARE study is subject to continuous ethical review. Waves 1–4 were reviewed and approved by the Ethics Committee of the University of Mannheim, while Wave 4 and the continuation of the project were reviewed and approved by the Ethics Council of the Max Planck Society. In addition, country-specific implementations of SHARE were reviewed and approved by the relevant ethics committees or institutional review boards where required. These reviews covered the SHARE study and its subprojects and ensured compliance with applicable legal requirements and international ethical standards. The present study was a secondary analysis of de-identified SHARE data and involved no direct contact with participants. No additional ethical approval was required for this secondary analysis.
Consent to Participate
Informed consent was obtained from all SHARE participants before data collection in accordance with the applicable legal and ethical requirements of each participating country.
Author Contributions
YX: Formal analysis, Writing—original draft. ZZ: Methodology, Software, Writing—review and editing. MJ: Software, Writing—review and editing. CW: Visualization, Writing—review and editing. XQ: Writing—review and editing. FJ: Conceptualization, Funding acquisition, Supervision, Writing—review and editing. All authors reviewed and approved the final version of the manuscript.
Funding
The authors disclosed receipt of the following financial support for the research, authorship, and/or publication of this article: Feifei Jia was supported by the Natural Science Foundation of Shandong Province (Grant No. ZR2021QH176).
Declaration of Conflicting Interests
The authors declared no potential conflicts of interest with respect to the research, authorship, and/or publication of this article.
Data Availability Statement
The data used in this study are available to registered researchers through the Survey of Health, Ageing and Retirement in Europe Research Data Center, subject to the SHARE registration procedures and Conditions of Use.
Sponsor’s Role
This study did not receive any specific funding from external sponsors. The analysis utilized de-identified, publicly available data from the Survey of Health, Ageing and Retirement in Europe (SHARE), which is freely accessible to researchers worldwide.
Supplemental Material
Supplemental material for this article is available online.
References
Supplementary Material
Please find the following supplemental material available below.
For Open Access articles published under a Creative Commons License, all supplemental material carries the same license as the article it is associated with.
For non-Open Access articles published, all supplemental material carries a non-exclusive license, and permission requests for re-use of supplemental material or any part of supplemental material shall be sent directly to the copyright owner as specified in the copyright notice associated with the article.
