
Abstract
Efforts to divert organics away from landfills are viewed by many as an important measure to significantly reduce the climate change impacts of municipal solid waste management. However, the actual greenhouse gas (GHG) impacts of organics diversion from landfills have yet to be thoroughly evaluated and whether such a diversion provides significant environmental benefits in terms of GHG impacts must be answered. This study, using California-specific information, aimed to analyse the GHG impacts of organics diversion through a life-cycle assessment (LCA). This LCA considered all aspects of organics management including transportation, materials handling, GHG emissions, landfill gas capture/utilization, energy impacts, and carbon sequestration. The LCA study evaluated overall GHG impacts of landfilling, and alternative management options such as composting and anaerobic digestion for diverted organic waste. The LCA analysis resulted in net GHG reductions of 0.093, 0.048, 0.065 and 0.073 tonnes carbon equivalent per tonne organic waste for landfilling, windrow composting, aerated static pile composting, and anaerobic digestion, respectively. This study confirms that all three options for organics management result in net reductions of GHG emissions, but it also shows that organics landfilling, when well-managed, generates greater GHG reductions. The LCA provides scientific insight with regards to the environmental impacts of organics management options, which should be considered in decision and policy-making. The study also highlights the importance of how site and case-specific conditions influence project outcomes when considering organic waste management options.
Keywords
Introduction
Global climate change has increasingly gained worldwide attention. Efforts have been made toward finding ways to minimize the adverse impacts of climate change. Solid waste management facilities, especially solid waste landfills, have been under significant scrutiny by regulators seeking to reduce greenhouse gas (GHG) emissions.
In California, following the passage of State Assembly Bill 32 (AB 32), ‘the Global Warming Solutions Act of 2006’, a comprehensive multi-year programme was initiated to reduce GHG emissions. AB 32 mandates that the California Air Resource Board (CARB) design and implement emission limits, regulations, and other measures, such that statewide GHG emissions be reduced to year 1990 levels by year 2020. Regulators and stakeholders alike have been engaged in extensive assessments of waste management practices relative to GHG emissions, including waste management approaches for organic waste. Under its Strategic Directive 6.1 (SD 6.1), the California Department of Resources Recycling and Recovery (CalRecycle), has targeted a 50% reduction in the amount of organics in the waste stream by year 2020.
Organic waste, including food waste, green waste, textiles, and to a much lesser extent biosolids and other organic components, comprises approximately 37% of California’s municipal solid waste (MSW) stream. While paper is the largest component (~ 27%) of the California MSW stream, food waste is the second largest category of MSW and comprises approximately 19% of the total MSW generated in California (Staley and Barlaz, 2009). Figure 1 shows California MSW stream composition.
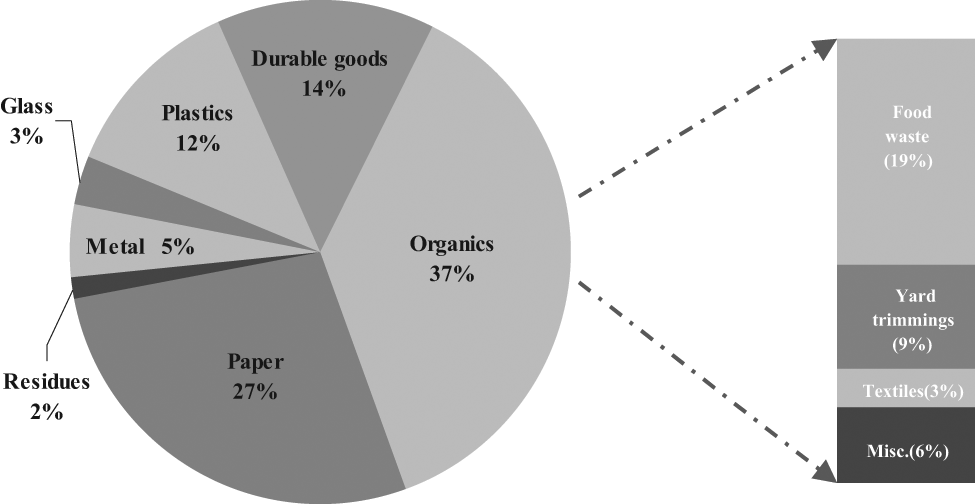
California MSW stream composition (Data source: Staley and Barlaz, 2009).
The diversion of organics away from landfills, and the direction of this waste to alternative management options such as composting, anaerobic digestion (AD), as well as other conversion technologies, is currently a popular topic for discussion among policy makers, regulators, and waste management industries. Many composting and AD proponents and landfill opponents have viewed composting and/or AD, as superior alternative management options to replace landfilling of organic wastes. One of the primary reasons given for diverting organics from landfills is to reduce fugitive landfill GHG emissions. In spite of policy decisions to reduce landfilling, it has not been demonstrated that diverting organics will in fact reduce the overall GHG emissions from management practices of organics. The claims regarding the GHG benefits of alternative management options of organics such as composting and AD have yet to be substantiated by real-world operating experiences.
To date, the true GHG impacts of the various organics management options remain unknown and are still in debate. In recent years, there have been scientific studies aimed at evaluating the environmental impacts of MSW management options. For example, Manfredi et al. (2009) analysed the GHG and global warming impacts of waste landfilling, by assessing different landfilling technologies in terms of GHG emissions. Boldrin et al. (2009, 2010) conducted life cycle studies analysing global warming impacts of composting and environmental benefits of compost utilization. Gentil et al. (2010) reviewed and analysed methodologies and technical assumptions that are important to life cycle assessment (LCA) models of waste management. They identified several model criteria, such as the functional unit, system boundaries, waste compostion and energy modelling, which could have significant impacts on the modelling results. Manfredi et al. (2011) evaluated waste management options such as recycling, incineration and landfilling through life-cycle impact assessment using the dedicated waste LCA tool EASEWASTE, developed at the Danish Technical University. Manfredi et al. (2011) found that the environmental performance evaluated for landfilling with energy recovery of ‘organics’ and ‘recyclable paper’ is comparable with composting (for ‘organics’) and incineration (for ‘recyclable paper’). Efforts have also been made previously by researchers to develop methodologies and models and to conduct studies to assess the environmental impacts of waste management alternatives such as composting and anaerobic digestion using LCA methods (Boldrin et al., 2011; DiStefano and Belenky, 2009; Haight, 2005). Boldrin et al. (2011) quantified potential environmental effects from biological treatment, such as composting, AD, and combinations of both, for organic waste. The LCA modelling study provided a comparison of environmental impacts between windrow and tunnel composting, as well as AD. In addition, the study also provided a review on features available in eight different LCA tools. The studies of Haight (2005) and DiStefano and Belenky (2009) found that diverting organics to AD would result in GHG reductions. However, relatively low landfill gas (LFG) collection efficiencies were assumed and landfill carbon sequestration benefits were not incorporated in these two studies. In addition, these previous studies also did not consider fugitive nitrous oxide (N2O), a potent GHG with a global warming potential (GWP) of 298 (IPCC, 2007). Therefore, in light of these previous efforts attempting to evaluate the environmental impacts of waste management options using a LCA methodology and the increased interest and momentum to utilize organics outside of the landfill, a systematic LCA analysis of the true GHG impacts of potential organics management options, including landfilling, composting, and AD, is warranted and valuable. For this purpose, an integrated LCA methodology was developed considering all aspects of organics management including transportation, materials handling, fugitive GHG emissions, LFG capture/utilization, energy impacts, and carbon sequestration. It is worth-noting that a comprehensive LCA normally addresses 12 ~ 16 impact categories (e.g. environmental – air, water, and groundwater quality, energy, ecological, economic, acidification, toxicity, global warming, human health, etc.). Only the GHG (global warming) impact is addressed in this LCA analysis.
This study, which uses California-specific information and includes a LCA of the GHG impacts from organics management options such as landfilling, composting, and anaerobic digestion, was performed using a dedicated LCA tool developed by the Los Angeles County Sanitation Districts (LACSD). This LACSD LCA tool, following the same general principles and methodologies of LCA models developed in previous studies discussed in the section above, was based on a GHG budget considering both sources and sinks of GHGs for various organics management scenarios considered. The results of this GHG budget represent any net increase (source) or decrease (sink) in the atmospheric global warming potential of an activity. In particular, this approach in the GHG LCA accounts for transportation, various unit operations and handling, such as the presence of gas and energy recovery systems, the extent of compliance with stringent fugitive emission control rules, carbon storage potential, emission offsets (e.g., displacing fossil fuel use), and the types and extent of the materials handling processes for each of the organics management options. The LACSD’s LCA approach tends not to be biased toward any particular organics management option; rather it analyses the GHG impacts of various management options through a LCA methodology.
Although carbon dioxide (CO2), methane (CH4), nitrous oxide (N2O), sulfur hexafluoride (SF6), perfluorocarbons (PFCs), and hydrofluorocarbons (HFCs) are all naturally-occurring or anthropogenic (man-made) GHGs, the most common GHGs that result from human activities include CO2 (GWP = 1), typically generated by fossil fuel consumption, CH4 (GWP = 25), formed as a by-product from microbial respiration reactions that occur when organic materials decompose under anaerobic conditions, and N2O (GWP = 298), produced by human-related sources, including composting operations (United States Environmental Protection Agency (USEPA), 2010a). Under certain conditions, N2O can also be detected on the MSW landfill surfaces (Bogner and Spokas, 1999; Borjesson and Svensson, 1997; Rinne et al., 2005; Zhang et al., 2008). Generally these N2O emissions are far smaller than CH4 emissions at landfills (McBain et al., 2005; Rinne et al., 2005; Tsujimoto et al., 1994), and the N2O emission from landfills is considered an insignificant source globally (Bogner and Spokas, 1999; Bogner et al., 2007; Rinne et al., 2005). AS these three gases are the GHGs most relevant to organics management, they are the primary focus of this analysis. It is common practice to express either emissions or reductions in GHG in terms of the elemental carbon portion of carbon dioxide, that is, the weight of carbon dioxide emissions or reductions is converted to an equivalent weight of carbon. This is done by multiplying the weight of carbon dioxide by the molar ratio of carbon to carbon dioxide (i.e. 12/44 or 0.2727). Thus, in the LCA study, GHG emissions and reductions are expressed in metric units, commonly, tonnes carbon equivalents (MtCE). An alternative unit, tonnes carbon dioxide equivalents (MtCO2E), is also commonly used in LCA analyses. An easy conversion (MtCE = 0.2727 × MtCO2E) links these two commonly used units.
An important concept in GHG LCA is that emissions may be considered either biogenic or anthropogenic. Biogenic emissions are part of the natural atmospheric cycle. For example, the organics carbon content was originally derived from atmospheric carbon dioxide, and as such, any subsequent release of carbon dioxide simply restores the atmosphere to prior carbon levels and is considered a part of the natural atmospheric carbon cycle, hence is not considered a GHG emission. In contrast, anthropogenic emissions resulting from human activities are those that occur outside the natural carbon cycle. Notably, fossil fuels produce anthropogenic emissions as their combustion processes release CO2 in excess of natural levels. In the case of organic waste, while the carbon content is derived from ambient air CO2, processes such as landfilling, composting, and AD produce CH4 and, in the case of landfilling and composting, some amounts of N2O. As generally accepted by the international scientific community and various regulators (e.g. USEPA, CalRecycle, CARB), both CH4 and N2O are not part of the natural atmospheric cycle and thus are considered anthropogenic emissions.
It is well known that some forms of carbon may persist under various conditions in a stable form and so are removed from the natural carbon cycle. Such carbon is considered ‘sequestered’ or ‘stored’. Organic waste landfilling, composting, and anaerobic digestion (when coupled with subsequent composting) have the potential to sequester carbon. Such processes represent reductions in the atmospheric carbon dioxide level at an equivalent rate of one unit of carbon dioxide removed for each unit of sequestered carbon.
Various processes may either offset or increase fossil fuel use. Changes in heavy equipment usage and truck transport have corresponding changes in carbon dioxide releases. Placement of organics in landfills requires fossil fuel use, and pre- and post-processing in composting and AD also require the use of fossil fuels. On the other hand, recovery of energy from landfill gas (LFG) and AD biogas created by organic waste decomposition processes offsets fossil fuel use for electrical generation.
What follows is a comparison of GHG reductions for various organic waste management options (landfilling, composting, and anaerobic digestion) using a comprehensive GHG LCA.
GHG life cycle assessment
Although there are other LCA tools (e.g., EASEWASTE) available, as discussed in the earlier section of this paper, this study was performed using a LCA tool that was developed by LACSD following the same general approach of other LCA tools discussed in the earlier section of this paper, to analyse the GHG impacts of landfilling, composting, and anaerobic digestion in managing organic waste. An early version of this LCA tool, using similar LCA methodology, was previously developed by LACSD and applied in a comprehensive life-cycle analysis to evaluate GHG impacts of two methods for managing green waste, namely landfill alternative daily cover (ADC) use versus composting (Kong et al., 2009). This previous LACSD study laid the groundwork for this current effort to perform the GHG LCA for the three organic waste management options following their individual conceptual flowcharts.
Scenario starting point
In this study, the starting point for all three organics management options was at the kerbside where organics are collected and trucked to a site where the actual organic waste processing for the specific management option would take place (e.g. landfills, composting, and AD facilities). The functional unit for this LCA analysis is a tonne of wet organic matter.
The following sections follow relatively conceptual yet streamlined LCA flow-charts, and discuss the stages and components of the LCA study for each of the three organics management options in a detailed systematic manner.
Landfilling scenario
The landfilling life-cycle scenario evaluates disposal of organics in a landfill and their subsequent contribution to LFG generation.
There are five stages in the landfilling GHG LCA resulting in either GHG emissions or reductions (Figure 2). The first stage is transport of organics from curbside or a collection point to a landfill for disposal. This transportation stage involves fossil fuel use. Carbon dioxide, methane and nitrous oxide, all are GHGs, and these are generated by and emitted from fossil fuel-powered vehicles. Nitrous oxide and methane emissions tend to comprise a relatively small portion of overall vehicle GHG emissions, generally in the range of 1–2% combined (USEPA, 2004). Consequently only carbon dioxide vehicle emissions are considered here (fossil fuel carbon dioxide emission factors and methane to energy conversion factors were derived from published reports and studies (NSWMA, 2006; Price, 2002; USEPA, 2006). The use of green waste, one of the key components of organic waste, as ADC in landfills displaces the need for importing clean soil for cover hence reduces fossil fuel use in transporting clean soil. Some landfills may use materials (e.g. tarpaulins, film plastic sheets, and foam) other than green waste as ADC and some landfills may utilize onsite soil for cover. These variations/exceptions were not considered in this study as either it is not typical or their GHG impacts are not significant.
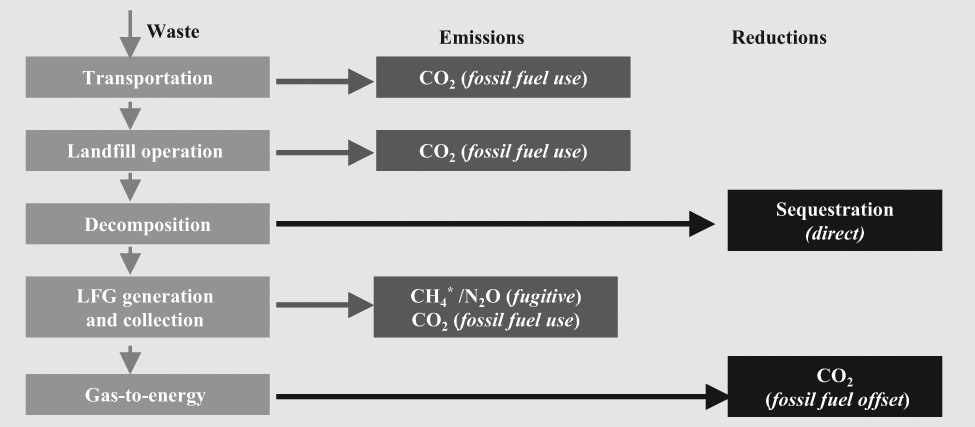
Landfilling GHG life-cycle analysis flow chart.
The second stage is the disposal/placement of organic waste in a landfill. This placement process (including ADC placement) involves the use of heavy equipment such as dozers, scrapers, and compactors. There are GHG emissions associated with fossil fuel consumption by the heavy equipment as part of the daily operations.
The third stage is organics decomposition. Organics directly sequester carbon during the decomposition process. It is well known that landfilling and composting (including composting of AD residues) provide for long-term carbon sequestration, and landfill carbon storage has been recognized and extensively discussed. (Barlaz, 1998; Bogner, 1992, 2008; USEPA, 1998, 2002, 2006). In addition, CARB recognizes carbon sequestration in its GHG inventory, and in a recently prepared CalRecycle organics management LCA study (CalRecycle, 2009), carbon sequestration was considered for organic waste management options involved in the analysis. The USEPA also recognizes and incorporates carbon storage (sequestration) in landfills in its GHG inventory life-cycle analysis (USEPA, 2006). This LCA study was consistent with this philosophy and methodology.
Organics carbon sequestration in a landfill is quantitatively larger than for composting and AD operations as the conditions within a landfill are not so favorable for decomposition. Noted ‘garbologist’ Dr William Rathje has long reported the resistance of landfill organics to decomposition (Rathje and Murphy, 2001). However, this study uses conservative assumptions based on the research of Dr Morton Barlaz and colleagues at North Carolina State University on behalf of the USEPA (Barlaz, 2000, 2005; Staley and Barlaz, 2009). Dr Barlaz’s work documents the maximum possible extent of landfill decomposition and so minimizes the calculated sequestration. Decomposition also generates landfill gas (typically contains 50% methane); which will be further addressed in the fourth stage. In this LCA study, methane gas generated from one metric ton of organics disposed in a landfill over its lifetime is considered, methane generation potential of the organics is used to represent methane production of landfilled organics. Table 1 presents the methane generation potential (L o) and carbon sequestration factors (CSFs) for each component of the California organic waste stream. Using data presented in Table 1, composited weighted average methane gas generation potential and carbon sequestration factors for the organics were derived and used in the LCA landfilling scenario.
Methane generation potential and carbon sequestration factors for organic components (Data for columns 3, 4, 5 are extracted from Table 6; Staley and Barlaz, 2009).

Although very small, the fugitive nitrous oxide emissions from an MSW landfill have been measured and reported (e.g. Bogner and Spokas, 1999; Rinne et al., 2005). In their field study using the eddy covariance method, Rinne et al. reported that N2O emissions make up about 3% of the total GHG emissions of the landfill. Fugitive N2O emissions from landfill surfaces were considered in this LCA landfilling scenario using literature data.
The fourth stage is landfill gas (LFG) generation and collection. Under CARB’s new landfill surface methane control rules, which became effective in June 2010 (CARB, 2010), virtually all MSW landfills where organic wastes are managed in California are required to be equipped with LFG collection systems. A commonly expressed concern is that organics will rapidly decompose before the LFG collection system becomes effective and it may take years after waste disposal to have gas systems installed. While this situation may be true elsewhere, this is not the case in the state of California, especially in southern California, where landfills are relatively dry (in semi-arid regions), with slower waste degradation rate constants (k) and longer decomposition duration. In fact, organics have been verified to require years to decompose under semi-arid landfill conditions and then only decompose incompletely (Al-Yousfi, 1992; Barlaz and Schaefer, 1992). As a practical matter, California has one of the most stringent surface methane control rules in the world. To comply with these stringent surface methane rules, landfill operators have to install gas collectors (especially horizontal trenches) soon after (weeks instead of years) the lift of refuse is completed. In addition, routine surface gas monitoring for regulatory compliance encompasses the entire landfill including the active areas. This extensive monitoring is required by the South Coast Air Quality Management District (SCAQMD) Rule 1150.1 and additionally by the more stringent CARB landfill surface methane rules. This level of monitoring ensures that emissions measured directly over all landfill surfaces are under control and kept to very low levels throughout the entire lifespan of a landfill.
LFG collection efficiency is an important parameter for gauging the performance of landfill gas collection systems. Collection efficiency measurements are typically complex and costly and so are seldom made, therefore practical measurements of collection efficiency are lacking. Instead conservative collection efficiencies are typically assumed. For example, a default efficiency of 75% based on surveys of industry estimates (Leatherwood, 2002) is commonly used by the USEPA. Despite the difficulty and complexity in measuring collection efficiency, there have been investigations in the past that attempted to quantify LFG collection efficiencies (e.g. Huitric and Kong, 2006; Huitric et al., 2007; Spokas et al., 2006). Dr Stan Zison of Pacific Energy, as reported in Leatherwood (2002), measured collection efficiencies at three landfills operated for energy recovery purposes at 85, 90 and 95%. It is reasonable to expect that gas collection efficiency is yet higher at landfill sites operated under strict regulatory requirements. Spokas,et al. (2006) conducted intensive field measurements at three French landfills with the aim of quantifying all of the pathways for methane generated at the sites. Efficiencies between 88 and 98% were calculated for sites with completed clay covers similar to those widely used in North America. Huitric and Kong (2006) developed a methodology that combines an extensive integrated surface methane (ISM) monitoring with air dispersion modelling, to estimate LFG collection efficiencies. The basis for this methodology is the Gaussian theory showing that the surface methane concentration from an area source such as a landfill is directly proportional to its emission rate. The integrated surface methane monitoring, required by California surface methane control regulations for effective emission control, standardizes the surface methane monitoring by dividing the landfill into 50 000 foot2 grids and requires an approximately 2600 foot long uniformly spaced route be monitored within each grid. Originally integrated gas samples were collected in bags, but now portable flame ionization detector (FID) units equipped with data loggers are used to record readings continuously at four-second intervals. The data logger values are then averaged for each grid to get an integrated surface methane value for the grid. The methodology minimizes the spatial and temporal variability of the surface methane emissions often associated with other emission measurement methods (e.g., flux chambers), it also avoids dealing with uncertainties associated with gas generation modelling. This ISM/air-dispersion methodology has been applied and verified by comparing the results with those from a surface flux-chamber method at a LACSD landfill (Huitric and Kong, 2006; Huitric et al., 2007). The results of the studies indicated that the LFG systems, operated for emissions control purposes, at LACSD’s Palos Verdes Landfill in southern California, had collection efficiencies at 90% and higher (95+% for some cases). The details of the ISM/air-dispersion methodology, and pros and cons of this methodology and other emission measurement methods are discussed in Huitric and Kong (2006) and Huitric et al. (2007).
Higher LFG collection efficiencies in California, even in the US, are also supported by other studies and various governmental and professional entities (e.g. ARF 2007; Bentley et al. 2005; CARB 2009, 2011; Michels and Hamblin 2006; SCS 2007; SWANA 2010; USEPA 2009). Bentley et al. (2005), using a baro-pneumatic method, estimated that the LFG collection efficiency at the North Shelby Landfill in southeastern USA. to be 83%. Michels and Hamblin (2006) analysed LFG data from 24 MSW landfills in Wisconsin, USA over a period of 5 years and found that LFG collection efficiency has been improved each year from 77% in year 2000 to 85% in year 2004. A weighted average LFG collection efficiency of 89.7% has been reported for LACSD’s three active landfills in southern California (Case et al., 2010). Furthermore, in its technical analyses, CARB (2009, 2011) used LFG collection efficiency values of 87 and 83%, respectively, to be representative of MSW landfills in California. With the implementation of CARB’s new surface methane emissions control rules earlier this year, LFG collection efficiencies of California MSW landfills are expected to be even higher, as landfill operators are required to install new LFG systems and operate LFG systems more aggressively for emission control.
Hence, for the landfilling scenario in this LCA analysis, a lower average gas collection efficiency value (82.5%) representative of California MSW landfills was utilized. This collection efficiency value is an average value that accounts for the relative number of LFG collection systems operated for emission control purposes (assumed a 90% collection efficiency) versus those operated for other purposes such as energy recovery (assumed a 75% collection efficiency). These assumed efficiency values are fairly conservative considering higher efficiency values have been proposed and recommended to the USEPA to represent LFG systems that are typically operated in California for emissions control and energy recovery purposes (SCS, 2007). In this LCA, it was also assumed that only half of the LFG systems in place in California are operated for the purpose of emissions control. It is important to note that with the CARB surface methane emissions control rules coming into effect recently, the number of LFG systems operated for emissions control purpose should increase noticeably in order to comply with these stringent new rules. As discussed earlier, recently published papers (Huitric and Kong, 2006; Huitric et al., 2007) have shown that LFG collection systems operated for emissions control (e.g. the federal NSPS MSW New Source Performance Standards, and the more stringent California landfill regulations) are highly effective, collecting nearly all the gases generated. However, conservative collection efficiency estimates representative of California landfills were made for this analysis and the impacts of LFG collection efficiency on the results of this analysis will be discussed in details later in this paper.
The fifth stage considered in this LCA is the collected methane utilized for renewable energy production, thereby offsetting fossil fuel use (the current California energy mix is 32% coal, 31% natural gas, 24% large hydroelectric, 11% renewable (e.g. geothermal, solar, wind, biomass, etc.), and 3% nuclear (CEC 2010)).The amount of collected methane used for energy recovery in California is estimated to be 72%, which is much higher than the US national average of 52% (Themelis, 2008; Themelis and Ulloa, 2007). This is reasonable, as California has the highest number of landfill gas to energy (LFGTE) projects in the nation, accounting for more than 25% total waste-in-place (WIP), 15% total LFG flow to LFGTE projects, and 12% of total number of LFGTE projects in the US (USEPA, 2010b). Looking forward, with more stringent GHG emission control rules to comply with, coupled with LFG renewable energy recovery incentives such as CO2 offset credits, there could be even higher percentages of collected methane utilized for renewable energy recovery if organics are not diverted away from well-managed landfills. It should be noted that fossil fuel usage during LFG collection and energy recovery were considered in the analysis, and published fossil fuel carbon dioxide emission factors and methane energy conversion factors were used in the LCA. Table 2 summarizes key parameters and assumptions applied in the landfilling scenario.
Summary of key parameters.

Round-trip transportation distances for landfilling, composting, and AD are 50, 76 and 100 miles, respectively. These values are obtained based on California reality.
CARB EMFAC (Center for Environmental Research and Technology, 2006).
Estimated based on the landfill operation routines of typical California landfills.
Average of 75% (for landfills operated for energy recovery) and 90% (for landfills operated for emissions control). California Air Resources Board (CARB) uses 83% collection efficiencies for California landfills in its GHG emissions inventory analysis.
Data derived based on LACSD landfill operations data.
Derived from fossil fuel CO2 emission factor and process fossil fuel consumption, converted to carbon equivalent.
Amlinger et al. (2008); Andersen et al. (2010b); Beck-Friis et al. (2000, 2003); Hellebrand (1998); Hellmann (1995); Hellmann et al. (1997); Stredwick (2001).
Amlinger et al. (2008); Andersen et al. (2010a, b); Beck-Friis et al. (2000); Hellebrand (1998); Hellmann (1995); Hellmann et al. (1997); Schenk et al. (1997).
Assume diesel fuel usage for AD is about half of that for windrow composting, as AD process requires less in heavy equipments’ usages.
USEPA (1998), with proper unit conversion.
For lack of data, these emissions are assumed to be zero in this analysis.
Assume AD residues (30% of initial feedstock) further undergo composting, thus using composting carbon storage factors (multiplying by 0.3).
Composting scenario
The organics composting life-cycle scenario evaluates composting of diverted organic waste with the end product used in agricultural and farming applications. Currently, the two most common methods of organics composting are turned-windrows and aerated static piles (ASP). Turned windrow composting involves constructing elongated trapezoidal piles of composting materials (feedstock), which are regularly turned with either a tractor, front-end loader, or specialized turning equipment to aerate the pile, promote microbial decomposition and maintain appropriate temperatures and moisture levels required for pathogen destruction. In contrast, ASP systems, unlike windrows that require periodically turning the piles, utilize forced aeration, with a blower to introduce air into the composting piles, either with positive or negative pressure. ASPs can be uncontained or contained using a cover such as a geo-synthetic membrane, or a layer of finished compost. It should be noted that contained and enclosed (in-vessel) or in-building systems are also employed, but to a much lesser extent than windrows and ASPs due primarily to the high cost of these systems, therefore they were not included in this evaluation.
In terms of aeration, an advantage of negatively aerated piles is that the air/gas generated within the compost piles can be pulled through the piles and directed to a treatment system such as a biofilter for odour and emissions control. On the other hand, a disadvantage of negative aeration is that it tends to result in very moist and often saturated conditions around the air lines and this can result in uneven composting and very high pressure drops and greater power requirements for ASP aeration. Although windrow composting is still the predominant method of composting in California and also in other parts of the US (CAR, 2010), ASP composting has increasingly gained attention and favour recently as a result of its emission control advantages over turned windrows. In this analysis, the GHG impacts of both centralized turned windrow and ASP composting facilities are analysed and discussed.
There are five stages in the composting GHG LCA that result in either GHG emissions or GHG reductions (Figure 3). The first composting stage is transportation in which organic waste is transported from kerbside or a collection point to a rural compost facility, and then from the compost facility to its ultimate end use location (for example, a storage/distribution point, farm or nursery). Organics transport consumes fossil fuel and generates GHG carbon dioxide emissions.
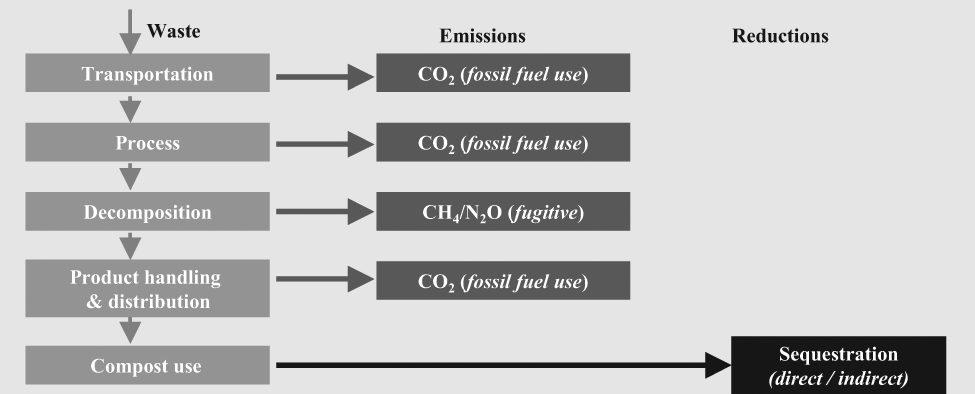
Composting GHG life-cycle analysis flow chart.
The second stage addresses emissions from fossil fuel use during the actual composting processes, such as shredding and grinding (pre-processing), pile building/dismantling, compost pile turning (for windrow composting) and aeration (for ASP operations). Different compost methods (windrow versus ASP) have different fossil fuel requirements. Data applied in this stage were obtained through either the literature (USEPA, 2006) or actual compost facility field data (IERCF, 2008). Details about assumptions made and data sources for the composting scenario are listed and discussed in Table 2.
The third stage is organics decomposition in which organics under optimal conditions decompose aerobically producing biogenic carbon dioxide. It should be noted that decomposition and subsequent emissions are associated with the active composting cycle as well as the subsequent curing cycle that is practiced by most operating facilities. Studies have shown that composting can produce fugitive methane emissions at a rate similar to or higher than landfills with adequately operated LFG emission control systems (Amlinger et al., 2008; Andersen et al., 2010a, 2010b; Beck-Friis et al., 2000, 2003; Hellebrand, 1998; Hellmann, 1995; Hellmann et al., 1997; Stredwick, 2001; Willoughby, 1995). In addition, past investigations have shown that another GHG, nitrous oxide (N2O), is produced under aerobic conditions during active and curing composting processes (Amlinger et al., 2008; Andersen et al., 2010b; Beck-Friis et al., 2000; Czepiel et al., 1996; Gronauer et al., 1997; Hellebrand, 1998; Hellmann, 1995; Hellmann et al., 1997; Schenk et al., 1997). Some recent data have also shown that fugitive GHGs (both CH4 and N2O) emissions occur not only during the active composting stage but also in the curing stage (Brinton, 2010). With regard to treatment of CH4 and N2O, biofilter performance for ASP operations are mostly untested to determine their effectiveness in removing these potent GHGs. Increasing amounts of fugitive GHG emissions data has been published in recent studies, but actual field data related to GHG emissions from organics composting processes continue to be lacking. Emissions data used in this analysis were obtained from the limited data currently available in related literature. This area certainly warrants further research in gaining better understanding of fugitive GHG emissions associated with composting processes.
The fourth stage addresses fossil fuel consumption associated with handling and distribution of compost products. Once the compost materials have been through the active and curing stages, a full compost cycle is completed. Under some circumstances, the finished compost materials still need to be screened to remove large and unwanted materials before trucking to end markets (e.g., a farm). Once completed, the non-compostable materials will still likely need to be trucked to a landfill for disposal. Fossil fuel will also be consumed when applying compost in agricultural and farming applications, as well as when transporting residuals.
The fifth stage is the agricultural and farming application of organic compost. This beneficial use of compost produces a small amount of indirect and a larger amount of direct carbon sequestration as it normally accumulates (‘sequesters’) in soils due to the presence of non-degradable organics (e.g. ‘lignins’). Lignins are readily degraded under aerobic conditions, mainly by fungi, during both the composting process and later application of compost to surface soils (e.g. Tuomela, 2002). The residual non-degradable organics directly sequesters a larger amount of carbon as compost is applied in soils. Additionally, composting indirectly sequesters carbon by fostering improved growth of farmed products. This study has also attempted to address other indirect factors and additional benefits of compost use such as reduced water use, and avoiding peat and mineral fertilizers production (Boldrin et al., 2009, 2010), which in turn, reduces fossil fuel use. Key parameters and assumptions applied in the composting scenario are listed in Table 2.
Anaerobic digestion scenario
Another increasingly popular alternative method for managing and utilizing organics is the anaerobic digestion of organic materials to produce biogas. AD is the biological decomposition of organic matter in an environment where there is adequate moisture and little or no oxygen. AD processes utilize organics as a feedstock, through a series of biological processes, to produce biogas, in which methane is the primary component. CH4 is recovered and utilized to produce fuel and/or energy. Although the concept of digestion has been applied in municipal wastewater treatment processes for quite some time, the development of solid waste organics AD processes is fairly new and still at its infant stage in California. Currently there are no commercial-scale AD facilities processing organic solid wastes in the state, other than some large scale demonstration projects handling well-sorted food waste which is relatively clean and free of debris. Actual field data, which is important for this analysis, are either lacking or incomplete. The data used for the organic solid waste AD scenario in this LCA were obtained from either published literature or studies/reports of pilot scale experiments (Beck, 2010; DiStefano and Belenky, 2009). Despite the fact that AD is still in the early stage of its development and only very limited information and data were available, efforts were made to ensure data used and assumptions made in the analysis were reasonable. Similar to the approach taken for the composting scenario, when judgments and assumptions were needed to be made with regard to data use, conservative approaches and estimates were used for the AD scenario. For instance, when there was no reliable data available with respect to fugitive GHG (CH4 and N2O) emissions associated with the AD processes, these fugitive GHG emissions were assumed to be zero in this LCA.
AD processes include pre-processing, digestion, and post-processing. Pre-processing includes feedstock receiving, storage, and all processing steps (e.g. grinding, crushing, shredding, and screening) required to prepare the feedstock for the digestion stage, and ultimately the delivery of feedstock into the digester. During the digestion stage, biological decomposition occurs and this process results in the generation of biogas with CH4 as its primary component. In the post-processing stage, the byproducts of the AD process, such as liquid and solid byproducts and biogas, are further processed. Options for managing liquid byproduct, depending upon its quality, include reuse in the digestion process, discharge to surface water bodies or sanitary sewer systems, and beneficial use as irrigation water. The digested solids are often dewatered and the solid byproduct can be aerobically composted for beneficial use as compost, used as feedstock for energy production, disposed of in sanitary landfills, or directly applied as soil conditioner on farmland. Biogas generated and collected from the AD process can be utilized for renewable energy recovery. All of these AD processes involve energy generation/consumption, transportation, fugitive emissions, and carbon storage, that all are considered in this LCA.
There are six stages in the organics AD GHG LCA resulting in either GHG emissions or reductions (Figure 4). The first stage is transportation, which involves transporting collected organics from curbside or a collecting point to a centralized AD facility. Fossil fuel is consumed and anthropogenic carbon dioxide emissions will occur during this transportation stage.
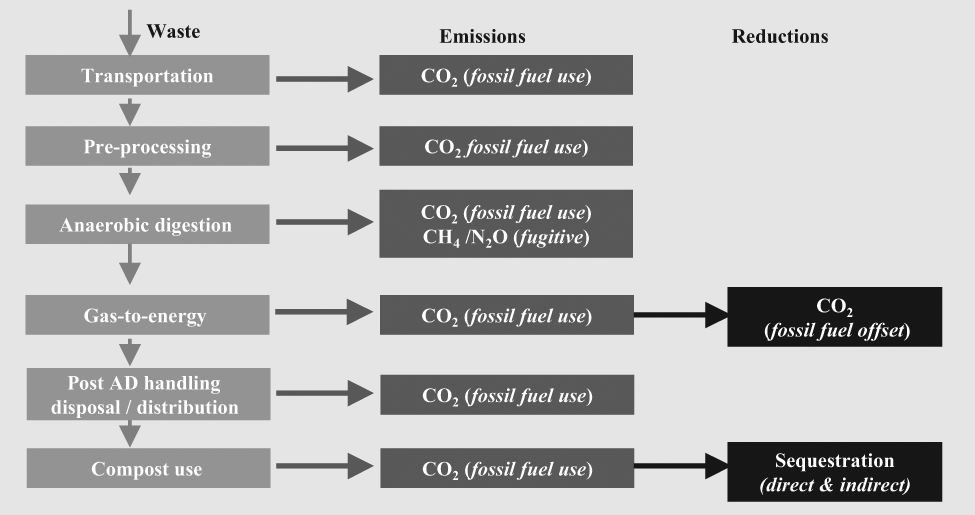
AD GHG life-cycle analysis flow chart.
The second stage is the pre-processing of the waste prior to introduction into the digester. Pre-processing includes feedstock receiving, storage, and all processing steps (e.g. sorting, grinding, crushing, shredding, and screening) required to prepare the feedstock for the digestion stage, and the process of feedstock delivery into the digester. These processes require the use of equipment and consume fossil fuels directly (e.g. diesel) or indirectly (e.g. electricity), thus there are anthropogenic CO2 emissions associated with the various steps occurred in the pre-processing stage.
The third stage is the actual anaerobic digestion of the organic feedstock. During this actual AD stage, organic material decomposes anaerobically, and biogas is generated and collected (Beck, 2004, 2010). Although the actual AD unit is supposed to be air-tight, fittings and piping connecting the AD unit and gas recovery devices might have leaks, resulting in fugitive GHG emissions. However, very limited AD GHG emissions data are available to date. Because the uncertainties associated with GHG data, it was assumed that fugitive GHG emissions from actual AD process were zero in this analysis. Anthropogenic CO2 emissions due to fossil fuel use in collecting, treating, and utilizing AD generated biogas, as well as heating the digesters for pathogen destruction are considered in this LCA.
The fourth stage considered is the amount of biogas (CH4) generated and collected in the AD process and its subsequent conversion and utilization for renewable energy recovery, which offsets fossil fuel use.
The fifth stage involves the handling and further treatment or disposal of all solid and liquid waste streams. Portions of the initial AD feedstock do not decompose during the AD process, thus they become residues. Currently, the solid residues of the AD process are typically directed for further treatment such as a composting step that produces compost products. Non-compostable residues are trucked to landfills for disposal, and liquids are either further treated on site or they can be discharged to the sewer. All of these process steps for managing AD residue materials require the use of equipment, consume fossil fuels, hence generate anthropogenic CO2 emissions.
The sixth stage is the use of finished compost products derived from AD residual material in agricultural and farming applications. This agricultural use has GHG benefits in terms of carbon sequestration. Similar to the composting scenario discussed earlier in the paper, these carbon sequestration benefits apply to the compost products derived from the AD process, and include carbon sequestration for reduced water/irrigation and fertilizer uses due to compost application. A summary of key parameters and assumptions applied in the AD scenario are shown in Table 2.
Results
The results of a GHG life-cycle assessment can be expressed as a simple equation (Equation (1)) which states that the net GHG emissions reduction is equal to the GHG reductions less the GHG emissions:

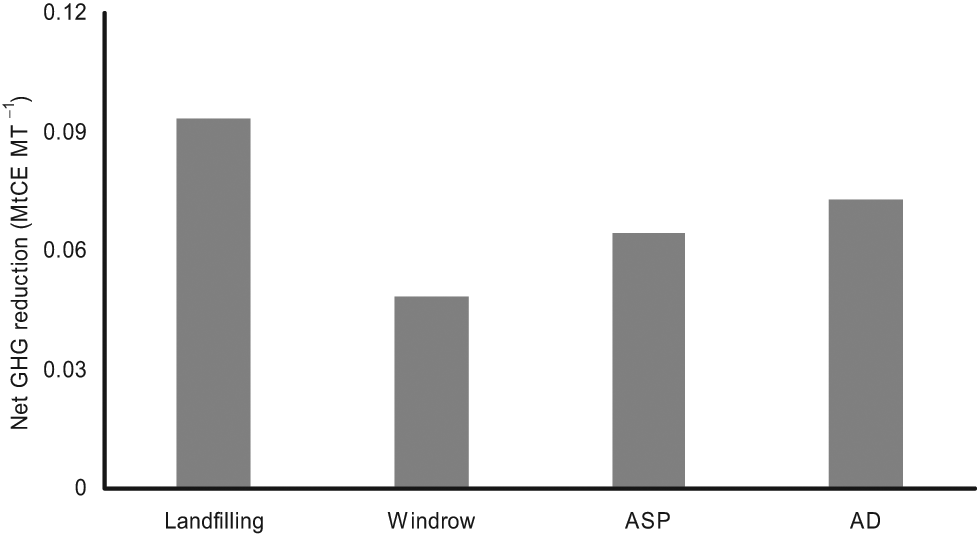
This study evaluates three organic waste management options, landfilling, composting, and AD, using a GHG LCA strategy. All the resulting reductions in GHGs and emissions for the three management options were expressed in terms of metric tons carbon equivalents per metric ton of organics (MTCE/MT), to allow all three organics management options to be directly compared. Table 3 summarizes the LCA modelling results. Figure 5 shows the relative performance of the three options for organics management. The LCA results indicate that for a base case scenario, representative of California conditions, landfilling is at least comparable or slightly more protective of the environment in terms of GHG reduction when compared with composting and AD. Because AD has better fugitive emissions control than composting, and has renewable energy recovery benefits, which composting does not have, AD has an overall better GHG emissions reduction (or, in other words, less net GHG emissions) than composting, as shown in Table 3.
Summary of GHG life-cycle analysis results.
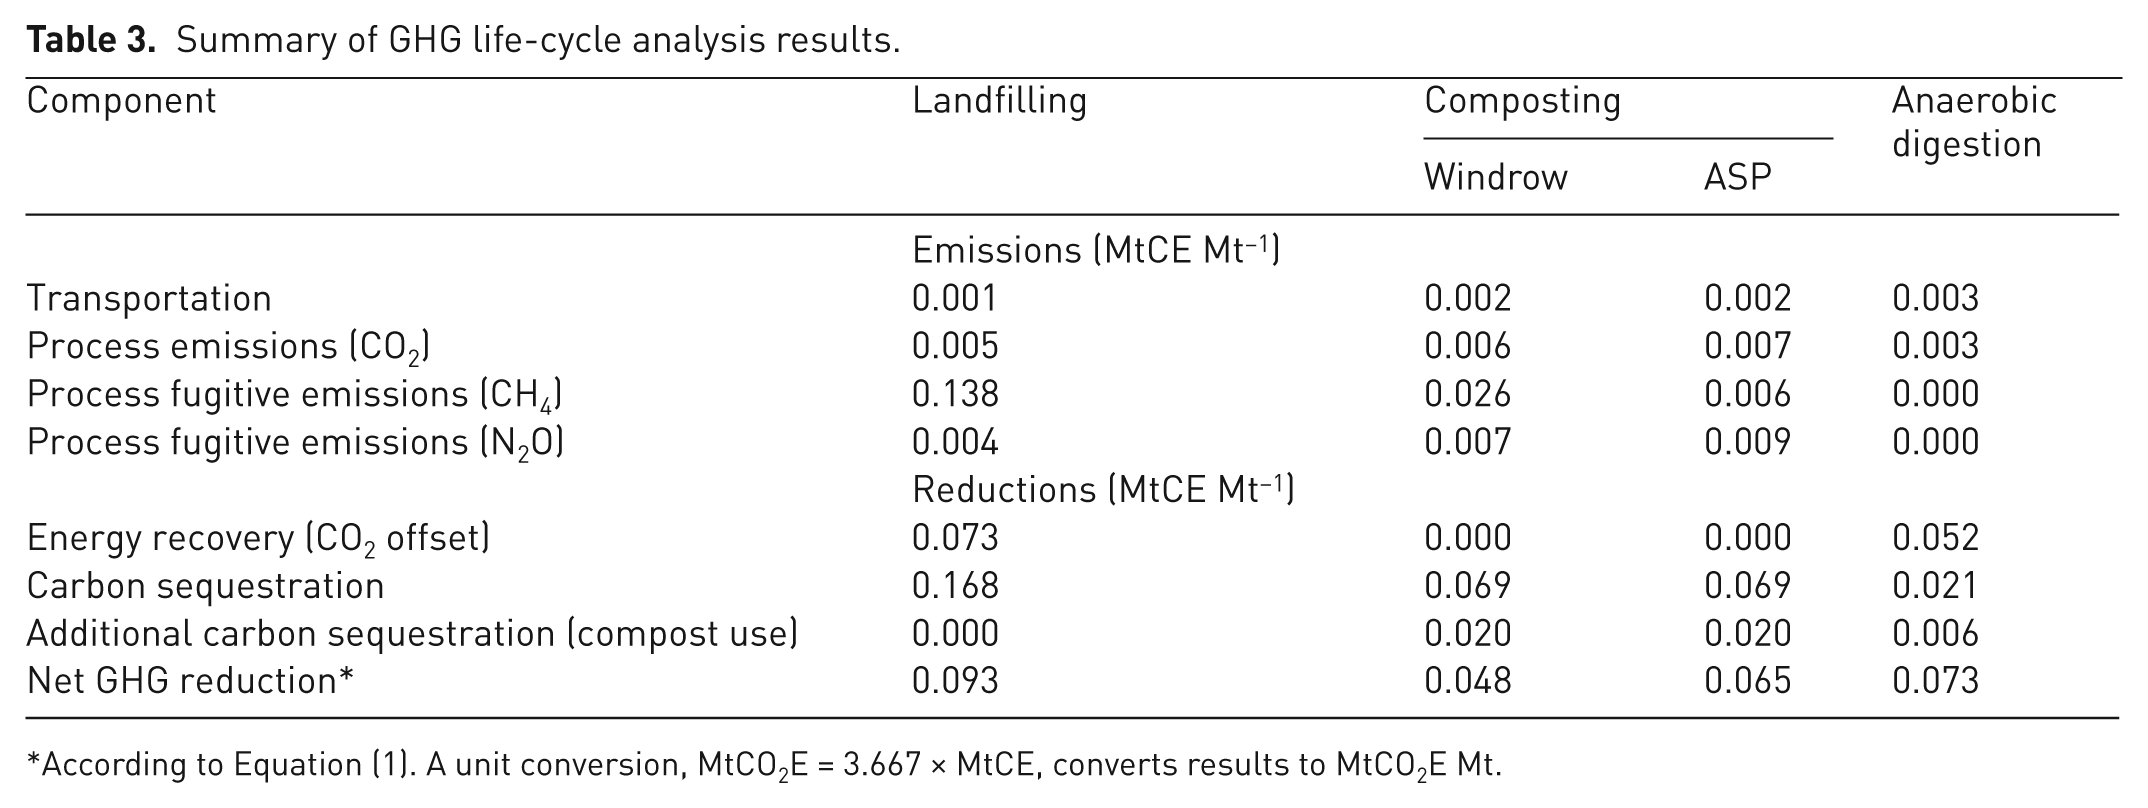
According to Equation (1). A unit conversion, MtCO2E = 3.667 × MtCE, converts results to MtCO2E Mt.
Results of GHG life-cycle analysis (LACSD model).
Discussion
In the organics LCA presented above, important assumptions were made relative to various factors. Important among these are the assumed LFG collection efficiency, and to a lesser extent the transportation distance. These issues are discussed in more detail below.
Landfill gas collection efficiency
Efficient LFG collection reduces the potential for methane emissions. Overall California landfills have the highest collection efficiencies in the nation for a variety of reasons. LFG collection was first pioneered in California in the early 1970s for odour or migration control and energy-recovery purposes. The nation’s earliest LFG emission control rules were developed by California air districts in the 1980s. The federal landfill emission control rule (MSW New Source Performance Standards) was adopted in 1996. The large landfills typically operated in California ensure that most of the in-place waste is subject to local air district and federal emission control rules. CalRecycle estimated that over 94% of total WIP in landfills in California was under active LFG collection and control (CARB, 2007). Because of the mature development of LFG collection systems for control and energy recovery purposes and because of the widespread applicability of emission standards, collection efficiency is generally very high in California. With the recent implementation of the new CARB landfill surface methane emissions control rule, which requires virtually all landfills to install active LFG collection and control systems (CARB, 2010), average collection efficiency in California landfills could even be higher.
The LFG collection efficiency (82.5%) used in this study is an overall average value considered to be representative of California MSW landfills. In developing this representative collection efficiency value, factors considered include those that account for the amount of WIP in landfills that are equipped with active LFG collection systems, and the operations strategies of the LFG systems (systems operated for emissions control or for other purposes such as energy recovery and migration control).
The effect of this assumed collection efficiency on the results of this LCA is presented in Figure 6. The trend line shows the net GHG reduction as a function of collection efficiency. The point on the trend line where the two dotted lines meet shows the net GHG reduction modelled in this study at the weighted average 82.5% collection efficiency appropriate for California MSW landfills. This figure shows that the conclusion of this analysis holds for a broad range of collection efficiencies considered to be representative of typical MSW landfills in California. Even for USEPA’s very conservative default 77.5% (75% methane collection + 10% cover soil methane oxidation) total collection efficiency that is sometimes used where better information does not exist, landfilling still produces a net GHG benefit that is comparable with the GHG benefits generated by the other two alternative management options, as shown in Figure 7.
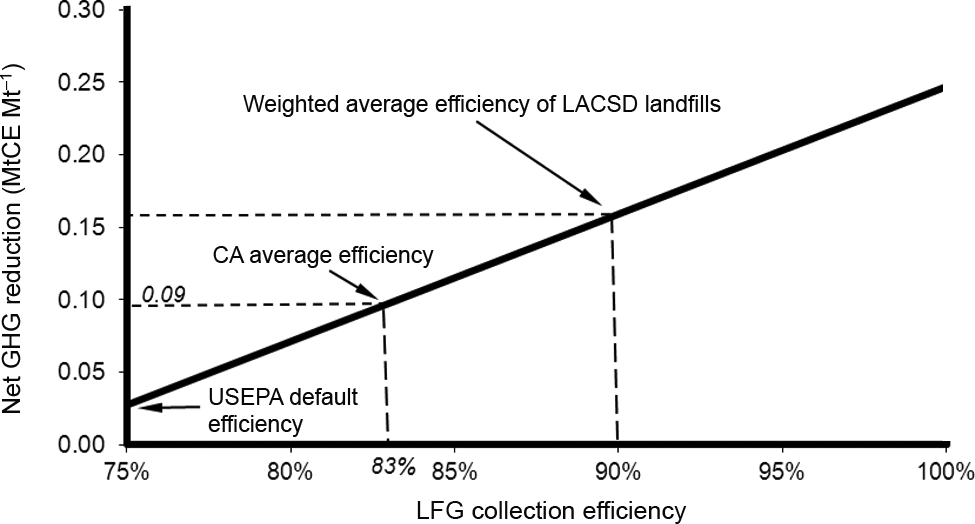
Sensitivity of GHG reduction to LFG collection efficiency.
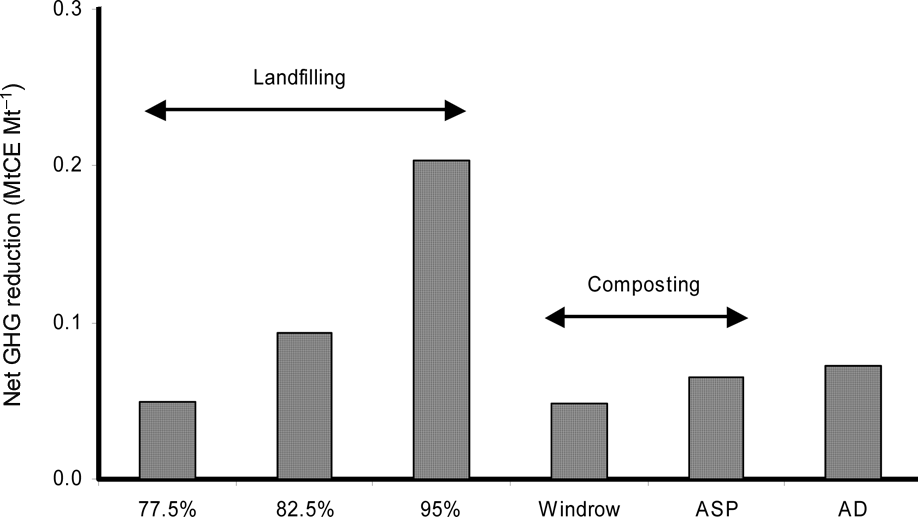
Comparison of the three OW management options (landfilling with a range of typical collection efficiency).
Effect of transportation distance
Although the transportation distance of 122 km roundtrip for composting scenario may be representative for northern portions of California, it may not be realistic for Southern California since the major compost end-market for compost products generated in Southern California regions is the agricultural areas within central California (at minimum, this would entail a 144 km one-way haul). The impacts of transportation distance on GHG reductions of organics management scenarios were investigated in this LCA study.
Figure 8 shows the effect of transportation distance on net GHG reduction for the composting scenario. As indicated by the figure, transportation distance does have a slight impact on net GHG reduction; however, this impact is very minor. In fact, even for the case of zero transportation distance (end-market for compost products is local), organics landfilling still poses a significant advantage over composting, in terms of net GHG reduction. Similar patterns also hold for the AD scenario.
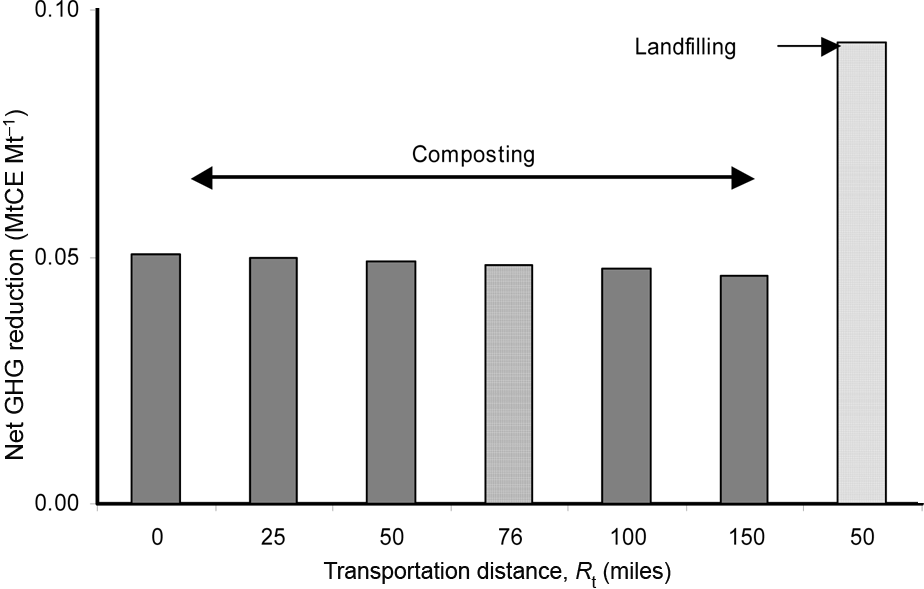
Effect of transportation distance on net GHG reduction.
Conclusions
This study confirms that all three options for organic waste management result in net reductions of GHG emissions, but it also shows that, using conservative assumptions, organics landfilling, when well-managed, can generate greater GHG reductions. Even at a fairly conservative LFG collection efficiency of 83% for California landfills, this analysis shows landfilling fares well, or is at least comparable in terms of GHG impacts and reductions, with the other two management alternatives (composting and AD). As noted in the discussion of each scenario, further research is needed in order to gain a better understanding in quantifying and assessing fugitive GHG emissions from the three management options. This is especially the case for composting and AD processes, which will require further research and more GHG data in order to enhance the scientific database and further refine LCA modelling results.
As discussed earlier, when accurate and general data and information were lacking, realistic but conservative assumptions for organics landfilling technical factors were made and California-specific information was used in this LCA. Lower ranges of LFG collection efficiencies were applied in the landfilling scenario that may underestimate the landfilling GHG reductions. An analysis of landfilling GHG impacts relative to collection efficiencies shows that the results are valid for a broad range of efficiencies, even down to the very conservative USEPA default value. Furthermore, with the implementation of CARB’s new landfill surface methane emissions control rules, landfills in California will have even higher LFG collection efficiencies, resulting in even greater net GHG reductions. Organics landfilling continues to be more advantageous over, or at least comparable with, composting and AD, in terms of net GHG benefits. It is worth noting that other environmental issues could also be affected by the systems studied in this LCA. Although landfilling appears to be better than or at least on par with composting or AD for reducing GHG emissions, it might not be, at times, the best option from a resource conservation or land use perspective. It really should be an integrated and site-specific approach when comes to analysing waste management strategies.
It is important to recognize that well-managed organics landfilling should not be excluded or discounted as an effective GHG emissions control strategy. And though waste reduction and reuse should continue to be a focus for resource sustainability, landfilling will continue to be a valuable practice while technology and viable reuse markets are developed. Although organics landfilling, especially in well-managed landfills operating in California, provides noticeably higher GHG emission reductions than composting and AD, there is no doubt that composting and AD are two very important organic waste diversion strategies that complement, rather than replace, landfilling. Further research is necessary to quantify and better understand fugitive GHG emissions associated with the unit processes employed by these organics management alternatives. Finally, this study highlights the importance of a scientific, case-specific life cycle assessment when evaluating relative GHG benefits of organics management options, and that general conclusions or policies may have negative GHG impacts.
Footnotes
Acknowledgements
The authors would like to thank the editor and two anonymous reviewers for their time and efforts in providing valuable constructive comments
Funding
This research received no specific grant from any funding agency in the public, commercial, or not-for-profit sectors.