
Abstract
The variability of the quantity and purity of the recovered materials is a serious drawback for the application of electrostatic separation technologies to the recycling of granular wastes. In a series of previous articles we have pointed out how capability and classic control chart concepts could be employed for better mastering the outcome of such processes. In the present work, the multiple exponentially weighted moving average (MEWMA) control chart is introduced and shown to be more effective than the Hotelling T2 chart for monitoring slow varying changes in the electrostatic separation of granular mixtures originating from electric and electronic equipment waste. The operation of the industrial process was simulated by using a laboratory roll-type electrostatic separator and granular samples resulting from shredded electric cable wastes. The 25 tests carried out during the observation phase enabled the calculation of the upper and lower control limits for the two control charts considered in the present study. The 11 additional tests that simulated the monitoring phase pointed out that the MEWMA chart is more effective than Hotelling’s T2 chart in detecting slow varying changes in the outcome of a process. As the reverse is true in the case of abrupt alterations of monitored process performances, simultaneous usage of the two control charts is strongly recommended. While this study focused on a specific electrostatic separation process, using the MEWMA chart together with the well known Hotelling’s T2 chart should be applicable to the statistical control of other complex processes in the field of waste processing.
Keywords
Introduction
Increased quantities of waste electric and electronic equipment (WEEE) need to be recycled every year. In the European Union, the waste stream of such obsolete equipment represents more than 107 tons per year, out of which up to 50% are metals and, roughly, 30% plastics (UNEP, 2007). The vast majority of WEEE is subject either to component recycling via disassembly, or to materials recycling via a mechanical treatment involving shredding, granulation, magnetic separation and classification (Kang and Schoenung, 2005; Veit et al., 2005). Various electrostatic separation processes (Lawver and Dyrenforth, 1973) have been developed specifically for WEEE (Dascalescu et al., 2012; Haga et al., 1995; Harue Yamane et al., 2011; Iuga et al., 2001; Li et al, 2007; ).
The variability of the quantity and purity of the recovered materials is a serious drawback for each such application. The common cause of variation is the naturally occurring oscillations of system response around a long-term average value due to inherent fluctuations of process parameters, such as composition of the treated wastes, feed-rate or ambient conditions. Special cause variation is typically due to some problem in the system, and statistic process control (SPC) proved its efficiency in detecting them and ensuring stable performances.
Widely used to ensure the quality of the products in the automotive, aeronautical, chemical and pharmaceutical industries, SPC detects non-conformities by sampling (Grant, 1988; Montgomery, 1999). The mean and the range of the measured process characteristics are calculated for each sample and then plotted on graphs called control charts. In this way, process evolution is visualized. The frequency of sampling is chosen so that if special cause variation is present, the control charts can identify it. The statistical analysis of sample characteristics suggests the adjustments to be made to the process in order to keep it within specifications (Ott, 1990). The charts facilitate the process control in order to maintain or improve its capability, i.e. reduce the variability, so that to constantly respect the quality requirements. In a series of previous articles (Medles et al., 2009; Senouci et al., 2009, 2010) we have pointed out how capability and control chart concepts could be applied to electrostatic separation employed in the recycling industry. Defined as the selective sorting of charged or polarized bodies under the action of electric field forces (Ralston, 1961), the electrostatic separation is a continuous process–the outcome of which is a function of numerous factors, including flow-rate, granule size, electrode system configuration, high-voltage level, etc. (Dascalescu et al., 2001; Li et al., 2008a, 2008b; Medles et al., 2007; Tilmatine et al., 2004). Thus, in a classic electrostatic separator (Dascalescu et al., 1995), the granular materials to be sorted (such as shredded WEEE) are fed onto the surface of a grounded roll electrode that rotates at a controlled speed. The electric field is produced between this roll and one, or several, electrodes connected to a direct current (DC) high voltage supply (Figure 1). The conducting (metals) and insulating (plastics) particles get charges of opposite polarities, are attracted by different electrodes and fall in distinct compartments of the collector.
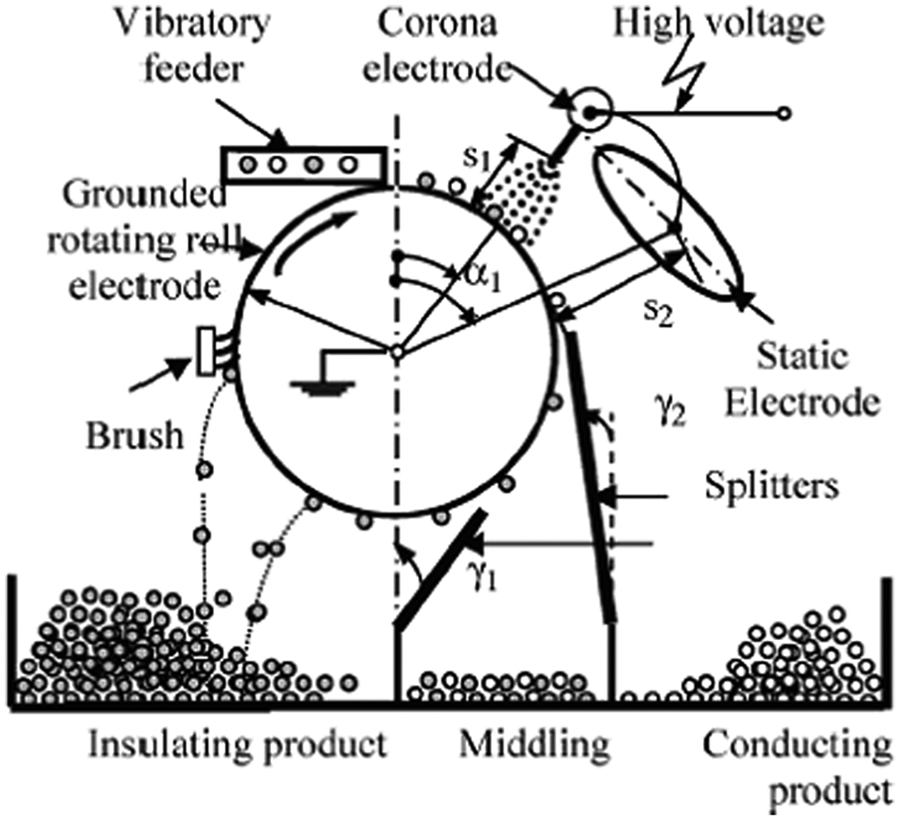
Variables of an electrostatic separation process: high-voltage level U; roll-speed n; angular α1 and radial s1 position of the corona electrode; angular α2 and radial s2 position of the electrostatic electrode; angular positions γ1, 2 of the splitters.
Electrostatic separation is a complex process that requires monitoring of several output variables, and this is a major obstacle against the industrial application of SPC techniques. For instance, the separation of copper from electric cable wastes is satisfactory when the mass of middling is small, and the grade of both metal and insulating products is high (Senouci et al., 2010). Monitoring of each criterion independently by distinct control charts has the advantage of simplicity, but it is not the most effective (Medles et al., 2009; Senouci et al., 2010). Superimposing univariate charts is not an appropriate solution when the variables are correlated, as is the case with the electrostatic separation processes. As demonstrated in a recent article (Senouci et al., 2009), the use of a multivariate SPC technique (Alt and Smith, 1988), namely the Hotelling’s T2 chart, may overcome this limitation by monitoring several variables simultaneously and taking into account the correlations that exist between them.
The present article introduces a new SPC chart called multiple exponentially weighted moving average (MEWMA) (Lowry et al., 1992; Maravelakis et al., 2004). The study aims to compare it with Hotelling’s T2 chart to determine which of them is the most effective in mastering the variability of the electrostatic separation process of granular mixtures originating from WEEE.
Theoretical aspects
Control charting is a two-phase activity. The first phase in constructing control charts is to analyze data from a process that is under control. Based on this analysis it is possible to estimate the control parameters that will be used subsequently for ongoing monitoring of the process. During this second phase the control charts serve to test whether the process remains in control or not.
Hotelling T2 chart
In an article published in 1931, Hotelling proposed to calculate the weighted distance from each measured point to the target (i.e. the process response under stable conditions) and compare it with a control limit. Hotelling’s T2 statistic (Alt and Smith, 1988; Bersimis et al., 2005) is a measure that accounts for the covariance structure of a multivariate normal distribution. Covariance is the measure of how much the variables change together, as distinct from variance, which means how much a single variable changes. The mean value xjī͞, the variance Sjj and the covariance Sjh of each output variable j were calculated for each subgroup i of a set of m experiments (Maravelakis et al., 2002):

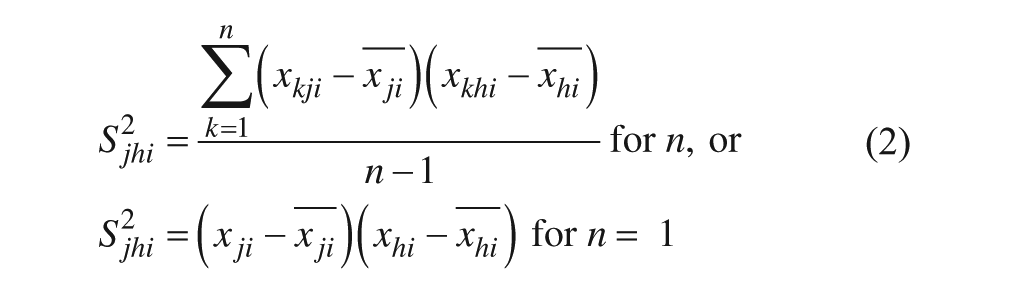

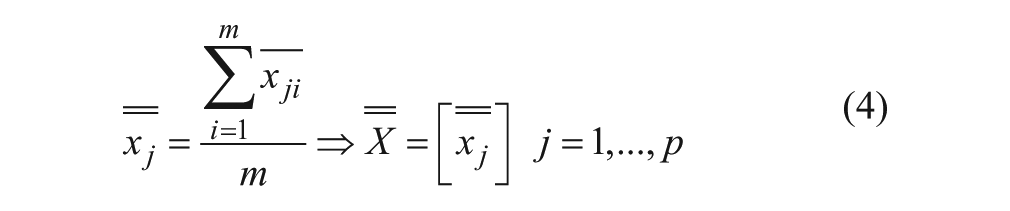
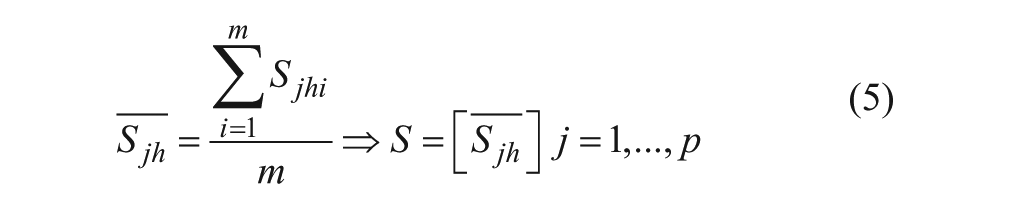
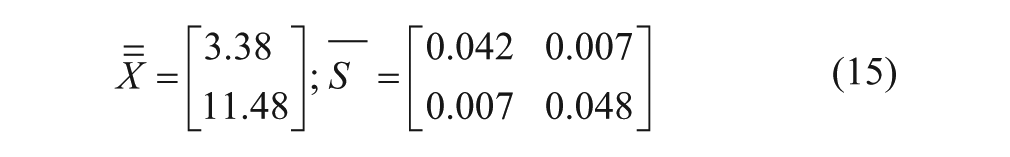
where n is the sample size and p is the number of variables (in the present study: n = 1 and p = 2). The results computed for the m = 25 sets of experiments were then employed for setting the average vector X and the covariance matrix S:
Thus, it was possible to compute the scalar Ti2 for each subgroup i in a set of m subgroups of an in-control historical data set for p variables, using the formula:

where:
The limits of the control chart are distinctly computed for the two phases of SPC application. In the case n = 1, which of interest to the present study, for the phase 1 (observation), the upper control limit (UCL) is calculated for m samples, p characteristics and a risk α, using the β distribution (Art and Smith, 1988; Pillet, 2009):

For phase 2 (monitoring) the computation is made using Snedecor’s distribution F:

During both phases, the lower control limit is:

MEWMA chart
The first step in the construction of MEWMA control charts (Bodden et al., 1999; Linderman et al., 2000; Lowry et al., 1992) is to compute the exponentially weighted moving average for each subgroup i of a set of m experiments:

where 0 < λ < 1 and Z0 = 0.
The principle of the EWMA chart is to calculate for each sample the static Ti2 and representing this value on a control chart.

The covariance matrix is calculated by the following equation:

For the samples of high the covariance matrix converges asymptotically to the expression:

The upper and lower limits of the MEWMA chart are functions of the number of variables p, the coefficient λ and the risk α. They are tabulated in (Pillet, 2009).
Experimental study
The operation of the industrial process was simulated by using a laboratory roll-type electrostatic separator [model EHTP (25, 36) 111-15, Carpco Inc., Jacksonville, FL, USA] which had been configured as shown in Figure 1.
The variables of the experimental study were constant for all the tests (Medles et al., 2007):
high-voltage U = 28 kV;
roll speed n = 75 rev/min;
angular (α1 = 30°) and radial (d1 = 40 mm) positions of the corona electrode;
angular (α2 = 70°) and radial (d2 = 70 mm) positions of the static electrode;
angular positions γ1 = 30° and γ2 = −6° of the collector splitters;
ambient conditions: 20.2–22.1°C; RH = 27.5−30.3%.
Observation phase
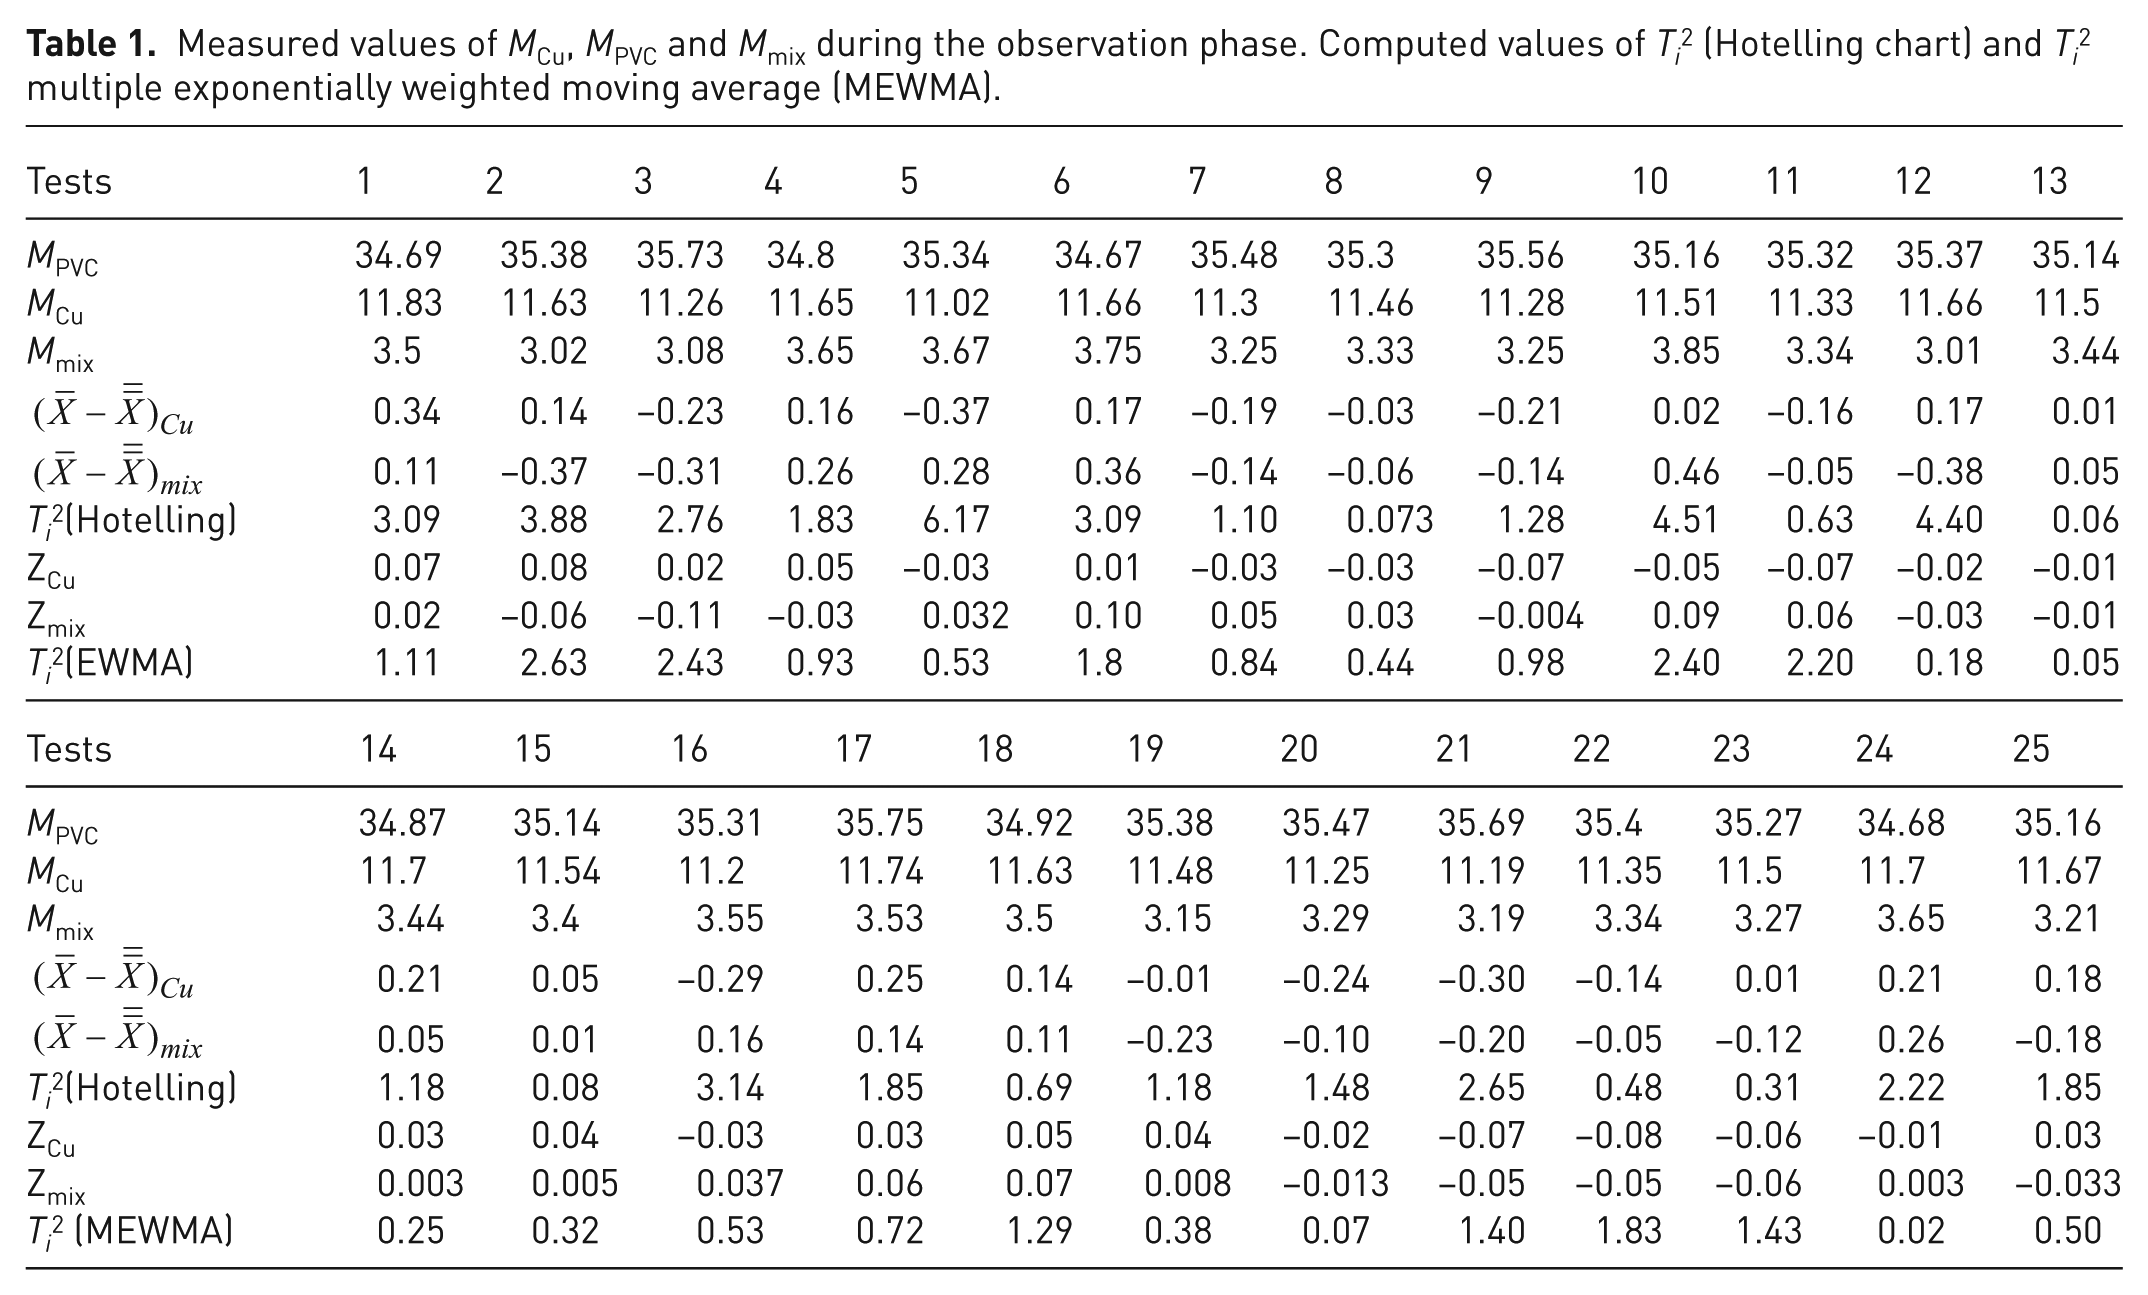
During the observation phase, 25 tests were carried out on granular samples resulting from shredded electric cable wastes (Figure 2). The mass of each sample was 50 g [12 g of copper + 20 g of polyvinylchloride (PVC); grain size between 1 and 3 mm]. The masses of copper (MCu), PVC (MPVC) and middling (Mmix) products were measured with an electronic scale (resolution: 0.01 g) and are given in Table 1.
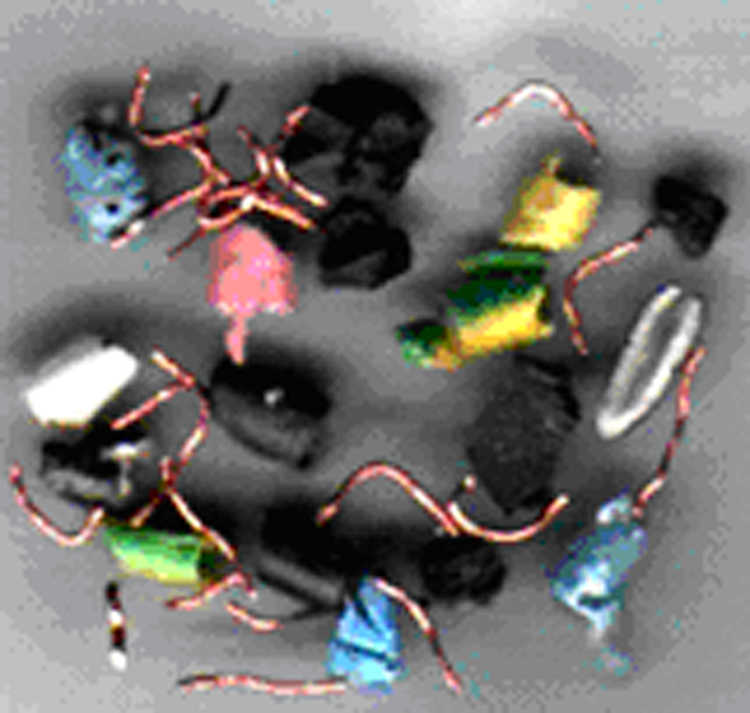
Granular sample (grain size: 1–3 mm).
Measured values of MCu, MPVC and Mmix during the observation phase. Computed values of Ti2 (Hotelling chart) and Ti2 multiple exponentially weighted moving average (MEWMA).
Hotelling T2 control chart
The study over the operation phase (under control, 25 tests) pointed out the correlation existing between the measured values of conducting and middling products. The coefficient of correlation r was:

From these observations it was possible to estimate with (4) and (5) the mean and the covariance matrixes:
The reverse of the covariance matrix is:

With m = 25, p = 2, α = 0.05, the distribution βα,p/2,(m-p-1)/2 = 0.43 (Pillet, 2009), the limits of Hotelling’s T2 chart for the observation phase are:

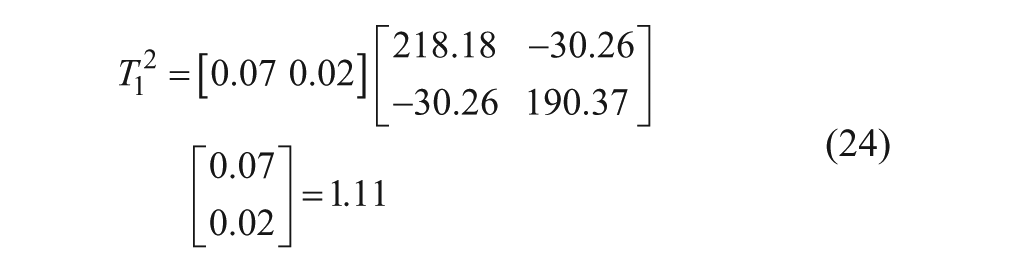
The values of the Ti2 given by equation (6) can be than represented on the control chart. For example, the first point on this chart is calculated as follows:
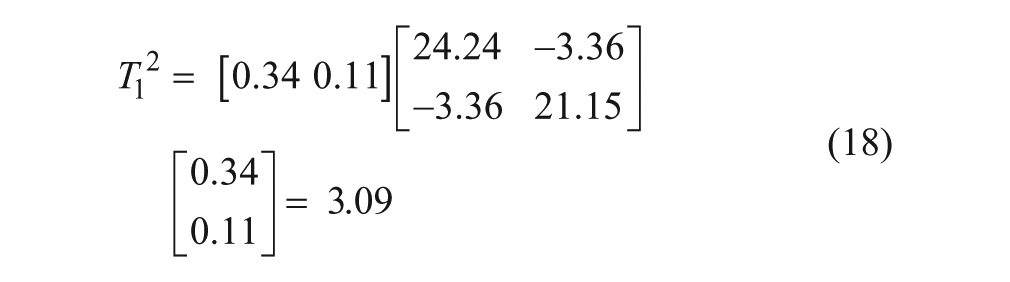
The other values of the Ti2 in Table 1 are calculated in the same manner and represented in Figure 3.
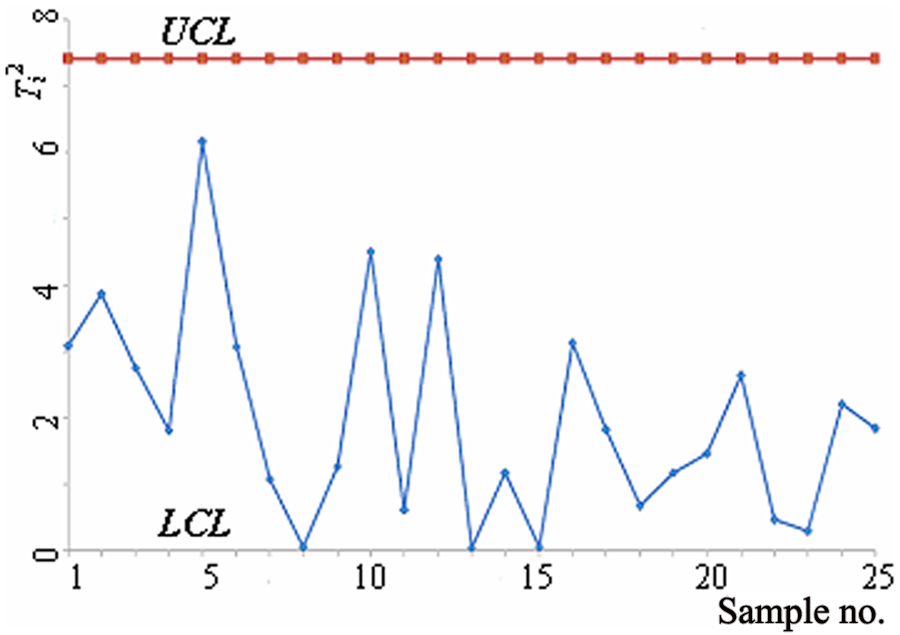
Representation of the results of the 25 experiments for the observation phase, given in Table 1, using a multivariate Hotelling’s T2 chart.
MEWMA control chart
Based on the data in Table 1, with λ = 0.2, the covariance matrix given by equation (13) for the MEWMA control chart is:

By inverting this matrix we have:

With p = 2, λ = 0.2, and α = 0.05, the limits of the control chart are (Pillet, 2009):

The next step in mapping the MEWMA chart (observation phase) is the computation of the elements of the Z1 matrix, using equation (10) with λ = 0.2. For the first point on the chart (i = 1; Zi - 1 = Z0 = 0), the measured values were X11 = 0.34 for Cu and X12 = 0.11 for the middling product, so that:

and

Thus:
The other 24 values of the Ti2 are computed in a similar way and grouped in the Table 1. The corresponding MEWMA can be examined in Figure 4.
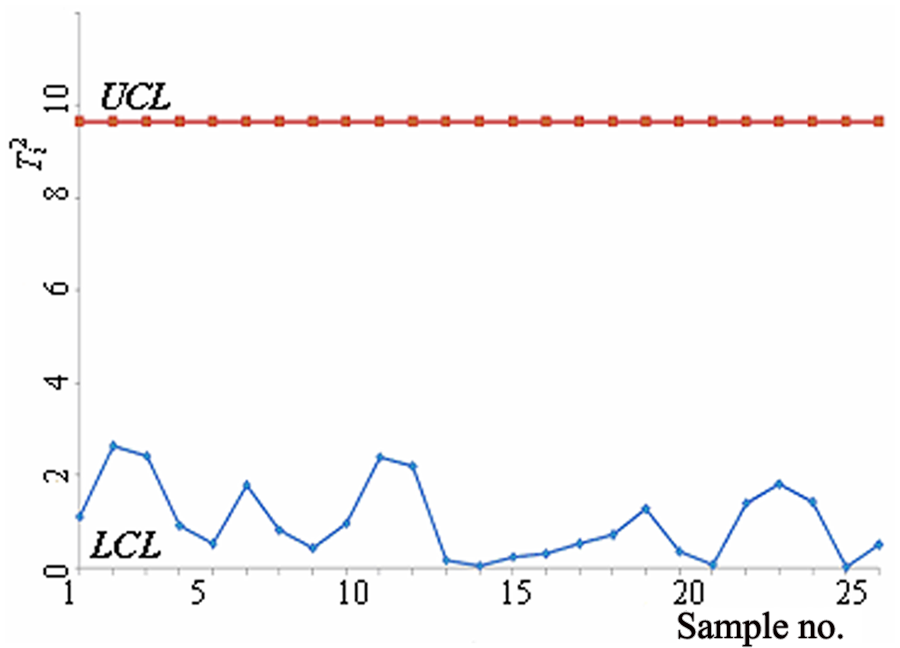
Representation of the results of the 25 experiments for the observation phase, given in Table 1, using a MEWMA chart.
The analysis of graphs for the 25 separation tests performed during the observation period shows that the electrostatic separator is under control. The parameters of control charts can be used as standard values and are used subsequently for monitoring the electrostatic separation process in real time.
Monitoring phase
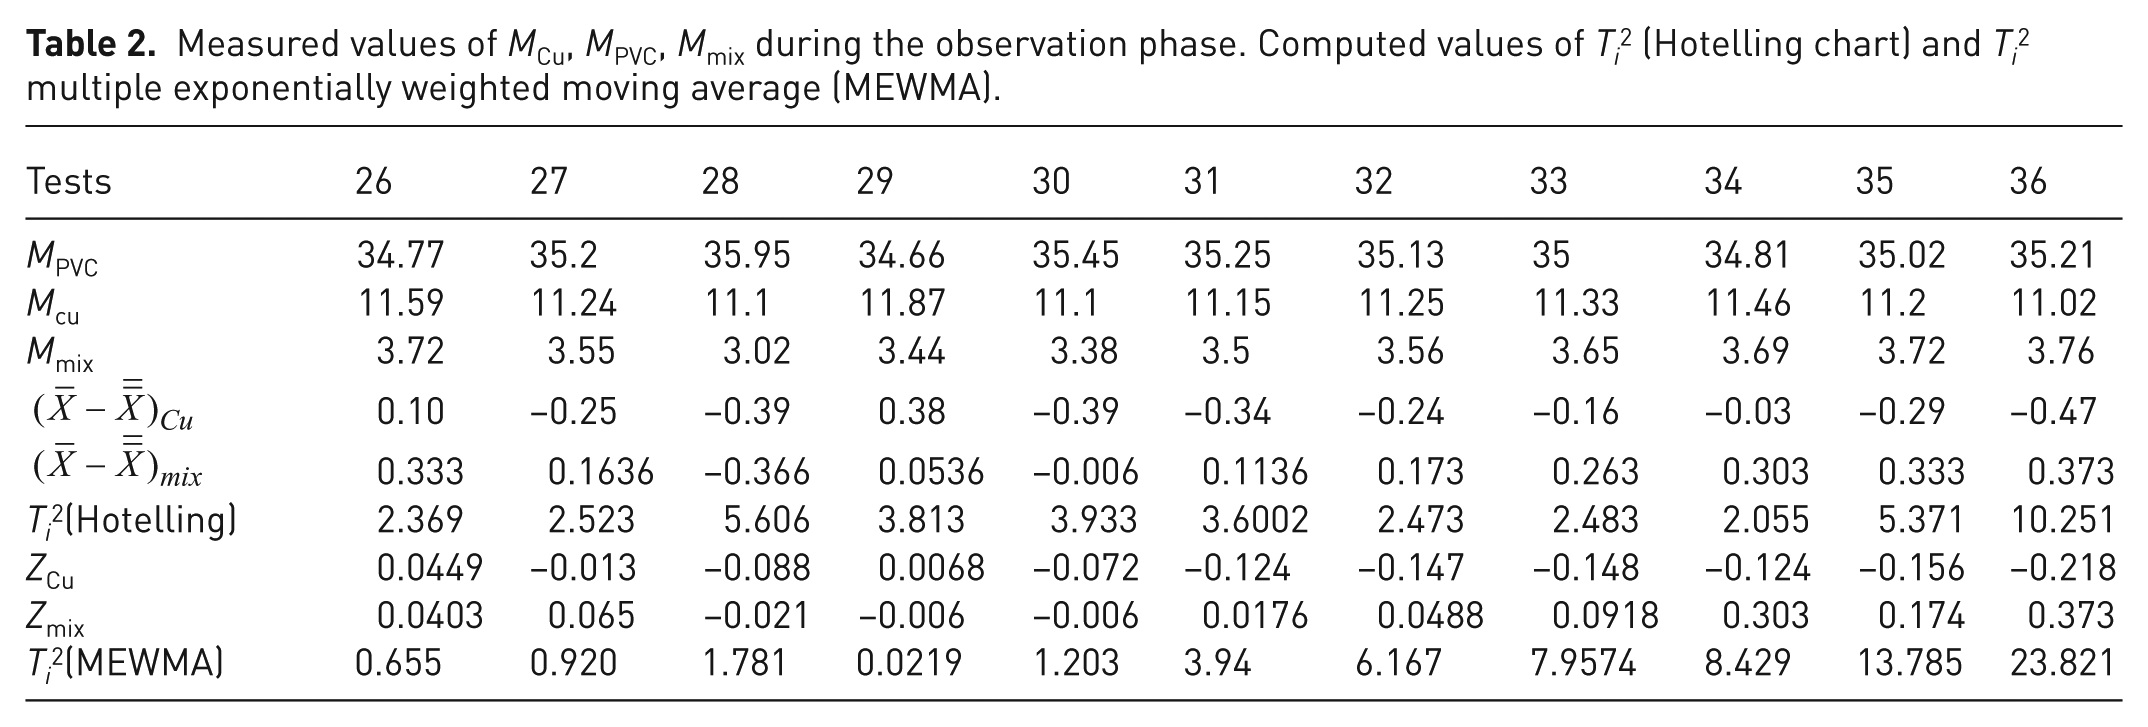
When control charts are used to monitor a process. the objective is to identify any change in the outcome. During this phase, 11 additional tests of electrostatic separation were conducted and the voltage decreased gradually from 28 kV to 27 kV, starting from the 30th test. The results of these tests are given in Table 2.
Measured values of MCu, MPVC, Mmix during the observation phase. Computed values of Ti2 (Hotelling chart) and Ti 2 multiple exponentially weighted moving average (MEWMA).
Hotelling’s T2 control chart
With m = 25, p = 2, α = 0.05 and the distribution Fα,p,m-p = 3.42 (Pillet, 2009), the limits of Hotelling’s T2 chart for the monitoring phase computed with equations (8) and (9) are:
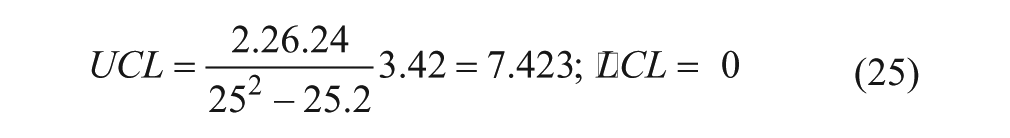
The Hotelling’s T 2 control chart for the 11 tests of the monitoring phase is shown in Figure 5.
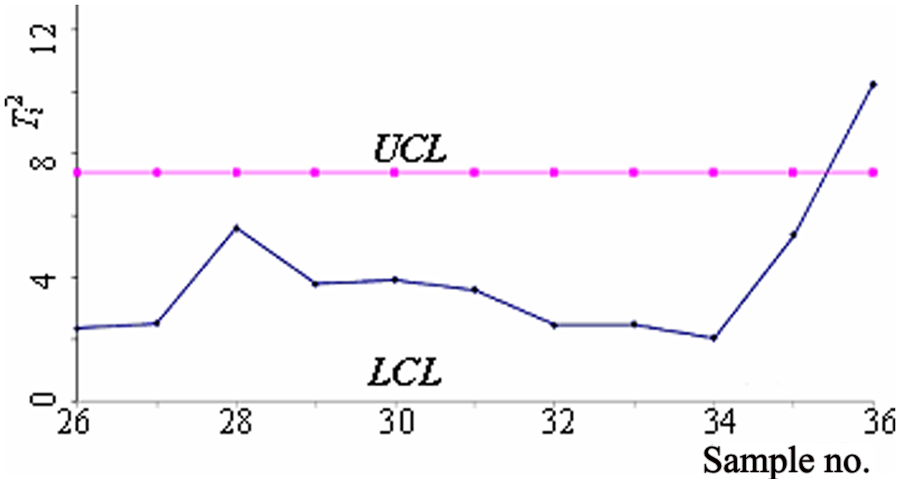
Representation of the results of the 11 ‘monitoring’ experiments given in Table 2, using a multivariate Hotelling’s T2 chart.
MEWMA control chart
The MEWMA values of the Ti2 for the 11 additional tests, with λ = 0.2, are given in Table 2 and represented in Figure 6.
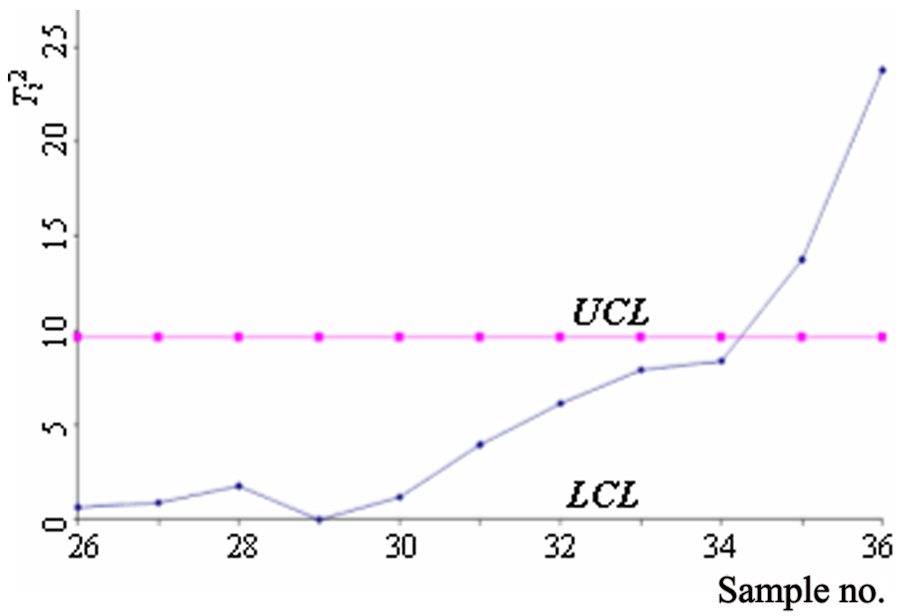
Representation of the results of the 11 ‘monitoring’ experiments given in Table 2, using a MEWMA chart.
The gradual decrease of the applied high-voltage is better between the 30th and 34th test reflected by the MEWMA chart. The fault is detected at the 35th test contrary to Hotteling’ T2 chart, which is out of control only at the 36th test.
Bringing the process back under control
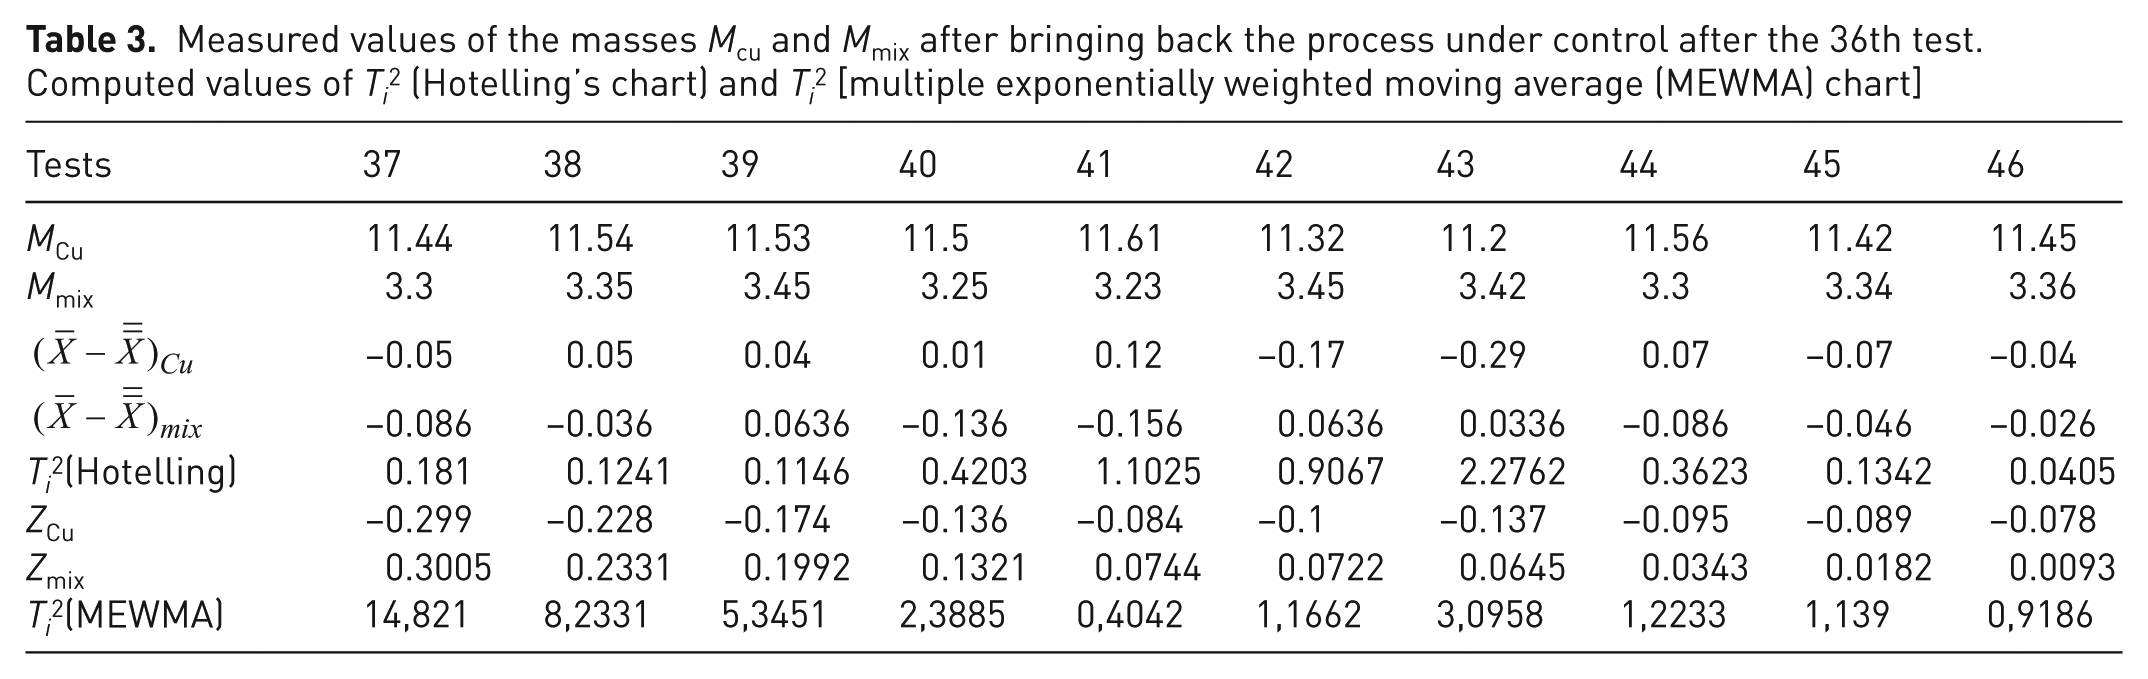
After fault detection, the high-voltage was set back to the optimum value (28 kV) and 10 additional tests of electrostatic separation were carried out. The results are given in Table 3, which contains also the calculated values of the two control charts that are represented in Figures 7 and 8.
Measured values of the masses Mcu and Mmix after bringing back the process under control after the 36th test. Computed values of Ti2 (Hotelling’s chart) and Ti2 [multiple exponentially weighted moving average (MEWMA) chart]
Representation of the results of the 10 experiments performed after bringing back the process under control (tests 37–46 in Table 3), using a multivariate Hotelling’s T2 chart.
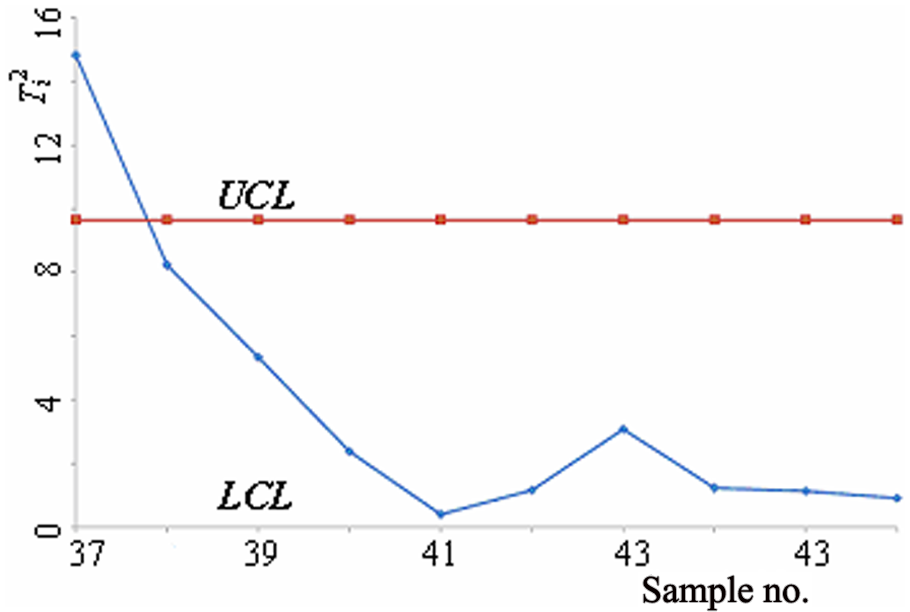
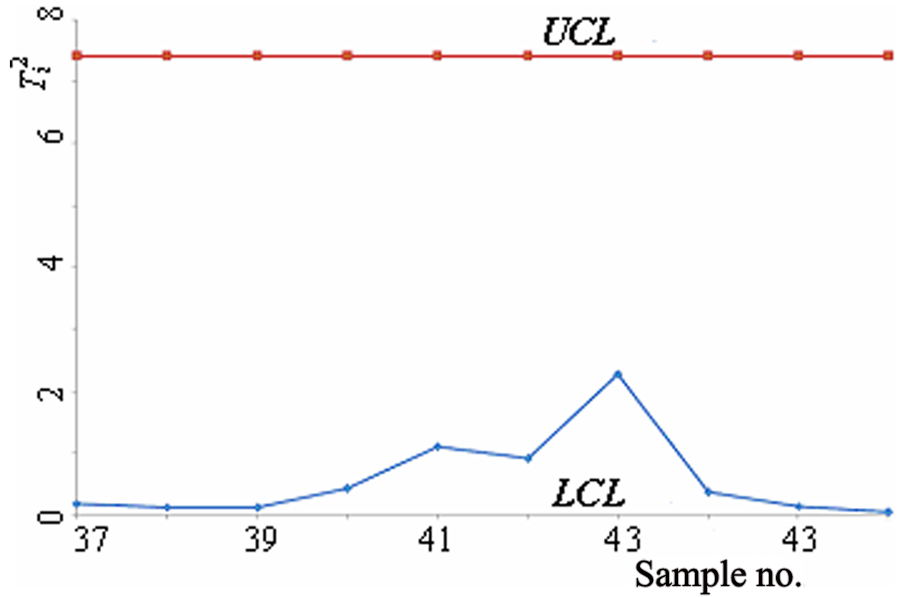
Representation of the results of the 10 experiments performed after bringing back the process under control (tests 37–46 in Table 3), using a MEWMA chart.
The graph of Hotteling’s T2chart (Figure 7) points out that the process is under control immediately after fault detection. Analysis of MEWMA control chart (Figure 8) shows that the value of T372 test is beyond the UCL and the graph has a decreasing trend for a number of tests (37th–40th test).
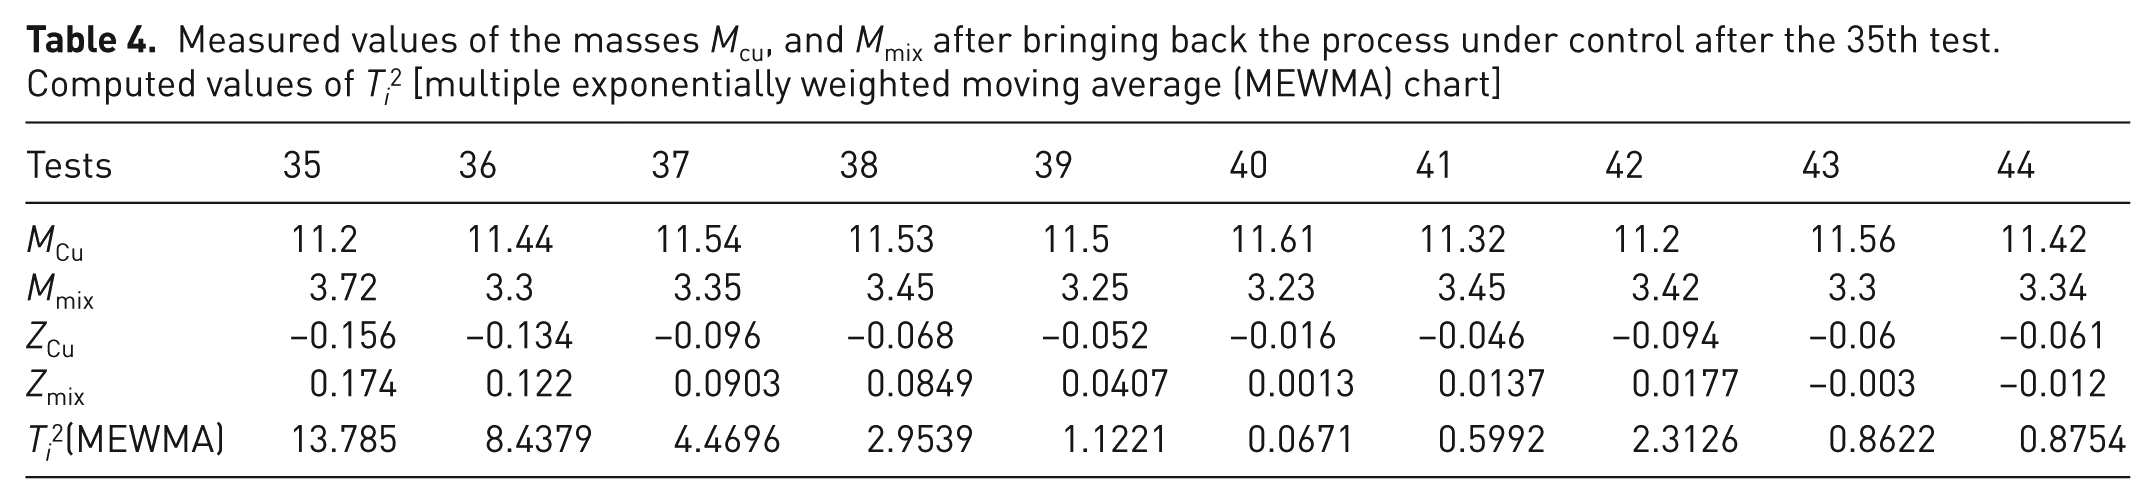
In practice, if using the MEWMA control chart, the corrective action is taken immediately after the fault detection at the 35th test. In that case, the 36th test in Table 2 should be eliminated and a different MEWMA chart can be computed from experimental results given in Table 4. The corresponding MEWMA chart is shown in Figure 9. The graph shows that the process is controlled directly after resetting the high-voltage at 28 kV.
Measured values of the masses Mcu, and Mmix after bringing back the process under control after the 35th test. Computed values of Ti2 [multiple exponentially weighted moving average (MEWMA) chart]
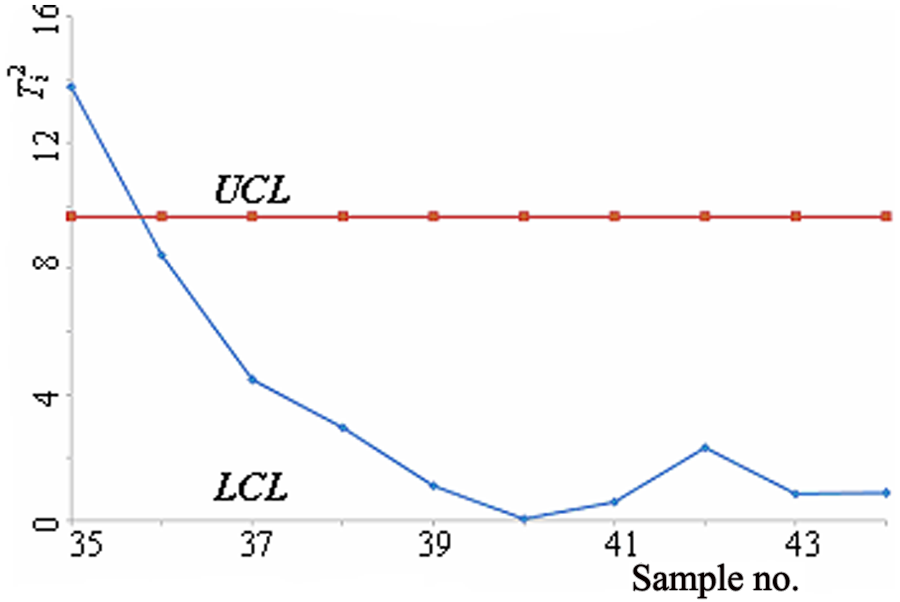
Representation of the results of 10 experiments after bringing back the process under control after the 35th test, using a MEWMA chart (Table 4).
In case of an abrupt reduction of the high-voltage from 28 kV to 27 kV at the 27th test, the aspect of the two charts would be totally different. Unsurprisingly, only the Hotelling’s T2 chart would detect it (Figure 10). The abnormal situation (the 27th test) provokes only a ‘bump’ in the MEWMA chart (Figure 11), which is known to be more appropriate for monitoring slow changes of the output variables. This may be a handicap particularly for the interpretation of the points on the MEWMA chart right after bringing back the process under control. Indeed, as it can be seen in Figures 8 and 9, these points—when calculated with the standard formulas given in the theoretical section of this article—might still indicate a process that is out of control. To remedy this problem and adjust the MEWMA, we propose to set the value of Zi-1 to 0 after each fault detection. In this way, the value of Zi calculated in the point i right after bringing back the process under control will not be affected by the out of control value at the moment (i – 1).
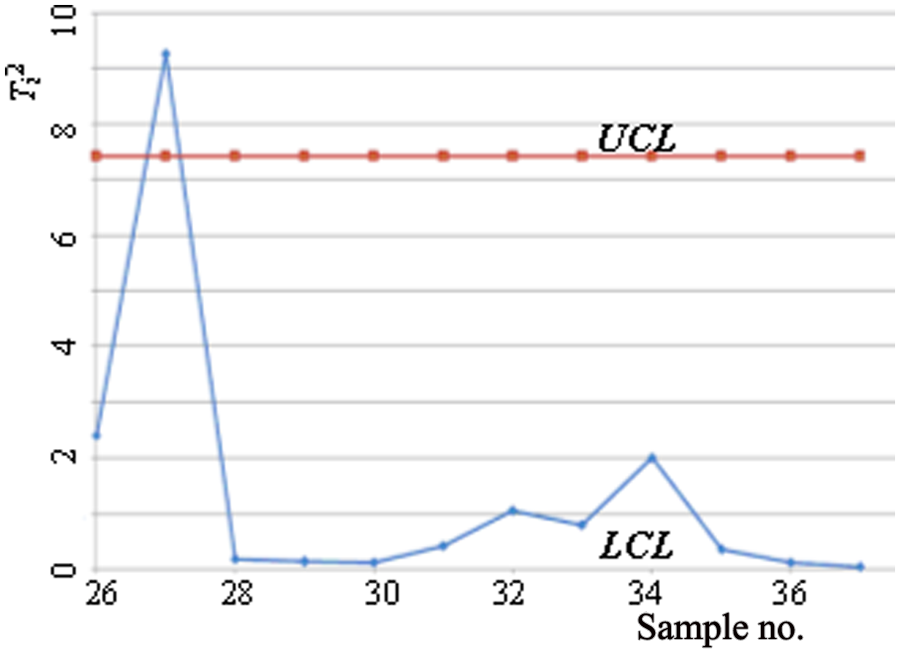
Representation of the results of the 10 experiments performed after bringing back the process under control after an abrupt default at the 27th test, using a multivariate Hotelling’s T2 chart.
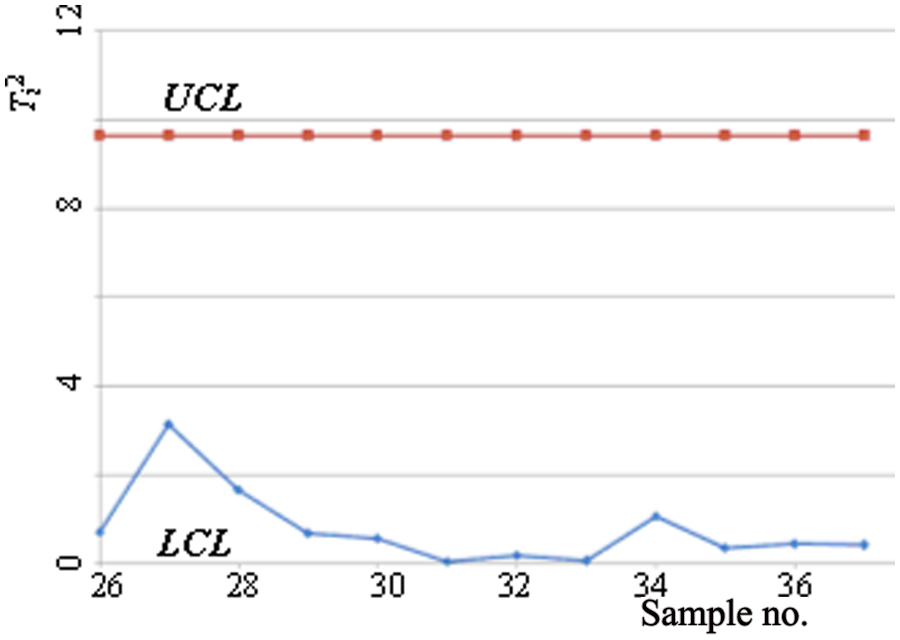
Representation of the results of the 10 experiments performed after bringing back the process under control after an abrupt default at the 27th test, using a MEWMA chart.
Conclusions
A MEWMA chart is more effective than Hotelling’s T2chart in detecting slow varying changes in the outcome of a process. The reverse is true in the case of abrupt alterations of monitored process performances. As both types of situations may occur during en electrostatic separation process, simultaneous usage of the two control charts is strongly recommended.
A simple EXCEL programme can perform the computation and plot both graphs. This control strategy is likely to be beneficial to other processes in the recycling industry, whenever slow and fast degradation of product quality are equally detrimental.
Footnotes
Funding
This research received no specific grant from any funding agency in the public, commercial, or not-for profit sectors