
Abstract
This article demonstrates how decision-makers can be guided in the process of defining performance target values in the balanced scorecard system. We apply a method based on sensitivity analysis with Monte Carlo simulation to the municipal solid waste management system in Loulé Municipality (Portugal). The method includes two steps: sensitivity analysis of performance indicators to identify those performance indicators with the highest impact on the balanced scorecard model outcomes; and sensitivity analysis of the target values for the previously identified performance indicators. Sensitivity analysis shows that four strategic objectives (IPP1: Comply with the national waste strategy; IPP4: Reduce nonrenewable resources and greenhouse gases; IPP5: Optimize the life-cycle of waste; and FP1: Meet and optimize the budget) alone contribute 99.7% of the variability in overall balanced scorecard value. Thus, these strategic objectives had a much stronger impact on the estimated balanced scorecard outcome than did others, with the IPP1 and the IPP4 accounting for over 55% and 22% of the variance in overall balanced scorecard value, respectively. The remaining performance indicators contribute only marginally. In addition, a change in the value of a single indicator’s target value made the overall balanced scorecard value change by as much as 18%. This may lead to involuntarily biased decisions by organizations regarding performance target-setting, if not prevented with the help of methods such as that proposed and applied in this study.
Introduction
The production of waste is inherent to economic development, and continuous economic growth presents challenges to the management of sustainable resources. The development of sustainable systems for waste management faces various difficulties, including public perception and acceptance, the minimization of environmental impacts and operational costs, and the complexity of the systems themselves (Pires et al., 2011; Salhofer and Isaac, 2002; Seadon, 2010). Thus, an understanding of the drivers that affect waste management systems is crucial if progress is to be made in the implementation of sustainable systems (Federico et al., 2009; Wilson, 2007).
The strategic planning designed by management tools such as ISO 9001 (2008), ISO 14001 (2004), and OHSAS 18001 (2007) help in the definition of strategies in an organization regarding aspects of sustainable management that include service quality, environment, and health and safety at work, respectively. These management tools are essential in well-organized and efficient waste management systems responsible for operations of waste deposition and collection, final deposition in landfills, recycling, valorization (the transformation of waste/biomass to valuable materials and energy), and public awareness.
Various integrated management systems (IMSs) have been proposed to combine similar aspects required in management tools, to simplify procedures, to avoid unnecessary duplication or conflict of requirements, and to reduce bureaucracy and costs (Trammer, 1996). The implementation of an IMS involves specific activities, such as planning, documentation, implementation, audit, and review, which together act as a cycle of continuous improvement based on the methodology known as the Deming Cycle or Plan-Do-Check-Act (PDCA) (Deming, 1986; Moen and Norman, 2010; Sokovic and Pavletic, 2007; Sokovic et al., 2010). Therefore, in an IMS, a systematic and continuous plan needs to be developed (Efendioglu and Karabulut, 2010; Kriemadis and Theakou, 2007).
With this objective, the balanced scorecard (BSC) has been proposed as an IMS that enhances the analysis of processes and promotes a balance between objectives, indicators, targets, and action plans (Kaplan and Norton, 1992, 1996). The BSC is a powerful management tool for the integration of waste management and sustainable use of resources through a diagnosis based on performance indicators (PIs), by providing trends and presenting possible solutions to identified problems. The evaluation of performance through the BSC provides management in a simple and practical way, because it promotes the selection of relevant PIs for each perspective (thereby eliminating excessive information) and compares them with pre-set targets (Irwin, 2002; Souza and Cordeiro, 2010). Such information should give an overview of the performance of a waste service and thereby constitutes an important aspect of support for decision-makers.
However, Kaplan and Norton (1992, 1996) do not provide clear guidance on setting targets and assigning weights to each target. The BSC is based on targets and weights, where consensus on cause–effect is important in implementing a successful BSC system. According to Herath et al. (2010), reaching consensus on the weights and targets to assign to each performance measure represents a challenge for top management and divisional managers. Recently, some governmental agencies have published general documents about setting targets for the Public Administration Service (PAS), where targets are considered important management tools for driving improvements in service delivery (Commonwealth of Australia, 2004; Crown 2003; DTF, 2004). Targets should represent the main aims and priorities of an organization, and should provide a focus on delivering results and act as a basis for monitoring performance. However, these documents do not define the specific methodologies required for optimizing quantitative targets. Although automatic methods are neither feasible nor advisable, measurements based on performance indices, such as used in the BSC tool, may assist better decision-making.
This article continues a line of research that applies the BSC integrated management model to municipal solid waste (MSW) systems, and the initial results of the application have been recently published (Mendes et al., 2012, 2013). In the 2012 study, the suitability of the BSC tool was demonstrated for the PASs needs regarding management of the waste sector. In the 2013 study, the PIs were selected, prioritized, and tested, and then applied in the BSC management tool to the particular municipal service responsible for the management of MSW in a tourist area (the municipality of Loulé, southern Portugal). However, in those studies, we discovered that the monitoring and evaluation of the model over time demonstrated a need to adopt methods for helping decision-makers define target values. Therefore, the objective of this present article is to contribute to meeting this need, which we do by conducting sensitivity analysis using Monte Carlo simulation methods to help in the process of defining management targets.
Methods
Case study
The case study locality (Loulé Municipality in southern Portugal) is the same as used in the earlier studies (Mendes et al., 2012, 2013). The BSC tool was applied to the municipal waste deposition and collection systems of Loulé. The MSW production in this municipality is about 47,000 t year−1 for about 70,600 residents (INE, 2011). The municipality’s waste management system covers 100% of the territory, including solid wastes and recyclable materials. MSW management systems in Portugal are the responsibility of the PAS. Therefore, deposition containers, collection, and transport of municipal mixed solid wastes (residential, commercial, and institutional) to the controlled landfill is a responsibility of the municipality, while deposition containers and collection of recyclables (article, glass, plastic, metal and batteries, and green wastes; theses wastes are in specific containers so are not a part of mixed solid wastes) is made by an independent state-owned company (ALGAR, S.A.) (Mendes et al., 2013). The division responsible for wastes in this municipality used various management and planning tools including the Integrated Quality and Environmental Management System (IQEMS) in accordance with the requirements of ISO 9001 and 14001, and the Hygiene and Safety at Work Management System (HSWMS) in accordance with the reference standard OHSAS 18001/NP4397. The application of the Individual Performance Appraisal is also an obligation in the PAS, and is therefore a system integrated into the management of human resources of the municipality’s administration.
The Portuguese entity responsible for economic regulation and quality of the waste management service (ERSAR) has a key role on general effects of regulation and monitor strategic plans, presenting a methodology to evaluate the services provided by management entities subject to regulation based on PI systems. Therefore, ERSAR: (i) identifies and specifies all components from the evaluation system; (ii) defines the quality service indicators that should be used; and (iii) specifies assessment procedures by defining the information needed, the calculation of indicators, their interpretation, and comparative analysis, in a benchmarking perspective (Alegre et al., 2010). Each management entity is responsible for the preparation and provision of data to ERSAR needed to determine PIs. The collection of internal and external data made by each management entity is followed by a self-assessment of data quality in terms of reliability and accuracy of the information source (Alegre et al., 2010).
The BSC tool as an IMS
In this study, the original BSC hierarchy of perspectives hierarchy was adopted, but with adaptions for the public sector. Four perspectives are included, namely clients, internal process, learning and growth, and financial (Kaplan and Norton, 1992). This hierarchical structure is suitable for the reality of the PAS, where meeting the needs of the population plays the major role and finance is the constraint that drives the activities.
The implementation of an IMS, such as the BSC, implies that corporate strategy and business are clear and properly defined, and are supported by the organization’s mission, vision, and values. The design of this system provides a structure that supports the basic elements of the strategy: perspectives that decompose strategy into financial, customer, internal processes, and learning and development components; objectives that align the strategic intentions with a single perspective; indicators that measure and evaluate performance, linking objectives and targets; initiatives that deal with action programmes, investments, or projects that lead to strategic performance; and cause–effect relationships between the BSC strategic objectives and its key processes. The cause–effect relationships between indicators should be identified so that a value chain can be created between the four perspectives of analysis that characterize the organization’s strategy. The BSC methodology is based on the formulation of strategy and implementation, incorporating the following steps (Mendes et al., 2012).
Vision and mission: these represent the top function in the BSC system structure, and comprise the element that defines the operational area. In this case, the Clients perspective occupied the leading position because greater importance is placed in the PAS on serving the needs of society, compared with the priorities of the private sector.
SWOT (strengths, weaknesses, opportunities, and threats) analysis: a tool used in the preliminary stages of strategic planning that led to the diagnosis and interpretation of the organization’s characteristics, identifying its critical success factors (CSFs), and helping in the formulation of the strategy.
Strategic map: through the CFSs, strategic priorities/vectors were identified and operationalized into strategic objectives framed in the perspectives. The interconnection of all perspectives and objectives was performed by generating a strategy map based on a cognitive system of causality between objectives showing cause–effect relationships.
Definition of objectives and indicators: indicators were identified for monitoring and evaluating the system in an integrated form, and were analysed with respect to their utility and relevance for controlling the strategic objectives. Weights were subsequently assigned to the objectives and indicators.
Definition of targets: targets were defined to assess the indicators and were based on historical data about the organization’s structural reality. Performance levels were then formulated by establishing ranges of values with applied tolerance levels.
Action plans: actions, plans, or initiatives were developed as a result of the analysis of the performance levels. These were developed to overcome weaknesses and to pursue continuous improvement towards organizational excellence.
The model structure adopted is shown in Figure 1, in which the BSC enhances the analysis of defined processes, goals, targets, indicators, and action plans in several perspectives, including in the areas of quality, environment, and safety in response to the various requirements of the normative references, namely ISO 9001, ISO 14001, and OHSAS 18001.
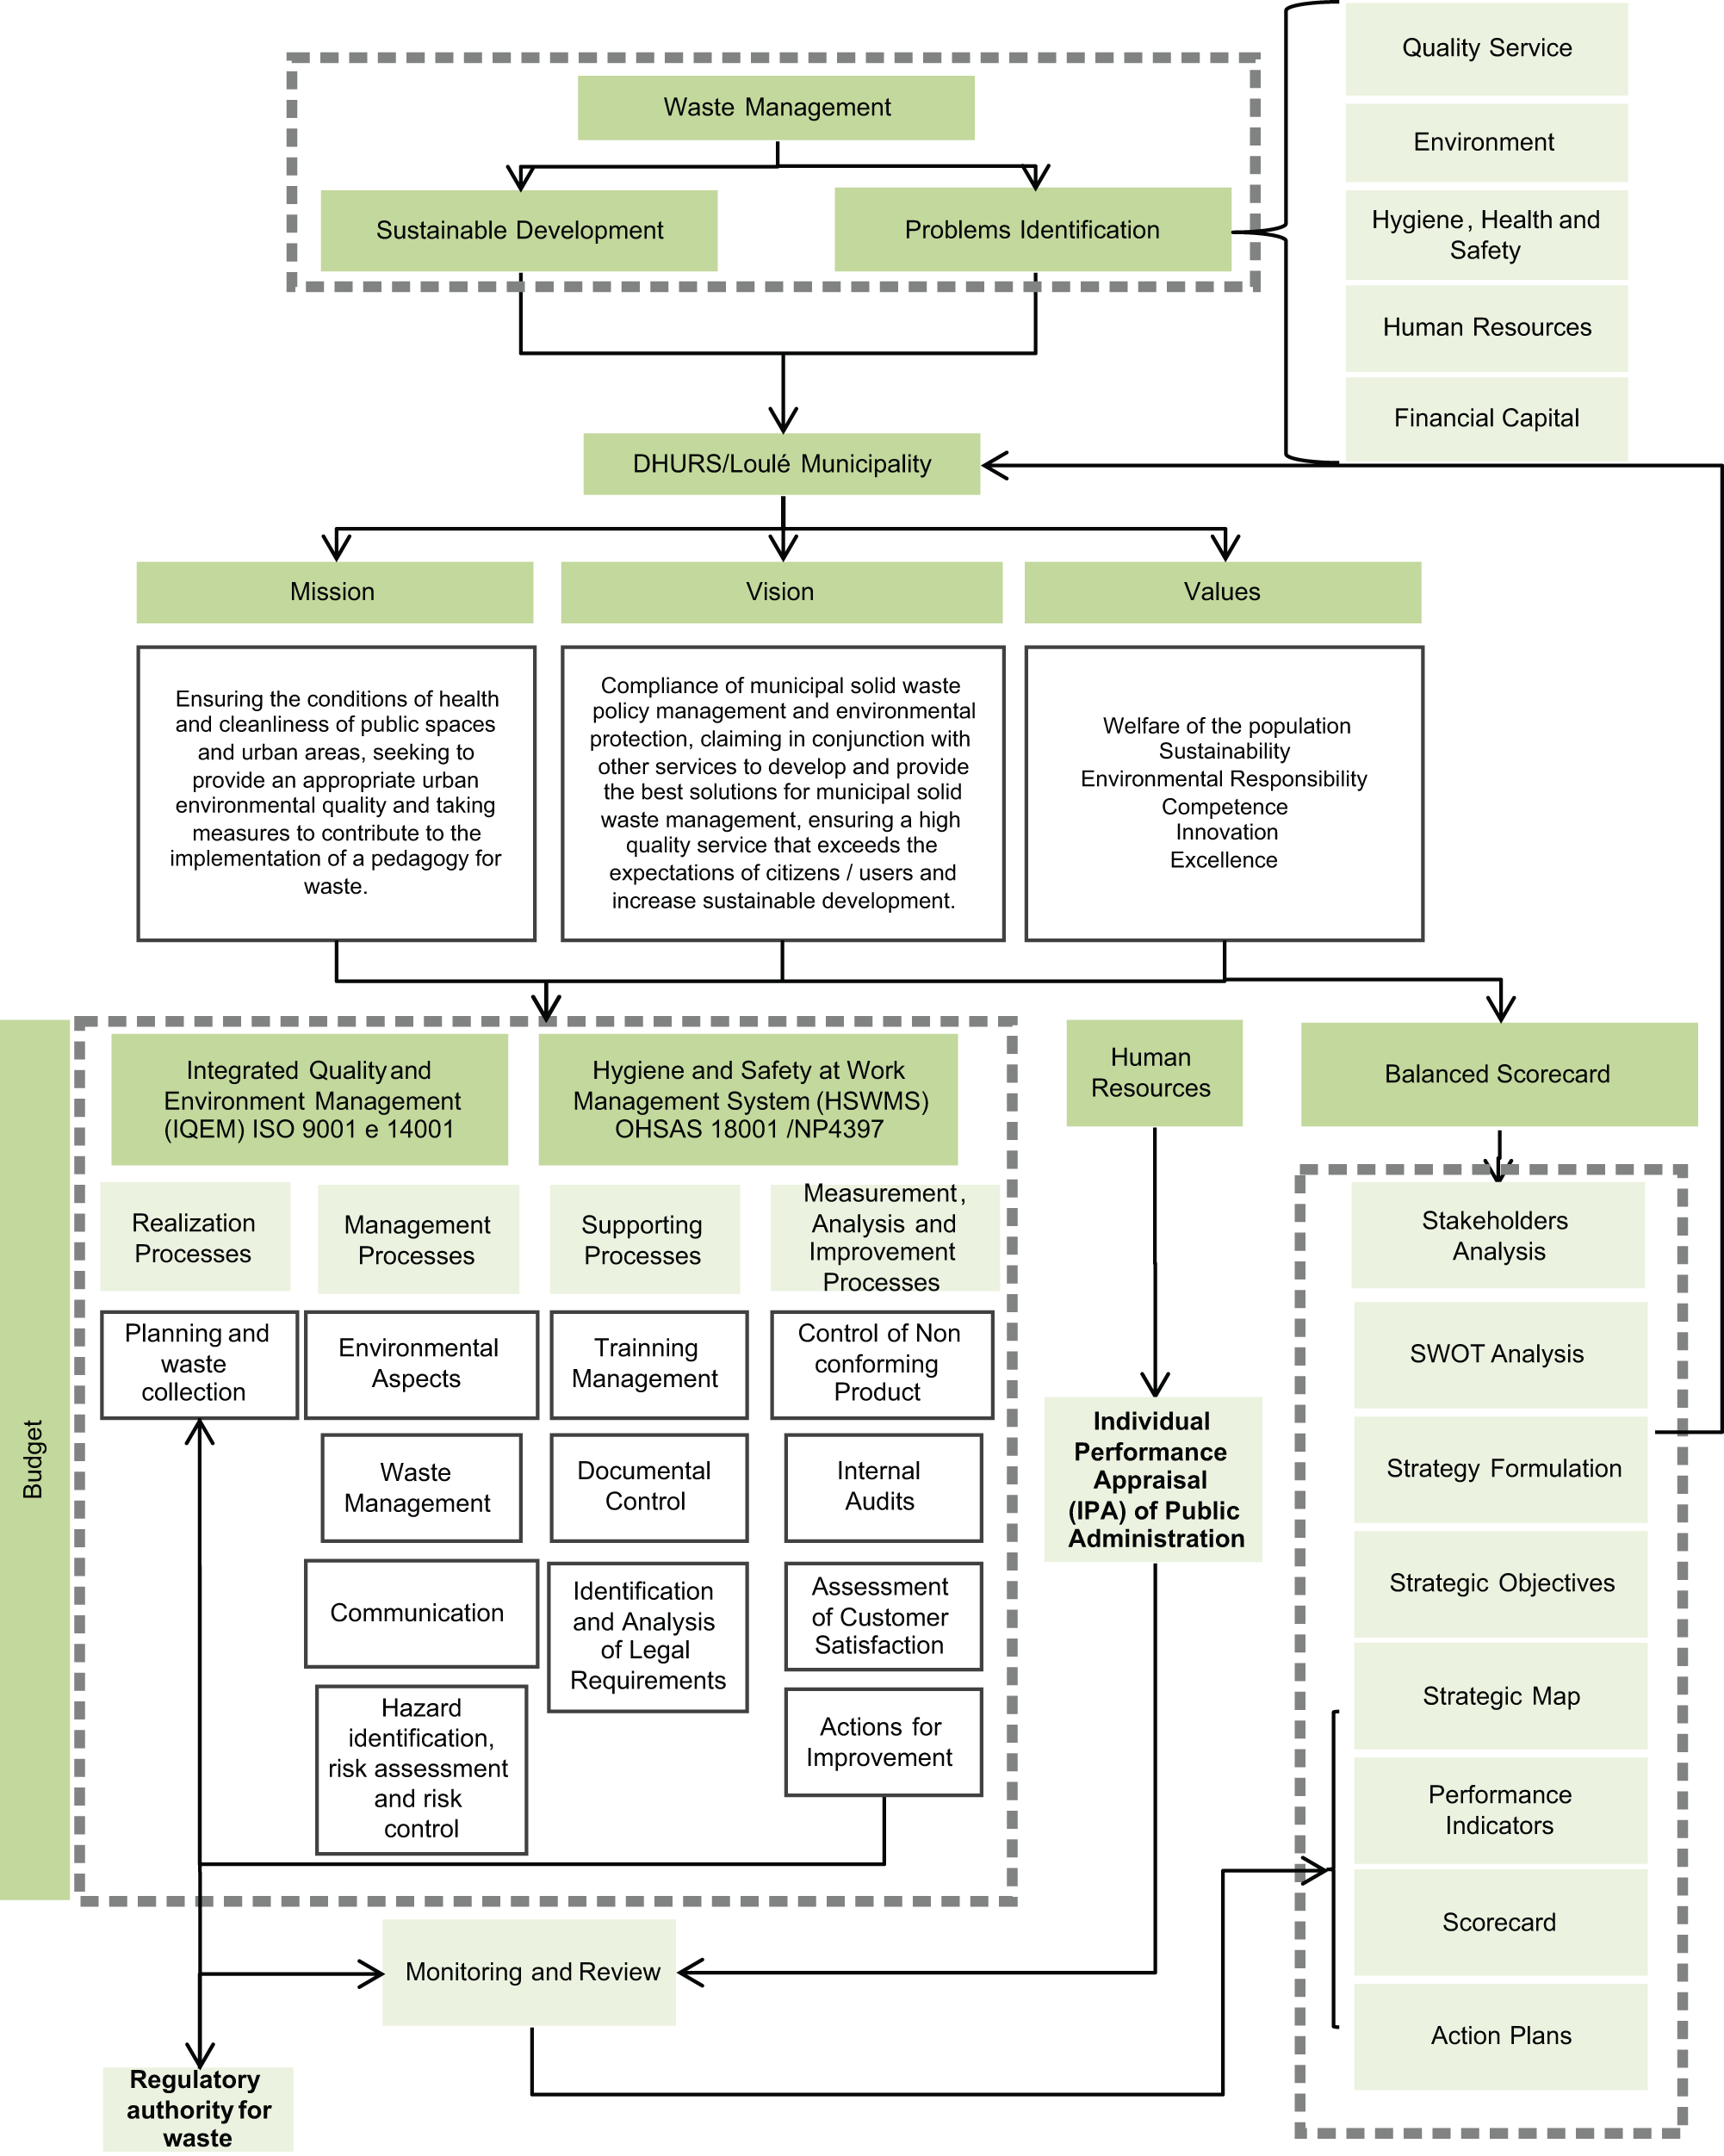
Schematic representation of the application of the BSC integrated model to the MSW disposal/collection system.
The model was applied for the period 2009–2011. Details of the methodology used are provided in Mendes et al. (2012), but a summarized version follows. By modelling the four BSC perspectives, correlations between them were established through a cause–effect relationship that enabled a synergy to be established between objectives, economic variables, and each management system (Figure 2). In brief, for each perspective, relative weights were designed according to the relevance and contribution to the organization’s mission, and were adjusted for the purpose of setting the goals. For objectives analysed using more than one indicator, levels of relevance were attributed to each and a weighted average used to represent the goal and the overall management (Table 1). Therefore, in such cases, the weighted sum of all the indicators equalled the weight of the goal. Each strategic indicator presents a quantitative set target, which refers to the level desired by the organization to achieve the objective, the definition of which is processed (Mendes et al., 2012).
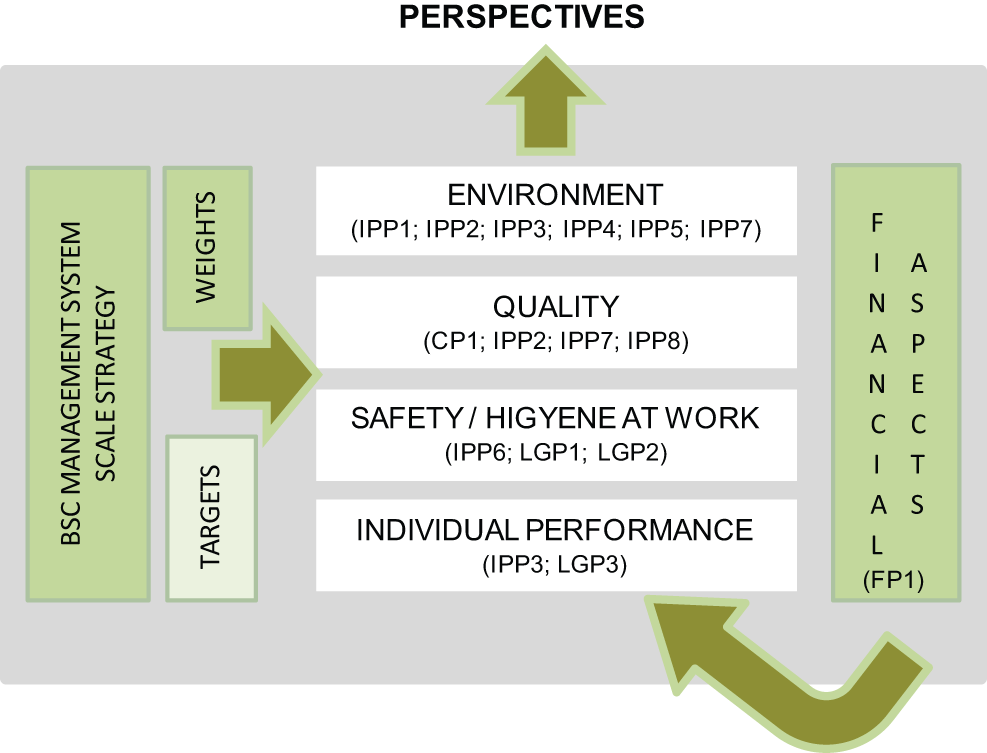
Relationships between perspectives and management systems in the BSC tool.
Strategic objectives and PIs for each perspective. The brackets contain the weighting of each perspective, strategic objective, and PI in the BSC tool (adapted from Mendes et al., 2012).

BSC overall assessment = ∑ (Pl performance level in each objective × Pl objective weight) (equation from Mendes et al., 2013).
BSC monitoring was performed every six months and annually, as suggested by Muchiri et al. (2011) and Perotto et al. (2008), and the monitoring process requires two years for consolidation (Ahn, 2001). Quarterly meetings were conducted with PAS representatives, to more quickly identify and correct failures in the strategic mapping, and to ensure that all aspects of the planning cycle and corrective actions were being addressed.
Defining targets for quantifying the achievement of goals
So that stakeholders can be provided with the motivation necessary to achieve the strategic objectives, the targets should always be ambitious yet incremental and tangible (Crown, 2003; Dubois, 2012). Therefore, the methodology for defining the annual target for each PI (and objective) was based on databases that record the organization’s history and assist in gaining a more realistic view of what is achievable. The absence of a target would result in a lack of feedback to the analysis and decision-making in the organization. Targets were defined by the value obtained for each PI in previous years multiplied by its variation occurring during the period of the study from 2009 to 2011. Therefore, each year, it is possible to determine the degree of change (reported as a percentage value, either +ve or –ve) in the performance of each PI with respect to the target. When those databases are not available, this methodology can still be used, but assumptions about and/or estimates of the PI have to be made.
To assess the impact of target values in the BSC tool, a sensitivity analysis was performed using Monte Carlo simulation (MCS). The decision about future target values should, in our opinion, be preceded by such a sensitivity analysis, which identities the variables to which the BSC model responds most strongly. In this process, having identified the most relevant PIs, their target values can be varied iteratively to higher or lower values, being recalculated each time that new BSC outcomes are available. This allows a quantitative assessment to be made of the relative gains/losses that each new target value imposes on the estimated BSC outcome, providing decision-makers with a powerful tool for helping set targets.
MCS analysis provides an understanding of how the model outputs are affected by changes in the inputs. Probability distributions are established with a randomly selected model input uncertain parameter, showing their importance and incorporating uncertainties of the input parameter (Van Passel et al., 2013). In MCS, values are picked from user-defined probability density functions and used to determine the outcomes of the BSC until the predetermined number of trials has been reached. At the end of the simulation, there are as many outcome results as there are trials, allowing statistics for the outcomes based on the trials to be calculated. Hence, unlike the deterministic approach, for which only one BSC value is calculated, in the probabilistic assessment a probability density function is generated for the BSC. When performing a sensitivity analysis, the value of a given parameter is altered while the remaining parameters are not, hence quantifying the impact of that particular parameter on the outcome. MCS is easily implemented using one of several available commercial software packages. We used Cristal Ball 7.3.1 (Oracle®) for the MCS in this study. Moreover, Table 2 shows the statistical distributions for the selected PIs used for the carried out sensitivity analysis.
Statistical distributions for the selected PIs.
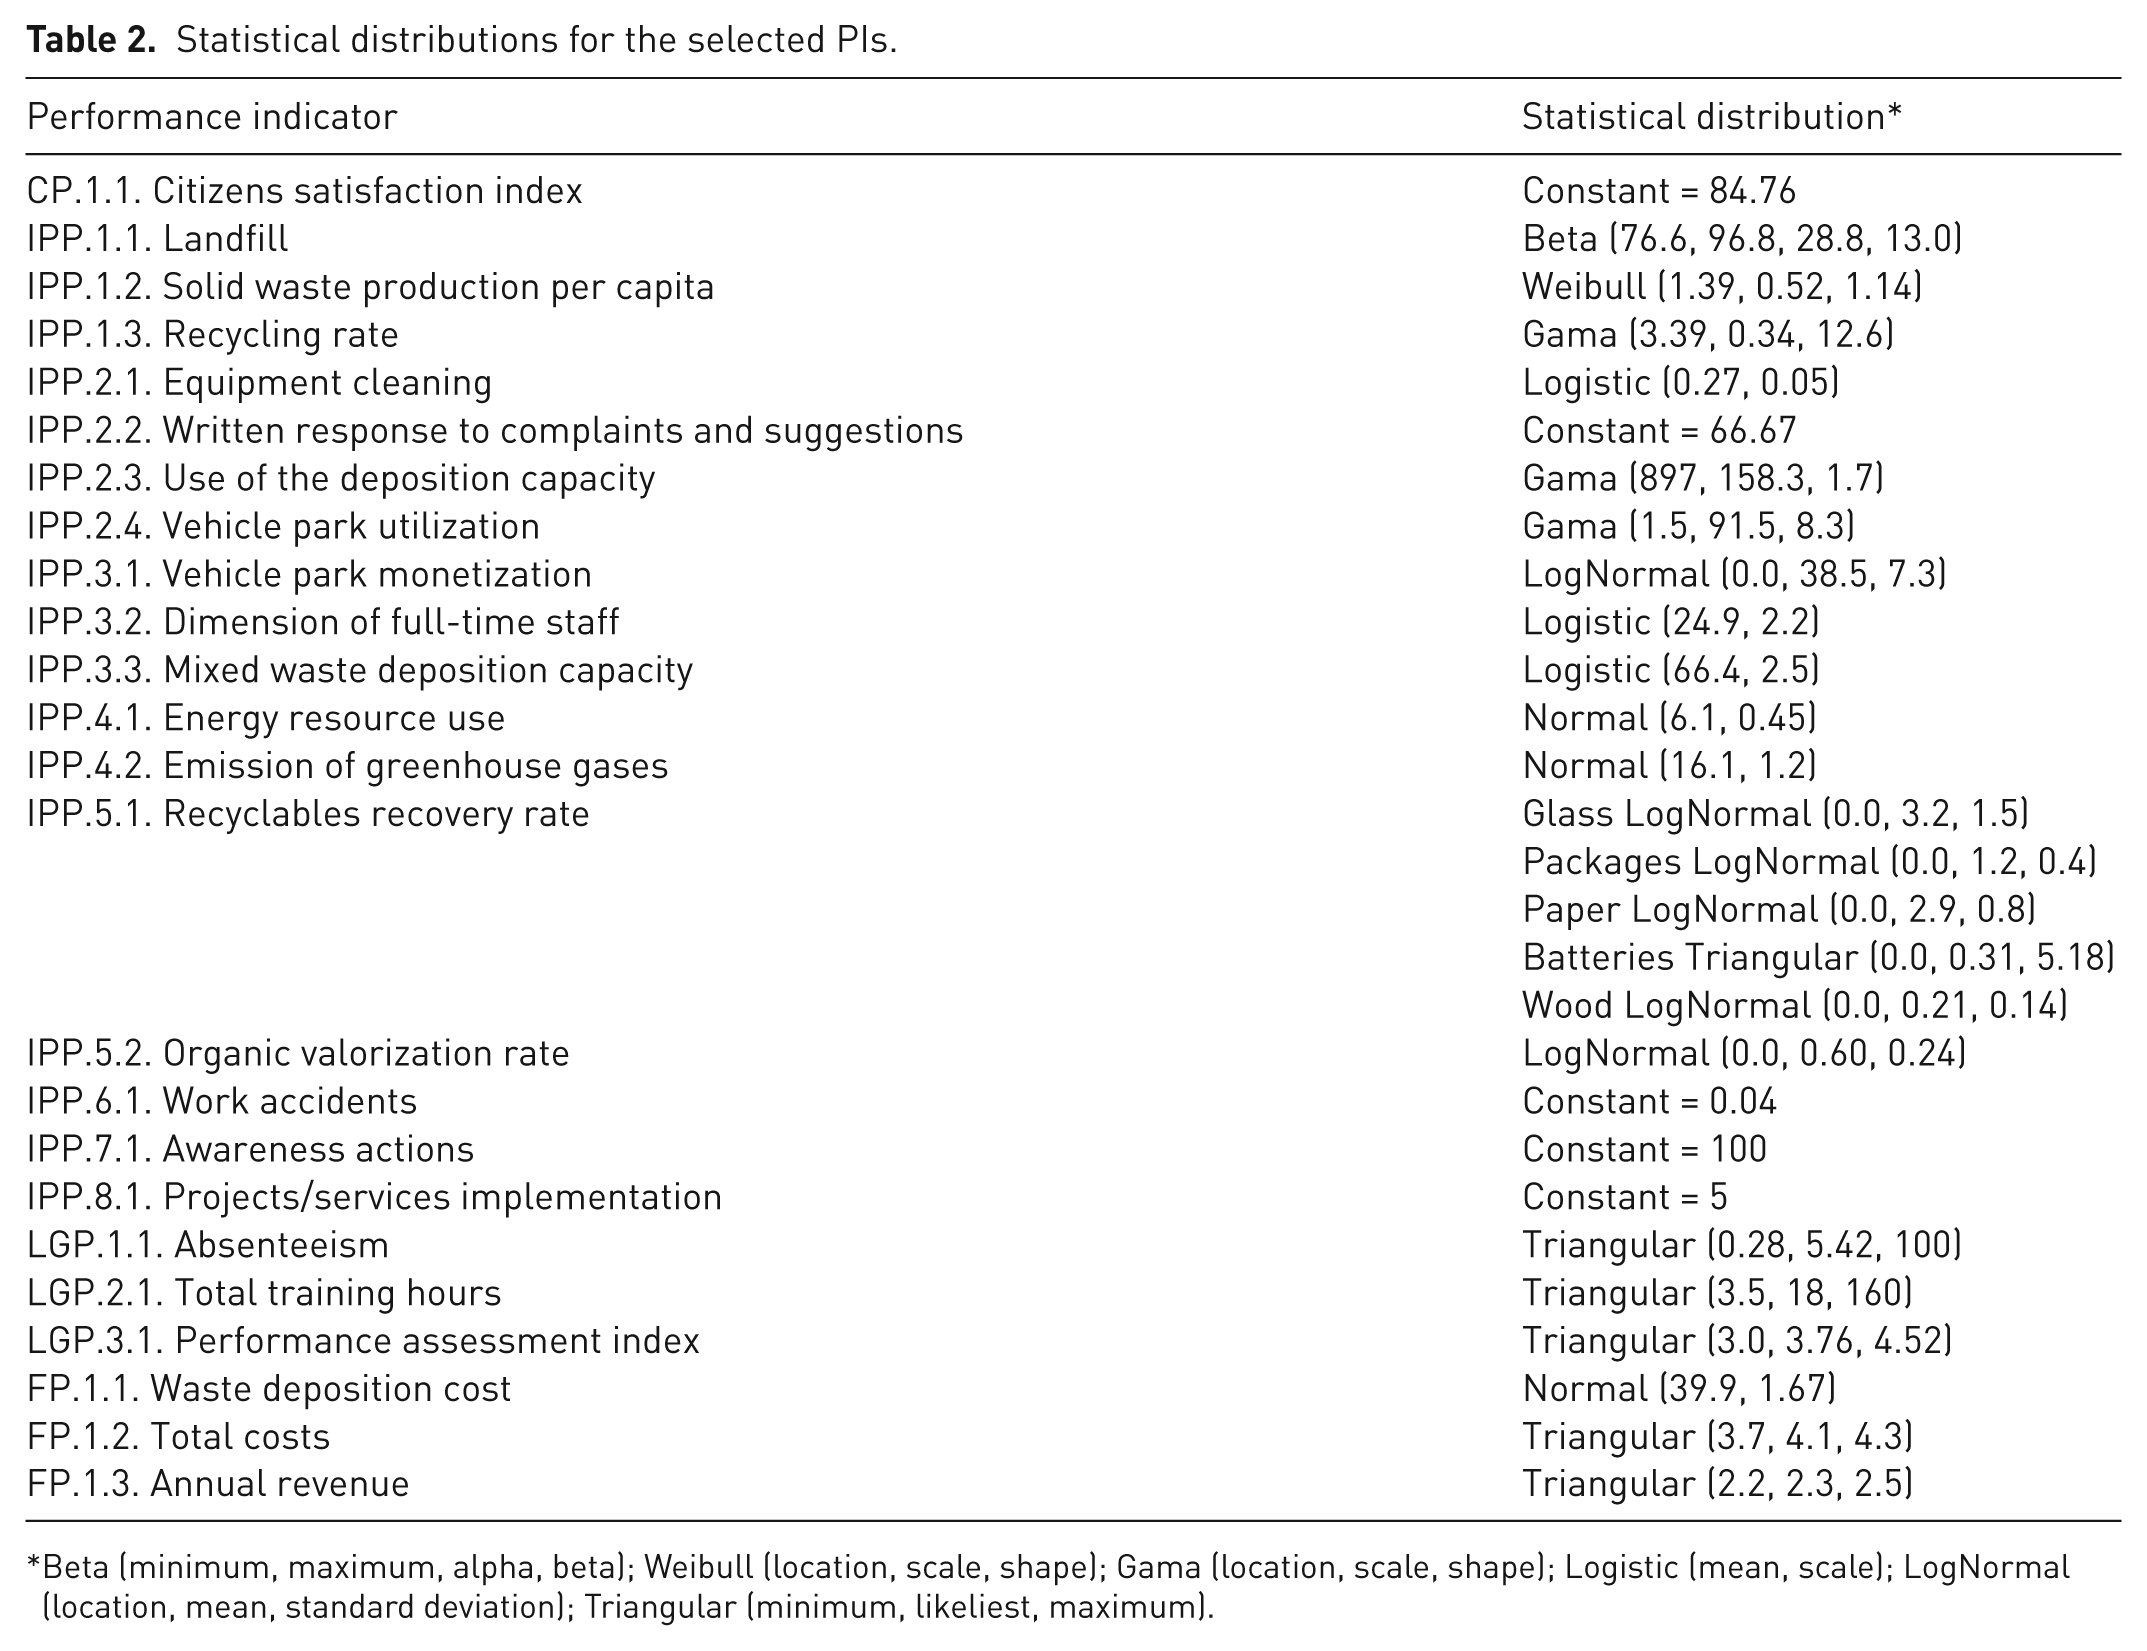
Beta (minimum, maximum, alpha, beta); Weibull (location, scale, shape); Gama (location, scale, shape); Logistic (mean, scale); LogNormal (location, mean, standard deviation); Triangular (minimum, likeliest, maximum).
In summary, the method includes two steps: (1) sensitivity analysis of PIs, for instance by using MCSs, to identify those PIs with the highest impact on the BSC model outcomes; and (2) sensitivity analysis of the target values for the previously identified PIs, for instance by varying the target values within predefined intervals established by consulting stakeholders, and assessing their impacts on BSC outcomes.
Results and discussion
Strategic goals and chains of cause–effect
Normalized results of the scorecards for each perspective, strategic objective, and PI for the years 2009–2011 are presented in Figure 3. Normalized results show the degree of attainment of the perspective, strategic objective, or PI with respect to its weight proposed for management (as presented in Table 1). An example is given for the computation of the normalized value for IPP2 for the year 2009. In this case, the weight was 10% (x), and the raw value was 6% (y). The normalized value is computed by y/x, and therefore the normalized value was 0.6. A normalized value of 0 means the perspective, strategic objective, or PI was not at all fulfilled, and a normalized value of 1 means that the perspective, strategic objective, or PI was completely fulfilled.
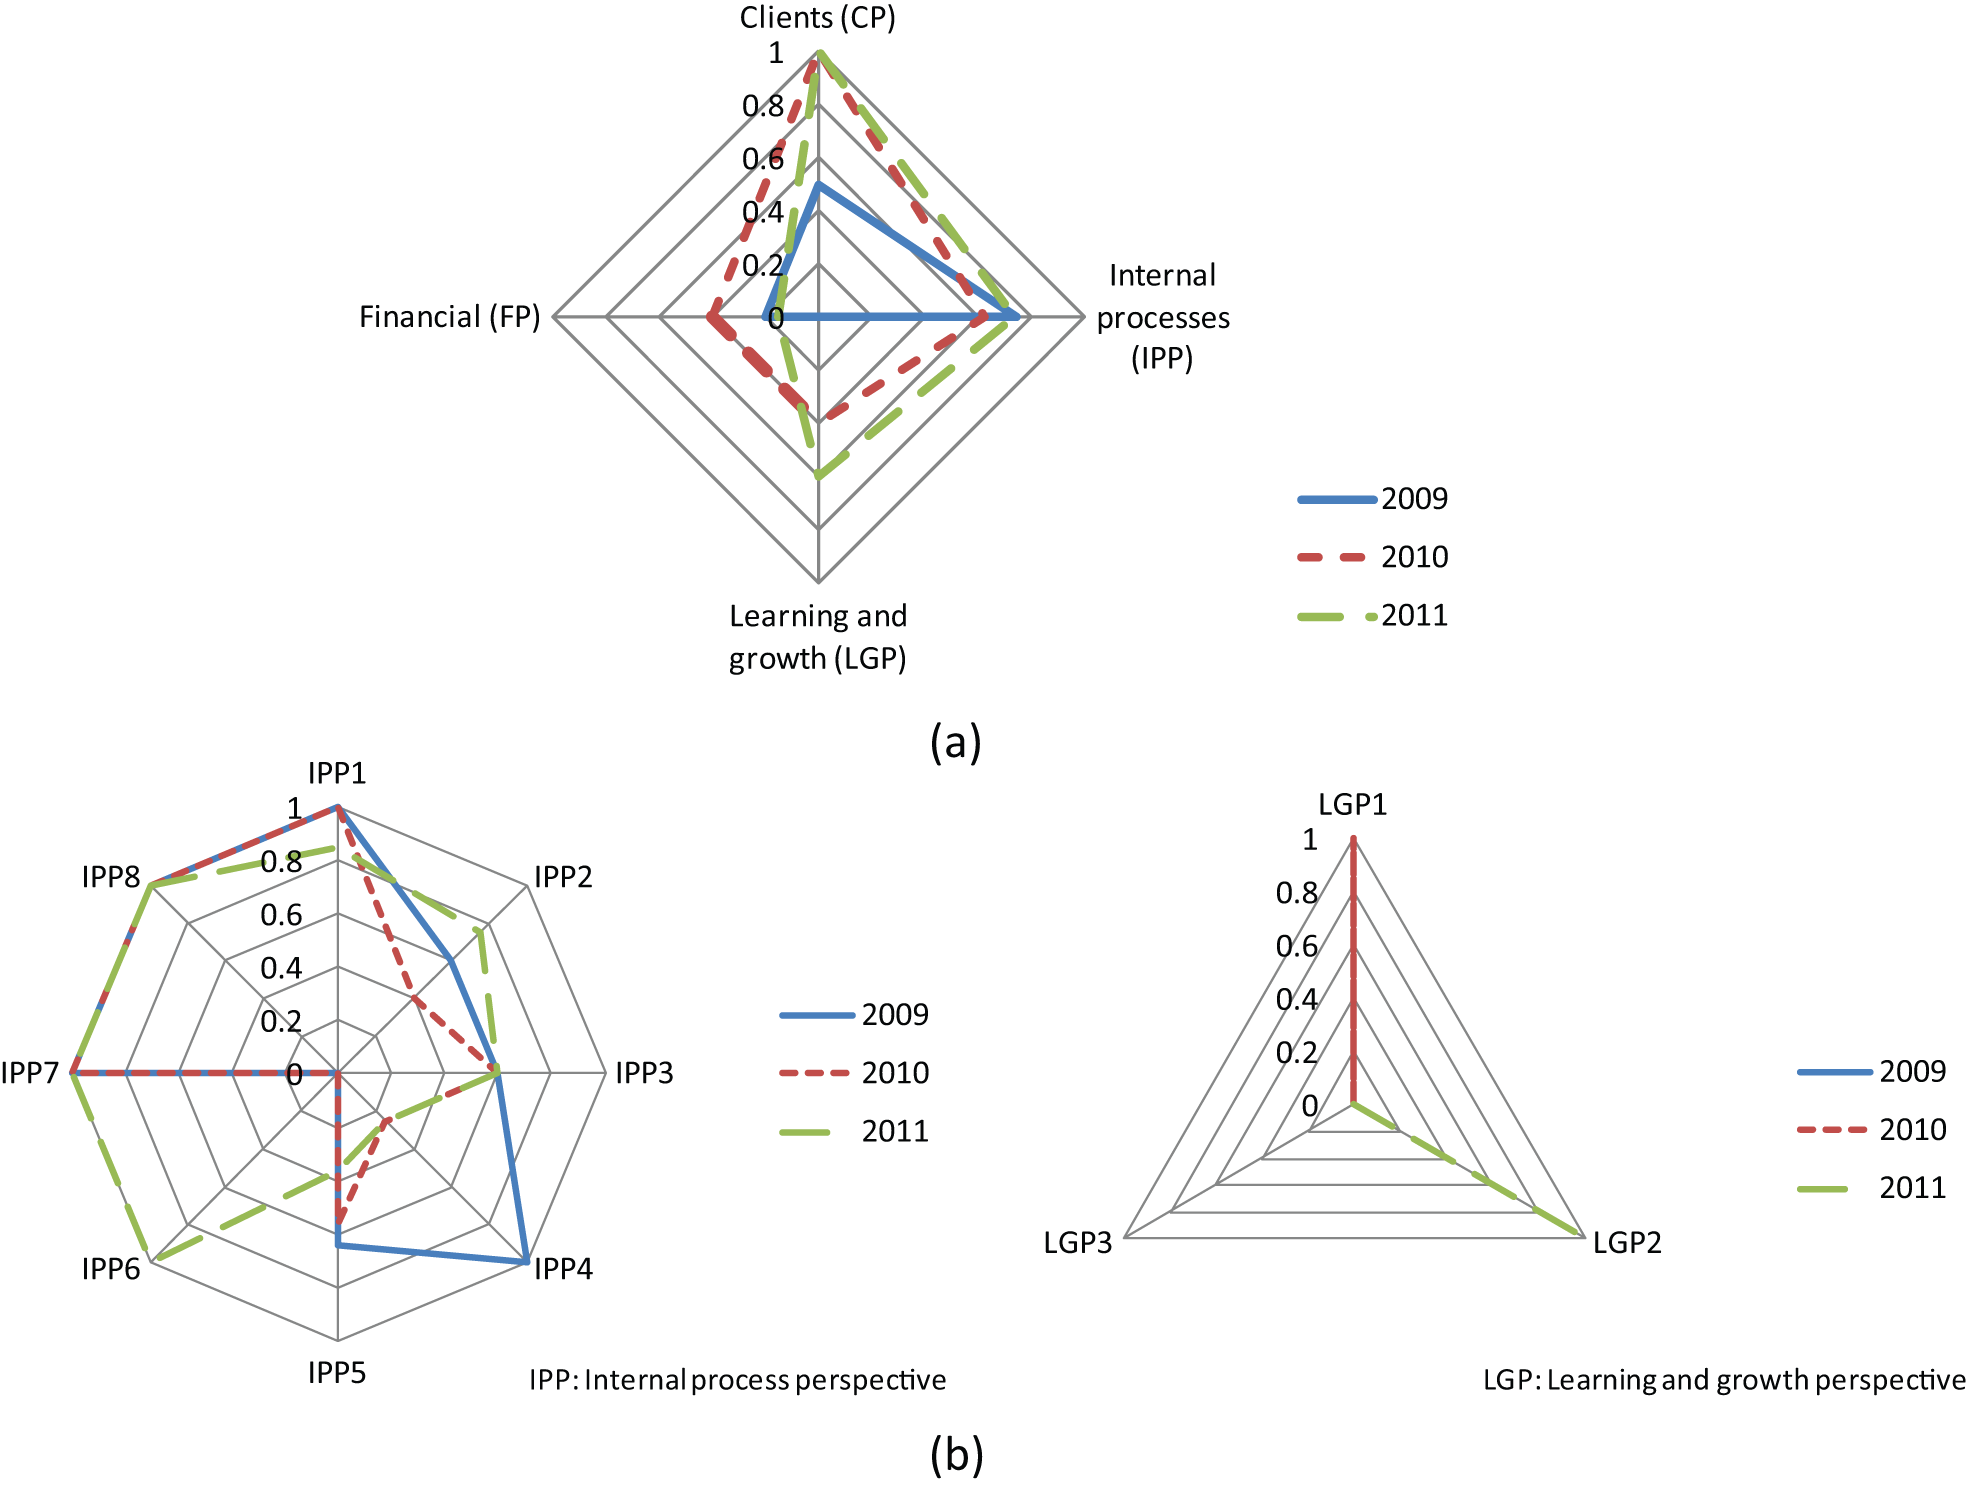
Normalized values of the BSC scorecards 2009–2011: (a) for each perspective; and (b) for each strategic objective (for the two perspectives that had more than one strategic objective).
Results from Figure 3(a) indicate that the Clients perspective shows a positive evaluation through the three years, having reached the target in 2010 and was maintained in 2011, meaning that the satisfaction of the Loulé citizens increased over years (Client satisfaction was measured by questionnaires made randomly to citizens about the quality of the waste deposition and collection service). The Learning and Growth perspective also demonstrates a positive trend through the study period, although the target has not yet been reached (Figure 3(a)). However, for the Internal Processes and Financial perspectives, there is a negative change in some of the years (2009–2010 for IPP and 2010–2011 for FP, Figure 3(a)). Therefore, normalized results for each strategic objective were made (Figure 3(b)). For the Clients and Financial perspectives, Figure 3(b) is not presented because these perspectives have only one strategic objective each (see Table 1). As displayed in Figure 3(b), the BSC results for the strategic objectives do not show a consistent pattern: some objectives show positive trends in the study period (for example IPP6, IPP7, and IPP8), while others present negative or mixed (both negative and positive) changes (IPP1, IPP2, IPP4, LGP1, LGP2, and LGP3).
A question arising from these results is why some perspectives present negative or mixed changes if the organization made concerted efforts towards achieving continuous improvement. This leads to the next analysis, which concerns the usefulness of sensitivity analysis for setting targets. In principle, it can give some insight as to which variables are causing the overall BSC value to change positively, and to try to explain why this happens when some PIs are performing badly.
Sensitivity analysis
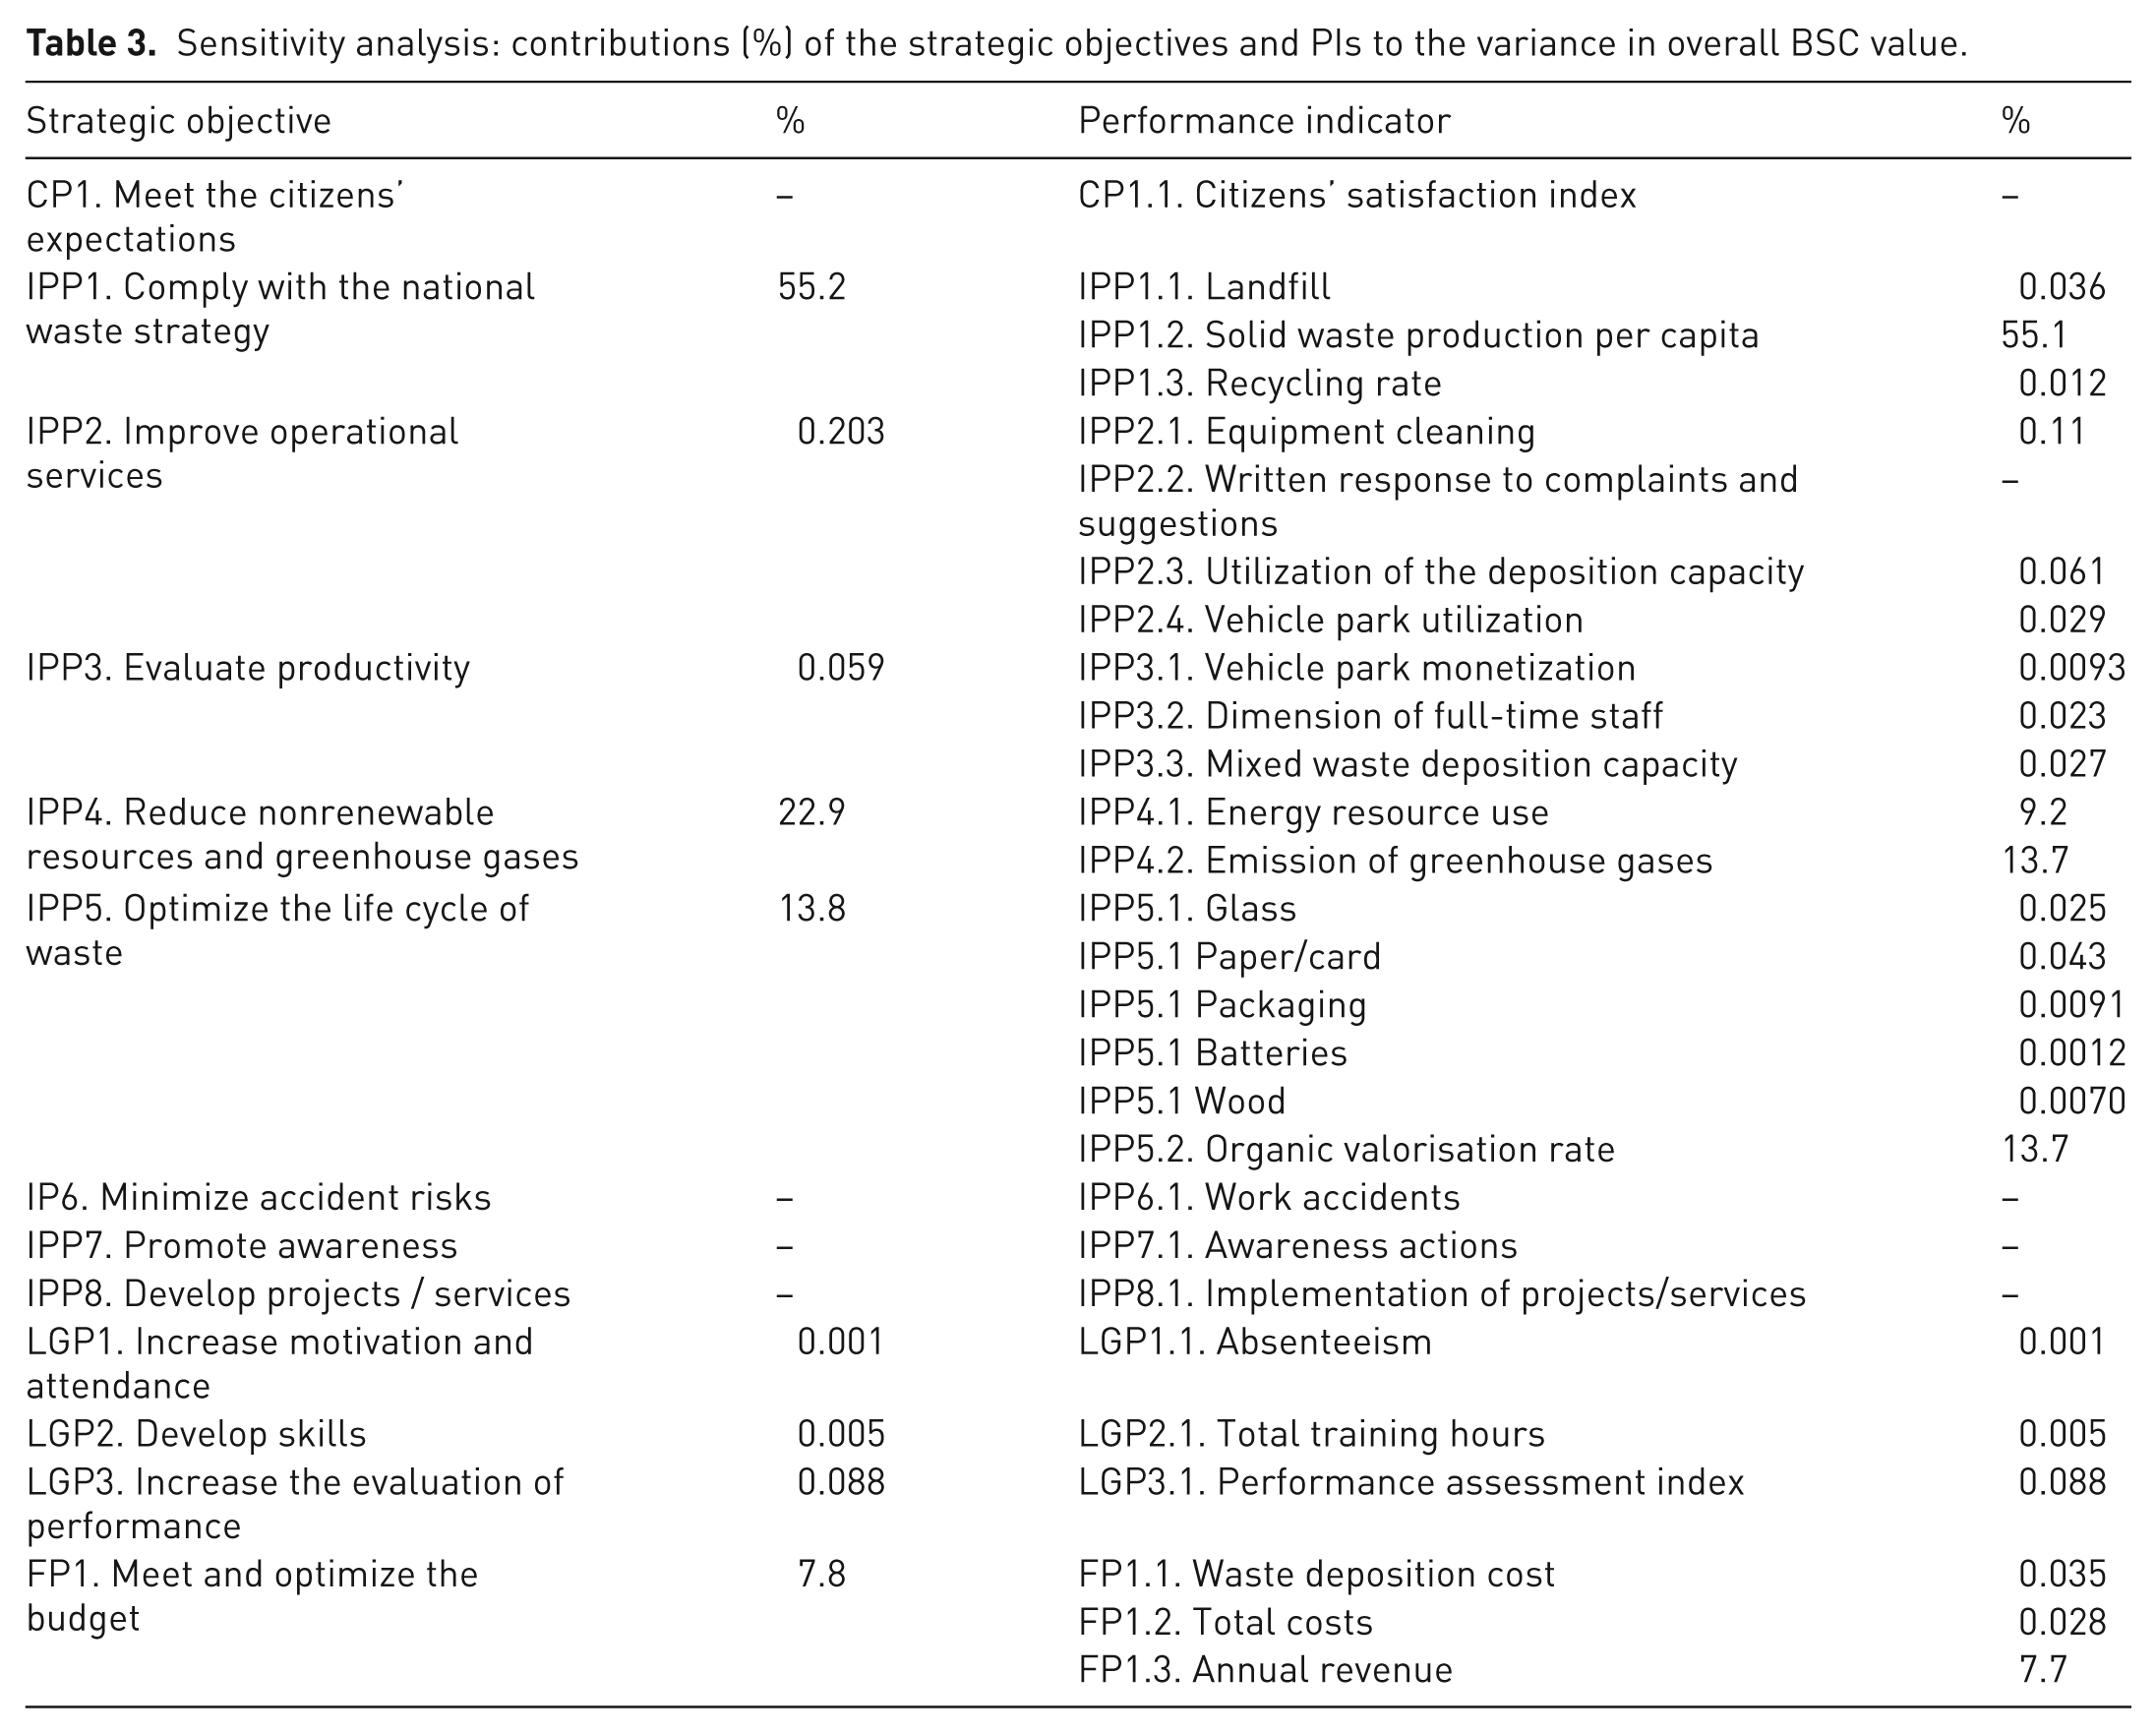
Results from MCS sensitivity analysis indicate that the four strategic objectives IPP1, IPP4, IPP5, and FP1 alone contribute 99.7% of the variability in overall BSC value (Table 3), and therefore changes in PI results and targets for the remaining variables have a very marginal contribution to the BSC value. For the purposes of analysis, we chose the PIs with the highest contribution to variance to assess how target-setting would affect BSC outcomes for 2012, on a ceteris paribus assumption (Table 3). Figure 4 presents the marginal variation in BSC resulting from small variations in the values of the targets for the PIs IPP1.2 Solid waste production per capita and IPP4.2 Emission of greenhouse gases. Negative values indicate a worsening of the BSC value and the positive values an improvement. These variations are exclusively the result of the targets, as the remaining conditions were maintained. For PI IPP1.2, a percentage change in the target value of a magnitude similar to that proposed from 2010 to 2011 (−2.5%) would result in a decrease of −0.24% in the overall BSC value, and only decreases in the target value of greater than 15% would cause the BSC value to decrease by more than 1%; if the target value were increased by 2.5%, the marginal gain in the BSC value would be also small, in the order of 0.28% (Figure 4). Increases in target value of around 30% or more would be required to result in a BSC increase of over 1%.
Sensitivity analysis: contributions (%) of the strategic objectives and PIs to the variance in overall BSC value.
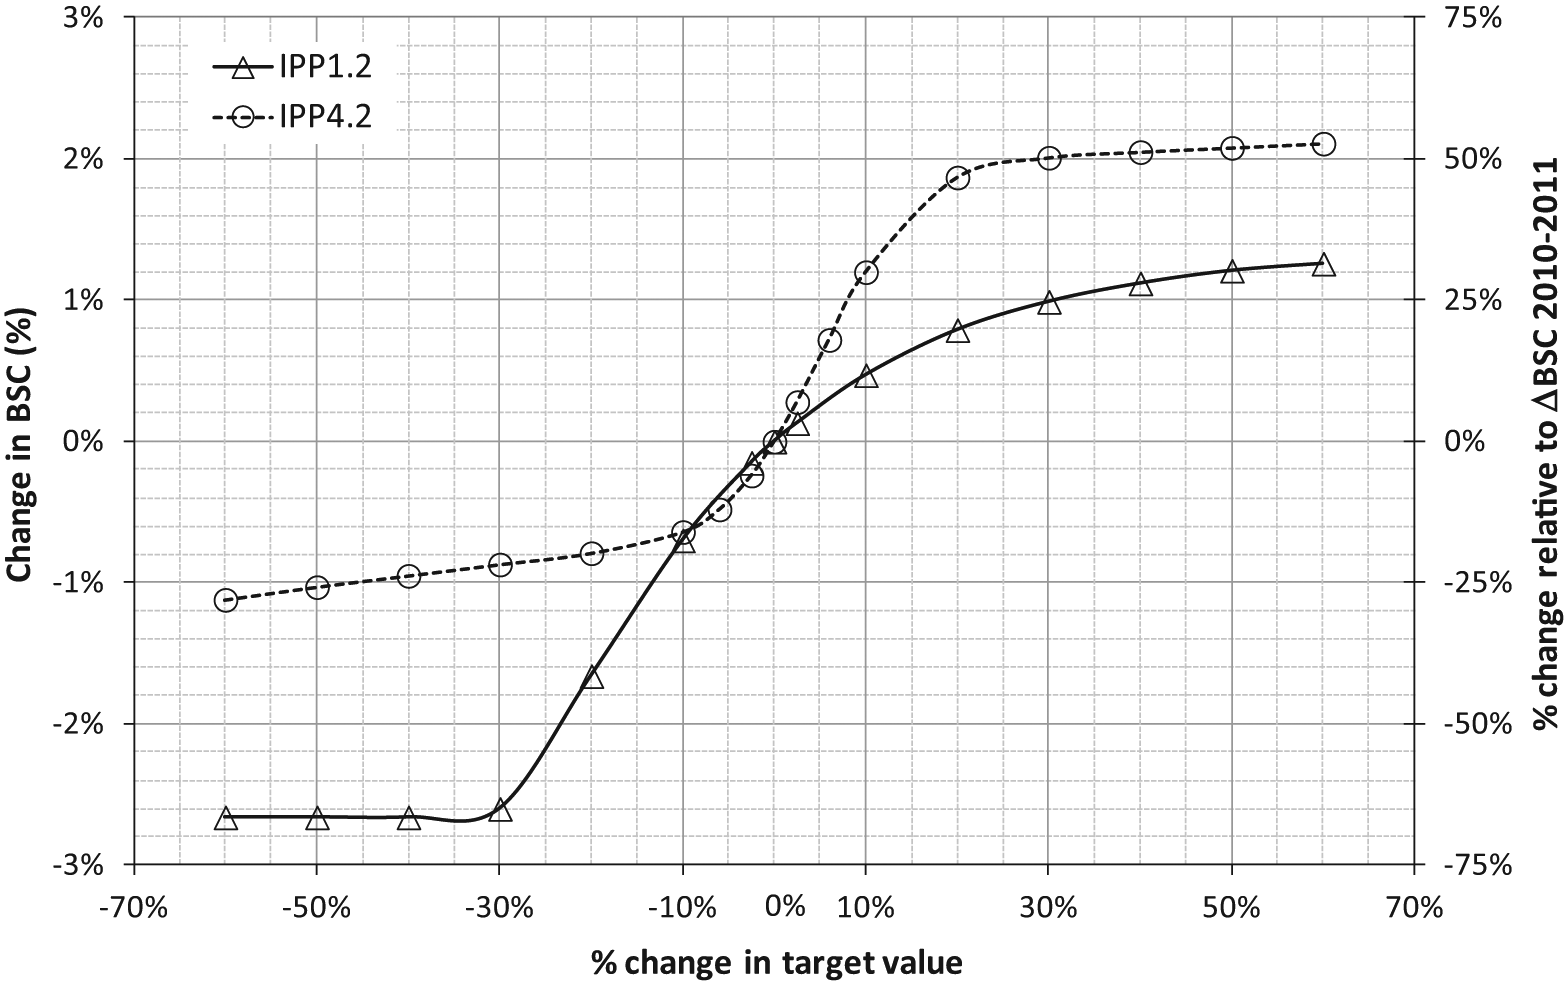
Sensitivity analysis for BSC target values.
Changes in the target value of PI IPP4.2 have a more marked impact on the resulting BSC value. For instance, a 6% increase (the magnitude of the change from 2010 to 2011) would result in an increase of 0.72% in the BSC value (Figure 4). If the target value were decreased by a similar amount, the BSC value would decrease by −0.48%. The magnitude of these results should be put into the context of change in BSC value between 2010 and 2011 (+4%, Mendes et al. 2013). In this case, for IPP4.2, a change in target values of +6% corresponds to 18% of the annual variation (Figure 4); while for IPP1.2 the 2.5% target change corresponds to only 3.75% of the annual variation.
We believe decision-makers may find this analysis helpful as it measures the impact of their uncertainty on the measure of sustainable performance. Langley et al. (2009) proposed uncertainty analysis to develop an internet-based decision-making tool for food waste estimation. Our results show that for PI IPP1.2, only movement to high targets would have a significant impact on the measured performance. In contrast, for PI IPP4.2, decision-makers should practice care when choosing the target value as the impact of their decision has a substantial uncertainty propagation through the model, eventually masking the evolution of the remaining variables.
The curves in Figure 4 are asymmetrical, indicating that targets lead to different answers when moving the strategic objective target up or down. The figure also reveals that the ‘target effect’ extends more when the moving is made to less-demanding targets (in this case, when increasing the target positively). In other words, moving targets to more demanding values would pay off only if the movement were relatively limited; beyond a given range (about −10% for IPP4.2, and −30% for IPP1.2), the marginal gain is very low. Given the high rate of variation of BSC value with respect to the target, it seems advisable to move the target only within very reasonable (conservative) intervals.
In summary, sensitivity analysis provides a method of measuring how target values affect BSC outcomes and of studying how incorrect target setting may result in the masking of effects and, consequently, in the incorrect assessment of the true results of planning. To the authors’ knowledge, this is the first time such an analysis has been proposed in this context, applied in this case to MSW management. Van Passel et al. (2013) used sensitivity analysis (MCS) to assess input parameter uncertainties and identify the impact of drivers, such as markets, regulation, and technology, on the economic performance of enhanced landfill mining. The methodology used in our study is similar to that of Van Passel et al. (2013), but was applied here to a municipality rather than to a project.
Conclusion
In this article, we have demonstrated the importance of setting quantitative targets in the BSC model applied to the public waste sector and the need for adopting methods to help decision-makers in the process of defining target values for PIs.
In this context, we conducted a sensitivity analysis on strategic objectives and PIs in the BSC tool. We found that some PIs contributed disproportionately to explaining the variance in the overall BSC value, thereby exemplifying the usefulness of the sensitivity analysis. The results demonstrated that four of the 13 strategic objectives contributed 99.7% of the variance in overall BSC value: IPP1 (Comply with the national waste strategy) at 55.2% of the variance, IPP4 (Reduce nonrenewable resources and greenhouse) at 22.9%, IPP5 (Optimize the life cycle of waste) at 13.8%, and FP1 (Meet and optimize the budget) at 7.77%. A variation in target values of 4% for the PIs IPP1.2 (Solid waste production per capita) and IPP4.2 (Emission of greenhouse gases) resulted in variations of 3.75% and 18%, respectively, in the overall BSC value between 2010 and 2011.
Incorrect setting of target values may lead to involuntarily biased decisions by organizations, if not prevented with the help of sensitivity analysis, used to complement expert-based methodologies.
Footnotes
Declaration of conflicting interests
The authors declare that there is no conflict of interest.
Funding
This research received no specific grant from any funding agency in the public, commercial, or not-for-profit sectors.