
Abstract
The reduction of food waste is seen as an important societal issue with considerable ethical, ecological and economic implications. The European Commission aims at cutting down food waste to one-half by 2020. However, implementing effective prevention measures requires knowledge of the reasons and the scale of food waste generation along the food supply chain. The available data basis for Europe is very heterogeneous and doubts about its reliability are legitimate. This mini-review gives an overview of available data on food waste generation in EU-27 and discusses their reliability against the results of own model calculations. These calculations are based on a methodology developed on behalf of the Food and Agriculture Organization of the United Nations and provide data on food waste generation for each of the EU-27 member states, broken down to the individual stages of the food chain and differentiated by product groups. The analysis shows that the results differ significantly, depending on the data sources chosen and the assumptions made. Further research is much needed in order to improve the data stock, which builds the basis for the monitoring and management of food waste.
Introduction
The Food and Agriculture Organization of the United Nations (FAO) estimates that globally about one-third of food produced for human nutrition gets lost or is wasted. This amounts to approximately 1.3 billion tonnes year-1 (Gustavsson et al., 2011). Regarding the whole food supply chain, excluding agricultural production, calculations for the EU-27 account for 89 million tonnes year-1 of food waste, corresponding to 179 kg per capita (Monier et al., 2010). Food is lost or wasted throughout the entire supply chain, from primary production to final household consumption. In low-income countries, food is lost mostly during the early stages of the supply chain as a result of limited harvesting techniques, inadequate storing and cooling facilities, unfavourable climatic conditions, poor infrastructure and insufficient processing, packaging and marketing systems (FAO, 2012; Lang and Rayner, 2012). In medium- and high-income countries, food losses occur to a significant extent at the downstream stages of the supply chain and are related to a lack of coordination between different actors as well as consumer behaviour and the fact that people simply can afford to waste food (Grethe et al., 2011). On a per capita basis, much more food is wasted by households in industrialised countries than in developing ones. The FAO estimates that the per capita food waste by consumers in Europe and North America is 95–115 kg year-1, while in Sub-Sahara Africa and South/Southeast Asia this figure is only 6–11 kg year-1 (Gustavsson et al., 2011). Regarding only the household level, estimates for the EU-27 amount to 76 kg of food waste per person and year (Monier et al., 2010).
Given the fact that almost one billion people suffer from malnutrition (FAO, 2010), wasting food is particularly an ethical problem. Although the question of how consumer behaviour in industrialised countries does affect hunger and rural poverty in developing countries is a contentious issue, it can be assumed that the careless handling of food in rich countries will increase the worldwide demand for food. A globally growing demand will result in higher prices of stable foods on the world market, which will further weaken the purchasing power of poor people in developing countries. Moreover, rising population levels combined with shifting dietary patterns in emerging economies will exert increasing pressure on global food supply (IMechE, 2013; UN, 2011).
Wasting food means losing not only life-supporting nutrition, but also consuming scarce resources like land, water and energy that were expended in the production, processing and distribution of food. Complementary to the saving of resources, an efficient handling of food would reduce agricultural emissions. According to Monier et al. (2010), food wastage in EU-27 is responsible for the release of at least 170 million tonnes of CO2-eq, which is broadly 1.9 tonnes of CO2-eq per tonne of food waste. This value covers the entire lifecycle of a product, from primary production to disposal. Pursuant to the consistent findings of various studies, fruit, vegetables and bakery products constitute the greatest percentage of food waste. But the largest consumption of resources and the highest greenhouse gas emissions per kg are caused by meat products, of which beef products are most critical (FAO, 2013; Fritsche and Eberle, 2007; Göbel et al., 2012; Lee and Willis, 2010; Noleppa and von Witzke, 2012; Venkat, 2011).
Large quantities of food waste from the household sector also mean high costs for collection and transport, as well as for separation and treatment in waste management facilities. Bio-waste, on average, accounts for 37% of total municipal waste in Europe, but differs considerably between member states, from less than 20% in Lithuania, Norway and Slovenia, up to more than 50% in Greece, Portugal, Slovakia and Malta. In the EU, the deposition of untreated organic waste in landfills is restricted by legal provisions. Article 5(2) of the Council Directive 1999/31/EC of 26 April 1999 on the landfill of waste requires the reduction of biodegradable municipal waste going to landfills to 75% by 16 July 2006, to 50% by 16 July 2009 and to 35% by 16 July 2016, calculated on the basis of the total amount of biodegradable municipal waste produced in 1995 or the latest year before 1995 for which standardised EUROSTAT-data is available. Member states that landfilled more than 80% of their municipal waste in 1995 are allowed to postpone each of the targets by a maximum of four years (European Council, 1999). Nevertheless, 50% of bio-waste generated in EU-27 was still landfilled in 2010 (up to 100% in some member states) (EEA, 2013). Thus, adverse environmental impacts of landfilling, the separate collection of bio-waste and the enhancement of its recycling rates are still a crucial issue in Europe (see ISWA, 2013; Priefer et al., 2013).
In addition to negative environmental impacts, food wastage causes significant monetary losses, both for the individual consumer as well as for the national economy, taking external effects into account. Buzby and Hyman (2012) estimated that in 2008, food waste at consumer level in the United States amounted to 124 kg per capita and year at an estimated retail price of $390 (€246) per year. This is roughly 10% of the average expenditure on food per consumer in 2008 and more than 1% of the average disposable income. For Germany, the economic losses are estimated at €234 per capita and year, corresponding to about 12% of the average expenditure on food and non-alcoholic beverages per consumer in 2010 (Kranert et al., 2012). All in all, the reduction of food waste is seen as an important lever for achieving global food security, freeing up finite resources for other uses, diminishing environmental risks and avoiding financial losses.
The food waste issue is currently high on the political agenda in Europe and there is a strong public debate about it. In its roadmap for a resource-efficient Europe, the European Commission has set the target to cut down the generation of food waste by one-half by 2020 (European Commission, 2011). The implementation of prevention measures to combat food waste, however, requires an understanding of the scale and pattern of wastage. This, in turn, depends on the availability of reliable data on food waste generation in EU-27. The present article is meant to provide an overview of available data on food waste generation, to give insight into different calculation methods and to compare the results of own calculations with available pan-European studies.
Assessment of data availability and reliability for EU-27
There are mainly two studies dealing with pan-European data on food waste: the study carried out by the Bio Intelligence Service (BIOIS) on behalf of the European Commission (Monier et al., 2010) and the study carried out by the Swedish Institute for Food and Biotechnology (SIK) on behalf of FAO (Gustavsson et al., 2011, 2013). Both studies have their strengths and weaknesses. The BIOIS-study examines the generation of food waste at all stages of the food chain across EU-27, but excluding agricultural production and without considering different product groups. The SIK-study addresses the generation of food waste at all stages of the food chain, including agricultural production and broken down to product groups. In contrast to the BIOIS-study, the SIK-study has a global focus, grouping the world into different regions. Apart from EU-27, the group of European medium/high income countries also includes the Russian Federation and those Eastern European countries that are not part of the EU. The SIK-study is based on FAOSTAT-data from 2007, while the BIOIS-study is based on EUROSTAT-data from 2006 and various national sources.
Besides these two pan-European studies, there exists a large number of national studies. For the UK, up to now a variety of reports have been published by the Waste and Resources Action Programme (WRAP), which is funded by the British government. This initiative was launched in 2000 and aims at reducing all types of waste in the private and industrial sector with a focus on the prevention of food waste. The available research offers a relatively robust data stock on food waste generation in the UK. The reports deal mainly with results of empirical surveys on food waste generation in the British food chain and in particular at the household level (e.g. Cox and Downing, 2007; Lee and Willis, 2010; Quested and Johnson, 2009; Quested and Parry, 2011; Quested et al., 2012; Williams et al., 2011; Ventour, 2008).
The Netherlands (Soethoudt and Timmermans, 2013; Thönissen, 2010), Denmark (Stenmarck et al., 2011), Sweden (Jensen et al., 2011), Finland (Katajajuuri et al., 2011) and Norway (Hanssen and Møller, 2013; Møller et al., 2012) are also very active in this field and have recently published several studies. National surveys are furthermore available for Austria (e.g. Obersteiner and Schneider, 2006; Schneider and Lebersorger, 2009; Schneider and Scherhaufer, 2009), Germany (Göbel et al., 2012; Kranert et al., 2012), Switzerland (Beretta et al., 2013) and France (Viel and Prigent, 2011). Research activities in Southern and Eastern Europe are scarce, with a few exceptions. There are studies for Italy (BCFN, 2012; Garrone et al., 2012; Segrè and Falasconi, 2011), Portugal (Baptista, 2012), Catalonia/Spain (ARC, 2012) and Greece (Abeliotis et al., 2014).
Even though there are plenty of research activities throughout Europe, the assessment of food waste generation along the supply chain is still fraught with considerable uncertainties. The available data are hardly comparable and thus, a solid estimation of the extent of food waste and the identification of hotspots is rather difficult. One reason is that the quantities are estimated while referring to different sources, including various methods for data collection. Most national studies extrapolate results from random waste analyses at district and region level, and transfer them to the whole country. Sometimes data from other countries that seem to be comparable in terms of lifestyle, income and wasting patterns are extrapolated to one’s own population size. The calculations carried out by BIOIS (Monier et al., 2010) are based on a mixture of data composed from EUROSTAT-data, national surveys and extrapolations by BIOIS. In contrast, the SIK-study (Gustavsson et al., 2011) uses FAOSTAT food production and utilisation data, which feed into a mass flow model.
Further reasons for the discrepancies in the data stock are that the underlying definitions of the terms ‘food waste’, respectively ‘food loss’, the defined system boundaries and the scope of investigation vary to a great extent. Moreover, the available studies use deviating metrics (e.g. tonnes of food waste per year, surplus calories per person and day) and refer to different research subjects, such as different stages of the food chain, different product groups or different geographic units (e.g. cities, regions, federal states).
There are also some knowledge gaps regarding the product groups and stages of the food chain. Cereals, fresh fruit and vegetables are better examined groups as they are discarded in larger quantities. Animal-derived products like meat, milk and eggs have been studied less, despite their high ecological relevance. There are quite comprehensive data on food waste of households for a variety of countries, while research on food waste generated in agricultural production, manufacturing and retail is most scarce.
Discussion of BIOIS data basis
The pan-European study by BIOIS (Monier et al., 2010) represents the only current reference when it comes to statements about the extent of food wastage in the EU-27. All figures presented there have to be considered as approximate estimations representing the best available data. Nevertheless, one can doubt whether they reflect the real quantities of food waste generated at the different stages of the food chain. In the following the underlying approach of the BIOIS-study will be discussed.
As mentioned above, a mixture of data were used, compounded of EUROSTAT, national surveys and extrapolations by BIOIS. As far as possible, data from national studies were used because they were generally considered to be more accurate, based on more intensive research and more precise methodologies than the disclosure of animal and vegetal waste under EUROSTAT. However, the availability of national sources other than EUROSTAT are quite different for the individual steps of the food chain. While national research on food waste generated in the manufacturing sector is rare (BIOIS identified only one for the UK), there are quite considerable data on food waste of households for a variety of countries. For the wholesale/retail and the food services/catering sector data on food waste are also very scarce. Furthermore, definitions and methodologies of national calculations vary greatly between member states, limiting the comparability of results.
EUROSTAT-data are subject to uncertainties and limitations. The member states are obliged by Regulation (EC) No 2150/2002 on waste statistics (European Parliament and Council, 2002) to provide data on the generation, recovery and disposal of waste every two years, but there is no standardised methodology and the members are free to decide on the methods used for data collection. Possible options are surveys, administrative sources, statistical estimations or any combination of methods (Eurostat, 2013). As a result, it is generally difficult to judge on how reliable data provided by various governmental authorities are and whether data from different countries are comparable with each other. EUROSTAT-data are mainly used by BIOIS for the manufacturing sector. The given figures for animal and vegetal waste in this sector include both food waste and by-products that are either reused or recycled. Thus, it can be assumed that the estimations of BIOIS for this sector are generally too high.
For the wholesale/retail and the food services/catering sector, BIOIS used extrapolations for all countries lack their own empirical evidence. For the wholesale/retail sector, BIOIS identified four national studies from Austria, Denmark, Sweden and the UK. The per-capita figures of the UK, Denmark and Sweden were in a similar range, at 6 kg, 8 kg and 12 kg, whereas the figure for Austria with 32 kg per capita was much higher. BIOIS calculated an average of 8.89 kg per capita, using only the British, Danish and Swedish data and excluding the Austrian ones. National data for the food services/catering sector came from both the EU-15 (available for Austria, France, Germany, Sweden and the UK) and those member states that joined the EU after 2004 (available for Estonia and Slovenia). For these two groups, BIOIS calculated different average figures. An EU-15 average (27.32 kg per capita and year) and an average for member states that joined the EU after 2004 (11.98 kg per capita and year) were used to complete data for all countries lacking other evidence. Besides the fact that these scenarios are based on a narrow empirical basis, any existing differences between member states are blurred by this methodological approach.
For the household sector BIOIS used national studies, as far as possible. When no national research was available, EUROSTAT-data were used, unless the per capita quantity reported was anomalously low. In those cases a minimum scenario was applied. This minimum scenario was based on a study carried out by Arcadis (2009, 2010), which estimates the share of food in bio-waste as well as the share of bio-waste in municipal waste. The estimated share of food in backyard composted bio-waste makes up about 25%. This figure was chosen by BIOIS as an overall ‘conservative estimate’ of food waste in bio-waste, given the lack of more robust data. According to the Arcadis study, the share of bio-waste in municipal waste varies between 26% in the Czech Republic and 56% in Denmark. Taking the figure for Bulgaria of 33.5% – again as a conservative estimation – BIOIS calculated a minimum scenario of food waste on household level in EU-27 of 8.375% (33.5% multiplied by 25%) (Monier et al., 2010: 54). Owing to the fact that the share of bio-waste in municipal waste, as well as the share of food in bio-waste, are oriented towards the lower edge of the spectrum, one may wonder if the constructed minimum scenario reflects reality correctly.
Given the debatable reliability of the existing data stock, the following two sections introduce an alternative approach to calculate food waste generation in EU-27. The calculations are based on the methodology provided by the FAO report Global food losses and food waste: extent, causes and prevention (Gustavsson et al., 2011). In contrast to the FAO report, the calculations presented here do not include the Russian Federation and other Eastern European countries not being part of the EU, but refer separately to each of the EU-27 member states. The aim of the calculations is to check the reliability of the available data as they build the basis for the identification of wasting hotspots and the development of mitigation measures in Europe. In 2012, Gustavssons’s methodology was already applied to South Africa by Oelofse and Nahmann (2012). However, these calculations are not based on the detailed Food Balance Sheets (FBS) and the corresponding mass flows described in Gustavsson et al. (2013). Instead, the authors applied a simplified approach by taking only food production data from FAO and applying waste percentages for South Africa as given in the FAO report to each of the stages of the food chain.
Model calculations
The FAO study calculated food losses along the food chain for different world regions (Europe, North America, industrialised Asia, sub-Saharan-Africa, North Africa and Central Asia, South and Southeast Asia, Latin America). These calculations were based on the FBS provided by the FAO (FAO, 2014) and on waste percentages for different food groups at different stages of the food chain (see Table 1). These waste percentages are ‘based on a thorough literature search in scientific journals, on the internet, in statistical databases as well as at national authorities, departments and NGOs. (…) Where there were gaps of knowledge, assumptions and estimations based on food waste levels in comparable regions, commodity groups and/or steps of the food supply chain were made’. (Gustavsson et al., 2013: 12 et seq.). The literature that was used and the assumptions applied are described in more detail in the report. The waste rates are considered to be representative figures for Europe.
Estimated waste percentages for each food group at different stages of the food supply chain for Europe in % (Gustavsson et al., 2013).
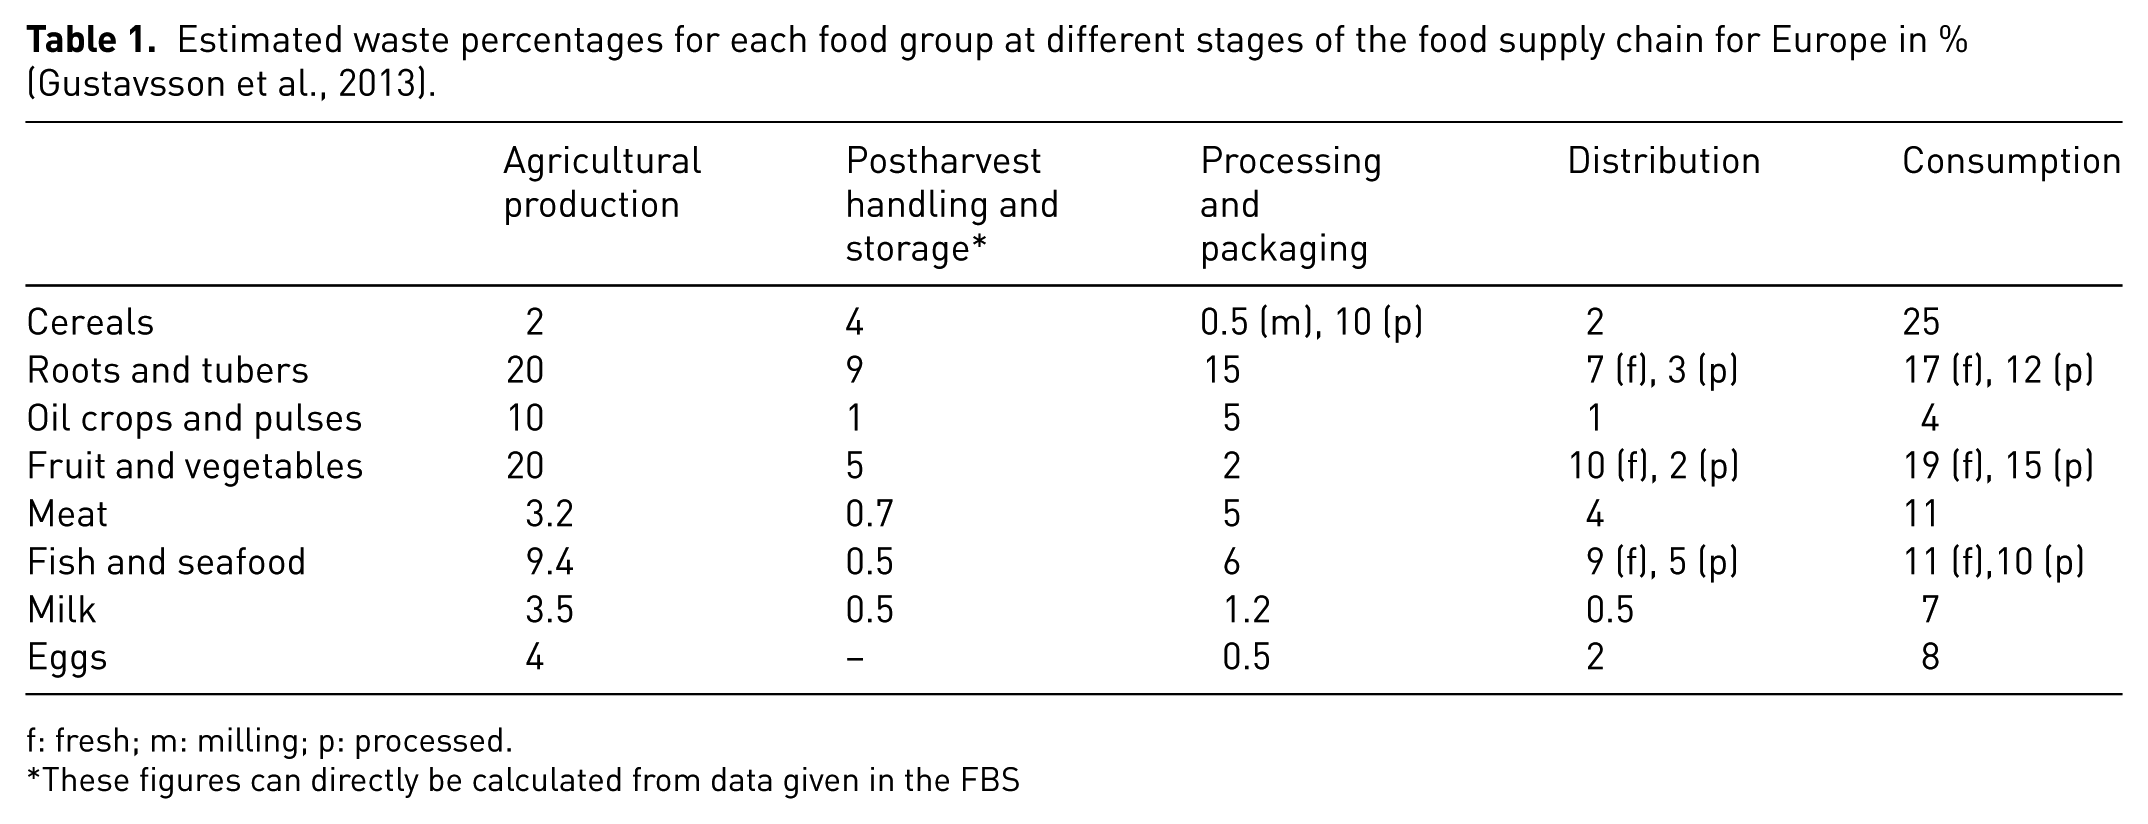
f: fresh; m: milling; p: processed.
These figures can directly be calculated from data given in the FBS
Since FBS are available for all EU member states, it is possible to apply this methodology to each of the individual countries. This approach offers several advantages. First, data from one source are used, which includes all relevant information for the EU-27 countries in a consistent manner facilitating a consistent proceeding. Second, the FBS are based on food production and utilisation data, which in general are collected more systematically than waste data. In addition, the results reflect differences in dietary patterns across the EU-27. Third, in contrast to the BIOIS approach, waste rates can be assigned to different product groups and all stages of the food chain, including the agricultural sector. Thus, the methodology allows for the identification of ‘hotspots’ that contribute most to increasing food waste (e.g. country, food group, stage of the food chain). The FBS are built on official information submitted by national governments. The FAO takes efforts to check these data for plausibility and consistency and to transform them into the FBS (Jacobs and Sumner, 2002).
However, it should be noted that there are also weaknesses limiting the liability of the results. The main disadvantage is that the waste percentages are, in most cases, identical for all European countries. Thus, the results are merely approximations, not entirely reflecting country-specific differences concerning behaviour and technologies.
Description of the methodology
The FBS show the mass flow of a country’s food supply during a specific period of time. According to Gustavsson et al. (2013: 13) ‘for each commodity group the domestic supply quantity (E) equals the sum of the supply elements production (A), import quantity (B), stock variations (C) and export quantity (D). Food available for human consumption (J) is left after withdrawing the utilisation elements feed (F), seed (G), processing (H) and other utilities (I) from the domestic supply quantity (E)’ (see Figure 1). “Processing” is defined as ‘the amount of the commodity available for human consumption as part of mixed processed food products, containing different types of commodities’. “Other utilities” include ‘the amounts of commodity lost during handling, storage and transport between production and distribution as well as amounts of the commodity used for non-food purposes, e.g. oil for oil production and wheat for bio-energy’ (Gustavsson et al., 2013: 13). Food groups taken into account for the calculations are: cereals, roots and tubers, oil crops and pulses, fruit and vegetables, meat, fish and seafood, milk and eggs. The following stages of the chain are considered: agricultural production, postharvest handling and storage, processing and packaging, distribution and consumption. It should be noted that the term “consumption” in Gustavsson et al. (2013) includes domestic consumption as well as out-of-home consumption at restaurants, coffee shops, canteens, take aways, etc. This necessarily results from the use of the FBS, which do not allow for further differentiation.
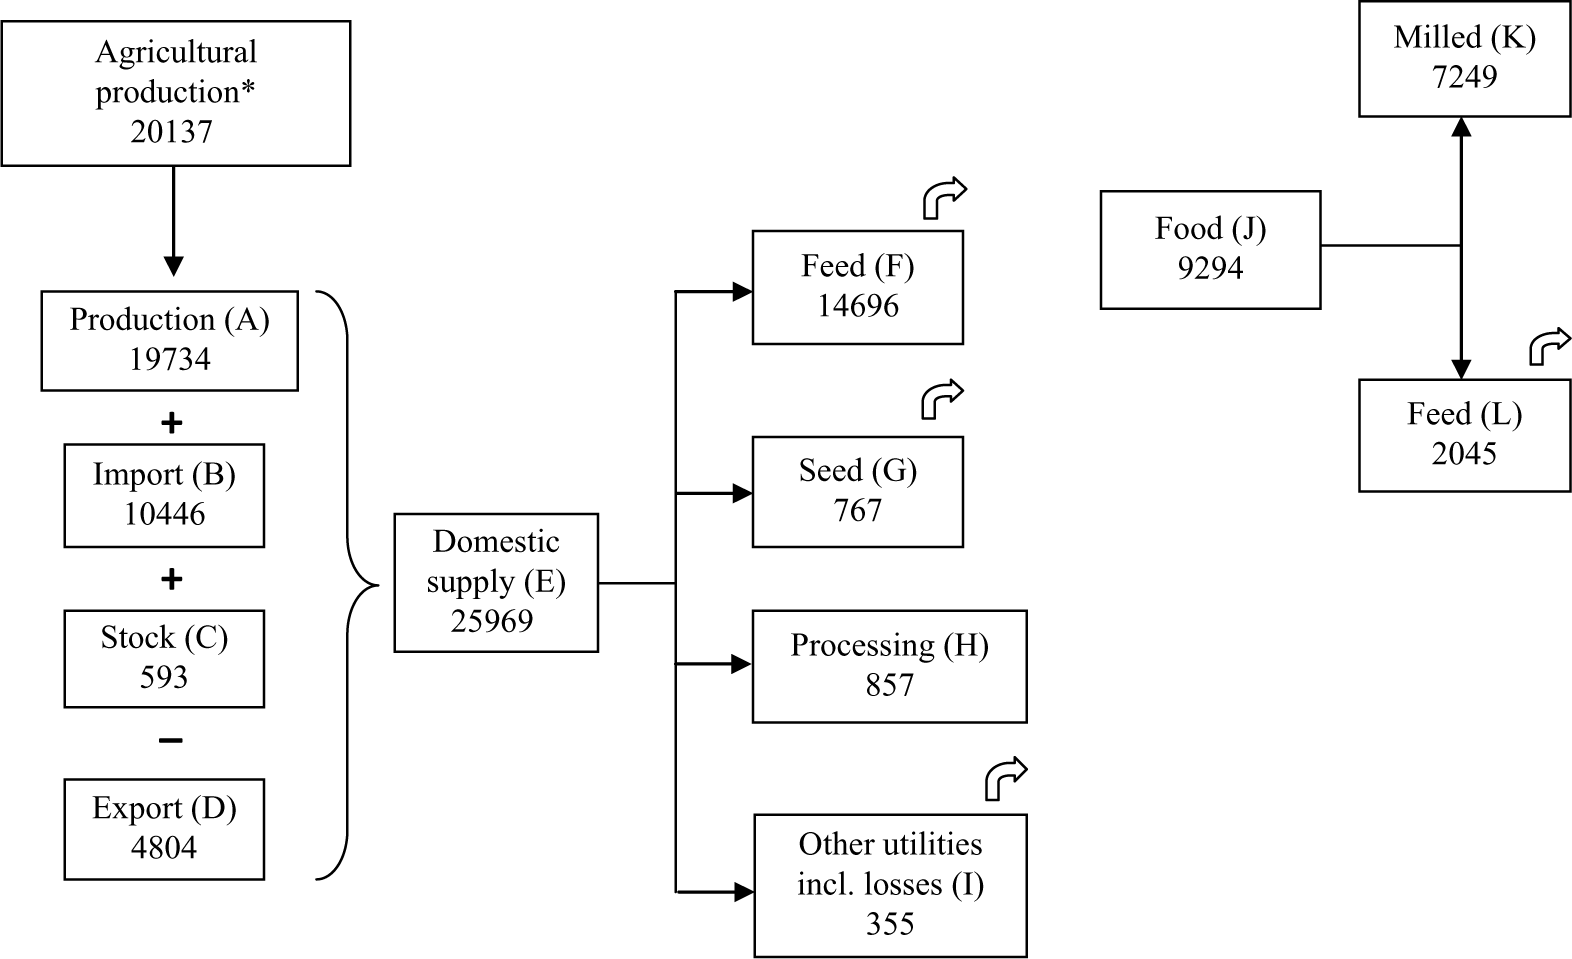
FBS ‘cereals’ for Italy in 2006 (figures are given in 1000 tonnes) (modified according to Gustavsson et al., 2013).
Food waste was calculated on the basis of the waste rates given by Gustavsson et al. (2013) (see Table 1), except for “postharvest handling and storage”. Rates for this sector were calculated directly from data in the FBS and therefore represent country-specific characteristics. Data for agricultural production (AP) are not given in the FBS and thus were calculated indirectly by applying the waste percentages given in Table 1 via:
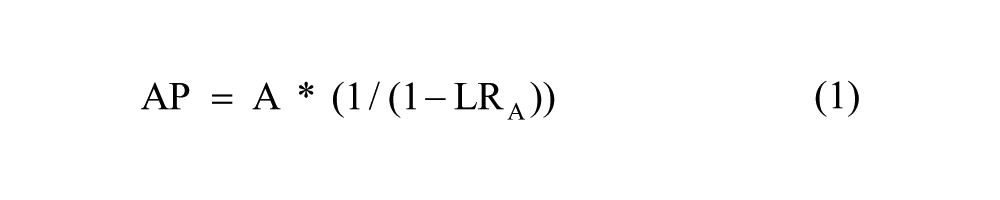
A represents the production quantity of the respective food group available for the market, as given in the FBS. LRA is the loss rate in agricultural production as shown in Table 1. The methodology for calculating food waste along the different stages of the food chain will be described in the following, using the example of cereals in Italy (see Figure 1). In the case of cereals, Gustavsson et al. (2013: 15) used conversion factors to convert food available for human consumption (J) to milled equivalents (K). The feed (L) amount was derived from subtracting the milled equivalents (K) from food (J). For all EU-27 countries, a conversion factor for wheat and rye of 0.78 was used.
In addition, Gustavsson et al. (2013: 15) introduced allocation factors (AF) in order to estimate the fraction of cereals lost during agricultural production and postharvest handling and storage. This allocation factor was introduced since a large share of the cereal domestic supply (E) is used for feed and/or bioenergy. The allocation factor was calculated via:

In Gustavsson et al. (2013) an average figure for Europe of 35% was applied. For the calculations presented here, this allocation factor was calculated separately for each of the EU-27 countries on the basis of data given in the FBS. In the case of Italy the corresponding figure is 28%.
Losses (LP) for the step “postharvest handling and storage” can be calculated by help of the following equation:
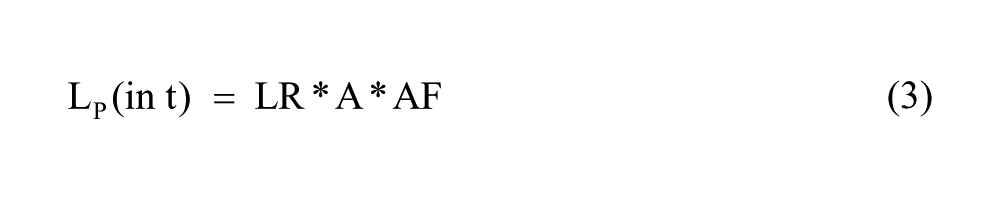
LR is the loss rate and AF the above mentioned allocation factor. For the loss rate, an average figure of 4% for Europe is given in the FAO-study (see Table 1). Instead, the rate can be quantified for the individual EU-27 countries by way of the following equation:
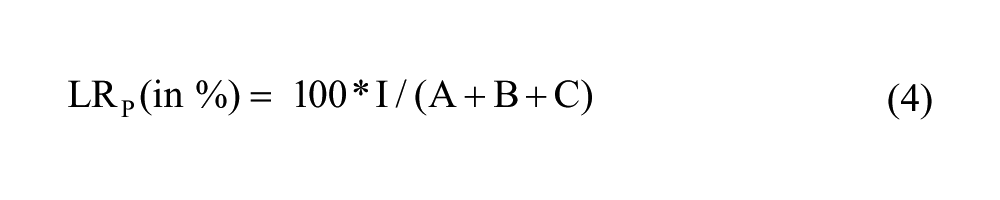
The resultant value for Italy is 1.15%.
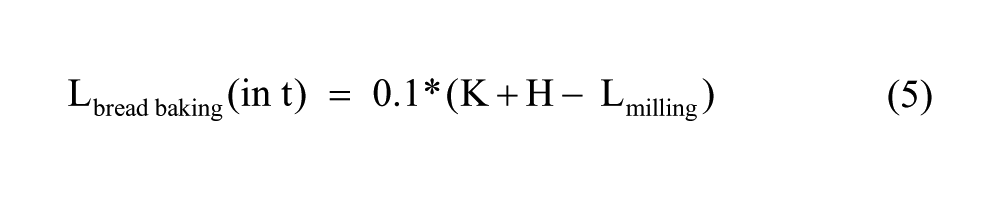
For the stage “processing and packaging”, a distinction was made between losses for milling [Lmilling = 0.5% of (J)] and losses for “industrial bread baking” with a loss rate of 10%. The losses for “industrial bread baking” can be calculated via:
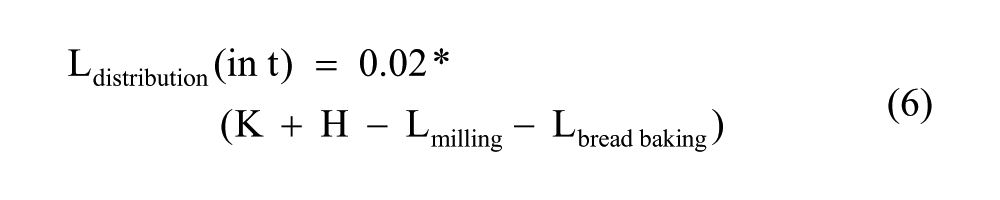
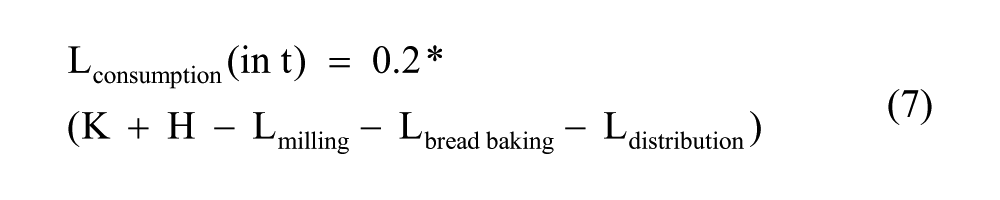
For the stage “distribution”, the loss rate is 2% and for ‘consumption’ it is 25% (see Table 1). The losses are calculated as follows:
For all other food groups the calculations were performed in a similar way. However, owing to the fact that processing steps and corresponding mass flows differ between food groups, the calculation procedure had to be adapted as well. For more details see Gustavsson et al. (2013).
Results of the model calculations
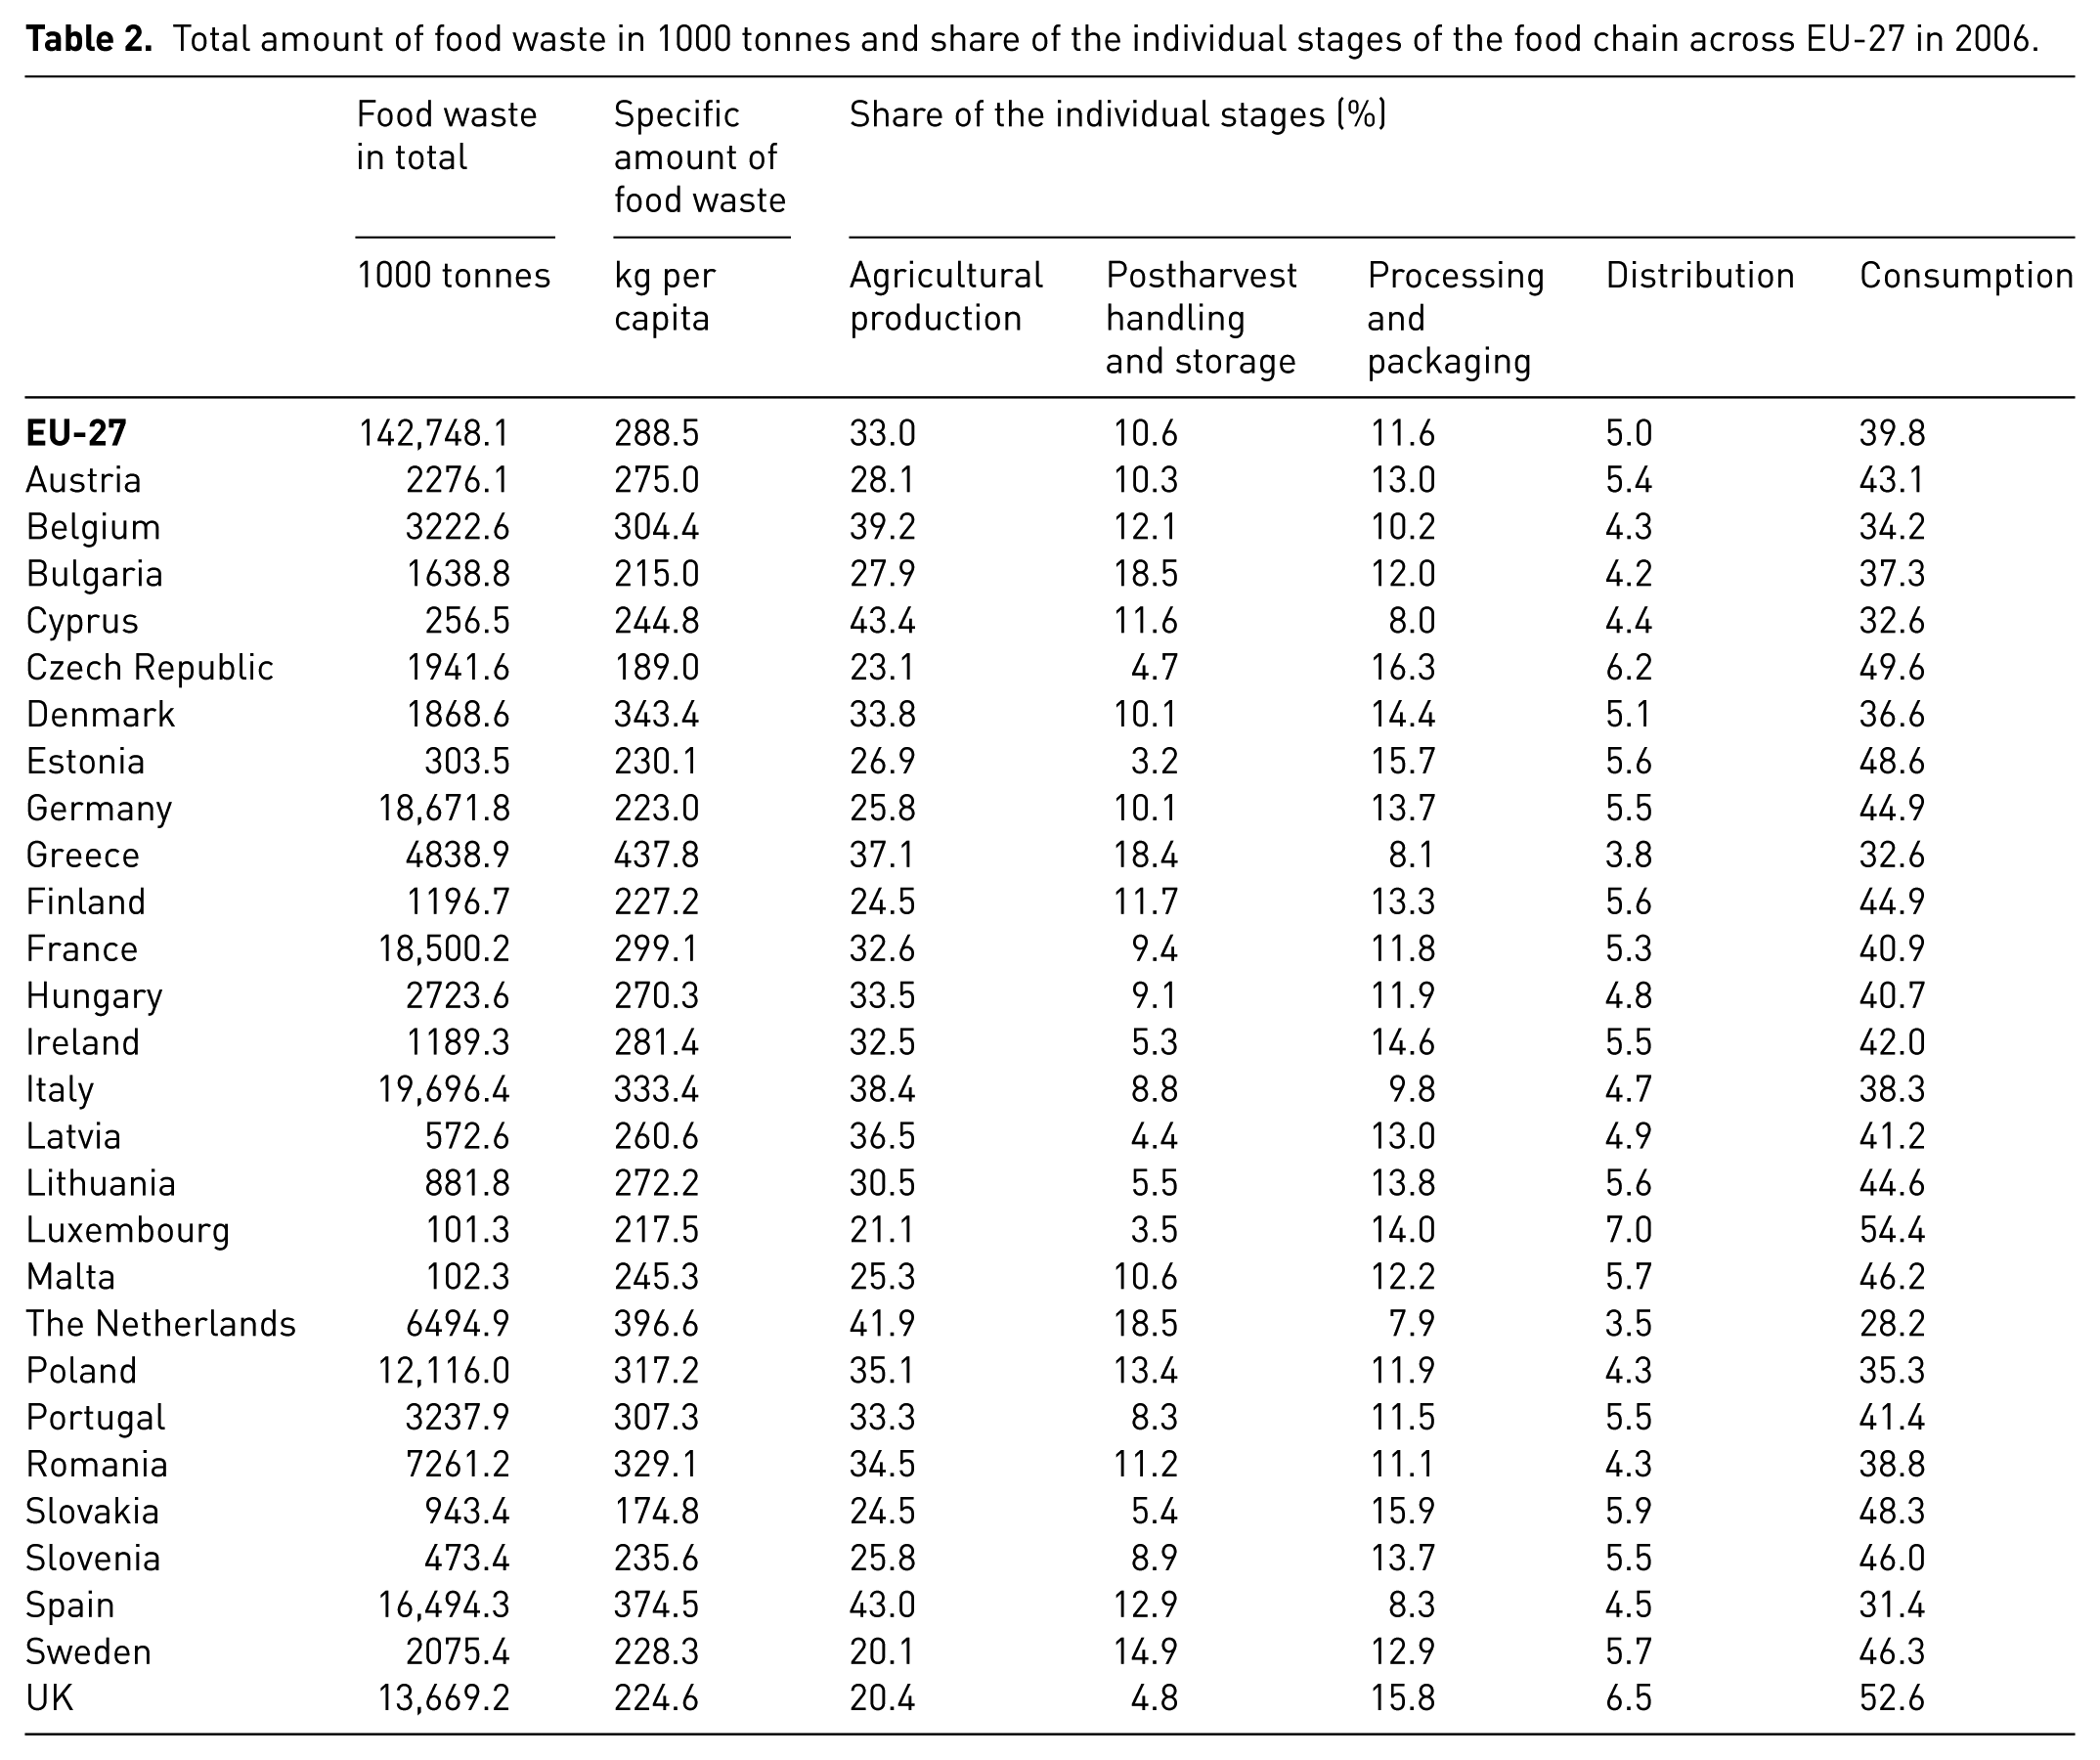
Calculations refer to 2006 because for this year a comparison with results from the BIOIS study is possible. As can be seen from Table 2, the first and the last step of the food supply chain contribute most to total food waste generation in EU-27: agricultural production with 33% of total food waste and final consumption with 40% of total food waste. Shares of agricultural production range from 20% in Sweden and the UK to about 43% in Cyprus, Spain and the Netherlands. Final consumption amounts to percentages between 28% for the Netherlands and 54% for Luxembourg, followed by the UK with 53% of total food waste. The per capita amount of food waste over all stages varies between 175 kg for Slovakia and about 438 kg for Greece and 397 kg for the Netherlands.
Total amount of food waste in 1000 tonnes and share of the individual stages of the food chain across EU-27 in 2006.
In the following, the share of food waste broken down by product groups will be exemplarily shown for the two stages with the greatest impact – agricultural production (Figure 2) and final consumption (Figure 3). Owing to the fact that waste percentages in agricultural production and final consumption are different for all food groups (e.g. for cereals 2% in agricultural production and 25% in final consumption), the shares of losses differ significantly between the first and the last step of the food chain. Thus, a comparison between the two figures should be interpreted with caution.
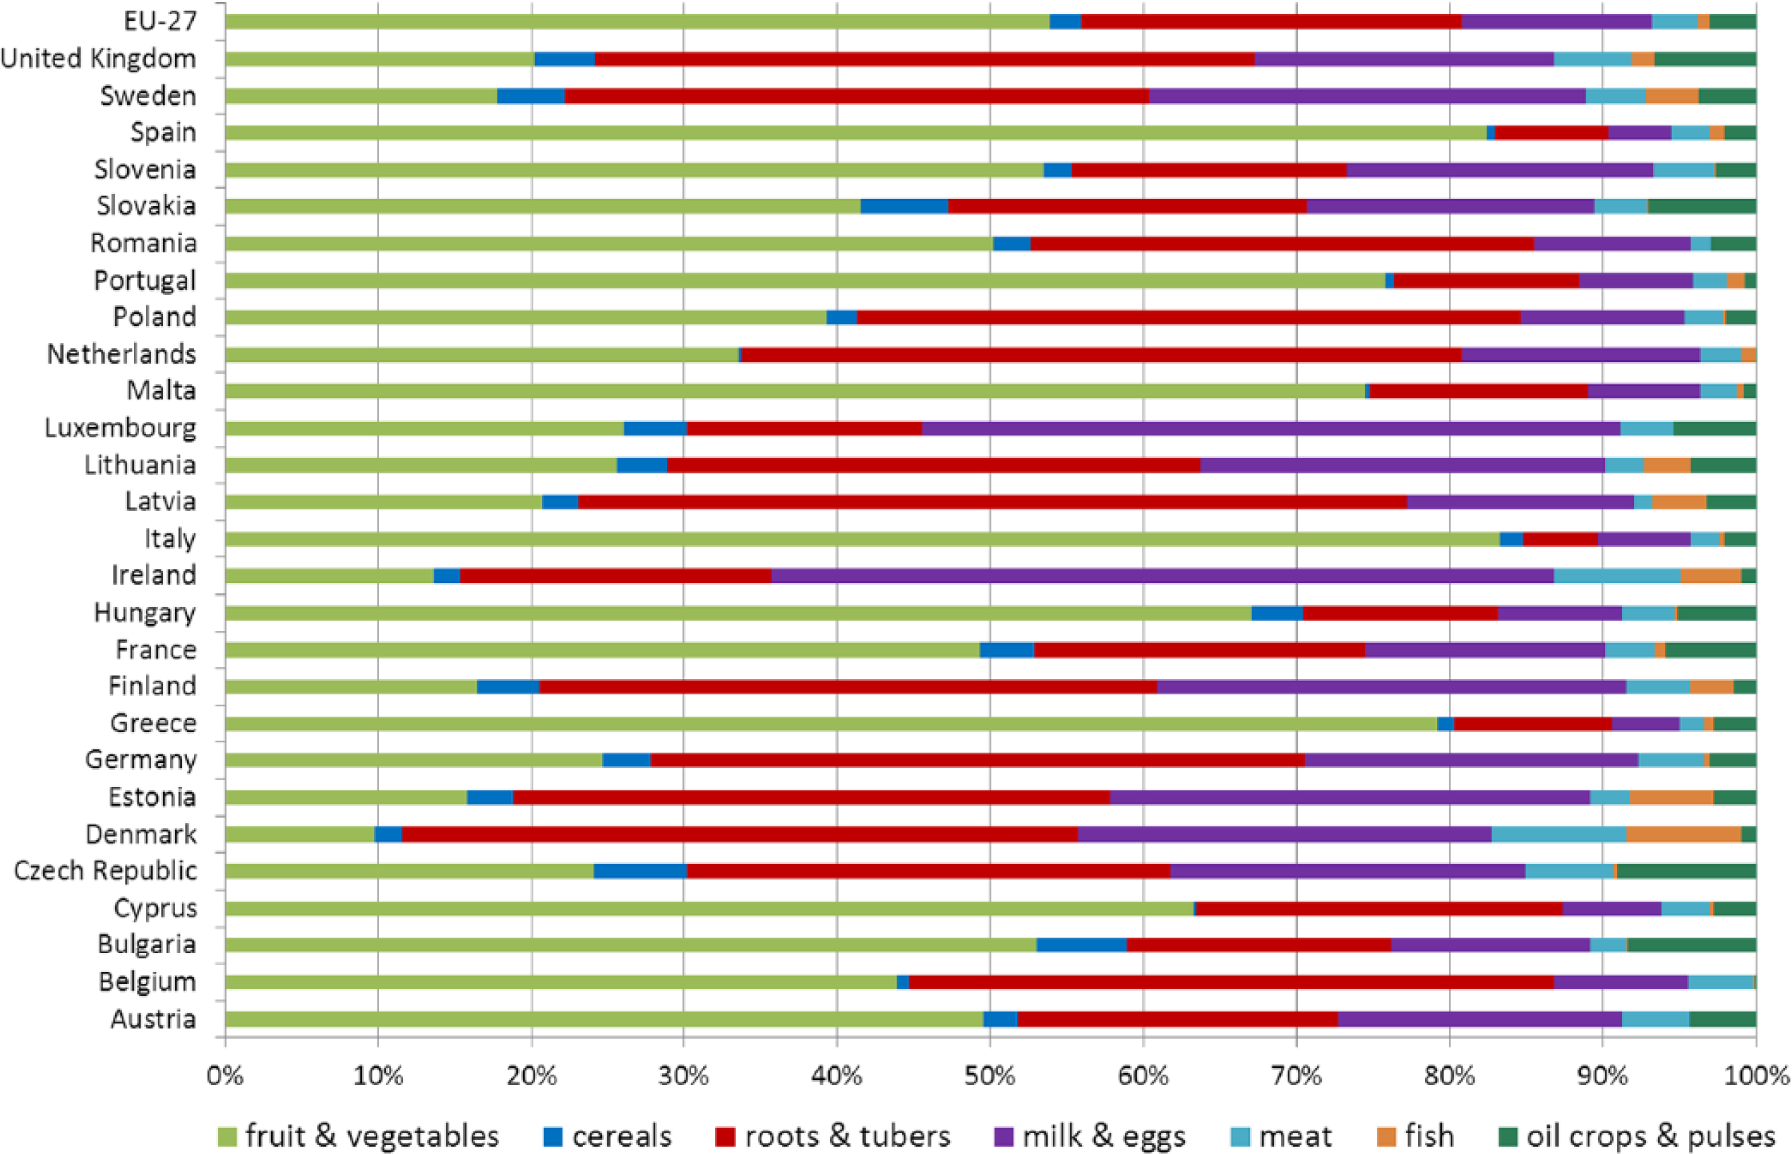
Percentages of different food groups of total food waste generation in agricultural production across EU-27 in 2006.
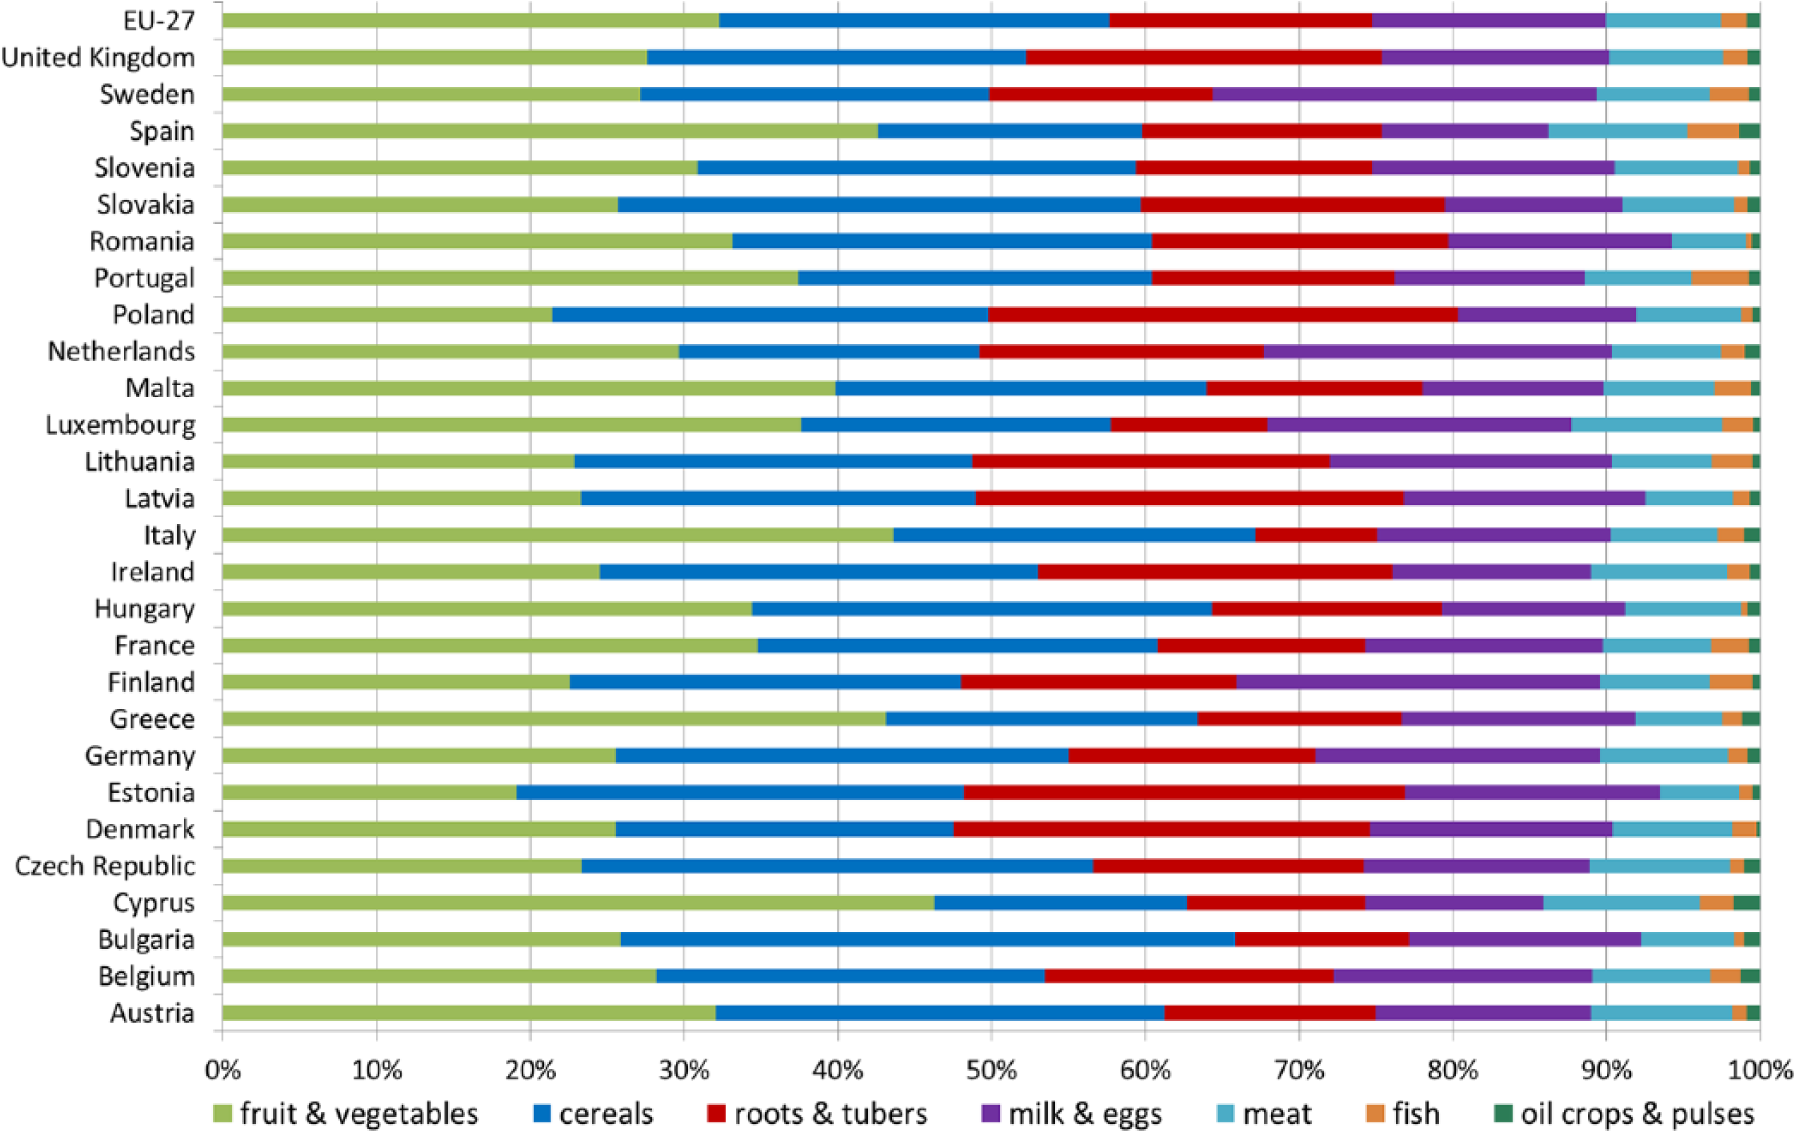
Percentages of different food groups of total food waste generation at the consumption stage across EU-27 in 2006.
Considering agricultural production, fruit and vegetables have the largest share of food waste. On EU-average, the waste rate amounts to 54%, with a focus on Southern European countries like Italy, Spain, Greece and Portugal, which are important producers. Roots and tubers follow with an average share of 25%, with a main focus on Western and Eastern Europe (in descending order: Latvia, the Netherlands, Denmark, Poland, Germany, the UK). Milk and eggs make the third largest group with an average proportion of 12%. Waste shares of milk and eggs are highest in Ireland and Luxembourg. In the UK and some Eastern European countries like Slovakia, Bulgaria, the Czech Republic, oil crops and pulses account for 7% to 9%, whereas in other European countries their share is very small.
Considering final consumption, the picture is quite different. For the majority of EU-member states, the most important food group lost is fruit and vegetables, which contributes, on average, about 32% to total food waste (19% for Estonia and between 43% and 46% for Greece, Spain, Italy and Cyprus). The FBS show that the Southern countries still have relative high consumption rates for fruits and vegetables. Examples are Greece with 392 kg, Malta with 320 kg and Italy with 309 kg per capita in 2006. The lowest figures can be observed for Bulgaria, the Czech Republic, Estonia, Slovakia and Finland (less than 165 kg per capita). This finding is underpinned by other empirical studies on food patterns in Europe (Elmadfa, 2009; Naska et al., 2006; Trichopoulou et al., 2002). The second important group is cereals, with an average share of 25% (between 17% for Spain and Cyprus and 40% for Bulgaria). Roots and tubers rank third, with an average share of 17%. The share of meat and fish of total food waste is relatively small, and the share of oil crops and pulses negligible.
Comparison of model calculations with BIOIS-results
In this section, the results of the model calculations will be compared with results from the BIOIS study. The focus is on the stages of ‘processing and packaging’ and ‘final consumption’. The stage of processing and packaging was chosen because, for this step, BIOIS applied data from EUROSTAT (sector: ‘Manufacture of food products, beverages and tobacco products’) for all countries except the UK. Owing to the limitations of EUROSTAT-data described above, a comparison seems to be particularly interesting. The stage ‘final consumption’ was taken into consideration because there is consensus in literature that this stage is one of the most important ones in terms of food waste generation. On the other hand, the data given in the BIOIS study are based on different sources as well as on extrapolations and might be linked to considerable uncertainties.
Manufacturing sector
The comparison shows that for Italy, Poland, the Netherlands and Belgium, EUROSTAT data on food waste in the manufacturing sector are by far higher than the results from the model calculations (see Table 3). The Italian data are higher by a factor of 3 than the corresponding data for Germany, although data given in the FBS do not show any considerable differences between these countries – in most cases Italian figures are even less. EUROSTAT data given for Poland are comparable with those for Italy. However, the amount of food produced and manufactured in Poland is by far less. Food production in Belgium is similar to that of the Netherlands. However, according to EUROSTAT, the amount of food waste generated in the Netherlands is much higher, and even higher than for Germany, despite a lower food production volume. EUROSTAT data on food waste in the French manufacturing sector are by far less than the calculated figures on the basis of FAO data and are also far less than those for countries that have comparable food balances (e.g. Germany or Italy). For these countries the differences cannot be explained by technological inefficiencies in the manufacturing sector or the scale of food industry in the countries.
Comparison of food waste quantities in the manufacturing sector according to EUROSTAT and model calculations (in 1000 tonnes).
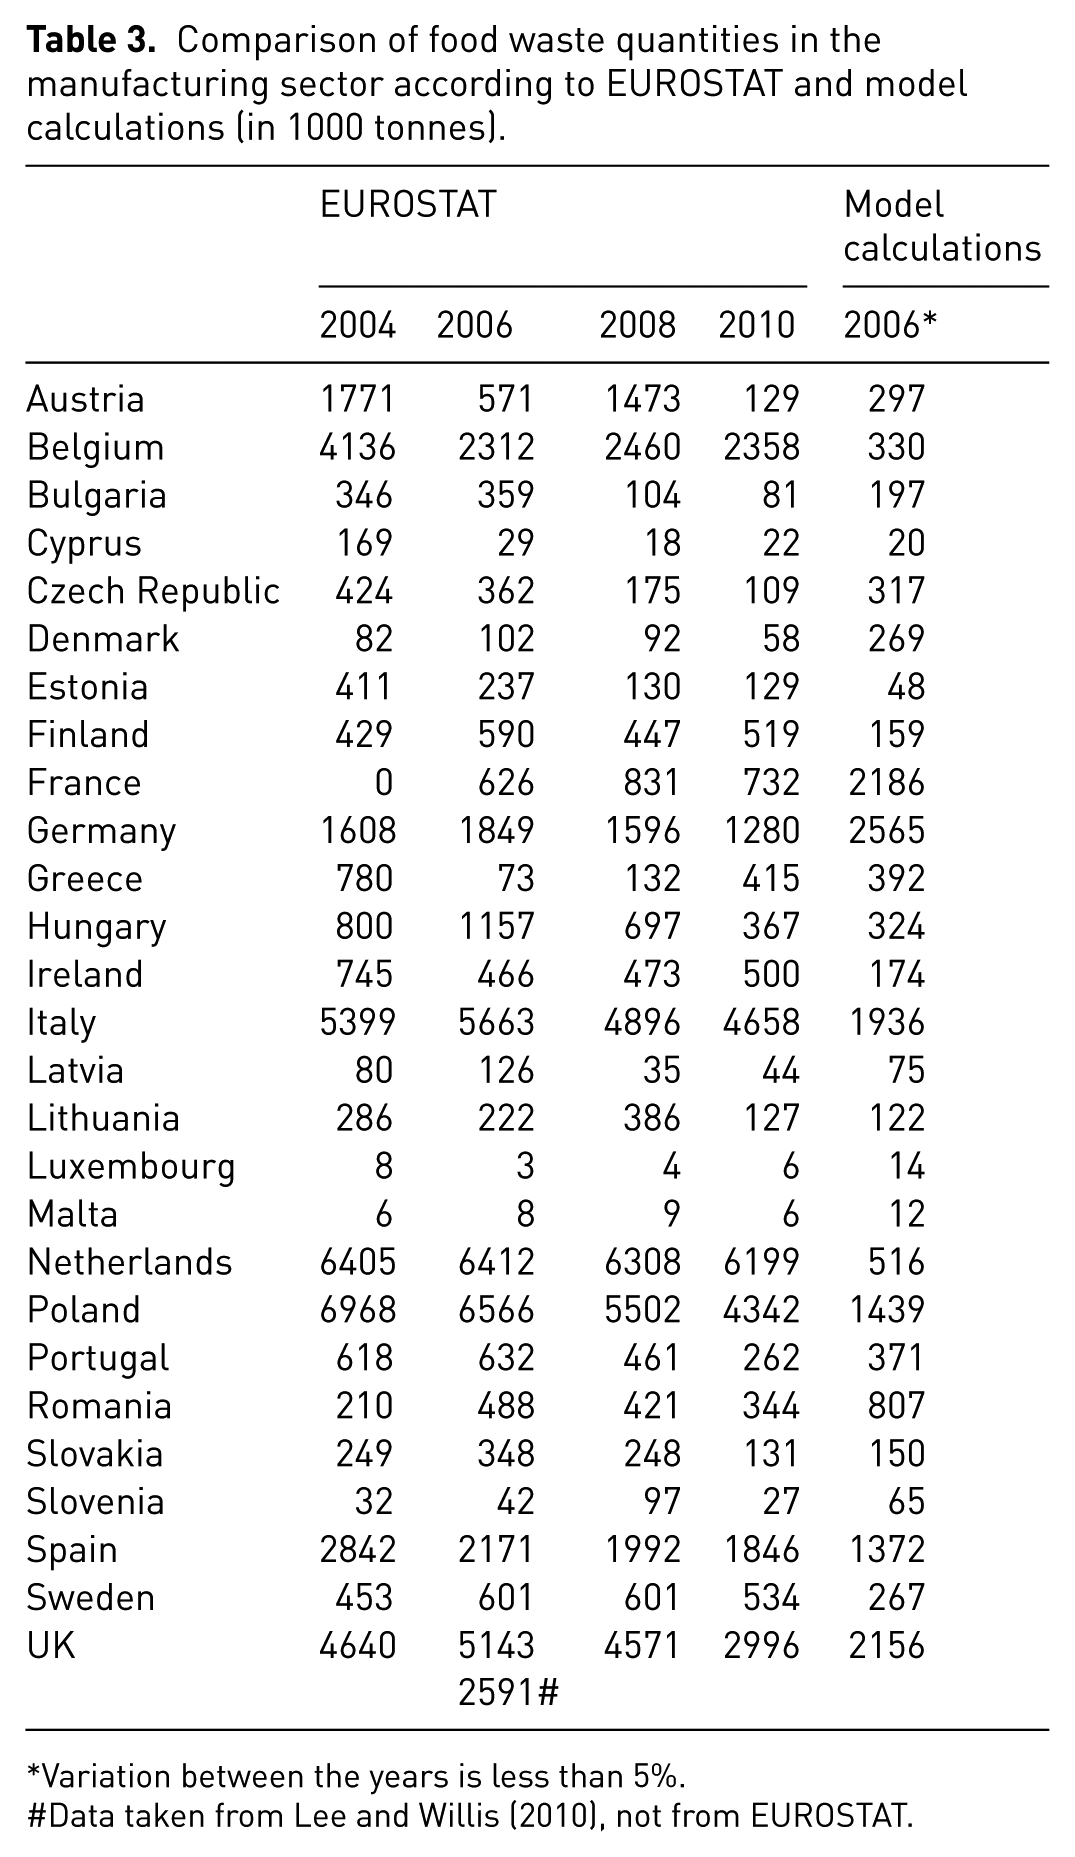
Variation between the years is less than 5%.
Data taken from Lee and Willis (2010), not from EUROSTAT.
Reasons for the high figures under EUROSTAT might be that the figure of animal and vegetal waste includes both food waste and by-products that are either reused or recycled. Furthermore, the amount of waste particularly for meat products includes, to a considerable extent, components like bones, carcasses and organs that are commonly not eaten and are thus not covered by the term ‘food waste’ as defined by Gustavsson et al. (2013) and also by Priefer et al. (2013). Thus, it can be assumed that the estimations of BIOIS for this sector are generally too high.
There are at least two European case studies providing empirical evidence to confirm this assumption. The WRAP study ‘The food we waste’ (Ventour, 2008) comes to a share of food waste in the manufacturing sector in the UK, which is only half as high as the figure supplied by EUROSTAT (2,591,000 tonnes a-1 compared with 5,142,864 tonnes a-1). For the Netherlands, EUROSTAT shows one of the highest amounts of food waste generation in the manufacturing sector: 6,412,330 tonnes a-1 corresponding to 72.5% of total food waste or 393 kg per capita (Monier et al., 2010: 48). More recent calculations for the Netherlands have revealed that the figure reported by EUROSTAT is a factor 3.5 to 6 higher than the current calculations (Soethoudt and Timmermans, 2013).
Another objection with respect to EUROSTAT data is their great variability for different years, which limits the reliability of any related analyses. As can be seen from Table 3, EUROSTAT data for the period 2004–2010 are strongly fluctuating for some countries (see e.g. Austria or Greece). It is not known whether this is a result of changes in the applied technologies and ways of behaviour or of changes in data collection. But it can be assumed that these fluctuations are related to inconsistencies in data collection. If data from another year had been fed into the BIOIS approach, the results would differ significantly from those for 2006.
Table 3 shows EUROSTAT data on food waste in the manufacturing sector for 2004, 2006, 2008 and 2010. Model calculations have also been performed for 2004, 2006, 2008 and 2009, the latest data in the FBS. As variations between the years are in most cases less than 5%, results of the model calculations are only shown for 2006.
Household sector
In the BIOIS study, the amount of food waste in the household sector was estimated as follows.
For Denmark, France, the UK, Austria, Ireland, the Netherlands, Estonia and Sweden the data were taken from literature mainly based on national studies.
For Italy, Luxembourg, Poland, Belgium and Germany – all countries without appropriate studies until 2010 – data were taken from EUROSTAT waste statistics for the household sector in 2006.
For all other countries a so-called ‘minimum-scenario’ was applied.
Figure 4 shows the per capita food waste generation at the final consumption level for the EU-27. The countries have been grouped according to same data sources (see explanation above). Owing to the fact that the FBS only consider ‘food supply’, they do not allow for a differentiation between domestic consumption and out-of-home-consumption at restaurants, coffee shops, canteens, takeaways, etc. Thus, the term ‘final consumption on household level’ in the SIK approach includes both types of consumption, whereas the BIOIS results differentiate between ‘households’ and ‘food service and catering’. To make a comparison between the results more transparent, a distinction is made within the BIOIS column between domestic consumption and out-of-home consumption.
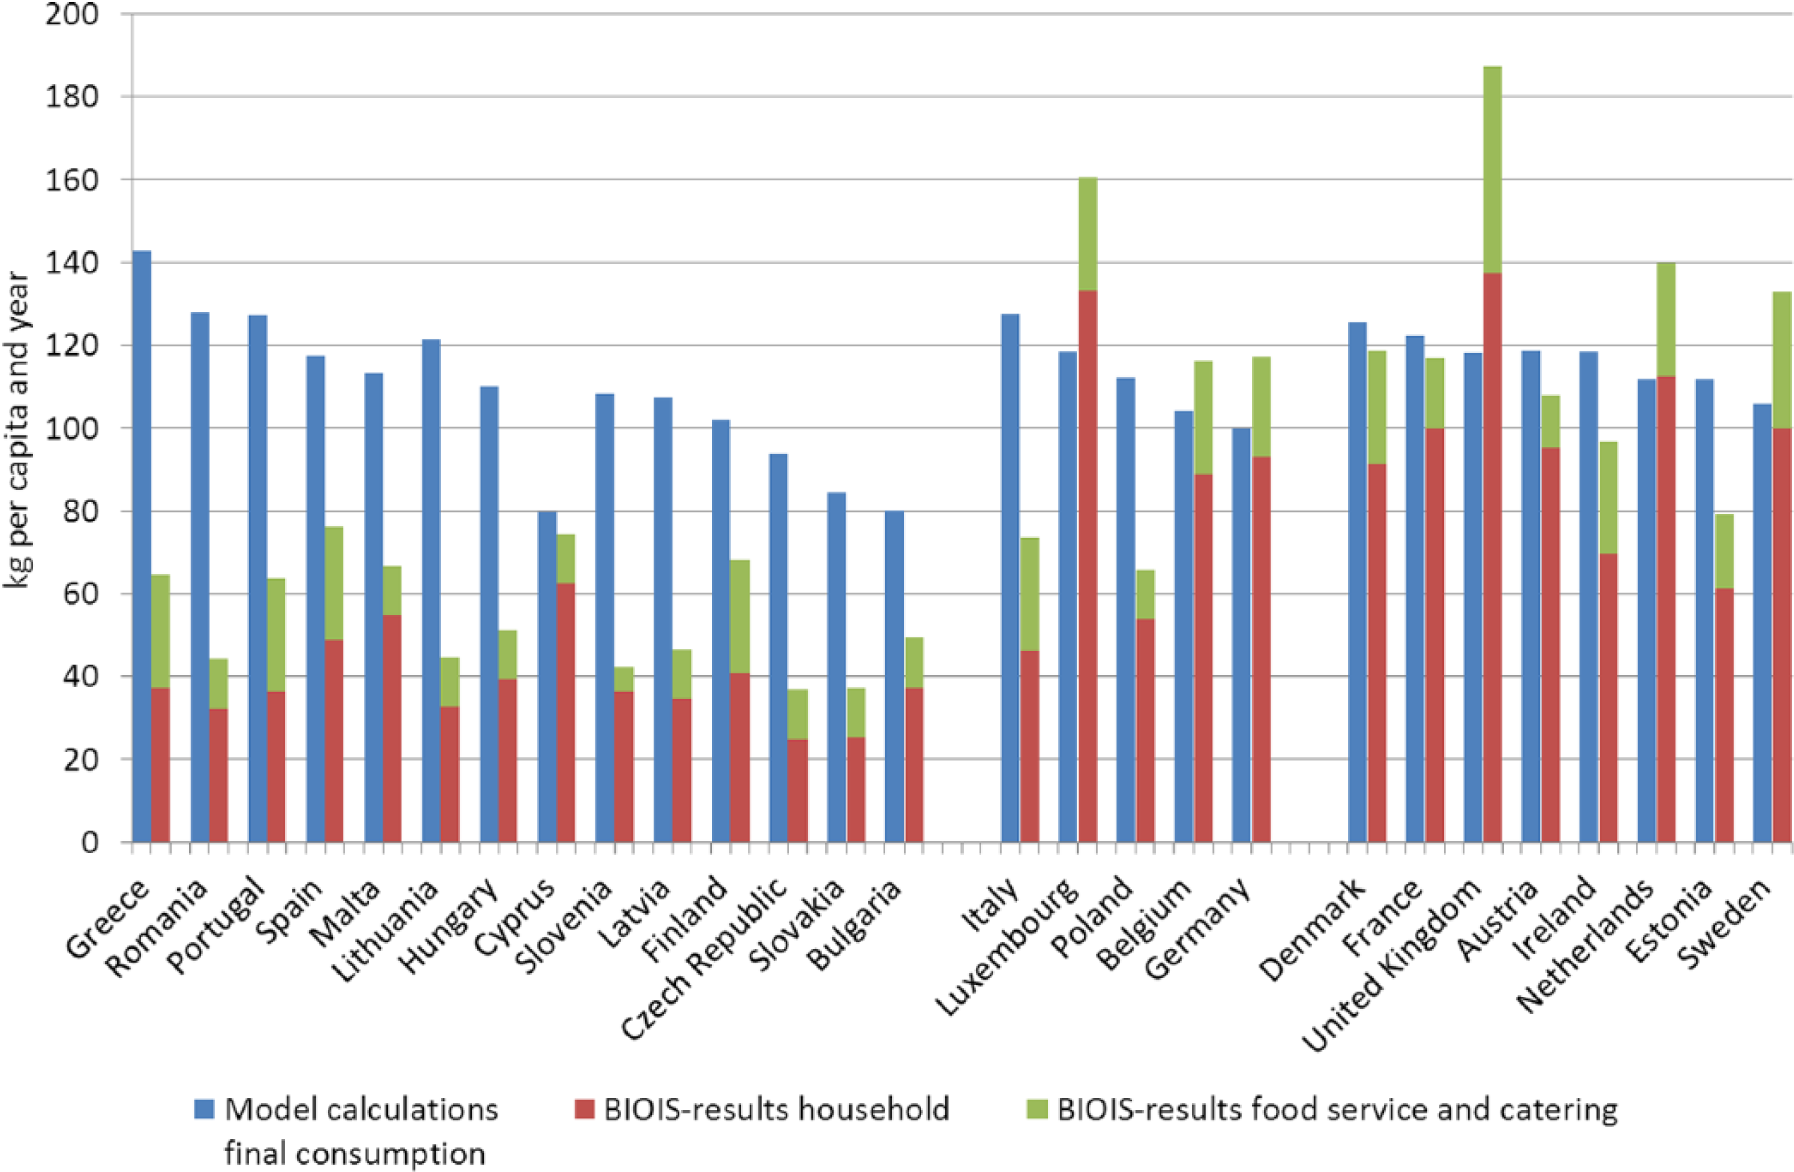
Per capita food waste generation at household level – comparison of model calculations with data given in the BIOIS study for EU-27 in 2006.
For countries on the left side of the figure (Greece to Bulgaria), food waste on household level was calculated by BIOIS on the basis of a ‘minimum scenario’. For all these countries, the per capita amount of food waste estimated by BIOIS is much lower than the results of the model calculations. Reasons might be that the average figure chosen by BIOIS for the minimum scenario is too low. This assumption is underpinned by the results of a recent national study concerning food waste behaviour in Finland. The study reveals that Finnish households discard 50 kg to 65 kg food per capita and year (solely the avoidable part), in contrast to 41 kg food waste in the minimum scenario (Katajajuuri et al., 2011).
For countries in the middle group, data from EUROSTAT are used. The compliance for two of the five countries in this group (Belgium, Germany) is quite high. Regarding Germany, recent calculations by Kranert et al. (2012) have revealed that household food waste amounts to 82 kg per capita and year, which corresponds quite well with the result of our model calculations. Major differences can be seen for Italy (127.7 kg per capita calculated compared with 46.1 kg per capita in the BIOIS study) and Poland (112.1 kg per capita compared with 53.7 kg per capita). Especially in the case of Italy, the BIOIS result does not seem plausible because it is much lower than those for other countries with a similar living standard and available household income, like Belgium and Germany.
For countries on the right side of Figure 4, the results of BIOIS are based on national studies. In general, the compliance is much better than for countries on the left side. Major differences can be seen for Ireland (118.3 kg compared with 69.5 kg per capita) and Estonia (111.9 kg compared with 61.2 kg per capita). In the case of the UK, the Netherlands and Sweden, the results of the model calculations are significantly below the estimations given by national studies.
Outlook on latest FBS-data
An advantage of the SIK methodology is that calculations can be performed for different years. In contrast, the BIOIS methodology refers partially to national studies which only represent snapshots. Repeating the BIOIS estimations would be a complex process, whereas the FBS are compiled regularly.
The calculations presented for 2006 were also performed for 2009, the latest year up to now for which FBS are available. Figure 5 illustrates the changes in total food waste generation across EU-27 for 2009 compared with 2006. For most of the countries the figures for 2009 do not differ very much from those for 2006 and there is no general trend (increase respective decrease by less than 5% for most of the countries). Deviations might be caused, e.g. by changes in production volumes, but also by variations in food supply, which are documented in the FBS. Whether a decrease in food waste is a result of national campaigns and mitigation measures or is caused by other reasons, including declining household incomes triggered by the economic crisis, cannot be deduced from these data. The highest decrease is calculated for Bulgaria with 12.7%. This is a result of lower production quantities for roots and tubers as well as for fruit and vegetables in 2009 compared with 2006. The highest increase can be seen for Finland, with food waste being higher by 18.4% in 2009 compared with 2006. This can be mainly explained by higher production volumes for roots und tubers.
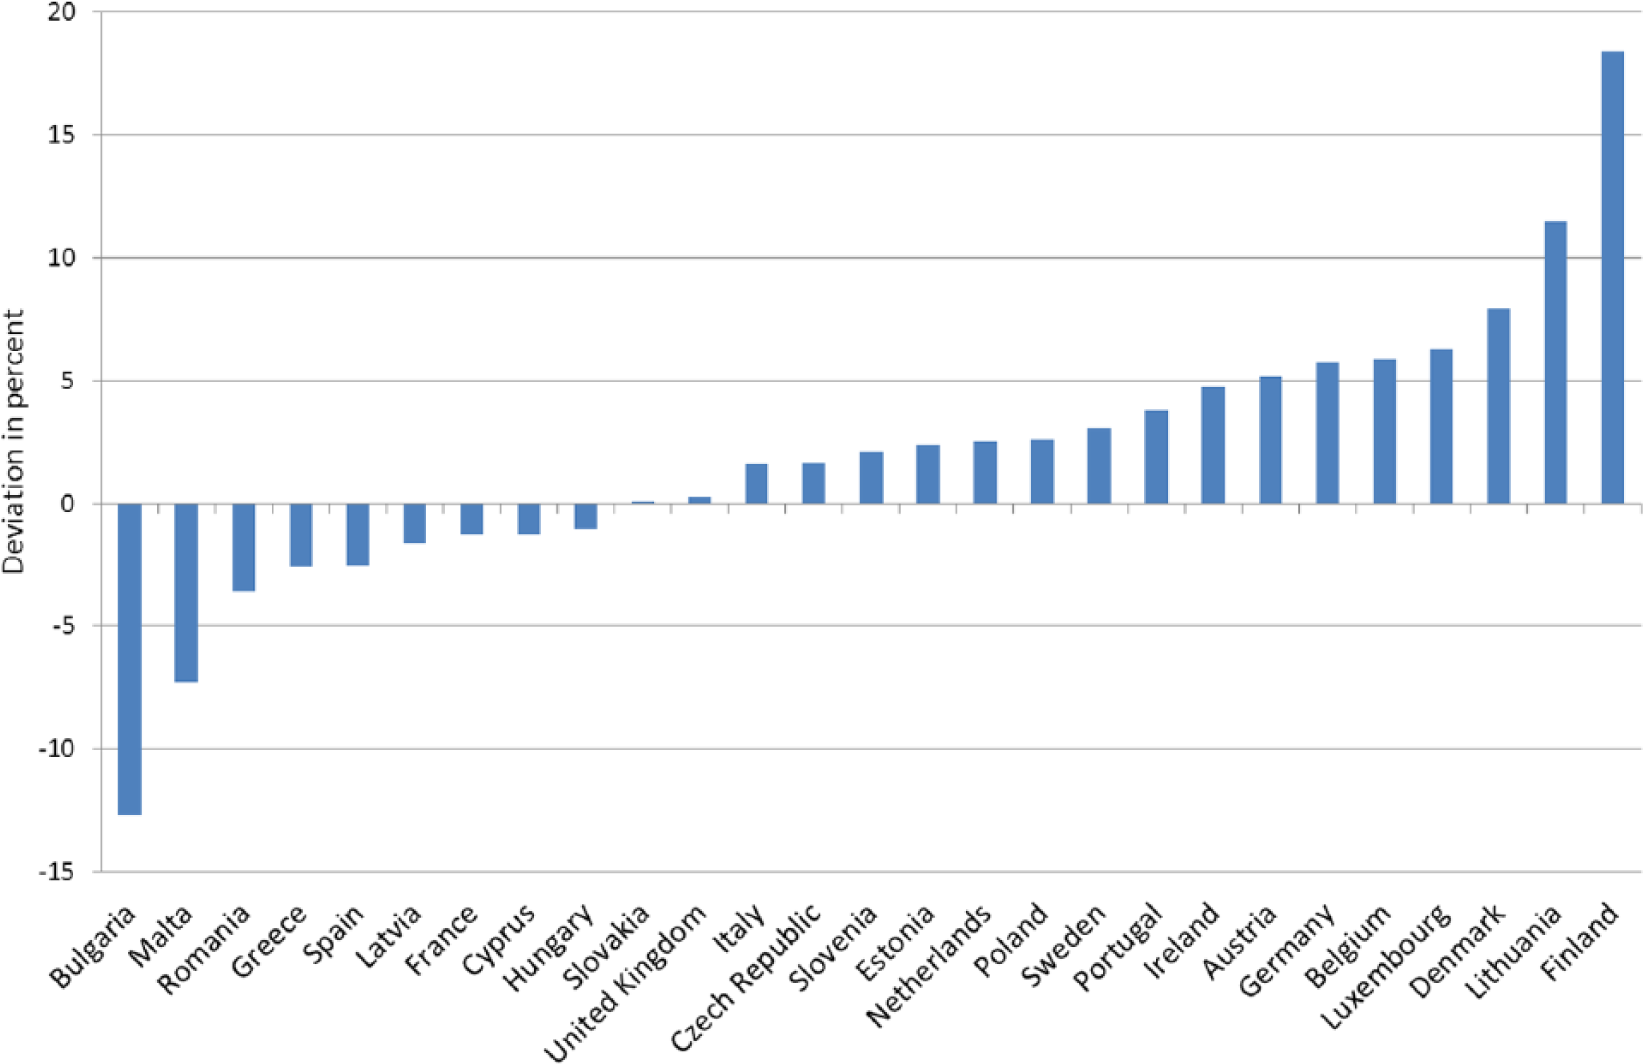
Change of total food waste generation in EU-27 in 2009 compared with 2006.
Conclusions
The comparison of data reveals that the results on food waste generation in EU-27 differ significantly, depending on the data sources chosen and the assumptions made. EUROSTAT’s waste statistics, which constitute one part of the pan-European calculations by BIOIS, are not yet sufficient for providing insight into the extent of food waste generation in the EU because they do not explicitly cover this category. The methodology provided by Gustavsson et al. (2013) offers the opportunity to calculate food waste generation in the EU, and also globally along the whole food chain, without the availability of original food waste data. As long as food waste data are not gathered systematically, it seems reasonable to consider such alternative data sources and models. However, it has to be recognised that all calculation methods can only be seen as approximations, which barely reflect reality.
An improvement of the EUROSTAT data is expected as a result of the FP7-project FUSIONS, which works on a European framework for data collection (FUSIONS, 2014). This especially includes the development of a handbook that will be agreed with EUROSTAT and shared with all member states. A uniform definition of the term ‘food waste’ and how it should be quantified will build the basis. Nonetheless, these data should be supplemented by more accurate national surveys on the individual stages of the food chain in order to get a comprehensive picture. Thus, more systematic research on the extent of food waste is much needed, which will make it possible to implement appropriate mitigation strategies and monitor their progress.
Footnotes
Declaration of conflicting interests
The authors declare that there is no conflict of interest.
Funding
This article is based on a project funded by the ‘Science and Technology Options Assessment Board’ (STOA) of the European Parliament (IP/A/STOA/FWC/2008-096/Lot7/C1/SC2-SC4).