
Abstract
Adoption of environmental management systems (EMSs) based on ISO 14001 has constituted one of the most important developments in sustainable industry management in recent years. Previous research on the impact of EMSs has relied heavily on corporate representatives’ subjective perception of benefits. Moreover, studies tend to focus on the systems’ impact on firms’ overall environmental performance, not distinguishing between the differences in different environmental aspects. This study aims to contribute knowledge about the influence of certified EMSs on industrial waste generation based on objective industrial waste data derived from mandatory annual environmental reports. The study focuses on changes in waste generation over a period of 12 years and includes both ISO 14001-certified firms (66 firms) and non-certified firms (50 firms). Consideration is given to the improvement efforts in the firms before EMS adoption. Analysis has been carried out using statistical methods for three different industrial waste parameters: hazardous waste, waste to landfill and the total amounts of waste. The results indicate that the certified EMSs have no statistically significant effect on any of the three waste parameters.
Keywords
Introduction
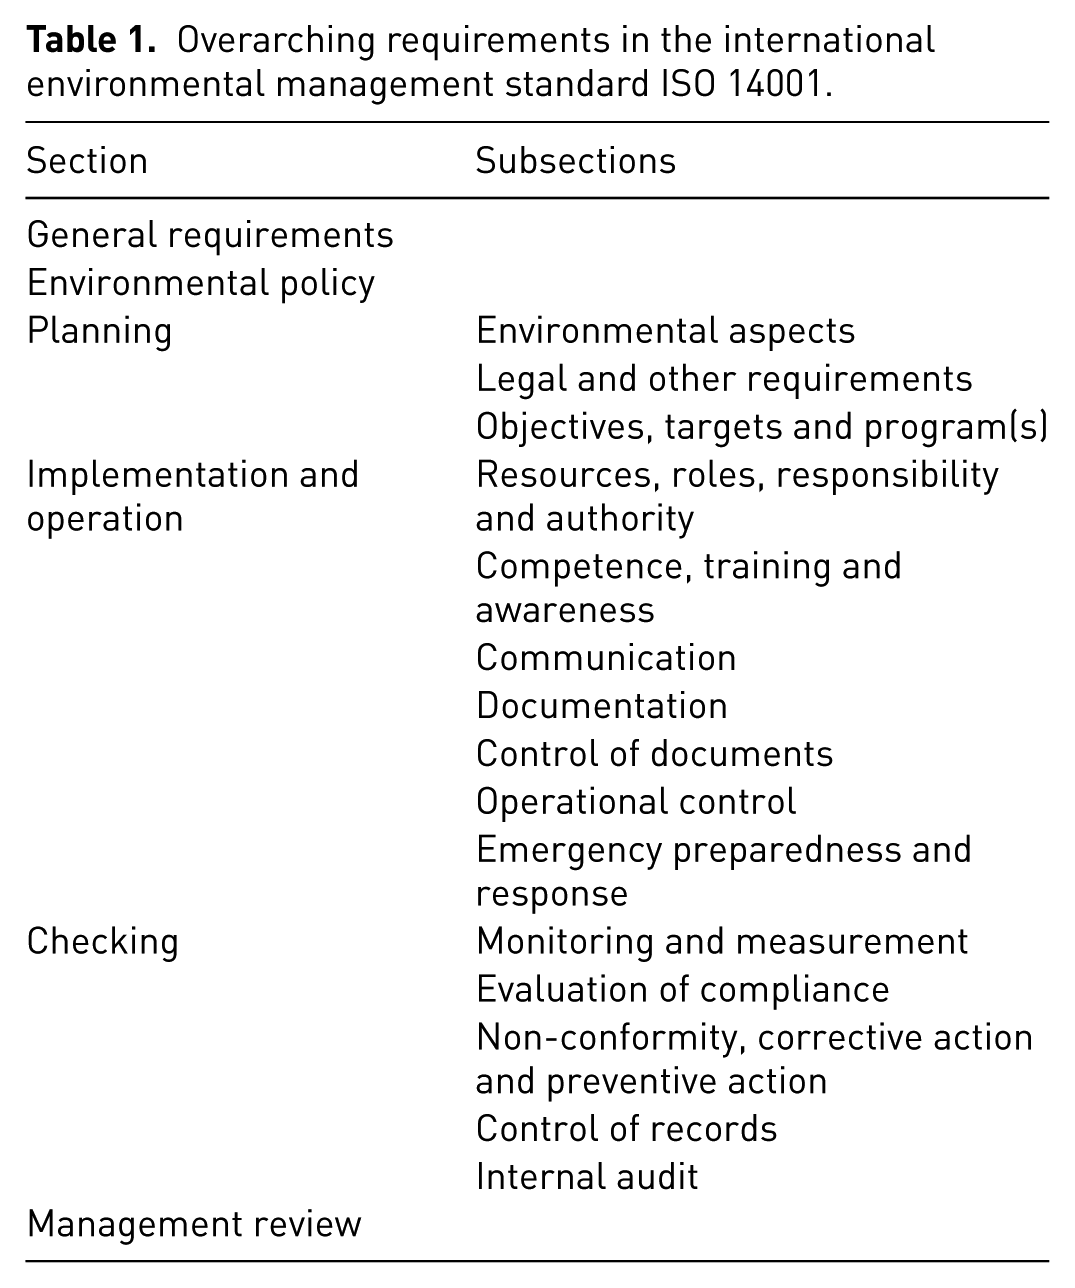
Industrial waste generation is one of the environmental aspects that have been in focus in environmental legislation and other environmental policy instruments all over the world for many years. This environmental area has also been one of the most dominating issues when firms and other organisations have turned their attentions towards voluntary environmental agreements and standards (Arifin et al., 2009). One such voluntary standard that has spread rapidly over the world during the last 10-15 years is the ISO 14001 international standard which contains specifications for the implementation of an environmental management system (EMS). Such a system is a set of management processes and procedures that allows organisations to analyse, control and reduce the environmental impact of their operations and services to save costs, improve efficiency and oversight and to streamline regulatory compliance (Pawar and Rissetto, 2001). A more specific description of an EMS in accordance with ISO 14001 is given in Table 1, where the overarching system requirements in ISO 14001 are shown.
Overarching requirements in the international environmental management standard ISO 14001.
During the period from 1996, when it first became possible to certify to ISO 14001, until now, almost 286,000 organisations worldwide have chosen to certify their EMS (ISO, 2013). The worldwide distribution and commercial success of ISO 14001 has led to extensive research on different phenomena and issues connected to the adoption of EMSs based on the standard (Nawrocka and Parker, 2009). To somewhat simplify this discourse, it can be divided into three subareas: (a) studies aiming at using the context of EMS and ISO 14001 certification in order to further develop general management theory; (b) studies focusing either on the organisational characteristics of the firms that adopt voluntary environmental approaches and the motives for adoption (the situation before adoption); and (c) studies which are concentrating on the usefulness and possible benefits of the approaches (the situation after adoption).
This paper is positioned within the last of the three subareas with a specific focus on industrial waste. One of the most important contributions of an EMS in accordance to ISO 14001 is that it potentially helps organisations to identify and actively work with their most significant environmental aspects. The generation of industrial waste is often one of those aspects which has significant environmental impacts. Arifin et al. (2009) report that among 12 major environmental issues in business organisations, waste generation ranked first and was the highest priority for businesses when they adopted the standard.
The purpose of the study is to address the issue regarding the influence of EMS adoption and ISO 14001 certified EMSs on industrial waste generation. Results from a study based on industrial waste generation data derived from mandatory annual environmental reports from 116 manufacturing facilities in Sweden is presented. A more specific hypothesis is derived from relevant literature in the next section. Following the literature review and hypotheses development in the next section, the data set and the statistical methods used in the study are then outlined. Results are presented next followed by the last section where the results are discussed and conclusions are drawn.
Literature review and hypothesis development
Effects of EMS adoption on industrial waste generation
The popularity of ISO 14001 has led to extensive research focusing on the impacts of certified EMSs on corporate environmental performance (Nawrocka and Parker, 2009). Numerous studies have been conducted to evaluate the impact of the EMS. We will not discuss all of them in this paper but rather focus on those studies most relevant for the generation of industrial waste. A literature review has given us a handful of studies with specific focus on finding the connection between EMS adoption and certification and possible improvements regarding industrial waste generation, as well as some studies that partly address waste issues but also study effects on other environmental aspects. To simplify in order to present this research, these studies can be divided into three categories: case studies in larger industrial firms; questionnaire-based surveys covering foremost larger industrial firms; and studies with specific focus on small- and medium sized firms using methods from both the first two categories.
When ISO 14001 was still very new, Rondinelli and Vastag (2000) performed an in-depth case study at an Alumax aluminum ingot production facility, called Mt Holly, in South Carolina, USA. It was found that adoption and certification of the EMS led to more ideas among employees for materials recycling within the plant and even increased their commitment to recycling at home. The certification process made employees more sensitive to opportunities for recycling and also led to waste reduction in the plant. Positive results were also found in four other case studies in industrial facilities located in Thailand (Rigling Gallagher et al., 2004). Rather positive effects of the EMS on different wastes were identified even though it was also concluded that the fact that a facility has an ISO-certified EMS may not have any common substantive meaning, despite their common framework and procedure. Despite this, some concrete positive results were identified, for example significant reduction of waste water, increase in recycling both for process and product wastes (lead and acid) and for other materials (glass, plastic, packaging), reduction of hazardous waste generation by 15% in its first year in one facility, improvement in in-plant waste separation and improvement in waste-water management
In common with the case studies, it seems that also the surveys have found mostly positive results, even though there is some indication that not all the firms that implement an EMS observe the applicable legal requirements or manage their wastes in an environmentally sound manner, for example in the construction industry (Rodríguez et al., 2007). However, most studies in this category seem to have found a positive relationship between EMS certification and waste reduction. Babakri et al. (2004) revealed in a study on industrial companies operating in the USA that firms’ recycling performance is significantly and positively affected by certification. They also found that firms who had certified earlier experience better recycling performance than more recently certified companies. Finally, it was also concluded that smaller firms experience greater improvement in recycling performance than larger firms due to certification. In another US study, Franchetti (2011) conducted a survey on industrial companies and showed that firms’ solid waste generation rates are significantly reduced as a result of ISO 14001 certification. In addition, the study also reveals that solid waste disposal costs are also significant and influence the solid waste generation of industrial companies. Arimura et al. (2008) used Japanese facility-level data from an OECD survey and found that ISO 14001 implementation helped reduce not only solid waste generation but also natural resource use and waste-water effluent. In an international survey, Summers Raines (2002) found that more than half of all firms reported savings from reduced waste disposal costs as well as in several other areas. It could also be established that firms with pre-existing environmental management systems reported slightly fewer benefits than others for ISO 14001 certification and that developing country firms reported greater cost savings than did firms in wealthier countries. Zutshi and Sohal (2004) found in Australasian organizations that ISO 14001 implementation and certification led to improvements regarding waste reduction and cost savings from waste reduction/disposal for all the studied industry sectors and ownership types. In an Austrian study, Schylander and Martinuzzi (2007) concluded that ISO 14001 often leads to reduced environmental impact, especially in the area of waste. The study showed that firms have realized considerable cost savings by reducing and separating their own waste as a direct result of ISO 14001 adoption. Finally, results from a study in newly industrialized Malaysia indicated that the benefits were rather similar to those documented for companies that adopted ISO 14000 in industrialized countries (Tan, 2005). In summary, it was observed that all industries except the food industry profited from waste reduction. Almost 8 out of 10 of the respondents reported cost savings through waste reductions after the implementation of an EMS.
Despite the fact that ISO 14001 has been criticized for not being so appropriate for smaller firms and organizations, survey research show that small- and medium-sized enterprises (SMEs) can also benefit from adoption. In a survey of Finnish SMEs in metal engineering, Kvist et al. (2011) found that waste awareness has increased after certifying EMS and that the treatment of solid waste has improved. EMS seemed to raise knowledge levels in particular on recycling of solid waste. However, it is concluded that, while certified EMS brought positive changes in waste treatment, it did not promote waste minimization and prevention. When interviewing mostly small and micro-sized companies in Sweden, Ammenberg and Hjelm (2003) could conclude that recycling of conventional and hazardous waste had improved after ISO 14001 adoption. In an Austrian brewery covered by a case study by Fresner and Engelhart (2004), industrial waste had been reduced by 66%. In the wine industry in New Zealand, ISO 14001 certified firms experienced decreased waste particularly through recycling as well as a number of other benefits (Hughey et al., 2005). More disappointing results from EMS adoption and ISO 14001 certification are presented by Ilomäki and Melanen (2001). In their study of Finnish SMEs, the EMSs do not appear to provide much impetus for SMEs to implement waste minimization. The reduction of wastes in SMEs seemed to be driven more by the costs of raw materials than by waste costs.
Hypothesis development
Common for all of the reviewed studies is that they rely solely on the subjective perceptions of the representatives, of the firms involved which in some cases are problematic since these perceptions might not always have factual support (Hamschmidt and Dyllick, 2001; Freimann and Walther, 2001). The studies are mostly rather positive regarding the impact of EMS implementation and ISO 14001 certification, but there are some exceptions. These exceptions, together with the fact that no previous studies could be found that based their conclusions on more objective industrial waste data, makes a good argument for further studies of a more objective nature. The reviewed case studies and surveys are all good studies but we believe that it is important to complement them with results that are derived from more objective, fact-based environmental data. Another argument for such studies is that it has been suggested that qualitative case studies or survey studies focusing on the impact of EMSs tend to show more positive effects of environmental management than the relatively few studies that are based on more objective measurements of changes in environmental performance (Ammenberg, 2003).
As a result of previous research and the empirical evidence it has produced we have chosen to collect empirical industrial waste data with a low degree of subjectivity and use this data and relevant statistical tests to test the following null hypothesis and alternative hypothesis:
H0 = the change of the rate of improvement concerning waste generation for ISO 14001-certified firms does not differ significantly from the corresponding change for non-certified firms
HALT = the change of the rate of improvement concerning waste generation for ISO 14001-cerfified firms differs significantly from the corresponding change for non-certified firms
Methodology
An approach aiming at studying the influence of certified EMSs on industrial waste generation needs to focus primarily on changes in performance over time as EMS is a tool for continuous improvement and do not say anything about the level of performance (Schylander and Zobel, 2003). Furthermore, the studies must include not only firms with a certified EMS but also firms without systems or possible simpler non-certified systems for comparison. Finally, the improvements that the firms had made before the introduction of the EMS must be taken into account.
Research approach
In this study, we have chosen 2000 as the base year and we have decided to study the change in industrial waste generation over 3-year intervals over the period 1994–2006, i.e. 6 years prior to certification and 6 years after certification. The 3-year intervals were chosen primarily in order to limit the amount of data. Figure 1 shows a schematic illustration of the time periods that form the basis for statistical analysis. The basis for analysis has not been the improvements as such, but rather the change in the rate of improvement concerning waste generation before and after ISO 14001 certification and the corresponding periods for non-certified companies. It should be noted that “improvement” is not always linguistically the correct word to use in this case since some of the firms actually do not improve over some of the time intervals. However, we use this term in order to distinguish it from the term “change” that we use to describe the change in the situations before and after ISO 14001 certification. Before analysis, all parameters (e.g. waste to landfill) have been normalized to each firm’s production rate (e.g. total weight of products or total weight of input raw material), in order to be able to study changes in performance independent of the level of production. Since we are using the change in waste generation measured in percent we have been able to use the individual indicators of production rate for each firm. This means that we have studied changes in eco-efficiency (e.g. ton waste to landfill ton products−1 year−1) rather than changes in absolute numbers.
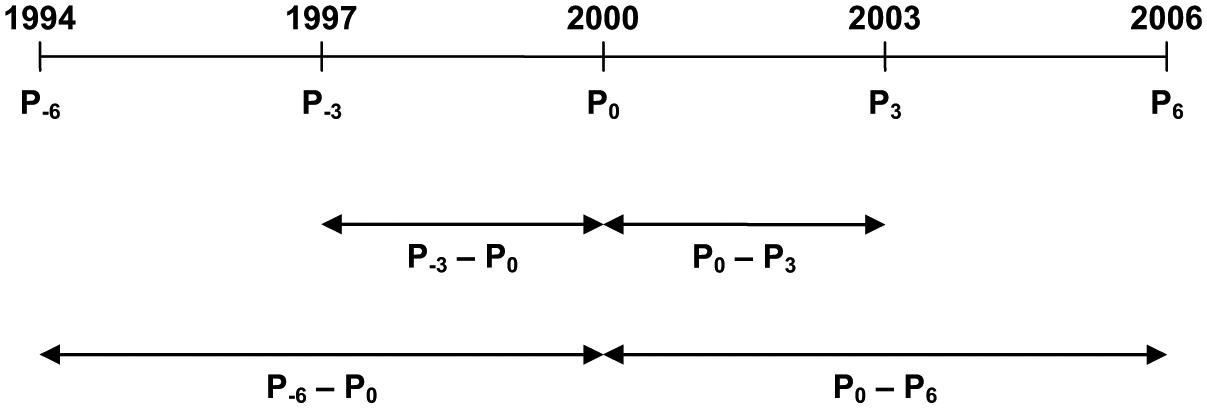
Schematic picture of the time periods over which the change in performance has been measured in certified and non-certified firms (P-6 = waste performance in 1994, 6 years before the base year 2000; P-3 = waste performance in 1997, 3 years before the base year 2000; P0 = waste performance in the base year 2000; P3 = waste performance in 2003, 3 years after the base year 2000; P6 = waste performance in 2006, 6 years after the base year 2000).
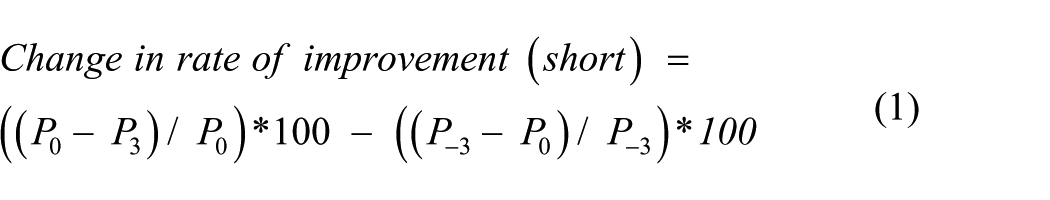
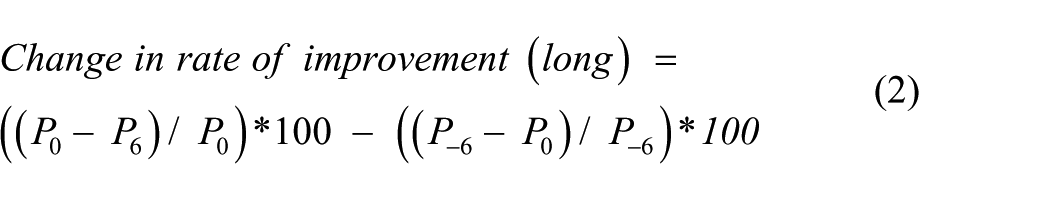
The change in the rate of improvement concerning waste generation has been calculated for three different waste categories: hazardous waste, waste to landfill and the total amounts of waste. The shorter period 1997–2003 has the advantage that the production most probably has not changed so much during the period and it is therefore easier to follow changes in performance. In addition, it was easier to find waste data from the years 1997, 2000 and 2003. However it is a disadvantage that changes are most likely smaller than for the longer period 1994-2006. The major disadvantage with the longer period is that waste data from 1994 was hard to find, which made the statistical analysis more difficult. The parameters used for the analysis have been calculated using the following equations, in which designations from Figure 1 are used:
Collection of data
To gain access to environmental data that are reported with a limited degree of subjectivity, mandatory yearly environmental reports from firms with regulatory environmental permits have been used. Environmental reports have been collected from both ISO 14001 certified firms and non-certified firms. We have chosen to study manufacturing firms (NACE code 15-37) where we can expect to find significant amounts of industrial waste as well as a number of different waste categories. A list of such firms, created by information from all 21 County Administrative Boards in Sweden, showed that the total number of such firms was 2331. The list was supplemented with information on ISO 14001 certification from all certification bodies in Sweden.
The year 2000 was chosen as the base year because it was the year that the largest number of certified manufacturing firms with a permit were awarded an ISO 14001 certificate. A total of 130 such firms could be found. A comparative sample was created by a random sample of 130 firms taken out of the total population of non-certified manufacturing firms with a permit. Environmental reports for the years 1994, 1997, 2000, 2003 and 2006 were collected from the firms’ local and regional environmental agencies. Documents were received for 217 of the 260 firms (83%). All 217 firms were not included in the study for various reasons, for example, that not enough of the necessary documents could be found, the firm had closed down or there was poor document quality. After the removal of non-usable firms, 66 certified firms and 50 non-certified firms remained.
Summary statistics of the two samples are illustrated in Table 2. Average firm size is greater for the certified firms (t-test, P < 0.05). This fact should be taken into account when interpreting the results of the study, since the data from the two groups of firms might be biased due to firm size. Unfortunately, this was unavoidable because firm size was not available in the original lists of firms that we received from the County Administrative Boards. The size of the firms in the random sample was identified after the sample was drawn.
Summary statistics over the samples of certified and non-certified firms.
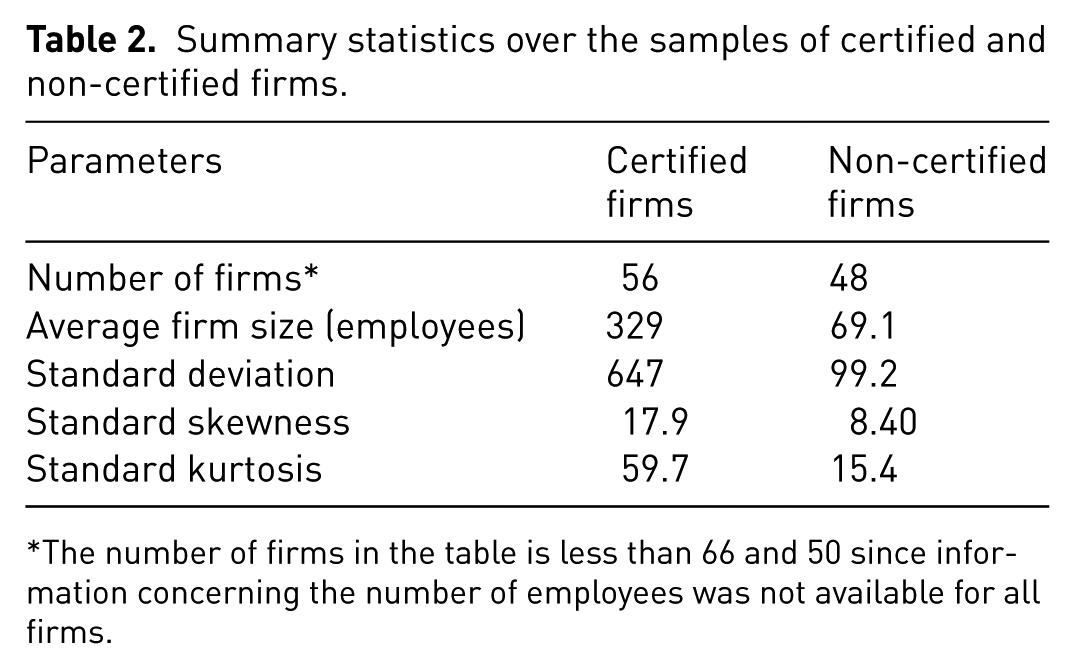
The number of firms in the table is less than 66 and 50 since information concerning the number of employees was not available for all firms.
Statistical methods
Certified and non-certified firms were compared using the t-test, which is one of the most commonly used methods for comparing two samples (Box et al., 2005). It should be noted that for the t-test to have full validity, assumptions about normally distributed data and equal variances must apply. Therefore, the sample distribution has been tested using the parameters standardized skewness and standardized kurtosis (Thode, 2002). Variances were tested using Levene’s test, which is a commonly used test to compare variances between groups (Lomax, 2007). When extreme values are present, box plots in the software SPSS have been used for identification of potential outliers. In those cases where it has not been possible to control the distribution of the data due to a low number of data points, the Mann–Whitney U-test has been used. The Mann–Whitney U-test is a non-parametric test that does not require normally distributed data, but the distributions of the data in the two compared groups need to be the same (Corder and Foreman, 2011).
Results
The data collected from the environmental reports allowed us to study three different waste parameters: hazardous waste, waste to landfill and the total amounts of waste (excluding hazardous waste). It should be noted that waste to landfill in a sense is counted twice in this study, both as an individual parameter and as a portion of the total amount of waste. However, waste to landfill is often a small portion of the total waste production. We have chosen not to use data regarding waste going to reuse, recycling, composting or incineration in our study mainly for two reasons. First, companies are often poor at showing the end destination for these types of wastes in their environmental reports. Second, it is not obvious how changes in the generation of these waste types should be interpreted. An increase can be counted as an improvement (if waste to landfill concurrently is reduced) or as deterioration (if the total amount of waste increases).
Time period 1997–2003
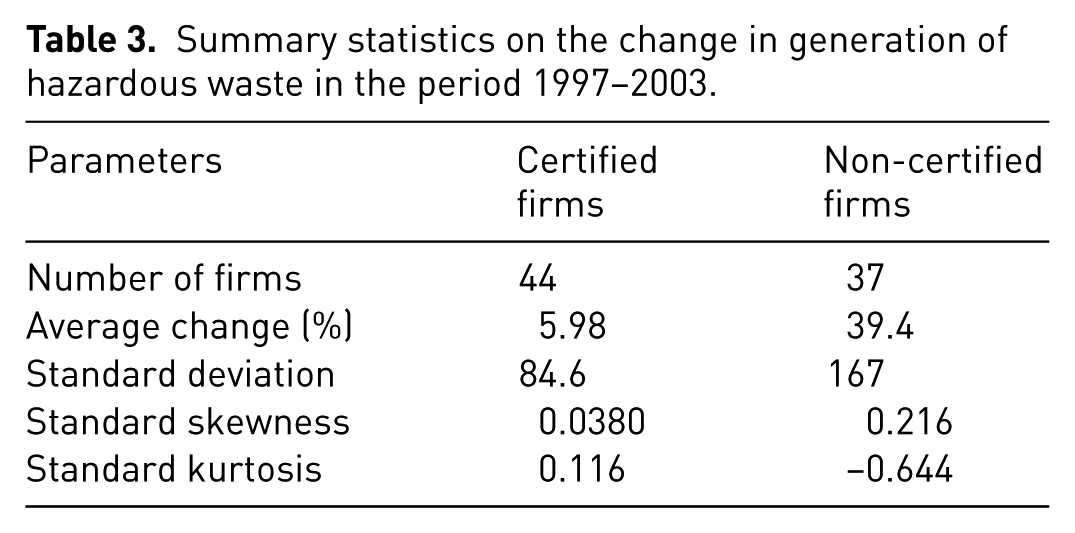
Despite some difficulties in interpreting environmental reports relating to the disposal of waste and quantities of waste, we have been able to use data from about two-thirds of the certified firms as well as the non-certified firms when it comes to hazardous waste. Summary statistics of both firm groups are shown in Table 3. We see from the table that the observations are likely to be normally distributed since the values of standardized skewness and standardized kurtosis are well within the range −2 to +2. Furthermore, we see that the average change in hazardous waste generation improvement is 6% for the certified firms and 39% for non-certified firms. After removal of six outliers in the certified group and one outliner in the non-certified group, a t-test gives the value P = 0.248, which means we cannot say that there is a significant difference between the groups. However, Levene’s test indicates significant difference between variances. A Mann–Whitney U-test, that is not dependent on equal variances, performed on the same data set with outliers removed give the value P = 0.378 and a test with all data points included give the value P = 0.743. We therefore reach the same conclusion as with the t-test.
Summary statistics on the change in generation of hazardous waste in the period 1997–2003.
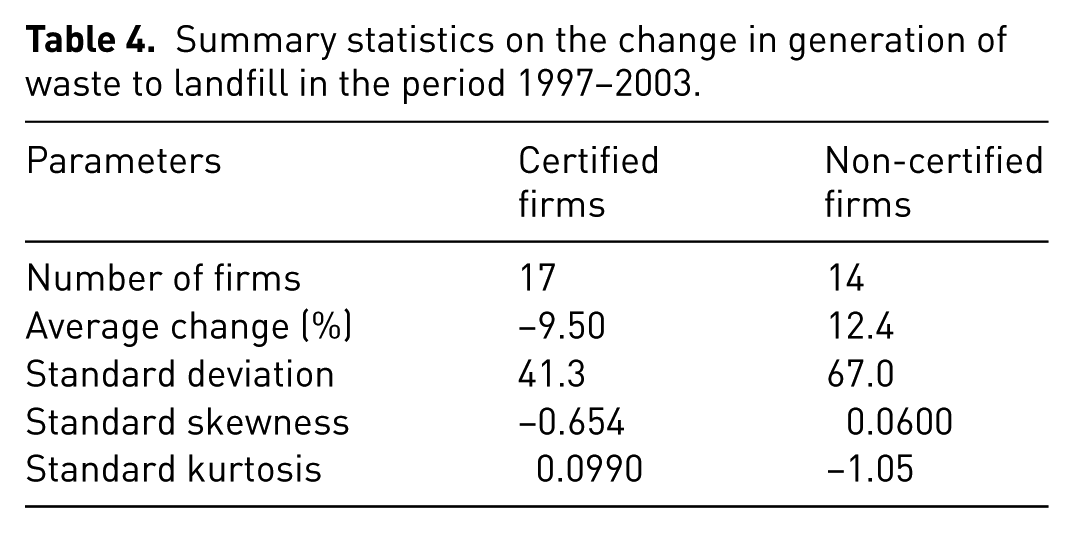
Only about a third of the firms in the sample report data concerning waste to landfill. Despite the relatively low number of observations, we do not seem to have any problem with normality, since the values of skewness and kurtosis do not give us any reason to doubt that the observations are normally distributed (see Table 4). The average change in rate of improvement concerning waste to landfill is almost 10% for the certified firms while the non-certified seem to improve their handling of waste to landfill by 12%. However, the t-test that was carried out after three outliers were removed (two from the sample of certified firms and one from the sample of non-certified firms) do not support that any differences would exist between the groups of firms (P = 0.272). The null hypothesis therefore appears to be valid but also in this case Levene’s test shows us that we have some problem with the assumption of equal variances. However, a Mann–Whitney U-test gave P = 0.316 with outliers removed and P = 0.286 with all data points included, and we can therefore be quite certain that there is no difference between the two groups.
Summary statistics on the change in generation of waste to landfill in the period 1997–2003.
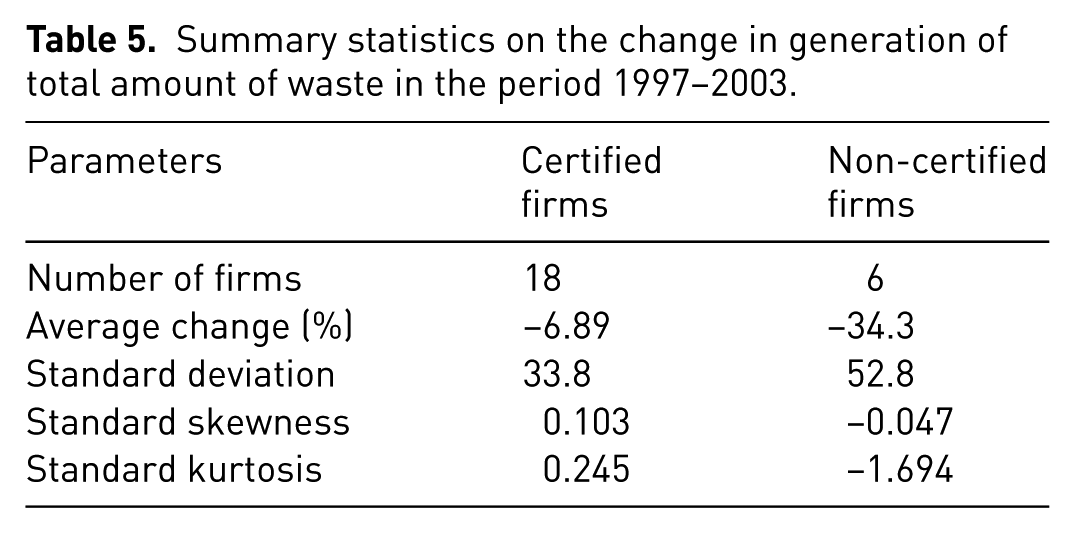
A small number of non-certified firms (six firms) reported reliable data concerning the total amounts of waste in the period (see Table 5), which makes a comparison between the groups somewhat problematic. We see that the mean value of the change in the rate of improvement indicates a slight decrease for certified firms (7%) and what might be a larger reduction for the non-certified firms (34%). We might therefore suspect that the certified firms perform better. The low number of data points in the non-certified group does not make it possible to control if the data is normally distributed and the t-test can therefore not be used. Any outliers have not been identified and a Mann–Whitney U-test including all data points give P = 0.280 and we have similar results as for hazardous waste and waste to landfill.
Summary statistics on the change in generation of total amount of waste in the period 1997–2003.
Time period 1994–2006
The quality of the waste-related data described in the environmental reports from 1994 is far poorer than it has been in recent years. This fact results in there being significantly fewer observations available to use for analysis for the period 1994–2006 than for the shorter period. Concerning waste to landfill and total amounts of waste, data from 1994 is so rare that we have not been able to use the t-test. Even if the number of data points is very low we have run the Mann–Whitney U-test, since theoretically it can be applied even if you have only two data points.
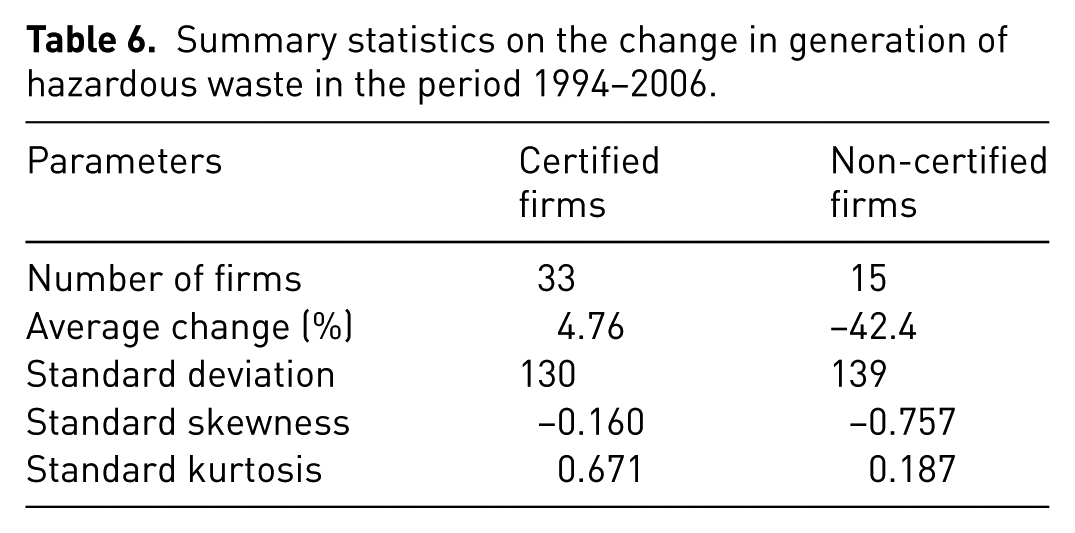
The quality of the reports also influences the usable number of hazardous waste observations, but here we have enough data for a t-test (see Table 6). Again we have no problem with the distribution of data, although the quality of the reported data from seven certified firms and three non-certified firms forced us to remove the data from these firms. The mean value of the change in the rate of improvement for the certified companies is 5% while the non-certified seem to have performed much worse in the period after year 2000 than they did the previous period (−42%). However, the possible difference is not statistically significant since a t-test give P = 0.259. Levene’s test shows us that the variances are equal and the test is therefore valid. We get the same results with a Mann–Whitney U-test (P = 0.417 with outliers removed and P = 0.190 with all data points included).
Summary statistics on the change in generation of hazardous waste in the period 1994–2006.
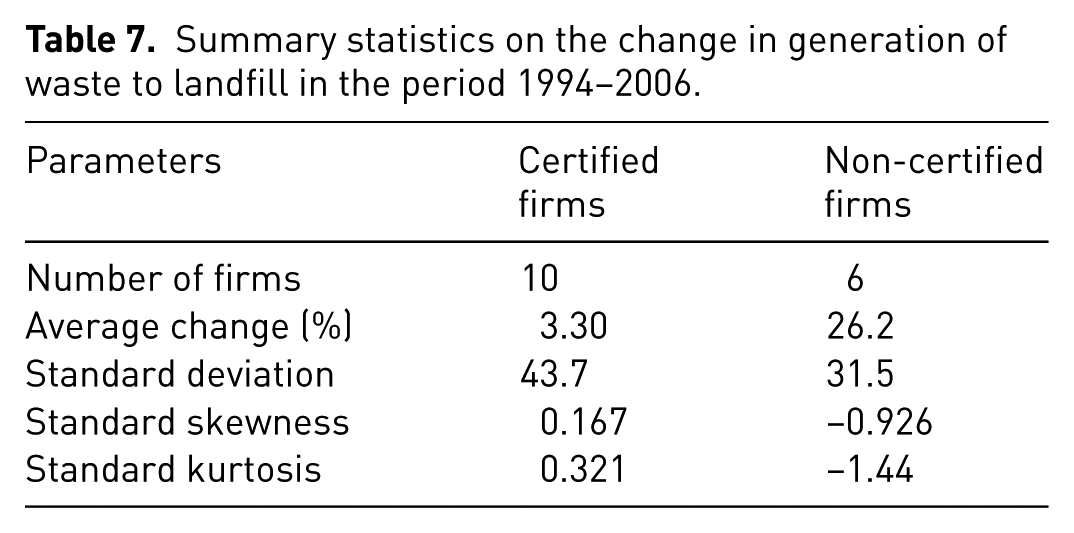
Concerning waste to landfill we get similar results for the longer period as we obtained for the shorter period. The data in Table 7 might indicate that the non-certified firms actually performs better but the possible difference is not statistically significant according to a Mann–Whitney U-test (P = 0.428 with one outlier removed from the certified group and P = 0.428 with all data points included).
Summary statistics on the change in generation of waste to landfill in the period 1994–2006.
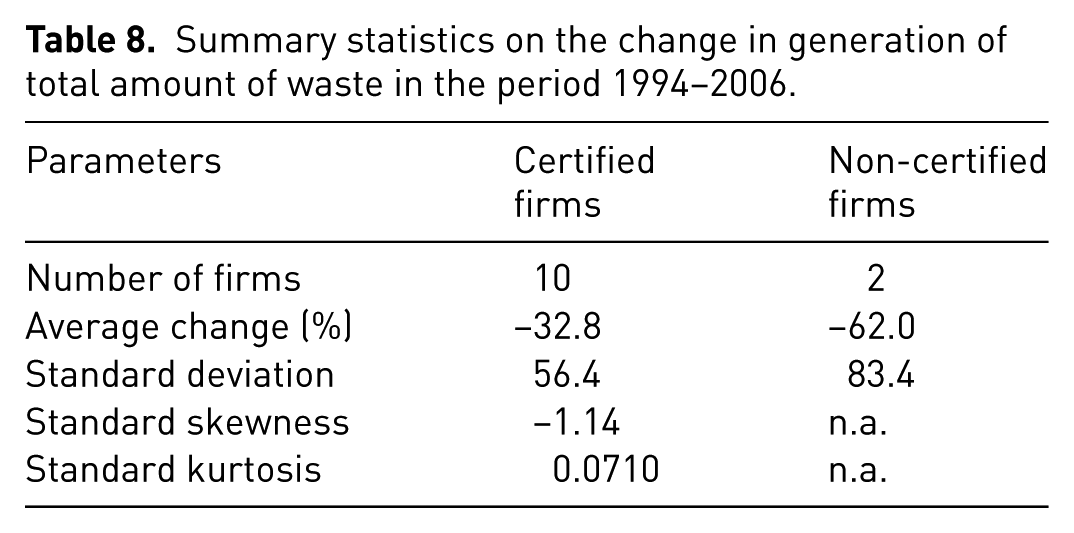
Lastly, we ran a Mann–Whitney U-test using the very low number of data points available concerning the total amounts of waste. The summary statistics of these data is presented in Table 8. The test gives P = 0.758 and there is therefore no indication that there might be any difference between the two groups.
Summary statistics on the change in generation of total amount of waste in the period 1994–2006.
Discussion and conclusions
To summarize the results of our study, we have not been able to find any statically significant differences between ISO 14001 certified firms and non-certified firms concerning the change in the rate of improvement before and after the adoption of the standard for any of the three studied waste-generation categories. A possible reason for these rather disappointing results might be that the certified firms simply do not consider that waste generation is a significant environmental aspect and therefore do not actively work with improvements in this area. Instead, firms might have chosen to focus on other environmental issues that in the current public debate are considered to be more important environmental aspects, such as energy use or emissions of carbon dioxide.
Our results can only to some degree be regarded to be in line with the majority of the previous research based on the subjective perceptions of firm representatives. Some of the previous studies report rather remarkably positive results from EMS adoption and ISO 14001 certification (e.g. Babakri et al., 2004; Franchetti, 2011; Fresner and Engelhart, 2004; Zutshi and Sohal, 2004), but the statistical analysis and results in our study cannot confirm the clear results in these studies. Our results are perhaps more in line with results found by, for example, Rodríguez et al. (2007), Ilomäki and Melanen (2001) and Kvist et al. (2001), who raise some doubts regarding the efficiency of ISO 14001 certified EMSs.
However, we should be somewhat careful in our conclusions since the used data set gives us some problems. In those cases where the number of data points makes a control of the normal distribution possible, we can be fairly certain that the data we have been using are normally distributed and it is clear that the distribution of the data does not influence the statistical methods used. In contrast, the variances in the waste data both from the ISO 14001 certified firms and the non-certified firms to a large extent hinder us from seeing clearer differences. The variances are large and concerning hazardous waste and waste to landfill for the period 1997–2003 the variances cannot be considered equal, which has an effect on the validity on the performed t-tests. The large variances, which also affects the possibility to see differences with the Mann–Whitney U-test, are somewhat surprising considering that the data is derived from mandatory environmental reports. One factor influencing the variances might be the methods and approaches used by the firms to measure their waste generation. It is obvious when studying the reports that most firms do not measure the amounts of waste themselves. Instead they rely on data from contracted waste handling firms. On the other hand, we have every reason to believe that the approach taken in this study to try to exclude the effects of factors other than the introduction of EMSs is accurate.
Footnotes
Acknowledgements
The author is grateful for the advice from the anonymous referees whose comments have improved the quality of this paper considerably.
Declaration of conflicting interest
The author declares that there is no conflict of interest.
Funding
This research received no specific grant from any funding agency in the public, commercial, or not-for-profit sectors.