






Abstract
The aim of this study was to use the life cycle assessment tool to assess, from an environmental point of view, the different possible municipal solid waste (MSW) management scenarios for the island of Mauritius. The scenarios include landfilling with energy recovery (S1), incineration with energy recovery (S2), composting, incineration and landfilling (S3) and finally composting, recycling, incineration and landfilling (S4). The MSW generated in 2010 was selected as the functional unit. Foreground data were collected through surveys and literature. Background data were obtained from ecoinvent data in SimaPro 8 libraries. The scenarios were compared both through the CML-IA baseline–midpoint method and the ReCiPe end-point method. From the midpoint method, the results obtained indicates that landfilling (S1) has the greatest impact in all the analyzed impact categories except ozone layer depletion and human toxicity, while incineration (S2) has the least impact on almost all the analyzed damage categories except in global warming potential and human toxicity. The collection and transportation of waste has a significant impact on the environment. From the end-point method, S4 reduces the damage impact categories on Human Health, Ecosystems and Resources due to the recycling process. S3 is not favorable due to the impact caused by the composting process. However, it is also very important to emphasize that for incineration, the best available technology with energy recovery shall be considered. It is recommended that S2 and S4 are considered for strategic planning.
Introduction
Today, solid waste management has become a major concern in every country. The environmental impacts of municipal solid waste (MSW) management have been highlighted in Mauritius, a small island developing state, due to the continually increasing amount of MSW being generated and the limited capacity of waste treatment facilities. The amount of waste generated per capita has increased from 0.8 kg to 0.9 kg from 2002 to 2011 (Ministry of Environment and Sustainable Development (2013)).
One important aspect of waste management planning is to ensure the identification of areas in which specific measures should be taken to reduce the environmental impacts of waste management (Banar et al., 2009). Indeed, there is no single waste treatment system which is most appropriate for all waste fractions (Liamsanguan and Gheewala, 2008). Waste management strategies should aim at maximizing energy and material recovery while minimizing the final amount of waste delivered to landfill and the pollution related to all treatment and collection steps (Cherubini et al., 2008). This can be achieved using the life cycle approaches. Although there are several analytical approaches, life cycle assessment (LCA) methodology is probably the most comprehensive (Miliute and Staniskis, 2010). It is accepted that LCA concepts and techniques provide solid waste planners and decision makers with an excellent framework to evaluate MSW management strategies (Obersteiner et al., 2007). LCA is best defined as an objective process to evaluate the environmental burdens associated with a product, process or activity, by identifying and quantifying energy and materials used and waste released to the environment.
The aim of this study is to use the LCA tool to compare and assess different solid waste management system options and determine the most feasible system for the island of Mauritius from an environmental perspective.
Materials and method
Case study
The island of Mauritius is located in the south west of the Indian Ocean. It has an area of 1969 km2 and a population of 1.3 million (Ministry of Finance and Economic Development (2015)). The daily waste generated per capita is 0.95 kg. Today, only 13% of the wastes generated in the island are recycled (Ministry of Local Government and Outer Islands, 2011). Among the materials that are recycled are paper, cardboard, plastics, scrap metals, textile and organic matter.
The collection and transportation of wastes is done either by local authorities or by private scavenging contractors. There are five transfer stations (TS) located throughout the island which are operated by private companies. All wastes collected are disposed at the Mare Chicose Landfill. Since the start of its operation in 1997, and until December 2015, it has received 6,502,690 t of wastes (Sotravic Ltee, 2015. Being, a sanitary landfill, it is designed to reduce the environmental impacts related to soil, air and water. At present, no studies have been performed to assess the environmental impact of the landfill site using the life cycle approach.
The LCA methodology
LCA is an internationally standardized methodology for environmental assessment (ISO, 2006). It is used to evaluate the environmental impact of a product or system. According to the ISO standard, an LCA should cover four distinct phases.
Goal and scope definition
The goal was to analyze and compare the existing MSW management system with other MSW management alternatives and to select an optimum waste management system. The functional unit was the management of 427,687 t of MSW generated in the year 2010. It starts with the collection of wastes, transportation of the MSW to transfer stations and from the transfer stations/material recovery facilities (MRFs) to the treatment facility plant. Life cycle analyses of secondary materials obtained from recycling processes is not considered. The boundary was limited to landfilling of residual materials after waste treatment processes. Figure 1 illustrates the system boundary of the different scenarios.
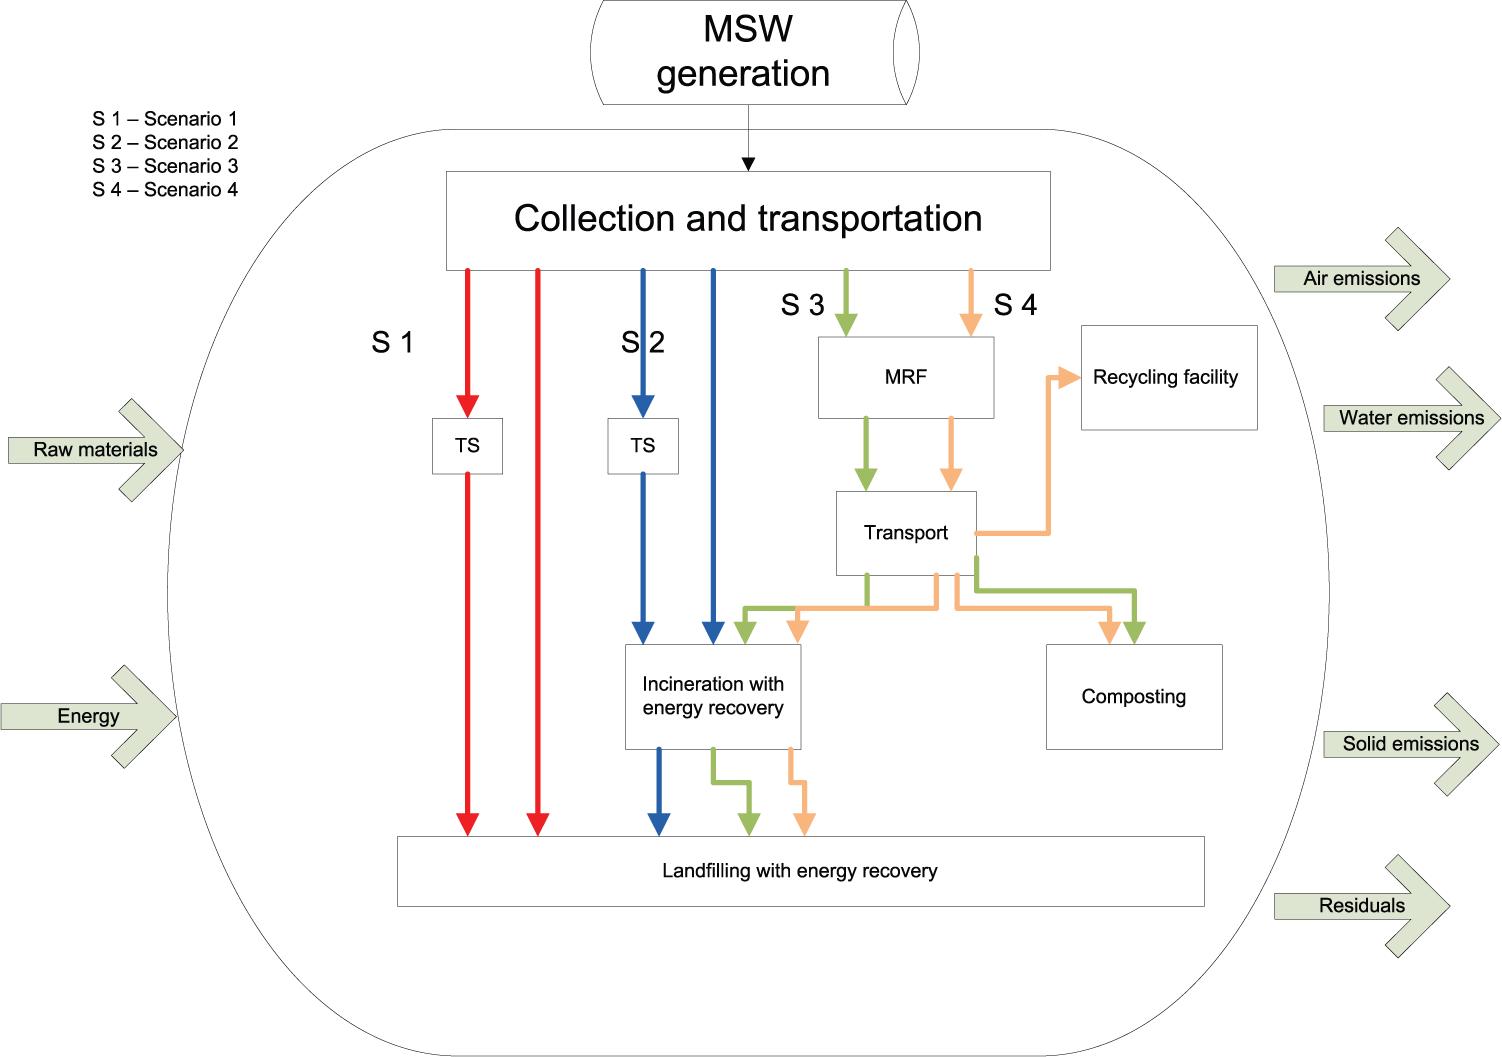
System boundaries of the different scenarios.
The following scenarios were assessed:
Scenario 1 (S1): landfilling of wastes with energy recovery. This is the current waste management system. At the landfill, the waste is buried. The landfill is lined using high density polyethelene (HDPE) geomembranes to prevent leachate leakage. Due to the degradation of organic material under anaerobic conditions, landfill gas is produced. The present gas capture rate is 60%, with landfill methane between 50% and 55%, carbon dioxide between 38% and 40%, and oxygen less than 1%. Landfill gas is only produced from the biodegradable fraction of the waste. Several authors have stated different values of landfill gas potentials depending on the specificity of the waste fraction; Dong et al. (2014) cited that the landfill gas potential in China is between 110 and 140 m3 per ton of MSW, with no data given, however, on the organic fraction of the waste. Cherubini et al. (2008) stated that the landfill gas potential in Rome is 140 m3 per ton of waste with a 50% fraction of organic waste. Bovea and Powell (2006) cited that the landfill gas potential is approximately 250 m3 per ton of biodegradable organic waste (putrescible, paper and textile). The landfill gas potential at Mare Chicose based on the typical composition of the waste is estimated at 206 m3 per ton of biodegradable waste (landfill operator, 2015, personal communication). The landfill gas collected is used to operate three gas engines to generate electricity which is then exported to the national grid system. A total of 110,000,000 kWh of electricity will be generated in five years’ time. Leachate generated is transported to a location 45 km away for treatment. The waste flow is shown in Figure 2.
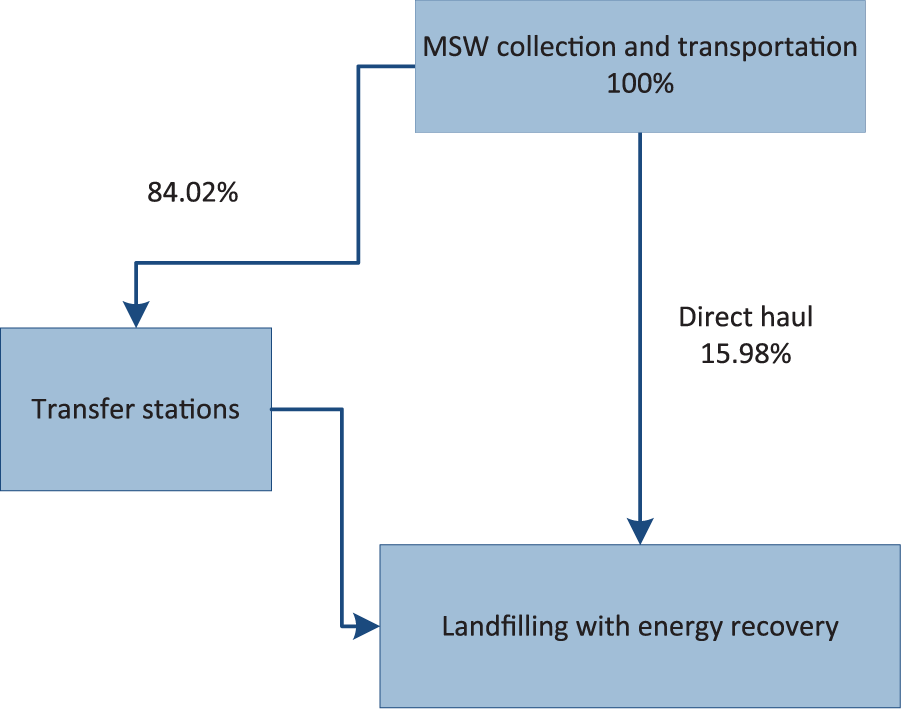
Scenario 1: landfilling of wastes with energy recovery.
Scenario 2 (S2): incineration of waste with energy recovery. S2 explores the possibility of maximizing the energy recovery and also reduction of the volume of wastes being landfilled through incineration. All the wastes collected are directly incinerated to produce electricity with no further pre-sorting or pre-treating, as shown in Figure 3. The incineration plant is assumed to be located at Mare Chicose.
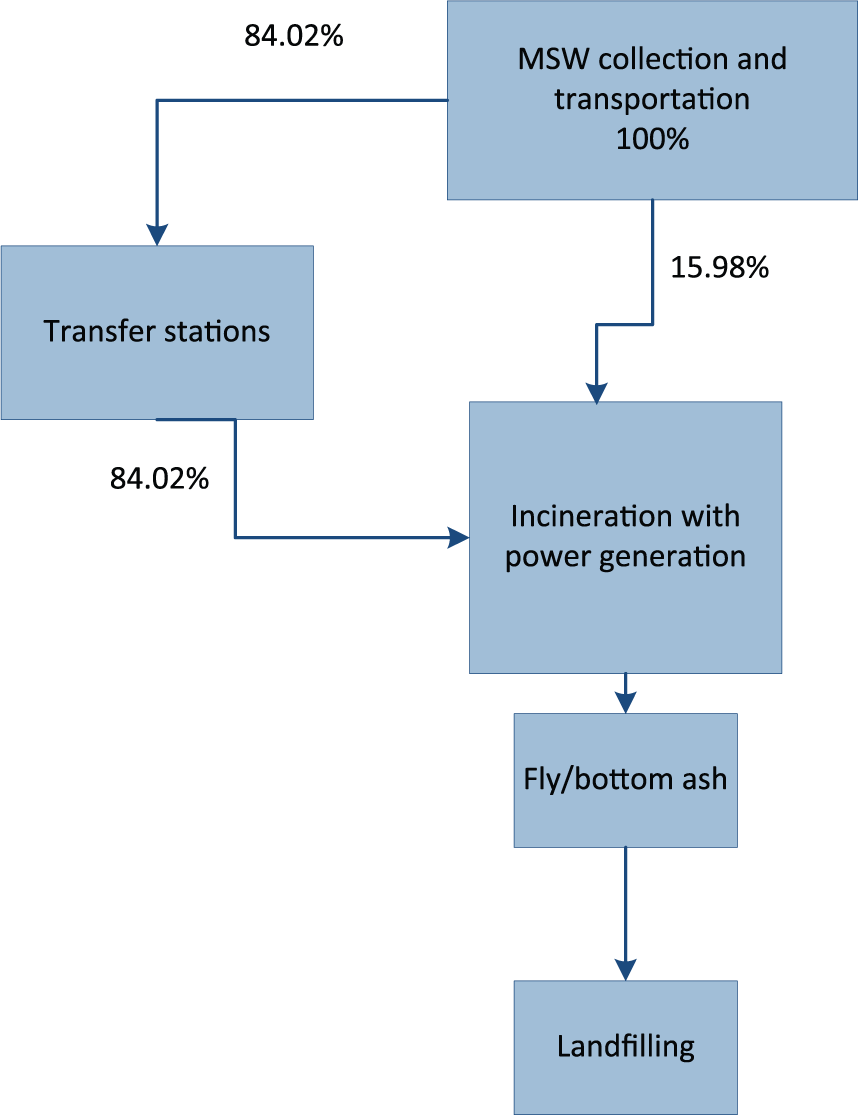
Scenario 2: incineration of wastes with energy recovery.
Scenario 3 (S3): MRF, incineration, composting and landfilling. All the transfer stations are upgraded into material recovery facilities (MRF’s) MRFs where 50% of the organic fractions are sent for composting. The remaining fraction is incinerated with energy recovery and the residuals are landfilled, as shown in Figure 4.
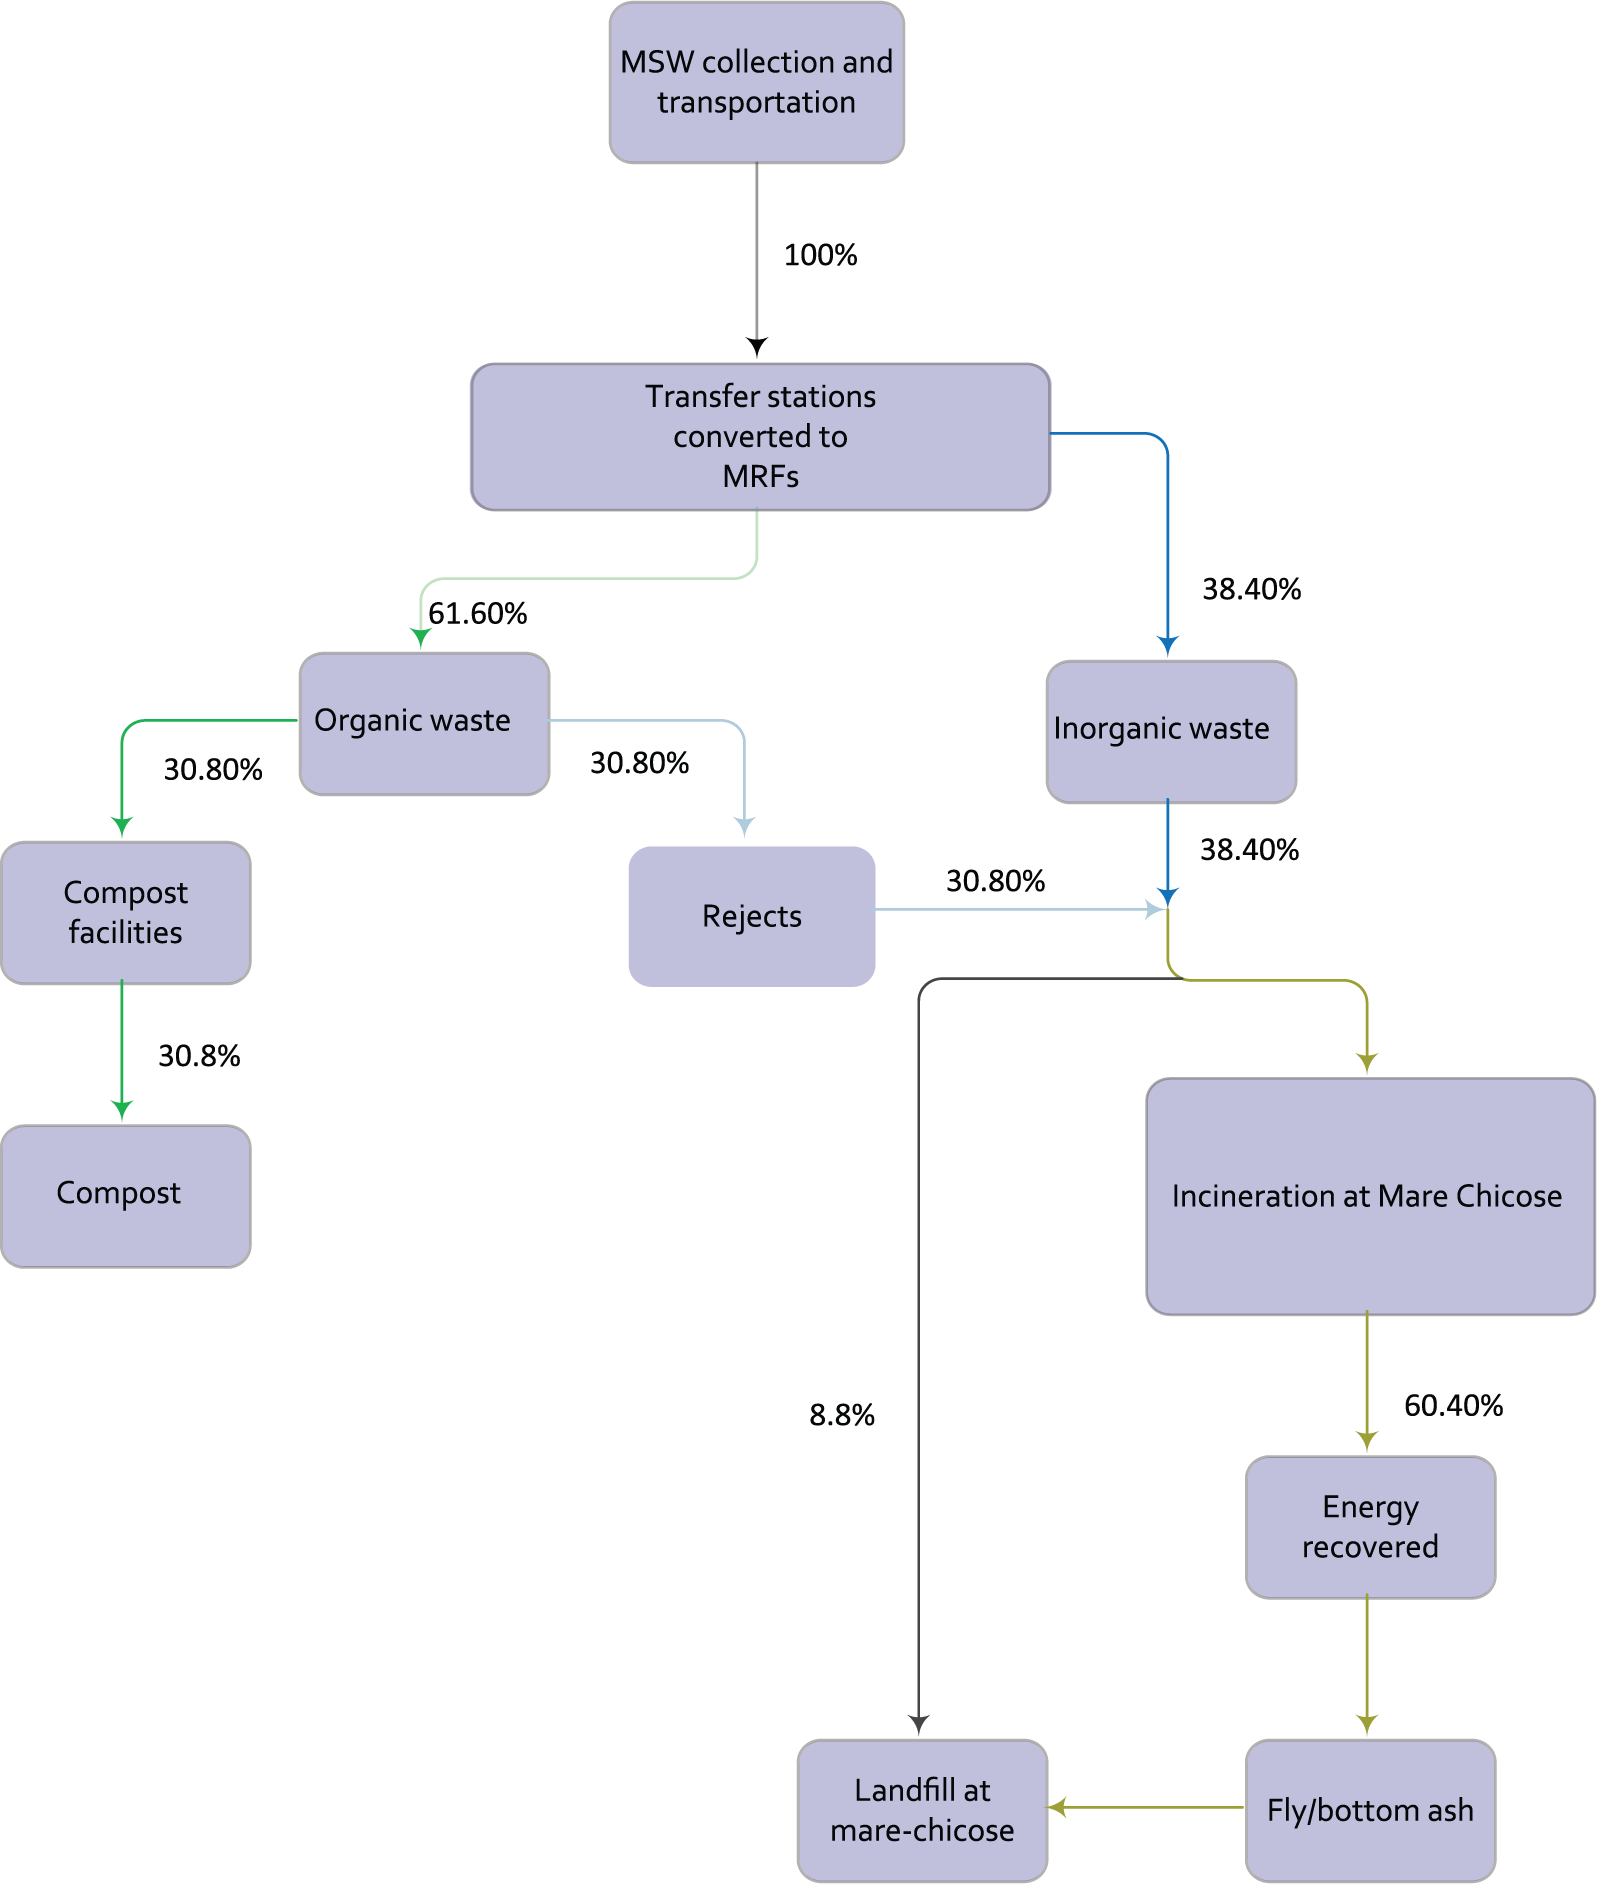
Scenario 3: MRF, incineration, composting and landfilling.
Scenario 4 (S4): MRF, incineration, recycling, composting and landfilling. The waste generated is source separated into two bins, as shown in Figure 5. The dry bin is for recyclables – plastics, paper/cardboard, glass and metals. It is assumed that 30% of the recyclables will be sourced separated. The recyclables are sent to the MRF and after processing they are sent to recycling facilities located at an average distance of 20 km from the MRF. Another fraction of 20% of the recyclables are assumed to be recovered at the MRF from the wet bin, thus allowing for a total of 50% materials to be recycled. The same rate of 50% as in S3 has been assumed for the generation of compost from the organic fraction.
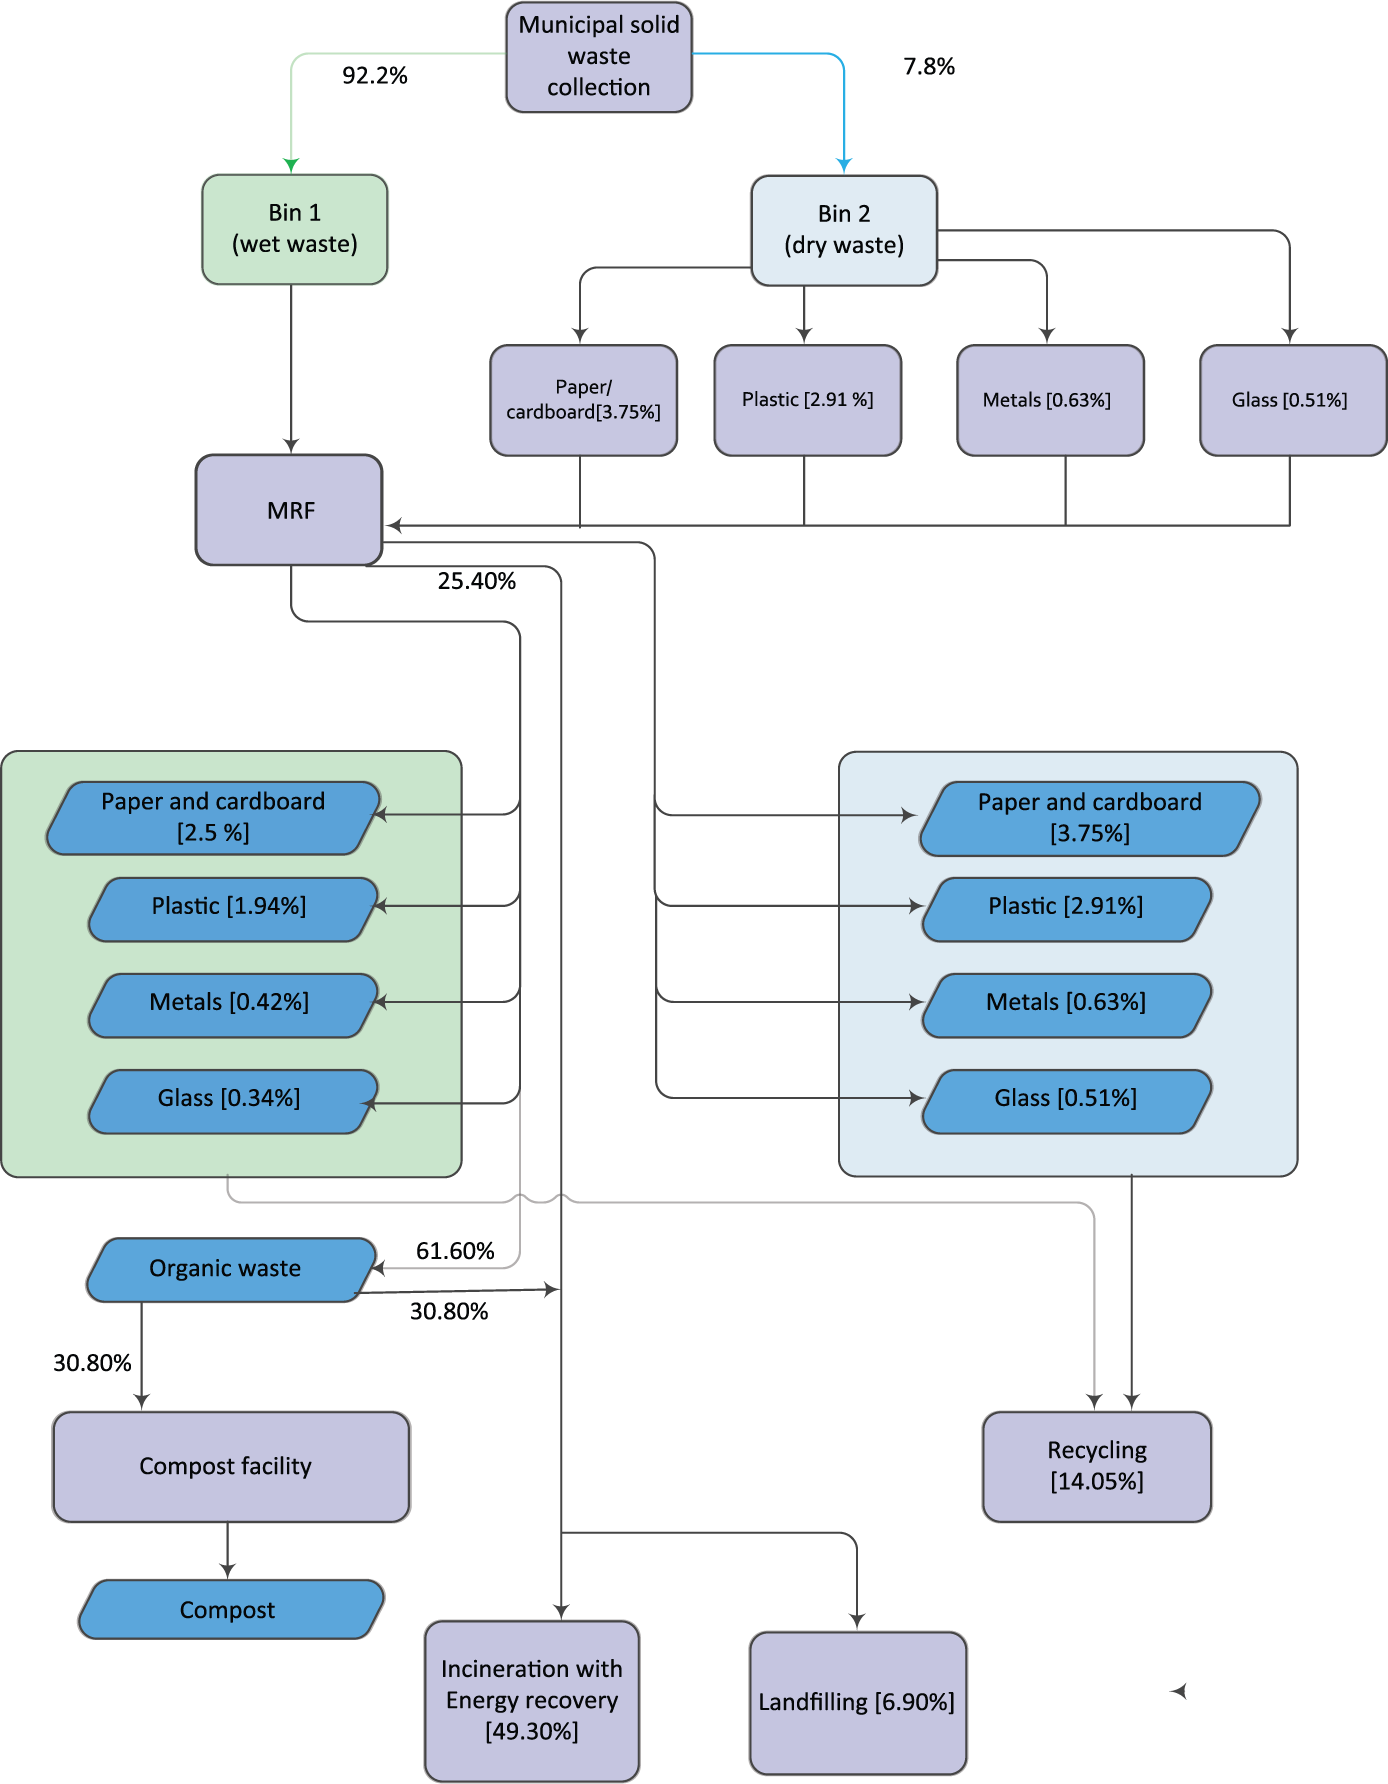
Scenario 4: MRF, incineration, recycling, composting and landfilling.
Allocation: According to LCA practitioners, allocation should be avoided whenever possible (Miliute and Staniskis, 2010). One method to avoid allocation controversy is to use the ‘system expansion’ approach, which is also known as an ‘avoided input or output approach’.
Similarly, since this study involves the utilization of the electricity produced as a by-product from the waste management scenarios, the system expansion approach has been used. The emissions avoided due to the utilization of conventional fossil-derived electricity production are subtracted from those produced from waste scenarios with energy recovery.
Life cycle inventory (LCI)
For the study, data for the LCI was gathered from annual reports from the landfill operator, literature and the database from the SimaPro software version 8.0.4.30 developed by Pré Consultants (2013). The Data Quality Requirements option of the software was used to select the most appropriate data with regards to time, geography and technology to suit the conditions in Mauritius.
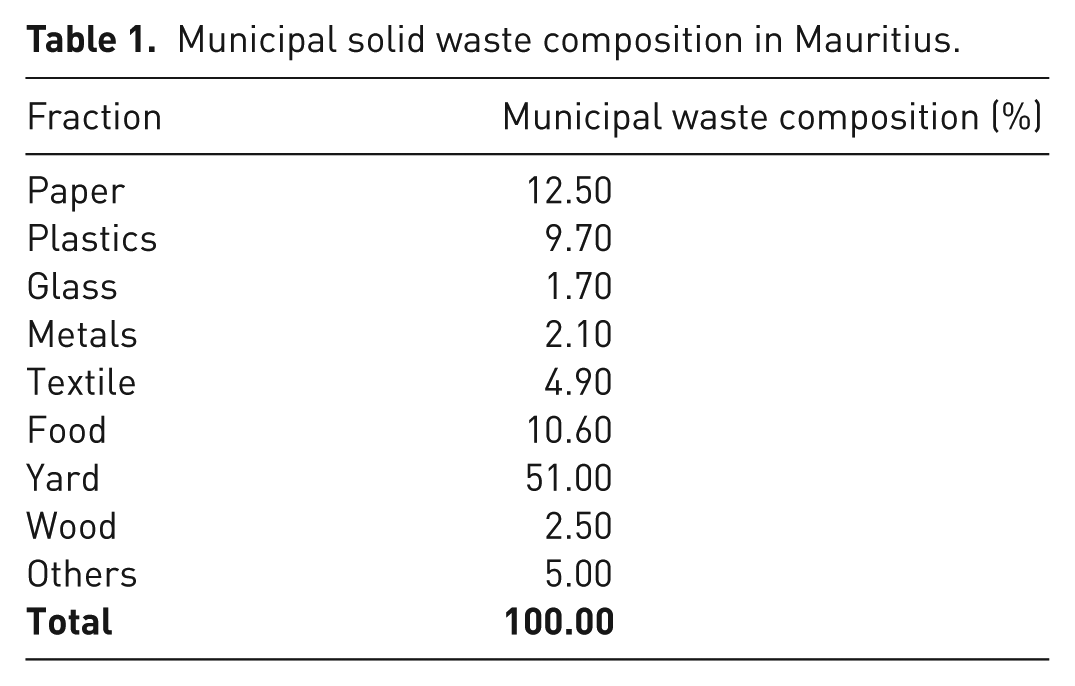
Waste Characterization: waste composition is an important parameter in the development of proper waste management strategies, as from the waste data, the recyclability, the combustibility or biodegradability of the waste streams can be identified and these can be subsequently used for designing and implementing appropriate waste management technologies (Mohee et al., 2015).
The waste management scenarios considered in this project take into account the waste characterization study carried out by the Ministry of Environment in 2009. This is detailed in Table 1.
Municipal solid waste composition in Mauritius.
Collection and transportation of wastes: part of the wastes generated are collected and transported to transfer stations where they are reloaded in truck trailers. Wastes generated in the south region of the island are directly hauled to the landfill site. Transportation is done by road. To create the inventory corresponding to the collection and transportation of wastes, the total distance travelled by the waste trucks and the tons of wastes transported in the year 2010 were considered for each MSW scenario. For collection, Transport, truck <10 t, EURO1, 50%LF, empty return/GLO Economic and for transportation, Transport, truck >20 t, EURO1, 50%LF, empty return/GLO Economic from the ecoinvent v2.0 database were considered.
The unit process for the collection of the compostable waste is selected from the ecoinvent unit processes in SimaPro 8.0.2 ‘Transport, municipal waste collection, lorry 21 t/CH U’. For the transportation of the recyclables to the recycling plant, Transport, truck <10 t, EURO2, 50%LF, empty return/GLO Economic from the ecoinvent database was selected.
Electricity: 83.8% of the total primary energy requirement is met from imported fossil fuels and 16.2% is derived from renewable energy sources (Ministry of Environment and Sustainable Development, 2013).
The electricity mix in Mauritius is as follows: oil 55.9%, biomass 15.3%, coal 27.9%, hydro 0.3%, wood 0.5% and wind 0.1%. A high-voltage electricity production according to these fractions was used from the ecoinvent v2.0 library.
Landfilling: landfill processes were performed using ecoinvent database v 2.0 of SimaPro software version 8.0.4.30. An average of 20,000 kWh of electricity and 240 m3 of water is consumed in a month (landfill operator, 2015, personal communication,). As regards to energy recovery, a total of 22,000,000 kWh would be produced each year for a period of five years.
Incineration: the incineration process is based on the model in the ecoinvent v 2.0 library. It is a mix of two different incineration models, one with a wet and one with a dry flue gas treatment (FGT) and different NOx-removal technologies to represent the appliance of the different FGT systems in Europe. The plant is fitted with a grate and a steam generator. Produced steam is used to generate electricity. The incinerator is an advanced technology and meets the requirements of 2007 in Europe. Some 10% of the electricity produced is consumed by the incinerator (Carl Bro, 2004). The water consumption was taken as 307.5 kg/t (Fernandez-Nava et al., 2014).
Composting: the composting process is based on the inventory data in the ecoinvent v 2.0 library. It involves a net consumption of energy to produce a material used as an artificial fertilizer (Bovea and Powell, 2006). The avoided chemical fertilizer is an equivalent amount of nutrients (nitrogen and phosphorus). The values for nitrogen, N and phosphorus, P were calculated by considering 28.2 kg N/t of waste and 3.9 kg of P/t of waste, respectively (Banar et al., 2009). Further, the energy consumption during the composting process was taken as 54.4 MJ/t for electricity demand and 555.5 MJ/t for diesel consumption in the wheel loader, mills and strainers (Banar et al., 2009).
MRF: The collected MSW will be separated at the MRF and materials like paper, plastics, glass and metals will be recycled at a rate of 50%. The different fractions obtained at the MRF are compressed in bales and then transported to the recycling plant. The impact due to these operations is due to electrical energy consumption used at the MRF and during bales production. The electricity consumption was taken as 5.9 kWh/t and the water consumption as 29.1 l/t (Bovea and Powell, 2006).
Main assumptions: Table 2 summarizes the main assumptions taken under each scenario studied.
Main characteristics and assumptions.
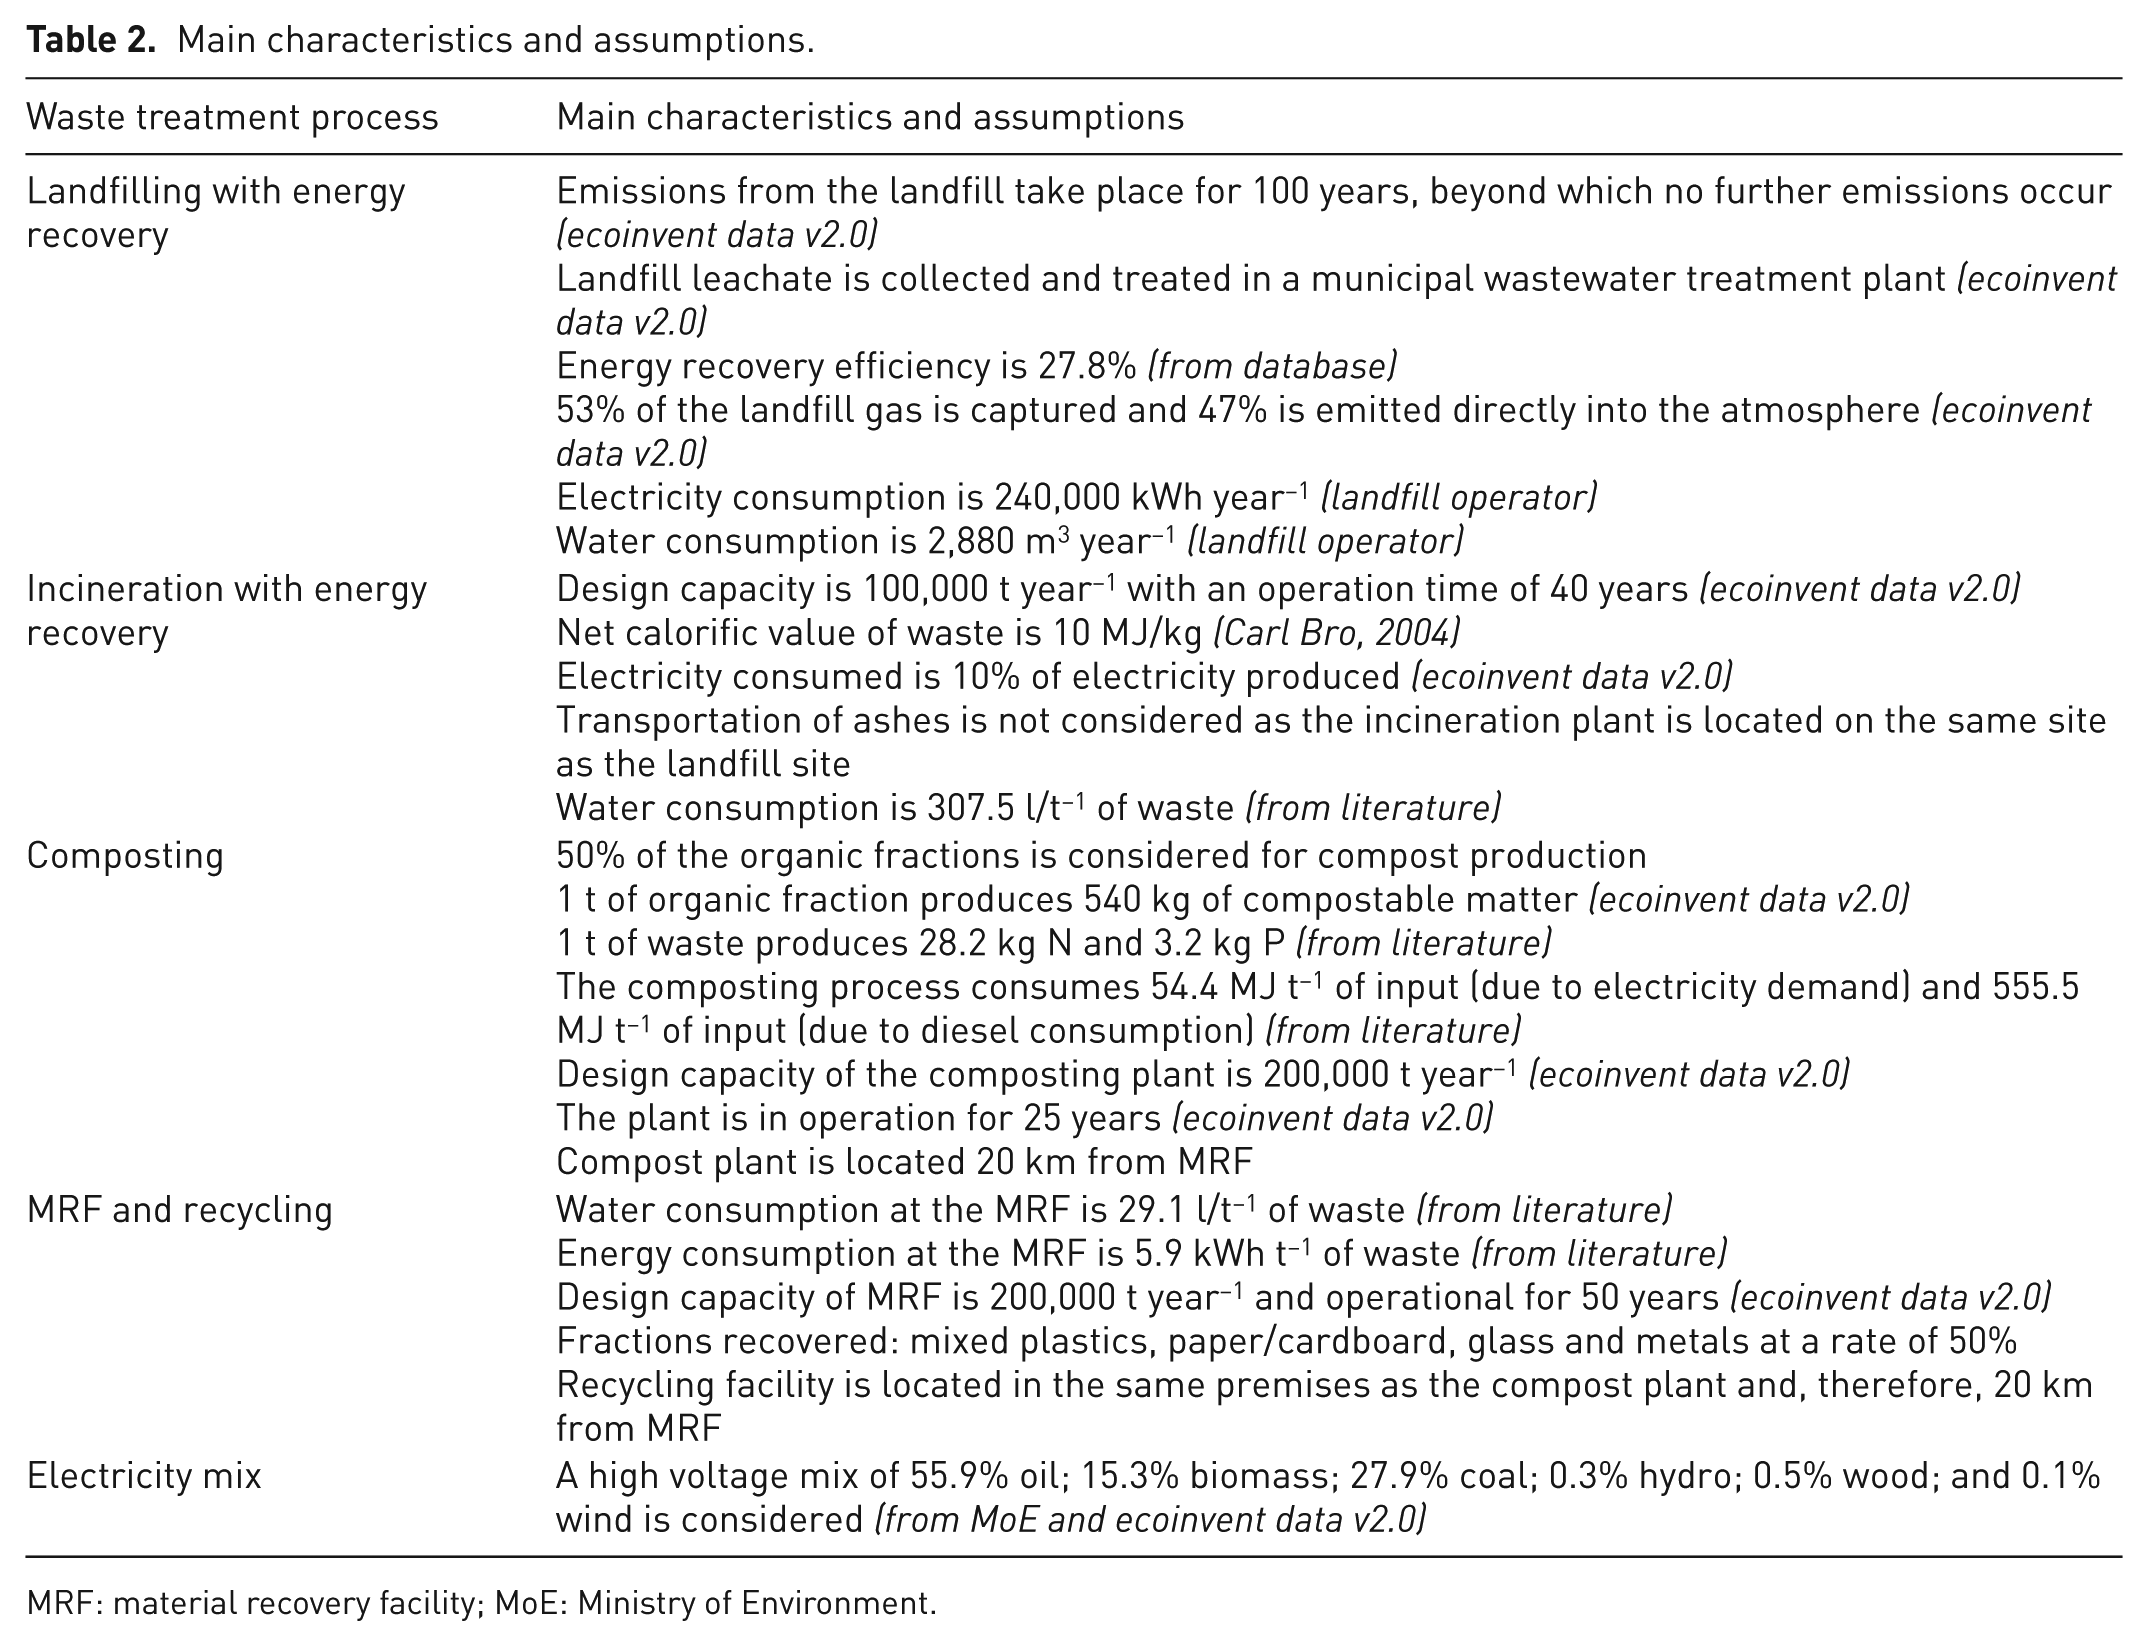
MRF: material recovery facility; MoE: Ministry of Environment.
Life cycle impact assessment (LCIA)
Eleven impact categories included in the CML-IA method were investigated.
The ReCiPe method was also used to determine the impact at the end-point level using the following indicators: human health, ecosystem diversity and resource availability.
Life cycle interpretation (LCI)
Finally, the results from the LCI and LCIA are evaluated and interpreted. A sensitivity analysis was also performed to check the robustness of the results. Sensitivity 1 was done by increasing the recycling rates from 50% to 75% in Scenario S4 (incineration, recycling, composting and landfilling). Sensitivity 2 was done by assuming that the recycling in S4 is being done abroad; more precisely, in India. Therefore, additional transport (shipping from Mauritius Sea Port to Mumbai Sea Port) and road transport from the port to a recycling plant has been added. Sensitivity 3 was done by increasing the net calorific value of the wastes from 10 MJ/kg to 18.8 MJ/kg. The latter figure is based on a conference paper published by Mohee et al. (2010).
Results and discussion
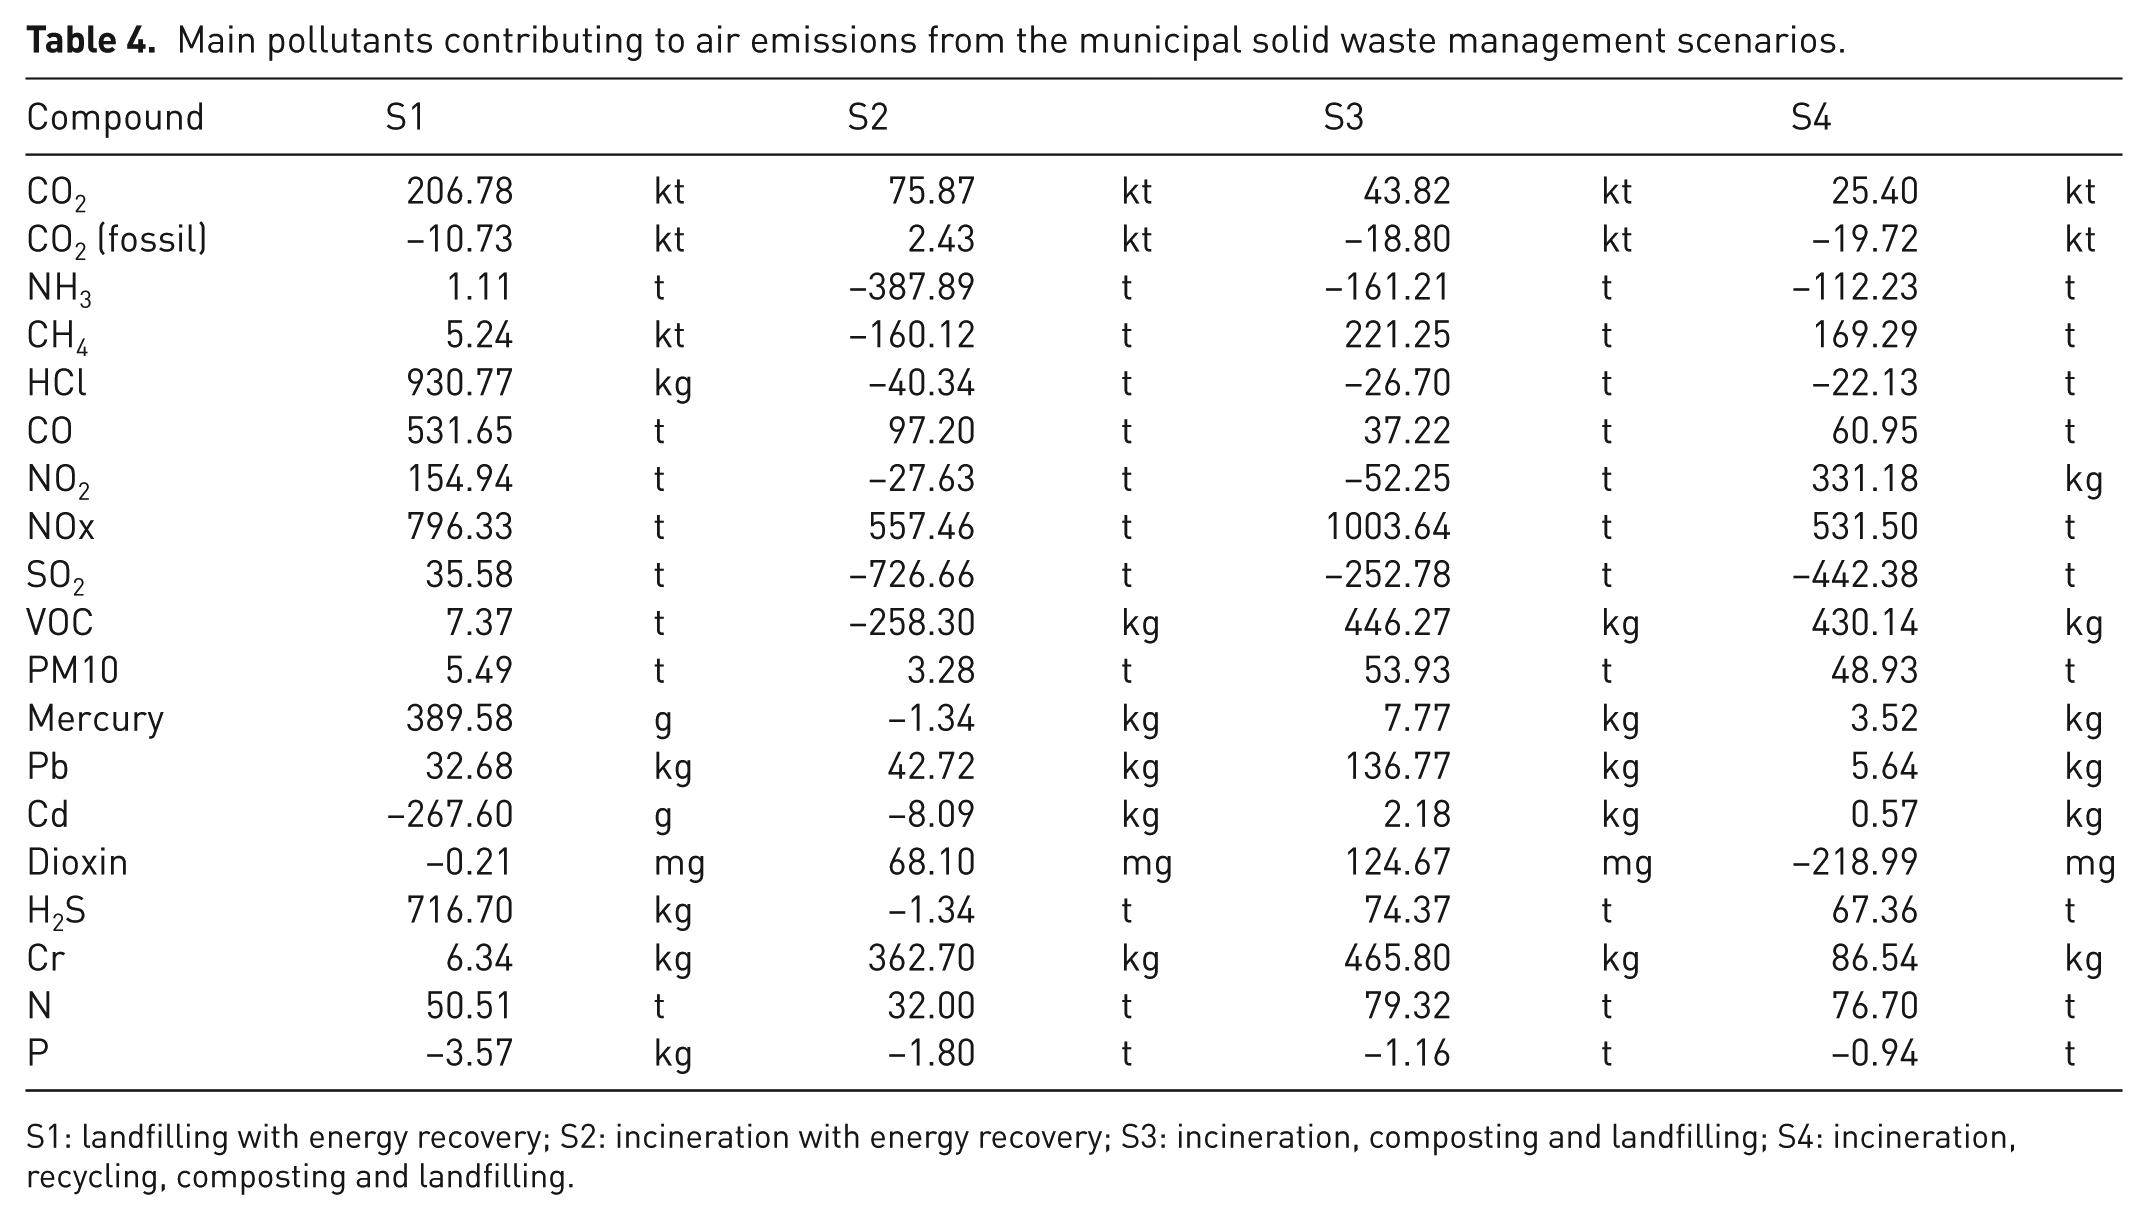
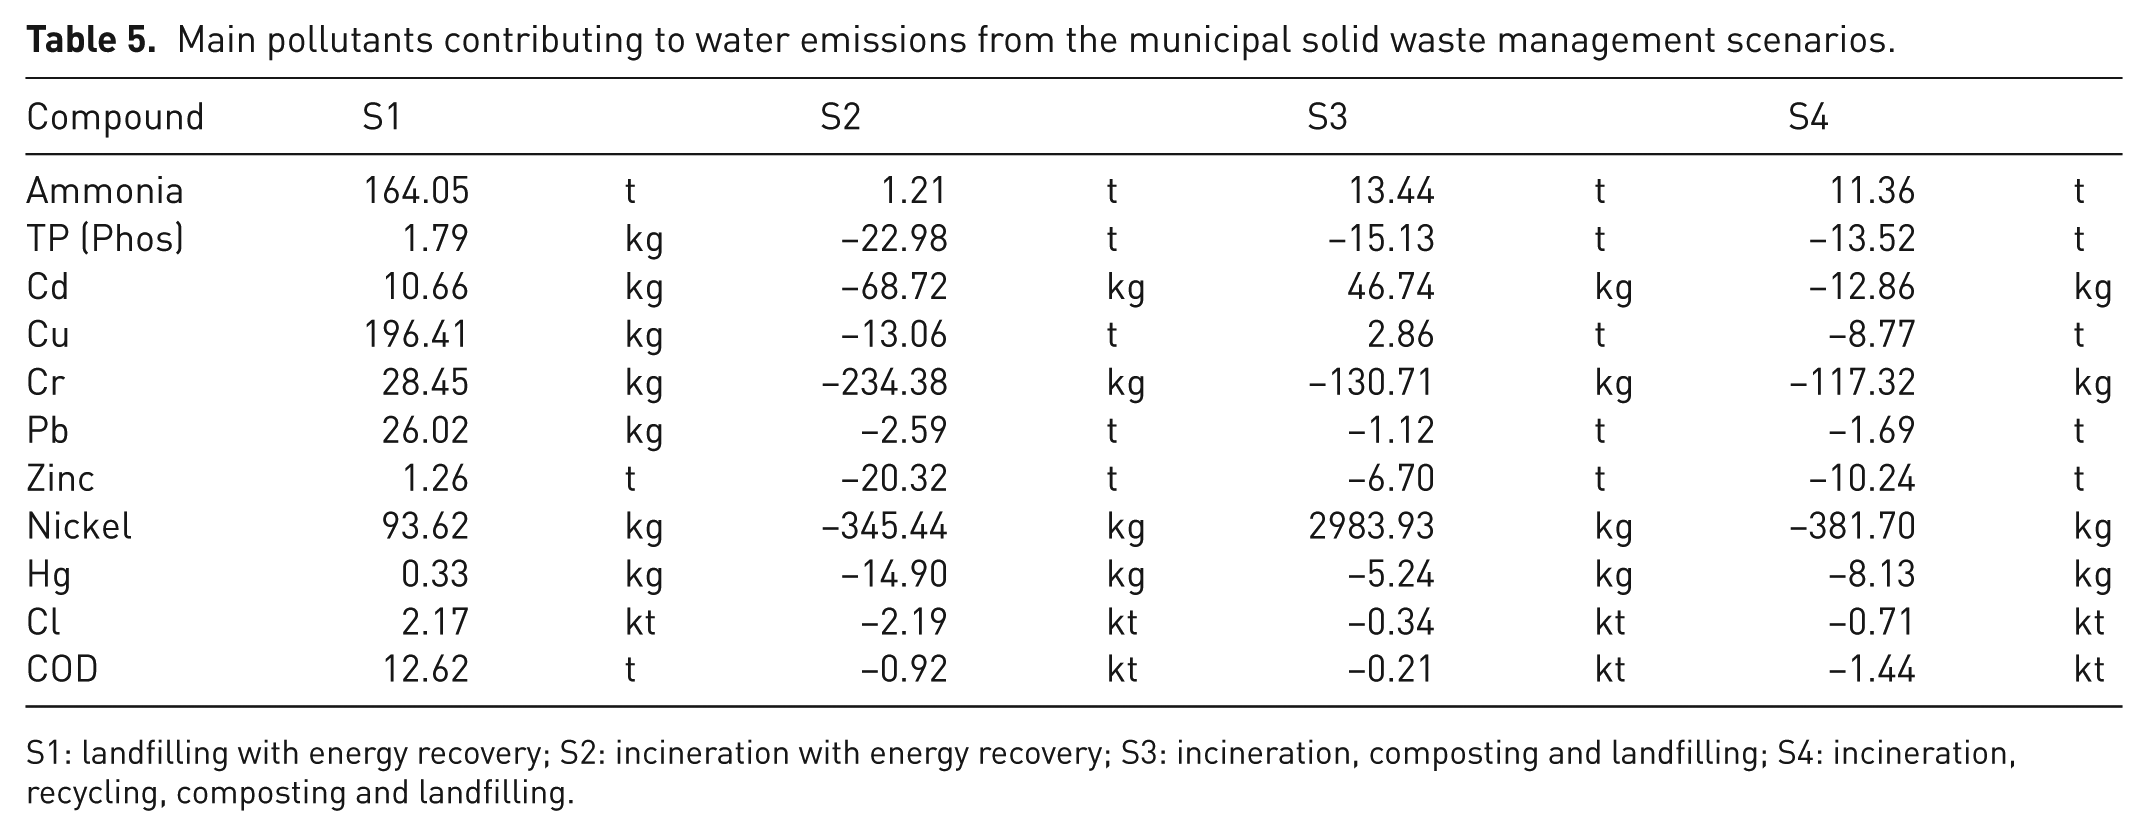
Table 3 shows the inventory of the resources consumption and energy recovery for the different scenarios. The air and water emissions inventories of the main pollutants are given in Tables 4 and 5.
Life cycle inventory of resources for each scenario.
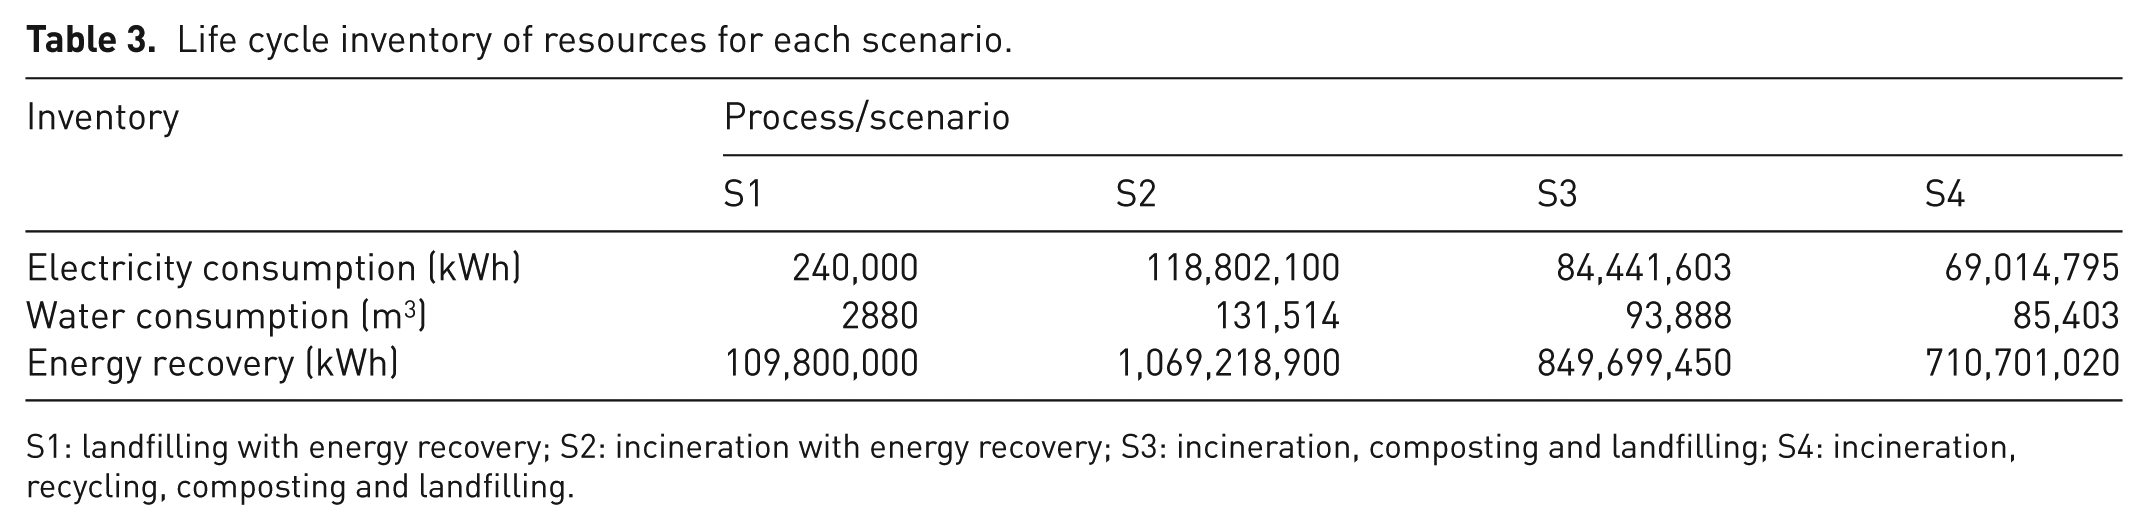
S1: landfilling with energy recovery; S2: incineration with energy recovery; S3: incineration, composting and landfilling; S4: incineration, recycling, composting and landfilling.
Main pollutants contributing to air emissions from the municipal solid waste management scenarios.
S1: landfilling with energy recovery; S2: incineration with energy recovery; S3: incineration, composting and landfilling; S4: incineration, recycling, composting and landfilling.
Main pollutants contributing to water emissions from the municipal solid waste management scenarios.
S1: landfilling with energy recovery; S2: incineration with energy recovery; S3: incineration, composting and landfilling; S4: incineration, recycling, composting and landfilling.
S1 contributes to a large extent of carbon dioxide and methane emissions in the air, with an amount of 206.78 kt and 5.24 kt, respectively. The carbon dioxide is emitted during the degradation of the organic fractions in the landfill and during the collection and transportation of wastes, while the methane is emitted during the degradation of the organic fractions in the landfill. There is, nevertheless, a saving in the carbon dioxide (fossils) due to the combustion of landfill gas to generate electricity. The high airborne emissions of ammonia and volatile organic compound (VOC) in S1 is due to the release of the landfill gas. The water pollution in S1 is largely due to the generation of leachate. All alternative scenarios lead to a significant reduction in airborne emissions compared to S1. However, in S4, the recovery of recyclables are beneficial due to the avoidance of using virgin materials, and this consequently results in lower emissions to air and water when compared to S3. For instance, the recycling of paper in S4 helps in avoiding sulfur dioxide emissions. The emissions of methane in S3 and S4 is due to partial landfilling of wastes. In S3, the release is relatively higher due to a larger amount of wastes being landfilled than in S4.
The relatively high amount of nitrogen emissions in S3 and S4 is due to the composting process. S2, on the other hand, produces the least emissions of nitrogen. Also, the recycling process in S4 helps in avoiding the nitrogen emissions. Incineration of wastes shows a net saving compared to the other scenarios with respect to carbon dioxide (fossil), carbon monoxide and heavy metals due to the energy recovery during the waste combustion process.
There is a net saving during both incineration and recycling due to the production of electricity and the advantage of not using virgin materials during the production of plastics, metals, glass and paper.
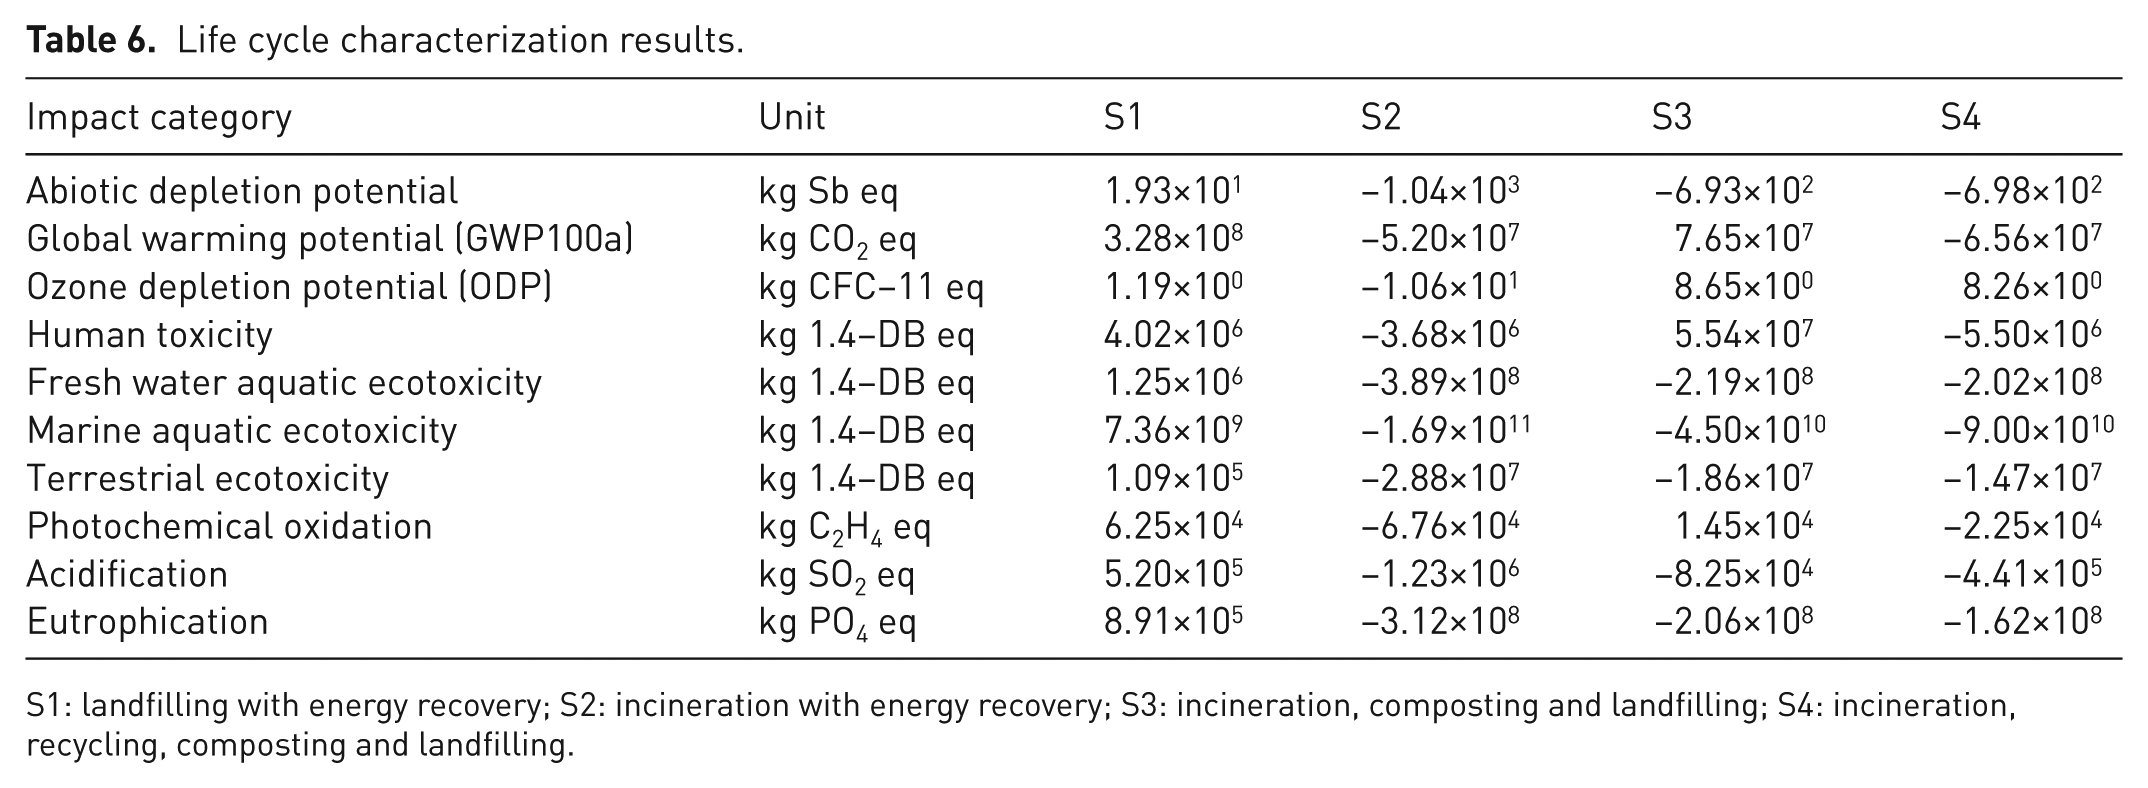
The results of the LCA characterization analysis for each impact category of each MSW scenario studied are reported in Table 6.
Life cycle characterization results.
S1: landfilling with energy recovery; S2: incineration with energy recovery; S3: incineration, composting and landfilling; S4: incineration, recycling, composting and landfilling.
S1 is the worst scenario in all the impact categories except for the ozone depletion potential and human toxicity. The contribution of each scenario in each impact category, together with the process contribution in each MSW scenario, is elaborated in the following sections.
S1 has the highest impact of abiotic depletion. S2 is seen to have the least impact, despite the fact that incineration consumes fossil fuels such as hard coal, natural gas and lignite for electricity (Yay, 2015). In both scenarios S1 and S2, the process of collection and transportation of wastes to transfer stations contributes the most in this category as they are the main consumer of fossil fuels due to the use of diesel. Composting contributes to abiotic depletion as energy is consumed during the process, whereas recycling helps in avoiding the use of virgin materials. In all the scenarios, the construction of waste treatment facilities contributes the most to this impact category, followed by collection and transportation of wastes to transfer stations.
As expected, landfilling contributes the maximum to global warming potential (GWP). Carbon dioxide, methane and nitrous oxide are the main pollutants under this impact category. The GWP emissions per ton of waste for the current MSW management system is about 770 kg of CO2 equivalent. This value is comparable to that obtained by Mendes et al. (2004) who obtained a value of 900 kg of CO2 eq/t of waste when analyzing the landfill of waste in the city of Sao Paulo in Brazil, and by Liamsanguan and Gheewala (2008) who recorded an amount of 628 kg of CO2 eq in their study in Phuket, Thailand. Landfilling process contributes to more than 60%, as shown in Figure 6 and Table 6. The composting process does not have a considerable influence on the results, because biogenic CO2 is not considered to be contributing to global warming. Also, the production of mineral fertilizer is of minor importance to this impact category. Scenario S4 is the best scenario mainly due to energy recovery from incineration and partly due to the recycling of materials. Although incineration releases carbon dioxide and dioxins during waste combustion, especially during the emission of fossil carbon in plastics, the net contribution related to the incineration process shows net savings of almost 60% due to the production of electricity.
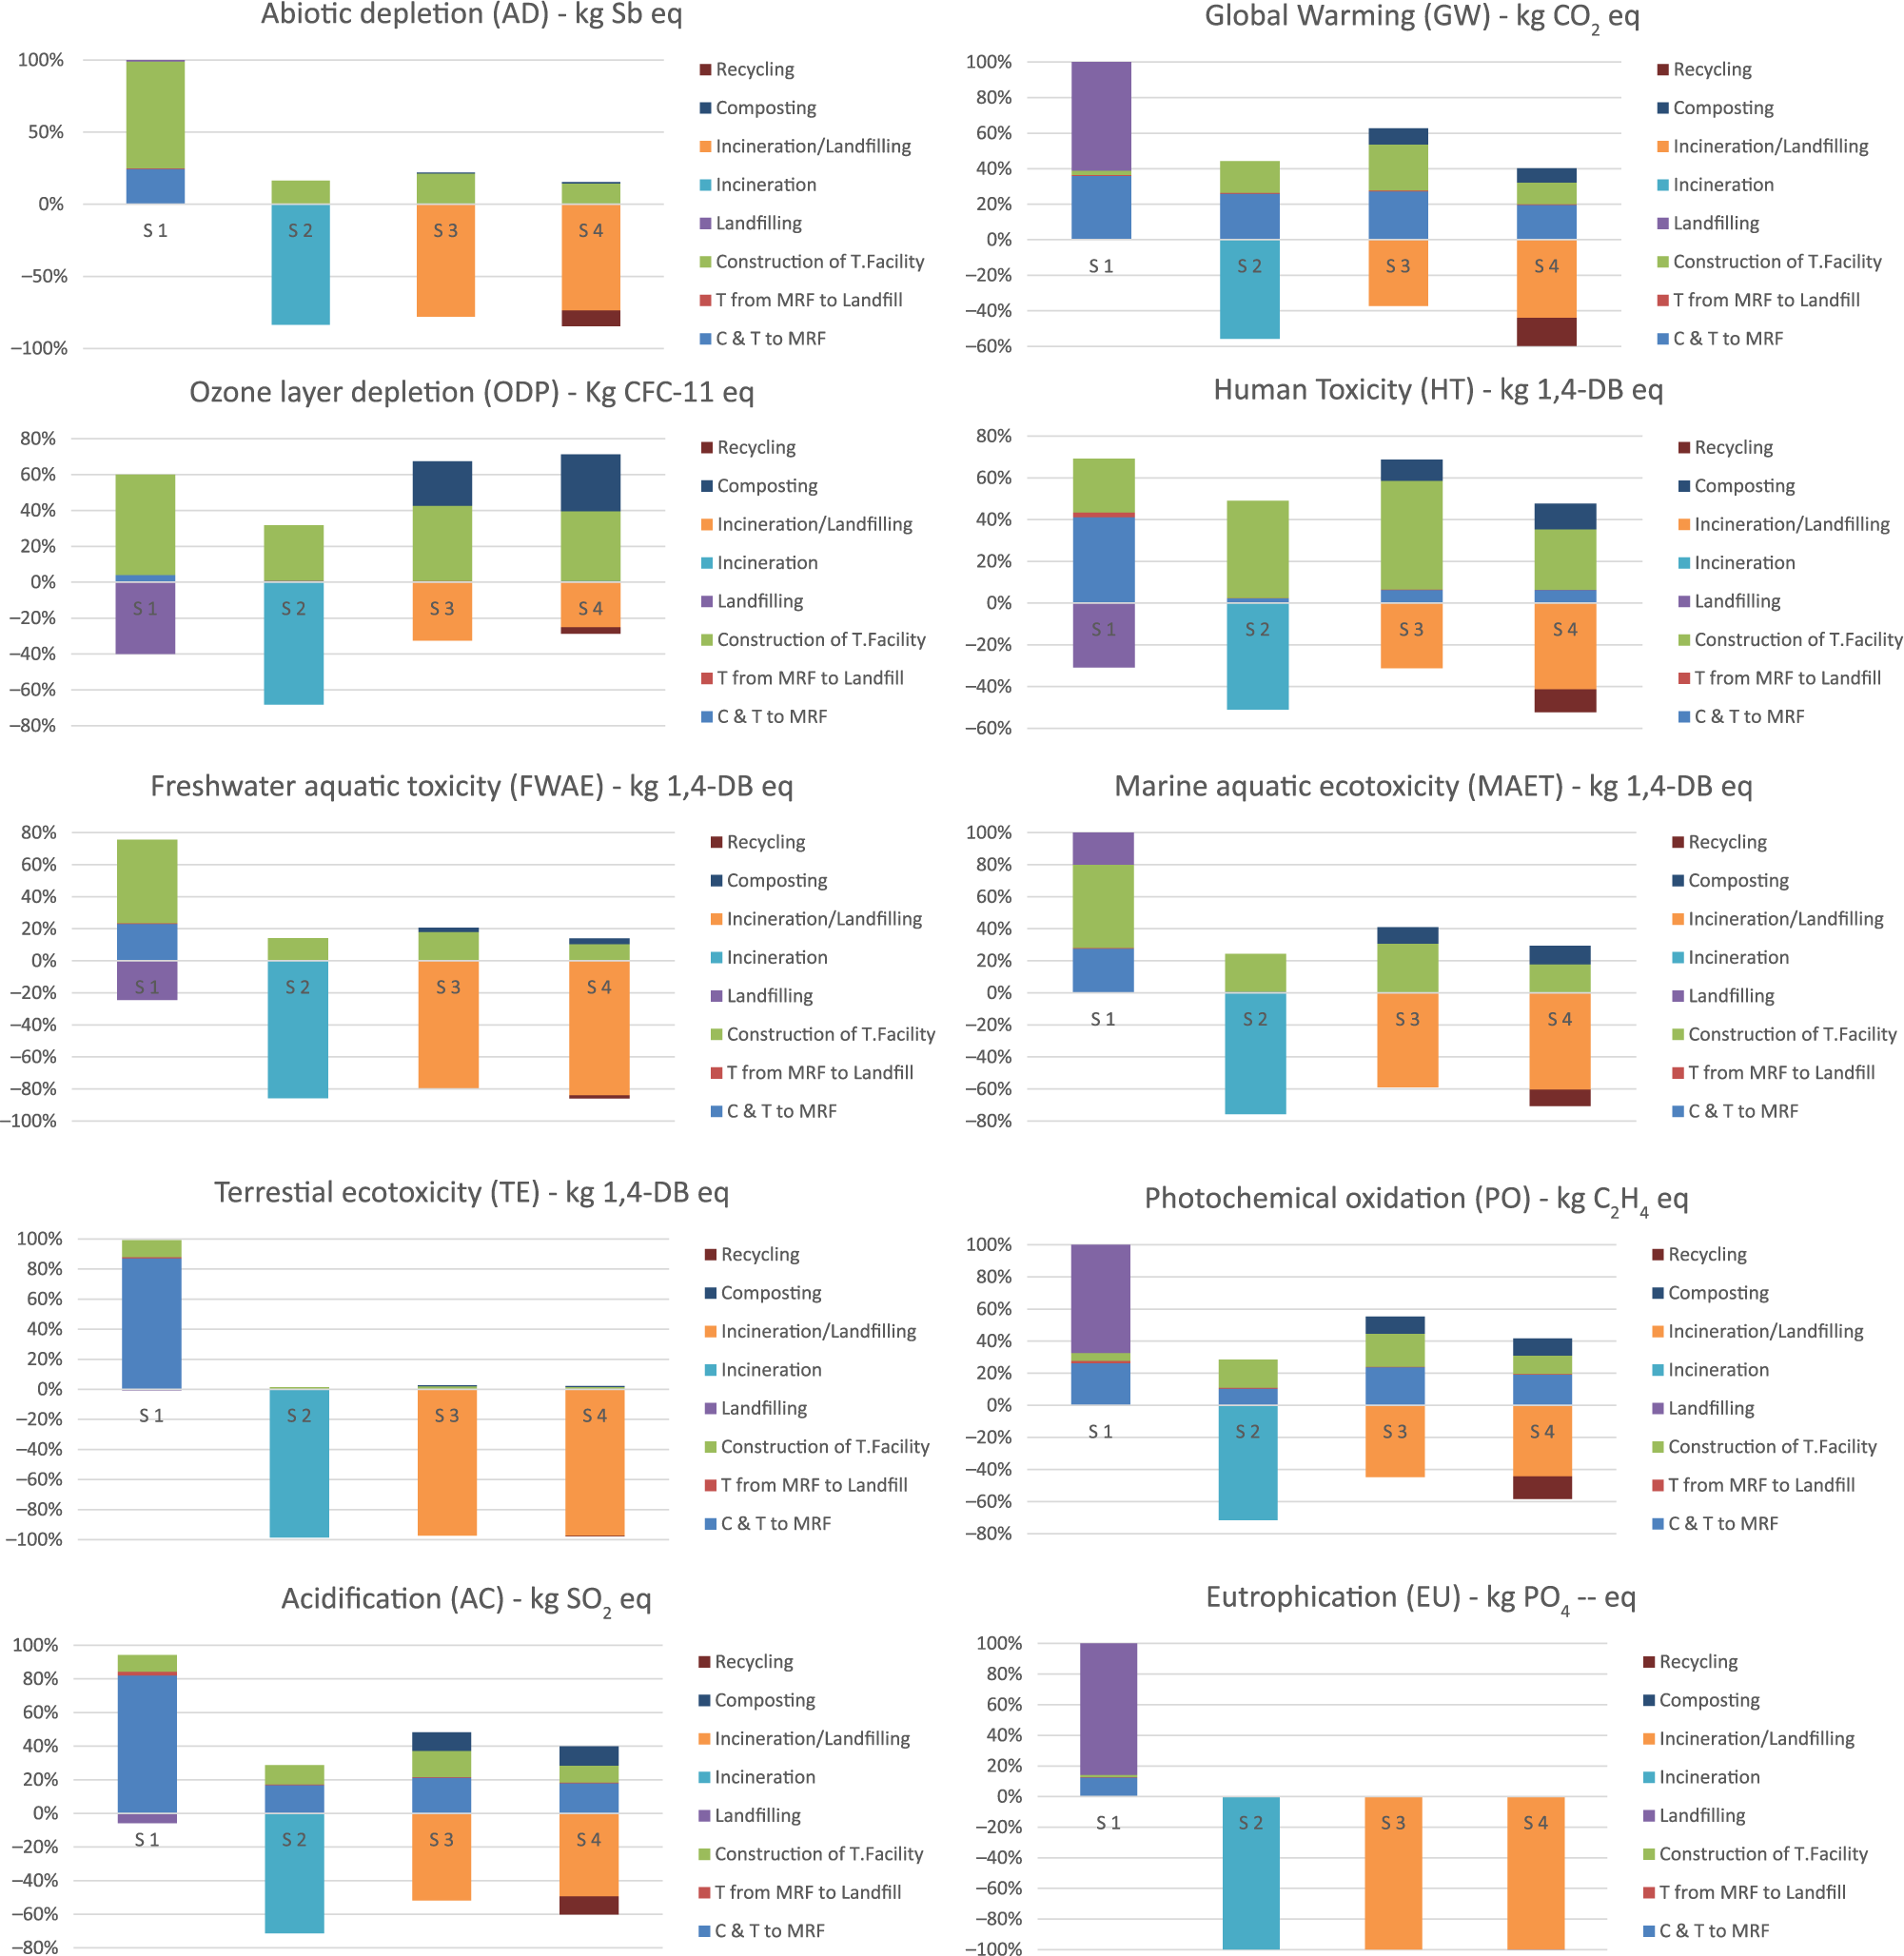
Contribution of each process from each scenario.
In general, a net contribution to ozone layer depletion can be found in all scenarios except in S2 where there is a net saving of about 70%. This is in line with the study performed by Yay (2015) where it was observed that the scenario with incineration and landfilling contributes to a net savings compared to other scenarios with composting. S1 contributes less significantly to this category. This has also been confirmed by Bovea and Powell (2006). The recycling of recovered fractions also contributes to savings because the recovered products are replacing the products manufactured using virgin materials. On the other hand, the composting process contributes significantly due to the construction of the waste treatment facility, transportation of organic wastes to composting plant and transporting compost to the market.
With regards to human toxicity, S4 is the best scenario due to savings during incineration and recycling processes. During incineration, the generation of NOx and SO2 is avoided due to the recovery of electricity during waste combustion. In all the scenarios except scenario S1, the construction of the treatment facilities is the main contributor to this impact category. The scenario that includes recycling (S4) is better than the others resulting from the recycling of metals.
The incineration scenario (S2) has the least eco-toxicity effect due to the recovered electricity during waste combustion. The construction of a treatment facility is the main process contributing to this impact category in scenarios S2, S3 and S4. Dong et al. (2014) concluded from their study that incineration contributes the most to this impact category. The difference with this study is that Dong et al. (2014) considered a net calorific value of 4.31 MJ kg−1 with co-firing of 50 kg of coal per ton of waste being fed. This study is considering a net calorific value of 10 MJ kg−1, with more electricity generated and more avoidance in the generation of pollutants.
The major sources of ground-level ozone are the SOx and NOx emissions related to fossil fuel consumption and the release of VOCs. S1 is the worst alternative related to photochemical oxidation due to the generation of methane gas. The landfilling process contributes to more than 70%. The best alternative is S2, followed by S4. The positive impact in S2 is mostly caused by saved non-methane volatile organic compound from the heat process (Miliute and Staniskis, 2010). In scenario S4, although recycling contributes to savings, the saving is less compared to S2, mainly due to the fact that in S4 less amount of waste is being incinerated. The result is in line with the studies performed by Miliute and Staniskis (2010) and Bovea and Powell (2006). In all the scenarios, the collection and transportation of wastes to the treatment facility and the construction of a treatment facility contributes to this impact category due to the release of SO2. Composting also contributes to this impact due to the release of SO2 and nitrogen oxides in the amounts of 103 t and 104.5 t, respectively.
Major acidifying pollutants are sulfur oxides (SOx,), nitrous oxides (NOx), HCl and NH3. The net contribution to this impact in S1 is the fuel consumption during collection and transportation of wastes to transfer stations followed by the construction of the treatment facility. In S2, the contribution made by the collection and transportation of wastes to transfer stations and construction of the treatment facility is counterbalanced by the incineration process. Scenarios S3 and S4 produce savings in this impact category due to the incineration/landfilling process followed by the recycling process. S2 is the most favorable scenario, with a saving of about 70%. However, it is good to mention that in the absence of energy recovery, incineration would have produced most of the acidifying pollutants (Dong et al., 2014). Also, composting contributes significantly to this impact category due to the release of ammonia (46.7 t). Similar results have been found by De Feo and Malvano (2009) and Bovea and Powell (2006) On the other hand, recycling provides savings to this impact as the production of materials requires considerable amount of energy based on ‘dirty’ fuels like coal and crude oil (Miliute and Staniskis, 2010).
The main pollutants causing eutrophication are ammonia as nitrogen, total phosphorus and COD. All scenarios except S1 contribute to net saving in this impact category. In S1, the landfilling process is the main contributor. This is equivalent to almost 90% of the total impact in S1, as shown in Figure 6. This is mainly due to the generation of leachate. The collection and transportation of wastes to the transfer stations/MRF also contributes positively due to the release of nitrogen oxides (NOx) and phosphate during transportation. Further, composting has a significant impact. This is in line with De Feo and Malvano (2009). Composting causes emissions from the spreading of the compost. Recycling also contributes to savings. However, the major saving is from the incineration process in S2, S3 and S4 due to the energy recovery process.
Figure 7 shows the normalized results of the damage categories. S1 has the most impacts in all the three damage categories (human health, ecosystems and resources). S2 shows the most savings in the human health and ecosystems damage categories. The savings are due to the avoided impacts which would have occurred if electricity had been generated from coal and oil. S3 shows the significant impacts on the human health and resources categories. In the resources category, S4 performs best due to energy recovery from incineration and the use of recovered materials for recycling.
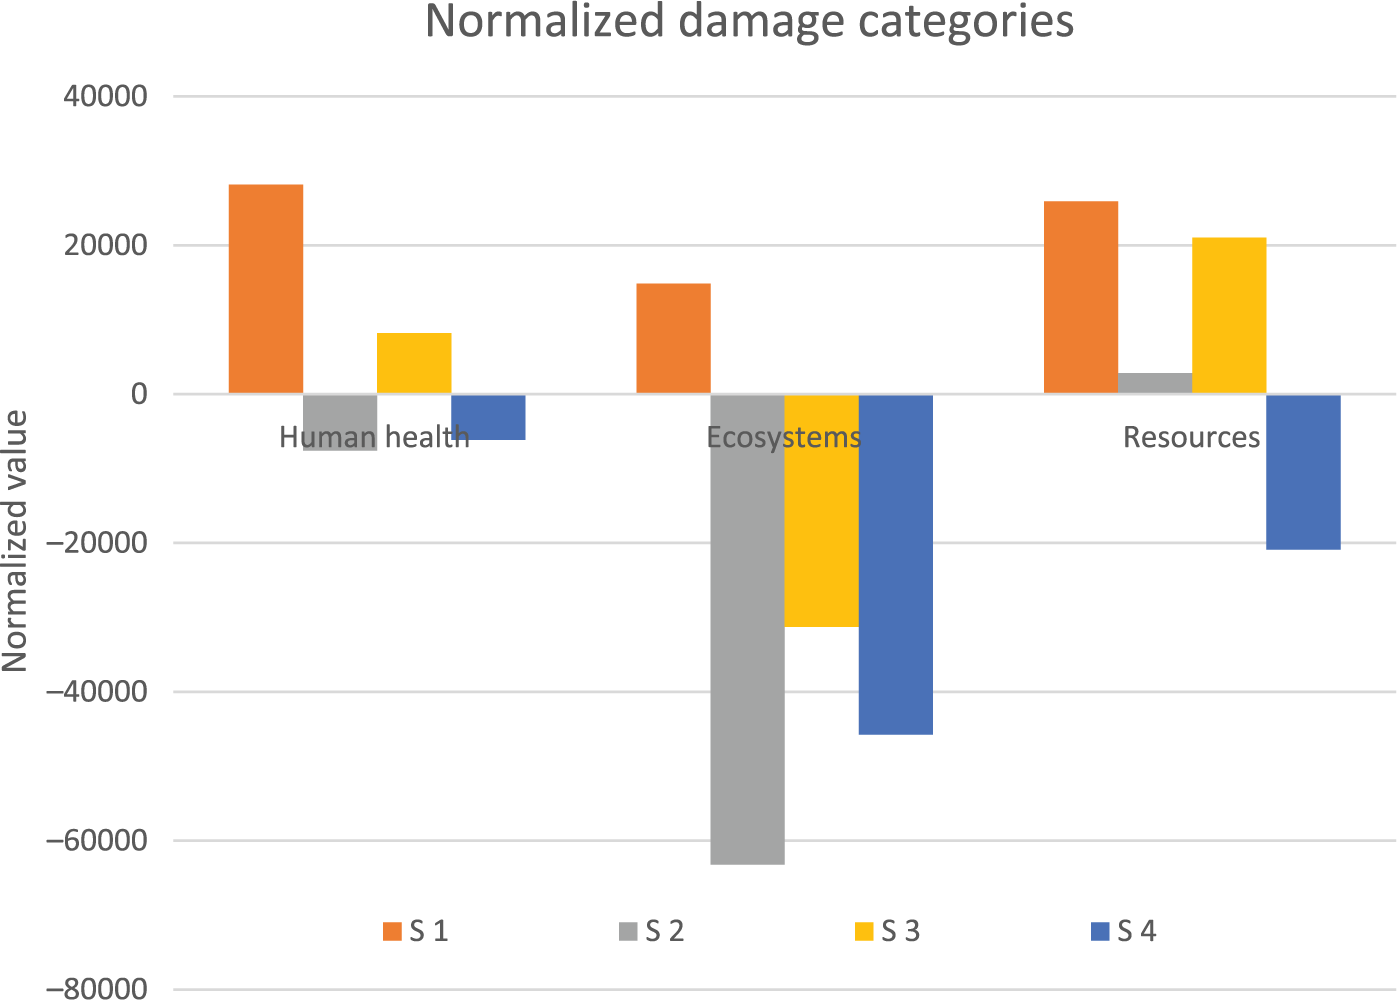
Normalized values of damage categories in each scenario.
Figure 8 indicates the sensitivity of the environmental impacts. In sensitivity 1, although the recycling rate is increased from 50% to 75%, the same ranking pattern is observed. In sensitivity 2, transporting the recovered wastes to India generates savings in categories like fresh water aquatic eco-toxicity, marine aquatic eco-toxicity photochemical oxidation, global warming and acidification. In sensitivity 3, the net calorific value of the waste is increased from 10 MJ/kg to 18.8 MJ/kg. Again, S2 remains the best option since the amount of waste being incinerated (427,687T) is more compared to scenarios 3 & 4. .
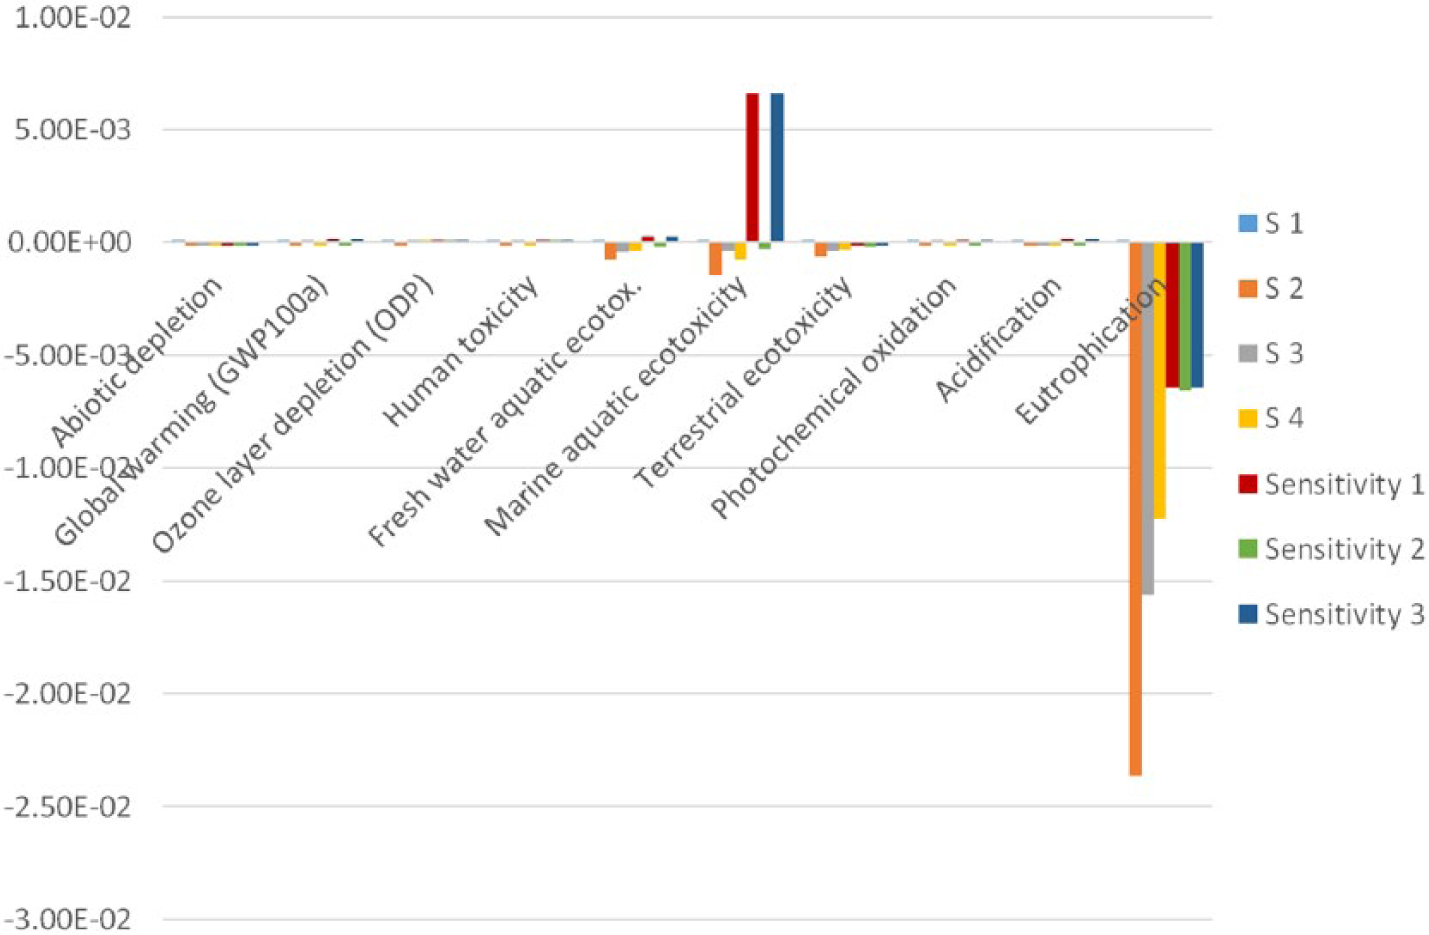
Normalized results of the sensitivity analysis.
Conclusions
LCI of the baseline scenario (S1) is helpful in supplementing the life cycle database for Mauritius. All alternative scenarios lead to a significant reduction in airborne and waterborne emissions compared to S1. The incineration of wastes with energy recovery shows a net saving compared to the other scenarios due to energy recovery during the waste combustion process. There is a net saving during both incineration and recycling due to the production of electricity replacing fossil-based electricity on the grid and the advantage of not using virgin materials during the production of plastics, metals, glass and paper.
In accordance with the literature, this study also shows that S1 is the most undesirable scenario as it generates the worst environmental impacts compared to the other waste scenarios. S2 produces the least environmental impact in all analyzed categories except in the global warming and human toxicity categories. This is due to the production of electricity during waste combustion. The improvements in eutrophication impact are particularly significant and scenario S2 is the optimal one here.
S4 performs better than S3 as recycling provides savings due to reduction in emissions made possible by replacing raw materials by the recovered materials. Composting, although substituting the use of nitrogen and phosphorus fertilizers, does contribute to environmental impacts. Composting deteriorates the impact categories in scenarios S3 and S4. This indicates that the waste management hierarchy should be applied flexibly and an integrated waste management approach must take the local specificity into account.
Using the normalized result of the end-point method, S1 causes the most impact in all the damage categories (human health, resources and ecosystems). S2 contributes positively in the resources category, while generating savings in human health and the ecosystem. S4 shows the most saving in the resources damage category. The incineration process is mostly beneficial in S2 since the amount of wastes being incinerated is more (427,687 t) compared to 295,959 t and 240,360 t in S3 and S4, respectively, and with more energy recovery.
Increasing the recycling rate from 50% to 75% increases the impact of marine aquatic eco-toxicity, fresh water aquatic eco-toxicity, global warming, photochemical oxidation and acidification due to a lesser amount of waste. Sensitivity 2, which involves recycling in India, generates savings in marine aquatic eco-toxicity, fresh water aquatic eco-toxicity, global warming, photochemical oxidation and acidification.
When comparing the normalized result of the different waste scenarios with sensitivity 3, where the net calorific value of the waste in S4 is increased from 10 MJ/kg to 18.8 MJ/kg, S2 still remains the most preferred option.
The collection and transportation of wastes to MRF/transfer stations has a considerable impact in the GWP, photochemical oxidation formation and acidification categories through the use of resources in the form of fossil fuels. At the end-point level, this process has a considerable impact on all the damage.
Incineration would be a good choice for MSW management in Mauritius. However, an advance flue gas system and combustion technology should be adopted in addition to efficient energy recovery. From an environmental point of view, it is recommended to consider S2 and S4 for future planning due to the limited space for landfilling and to allow for material recovery. It is important to record that in any scenarios, the need to construct a landfill is inevitable for the disposal of all waste fractions that cannot be valorized.
Footnotes
Declaration of conflicting interests
The authors declared no potential conflicts of interest with respect to the research, authorship, and/or publication of this article.
Funding
The authors received no financial support for the research, authorship, and/or publication of this article.