
Abstract
For the objective of evaluating the contamination degree of heavy metals and analysing its variation trend in soil at a waste electrical and electronic equipment processing area in Shanghai, China, evaluation methods, which include single factor index method, geo-accumulation index method, comprehensive pollution index method, and potential ecological risk index method, were adopted in this study. The results revealed that the soil at a waste electrical and electronic equipment processing area was polluted by arsenic, cadmium, copper, lead, zinc, and chromium. It also demonstrated that the concentrations of heavy metals were increased over time. Exceptionally, the average value of the metalloid (arsenic) was 73.31 mg kg−1 in 2014, while it was 58.31 mg kg−1 in the first half of 2015, and it was 2.93 times and 2.33 times higher than that of the Chinese Environmental Quality Standard for Soil in 2014 and the first half of 2015, respectively. The sequences of the contamination degree of heavy metals in 2014 and the first half of 2015 were cadmium > lead > copper > chromium > zinc and cadmium > lead > chromium > zinc > copper. From the analysis of the potential ecological risk index method, arsenic and cadmium had higher ecological risk than other heavy metals. The integrated ecological risk index of heavy metals (cadmium, copper, lead, zinc, and chromium) and metalloid (arsenic) was 394.10 in 2014, while it was 656.16 in the first half of 2015, thus documenting a strong ecological risk.
Keywords
Introduction
With the development of science and technology, electrical and electronic equipment (EEE) is renewed much more frequent, which results in a large amount of waste electrical and electronic equipment (WEEE). According to the statistics of China Association of Renewable Resources in 2011, WEEE was 3.5 million tons in China, and it is expected to grow at a speed of 5%~10% per year (Li, 2012). Research showed that 20~25 million tonnes of WEEE were generated around the world annually, and about 50%~70% of them were transported into China (Kong et al., 2012). WEEE contains heavy metals and organic substances, and the improper disposal of WEEE will make these toxic and harmful substances pollute the environment (Xie and Chen, 2014).
According to a study in Switzerland, the concentration of copper in WEEE was 41,000 mg kg−1, and it was about 1.3 times higher than that of municipal waste, while the concentration of chromium was 9900 mg kg−1, which was about 2.1 times higher than that of municipal waste (Morf et al., 2007). Researches showed that soil in a WEEE processing area suffered from different contamination degrees of cadmium, copper, lead, zinc, chromium, mercury, and nickel (Chen et al., 2015; Li et al., 2012). Another study (Qin et al., 2013) found that the concentrations of mercury, copper, cadmium, and nickel in the soil near a WEEE processing area exceeded 3.80%, 3.80%, 87.34%, and 8.23%, respectively, when compared with the Chinese Environmental Quality Standard for Soil (CEQSS, GB15618-2008). The soil in three types of industrial fields was sampled, and the results revealed that the soil was contaminated with heavy metals, then the health of nearby residents was threatened (Xie et al. 2009). There is little research focused on the variation tendency of heavy metals along with time. Therefore, it is necessary to analyse the soil pollution at WEEE processing areas, to provide the basis for controlling the pollution on the WEEE dismantling process.
The purpose of this study was to evaluate the contamination level of soil at WEEE processing areas and to analyse the time dependent variation of metal content. Four methods were adopted in this study, and the conclusion might truly reflect the soil contamination at WEEE processing areas.
Materials and methods
Materials
Soils were sampled at a WEEE processing area (Shanghai). Location of the WEEE processing area and the sampling sites is shown in Figure 1. WEEE contains heavy metals, and dismantling activities may lead to heavy metals release, thus pollute the surrounding environment. Because of the short distance between WEEE processing area and residents’ home and farmland, it is very important to monitor the variation of heavy metals’ content near the WEEE processing area. Considering the seasonal variation of weather in this area, one sampling is taken at every season from winter in 2013 to summer in 2015. For the accuracy of the experimental conclusion, samples that were at the depth of 0~20 cm from the surface of the soil were chosen for investigation (Yin et al., 2013). Shovel, valve bag, pencil, and paper labels were prepared prior to sampling (Xi and Zhang, 2007). All of the samples were placed in a clean, ventilated place to dry naturally. Impurities (rocks, grass roots) were eliminated before sieving, and samples were sieved by a sieve (100 mesh). All the chemicals used in this study were of analytical grade.
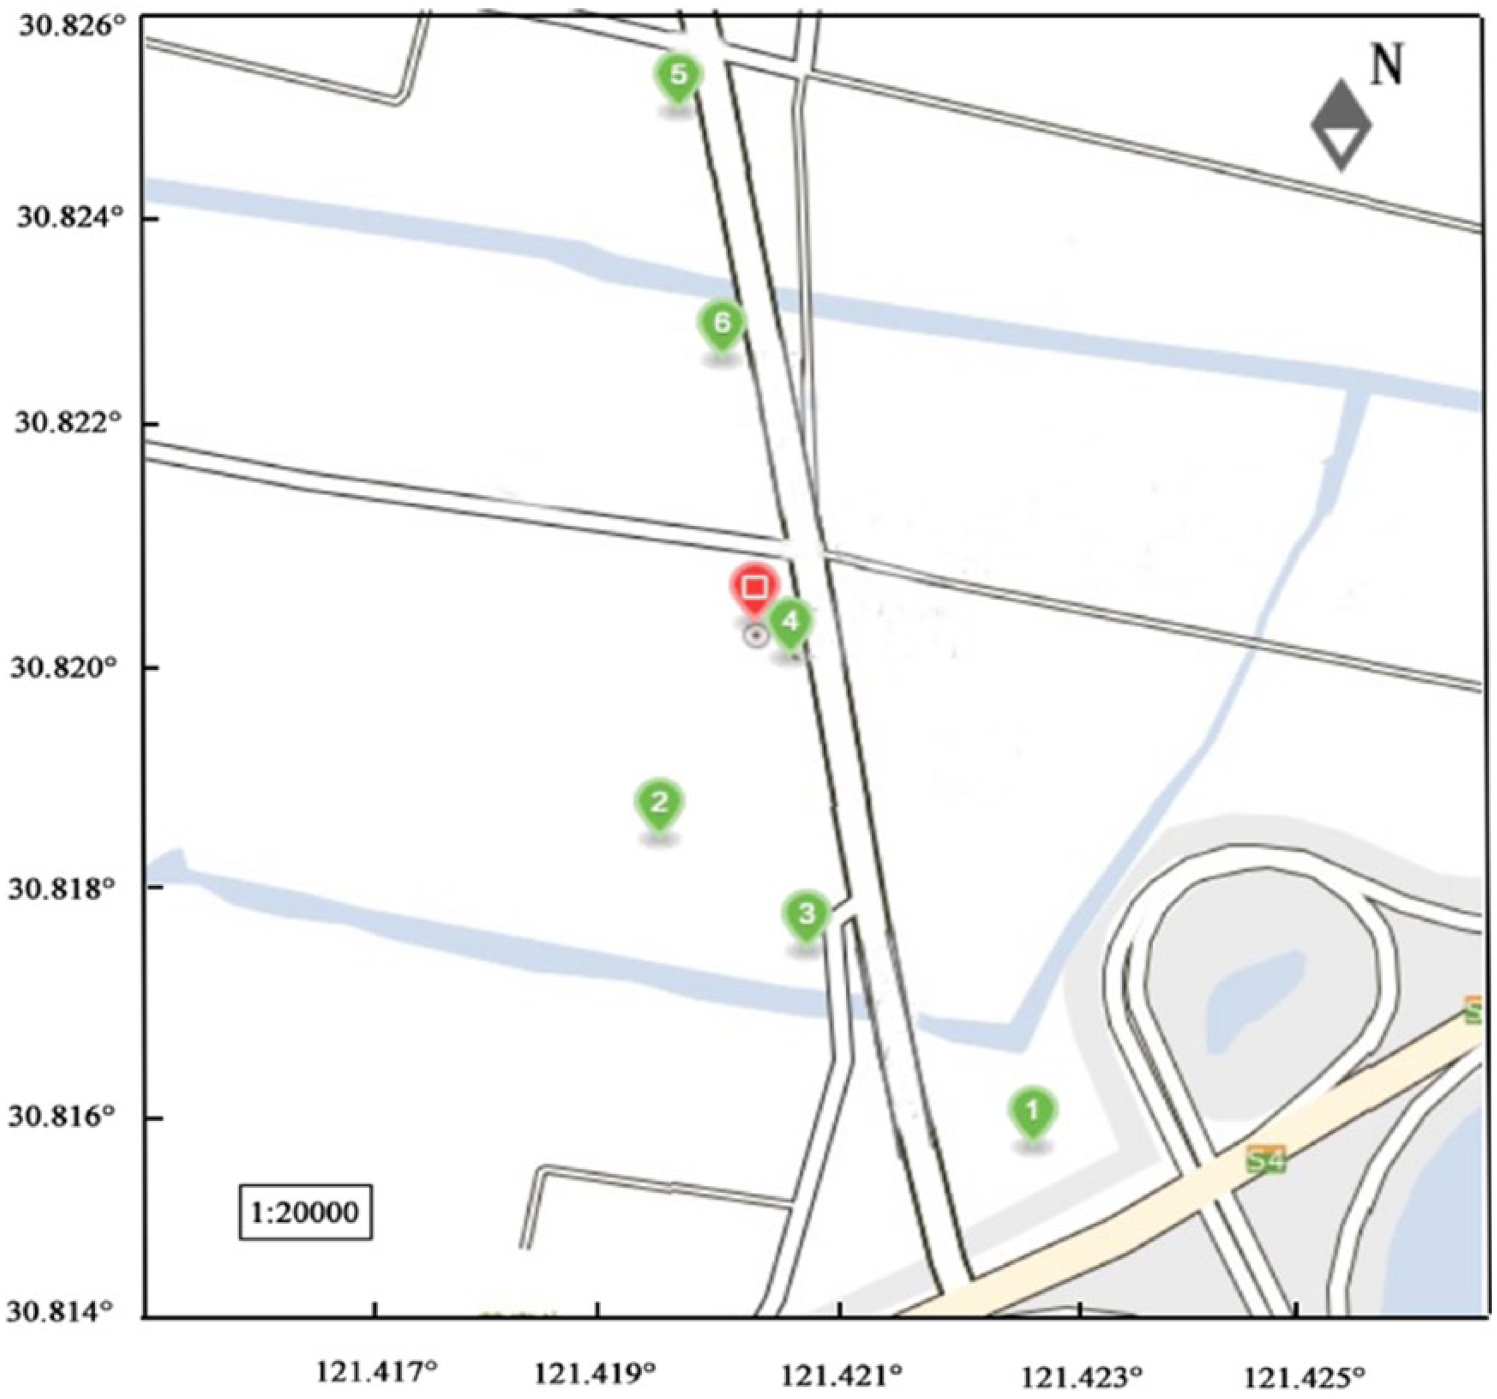
Location of the WEEE processing area and the sampling sites.
Methods
Samples were dissolved by aqua regia (HNO3:HCl = 1:3, v/v), and the mixture was kept for 4 h in a 90 °C water bath. As silicate compounds in soil cannot be digested completely by this method, soil samples must be ground into small particle, to a size less than 1 mm. Basically, aqua regia can dissolve heavy metals in soil, and the proportion of undissolved elements is relatively low. The metallic elements in samples were analysed by the inductively coupled plasma atomic emission spectrometer (ICP–AES, Thermo, A-6300). The recovery rates of metals in reference samples are shown in Table 1. Four evaluation methods were adopted, including a single factor index method, geo-accumulation index method, comprehensive pollution index method, and potential ecological risk index method. All data were calculated using Excel®. The graphs were drawn using Origin 8.5.
Recovery rates of metals in this experiment.
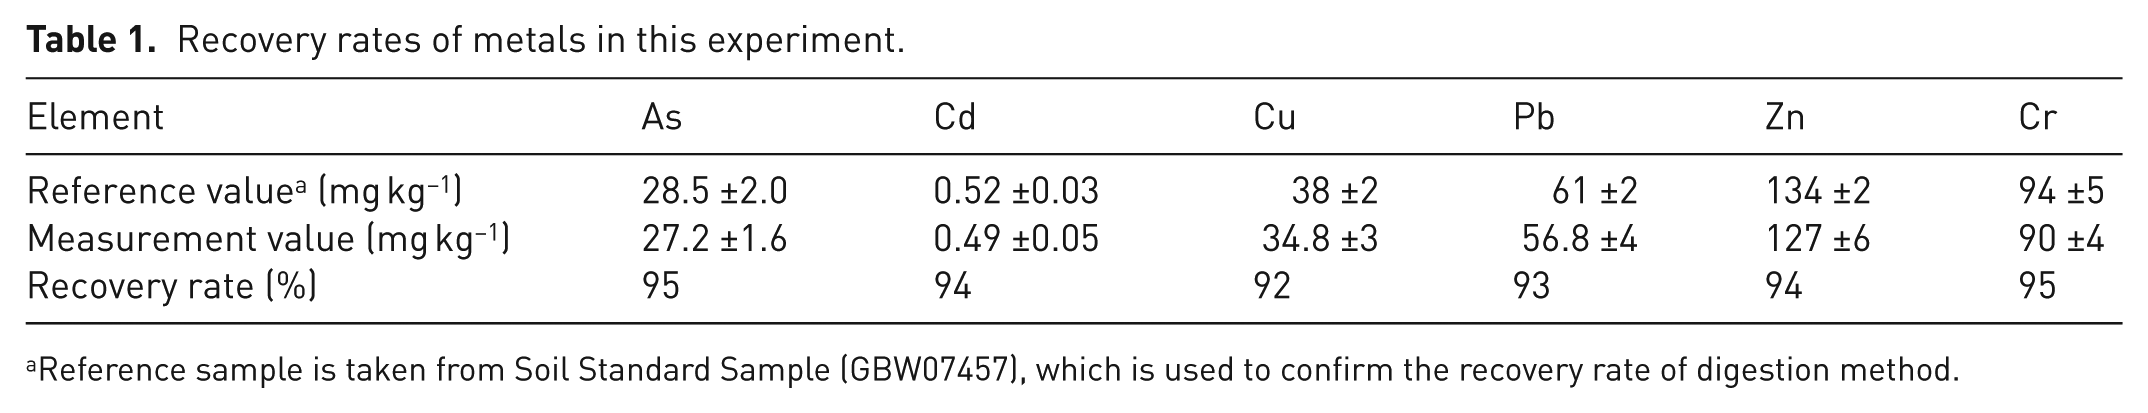
Reference sample is taken from Soil Standard Sample (GBW07457), which is used to confirm the recovery rate of digestion method.
Single factor index method
The calculation formula of single factor index method is listed as:

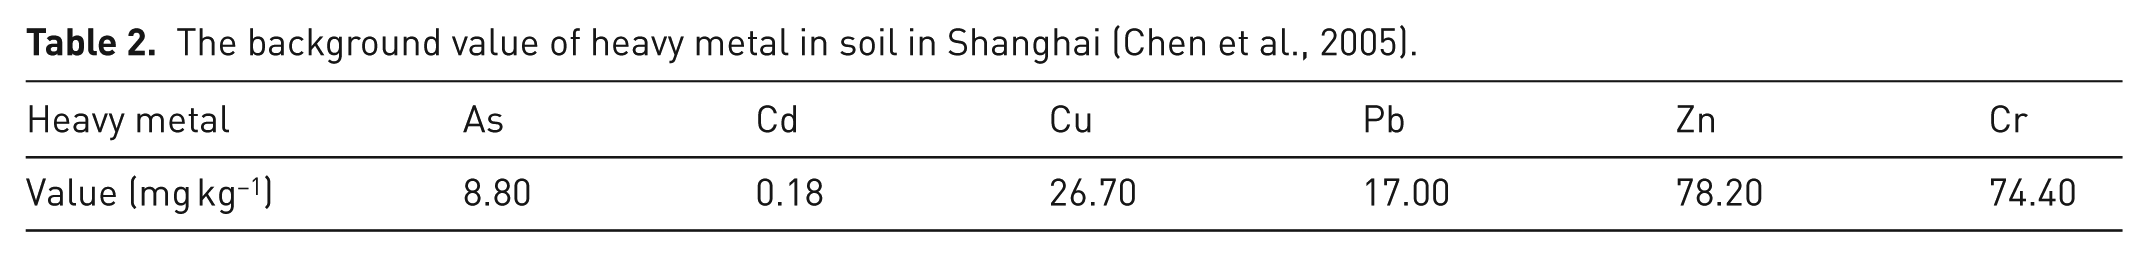
where Pi represents the environmental quality index, Ci represents the measured value of heavy metal in the investigative site, and Si represents the background value of heavy metal in soil in Shanghai (see Table 2).
The background value of heavy metal in soil in Shanghai (Chen et al., 2005).
Geo-accumulation index method
The geo-accumulation index method is used to evaluate the heavy metal pollution in soil, the calculation formula is listed as:
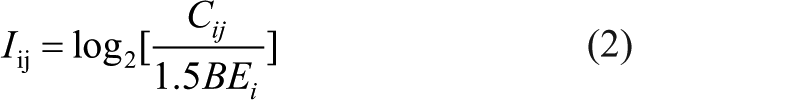
where
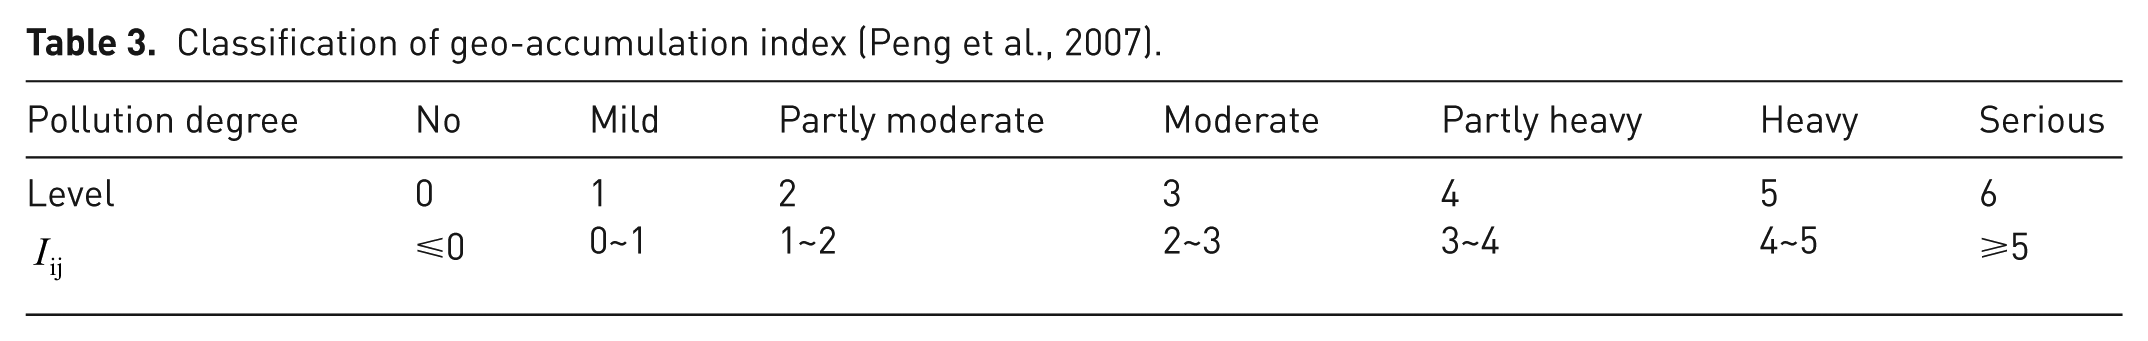
Classification of geo-accumulation index (Peng et al., 2007).
Comprehensive index method
The calculation formula is listed as:
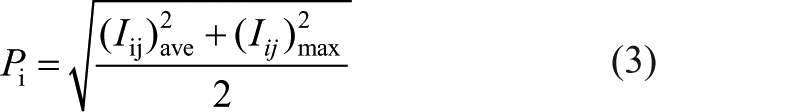
where
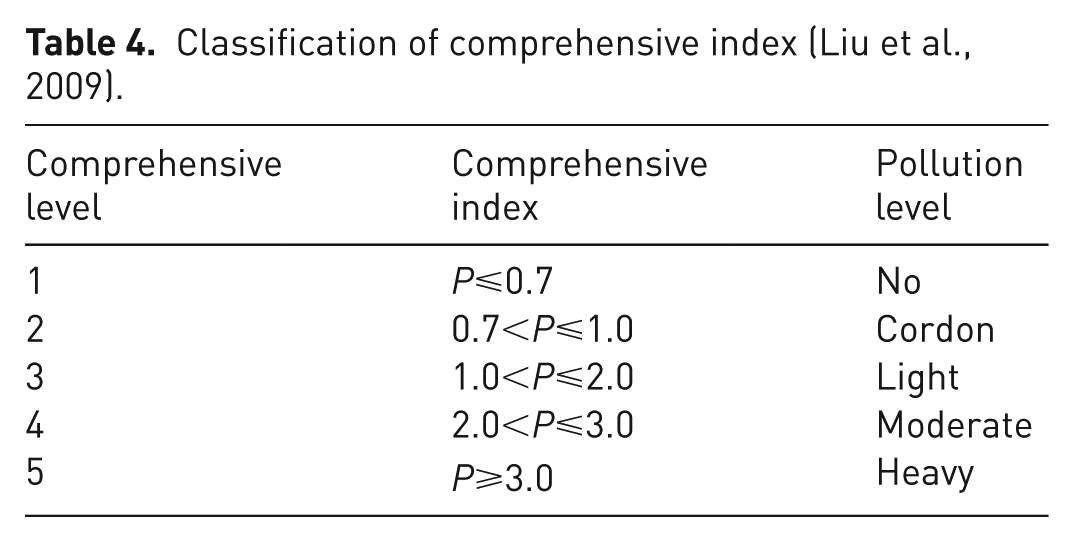
Classification of comprehensive index (Liu et al., 2009).
Potential ecological risk index method
Excessive heavy metals will endanger the surrounding environment. The potential ecological risk index method is used to evaluate the ecological risk produced by heavy metals (Faber and Van, 2012). The calculation formula is listed as:
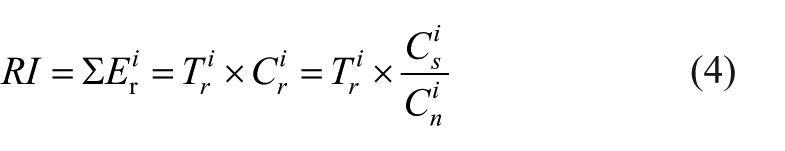
where
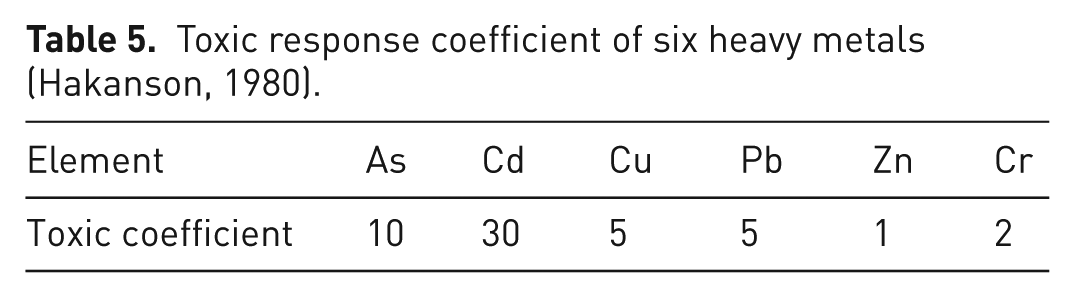
Toxic response coefficient of six heavy metals (Hakanson, 1980).
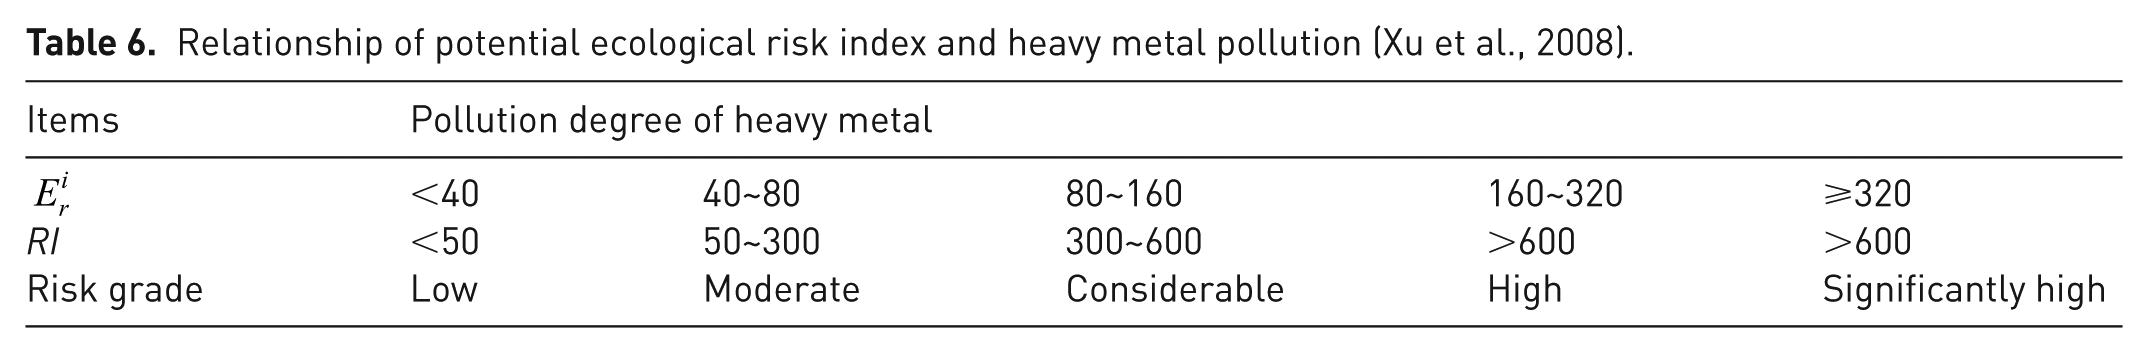
Relationship of potential ecological risk index and heavy metal pollution (Xu et al., 2008).
Experimental procedure
Testing of soil moisture content
According to the requirement of the National Standard, the testing procedures of the soil moisture are presented as follows (Bao, 2000). Soil samples of 10 g were taken and crushed into 1 mm, then placed in a small aluminium box. The samples were put into the 105 ℃ oven to dry to a constant weight, then removed out of the oven to cool to room temperature, and weighted accurately to 0.001 g. Three parallel tests revealed a soil moisture of 83.1%.
Concentration analysis of metals in soil
The concentrations of heavy metals (cadmium, copper, lead, zinc, and chromium) and metalloid (arsenic) were detected by using ICP-AES. One gram of soil sample (100 mesh) was taken, and 10 ml of aqua regia was added into each sample, then the mixture was reacted in a 90 ℃ water bath for 4 h, test runs were executed for each sample. The soils that were collected during different seasons at the WEEE processing area were analysed by this method. Four evaluation methods were adopted to analyse the potential harm to human health.
Results and discussion
Variation tendency of heavy metals
From Figure 2 to 6, it can be concluded that the concentrations of arsenic, cadmium, copper, lead, zinc in every sampling location increased over time. Overall, the concentrations of heavy metals were relatively higher in summer than other seasons, potentially caused by changing temperature and wind. Usually, summer has a higher temperature and less wind than other seasons at this WEEE dismantling area. The pollution of sampling location 4 was higher than that at other sampling locations, and it was 100 m away from the WEEE processing factory gate. The concentrations of cadmium and copper increased clearly over time. The maximum values of arsenic, cadmium, copper, lead, and zinc were 98.60, 5.25, 77.34, 153.04, and 117.85 mg kg−1, respectively; they differed by a factor of 3.94, 8.75, 0.77, 0.44, and 0.39 from the dataset by the CEQSS. The minimum values of arsenic, cadmium, copper, lead, and zinc were 71.20, 1.40, 43.21, 111.10, and 80.85 mg kg−1, according to factors of 2.85, 2.33, 0.43, 0.32, and 0.27 with respect to the CEQSS. The results showed serious pollution of arsenic and cadmium.
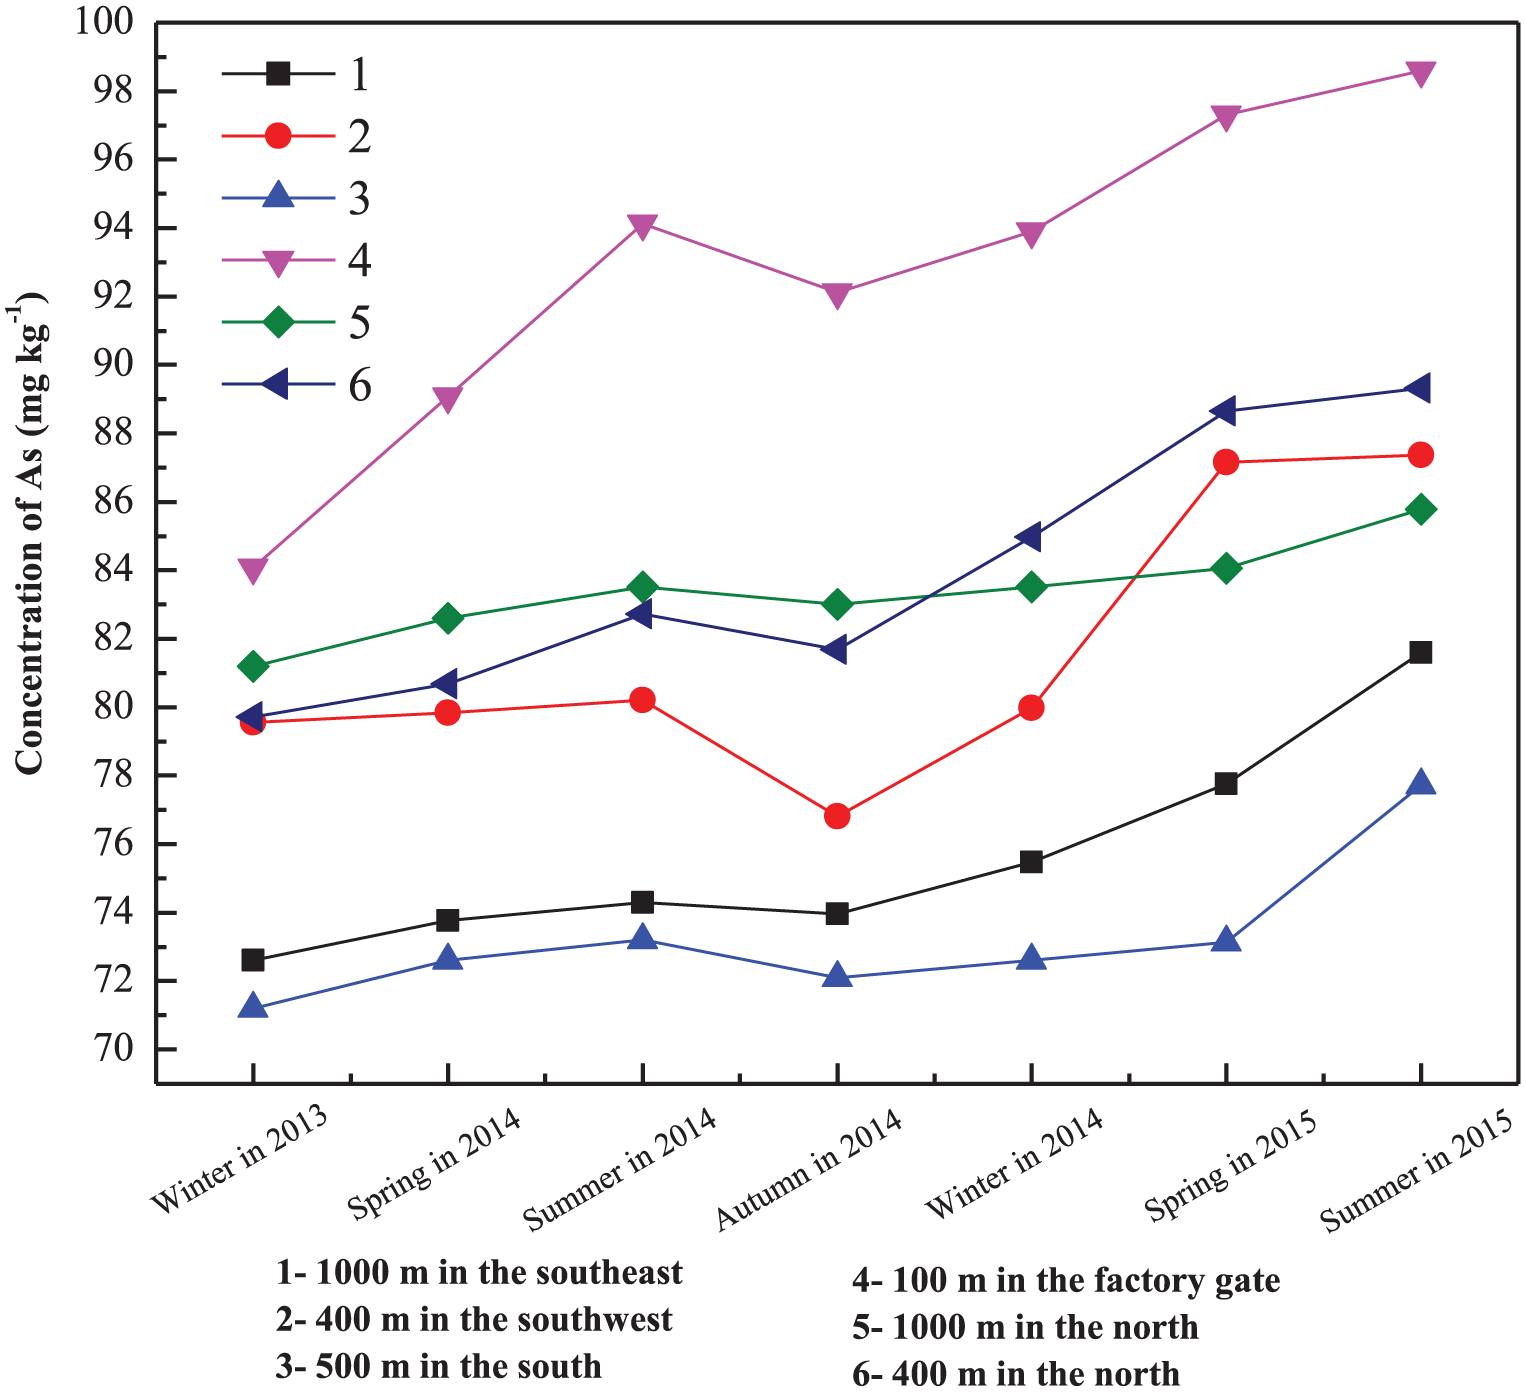
Variation of arsenic concentration over time.
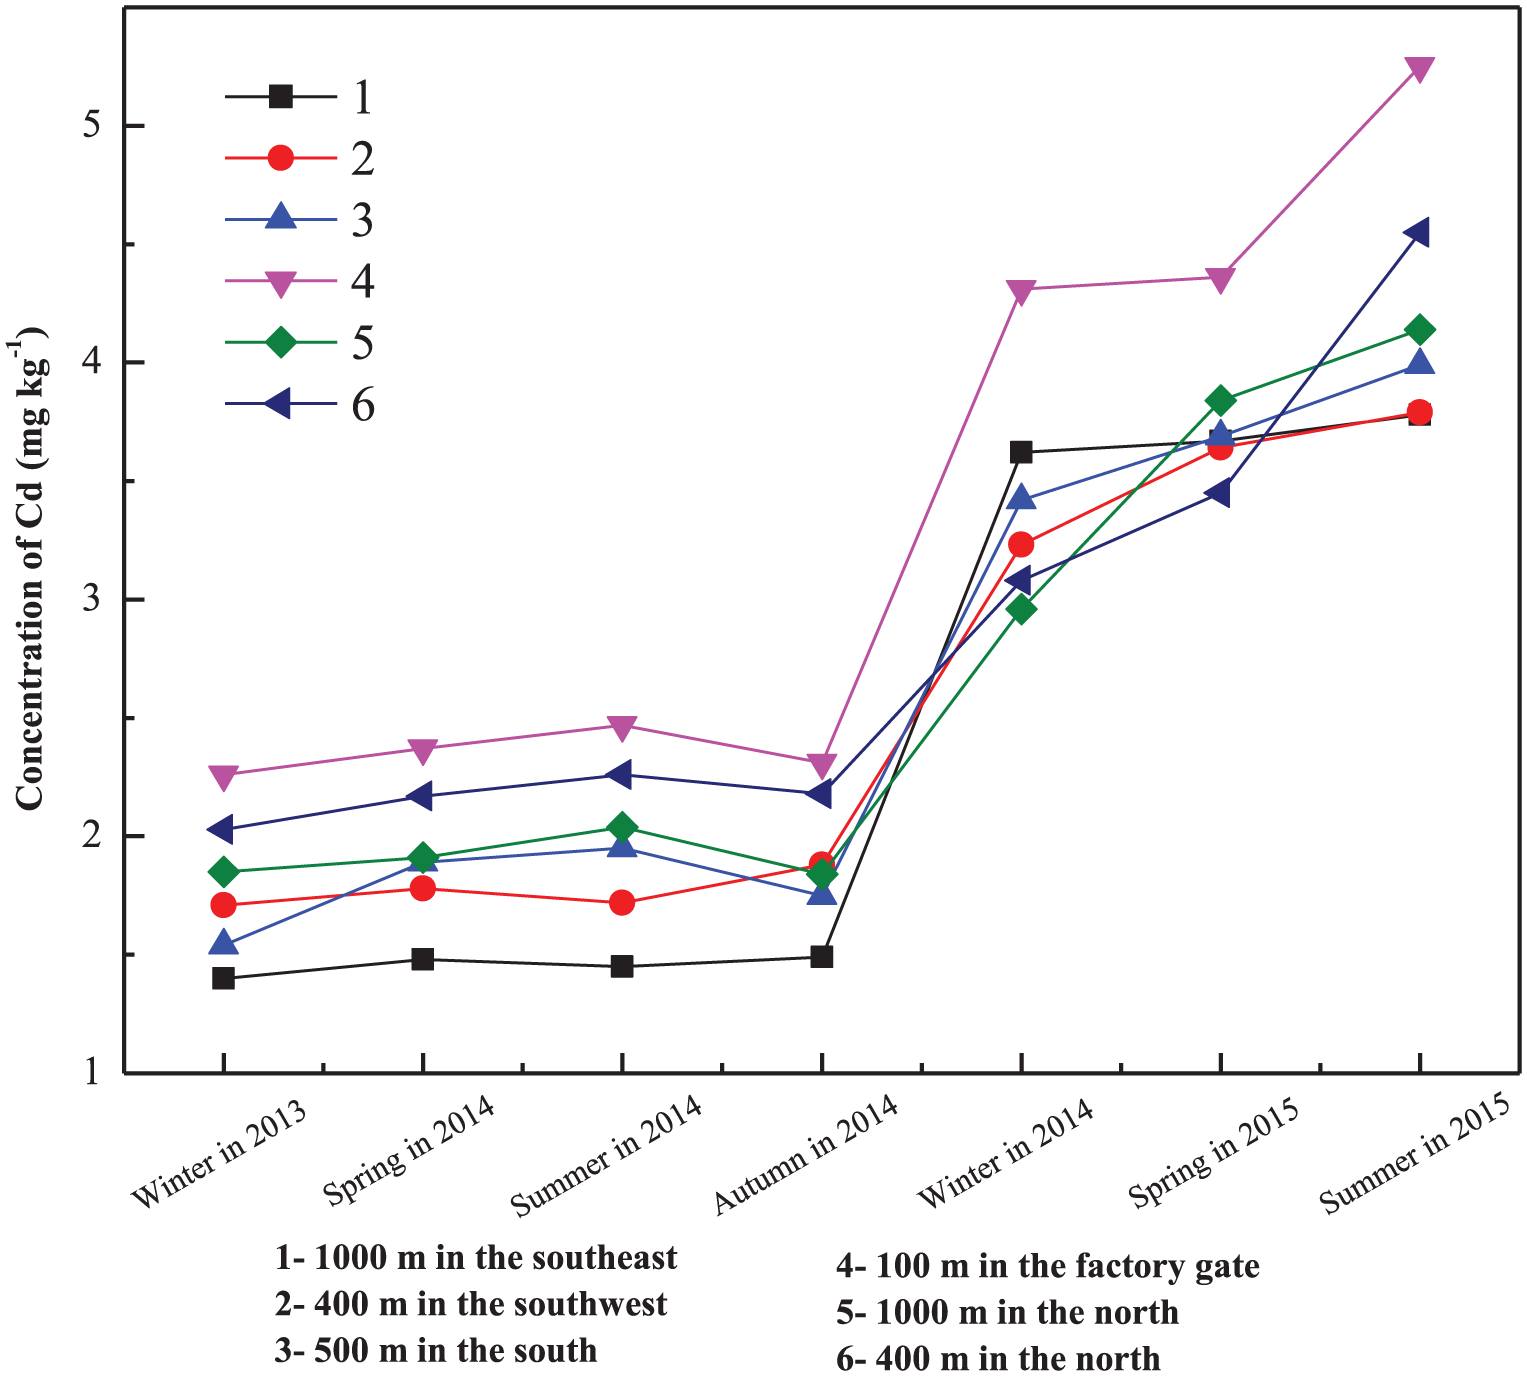
Variation of cadmium concentration over time.
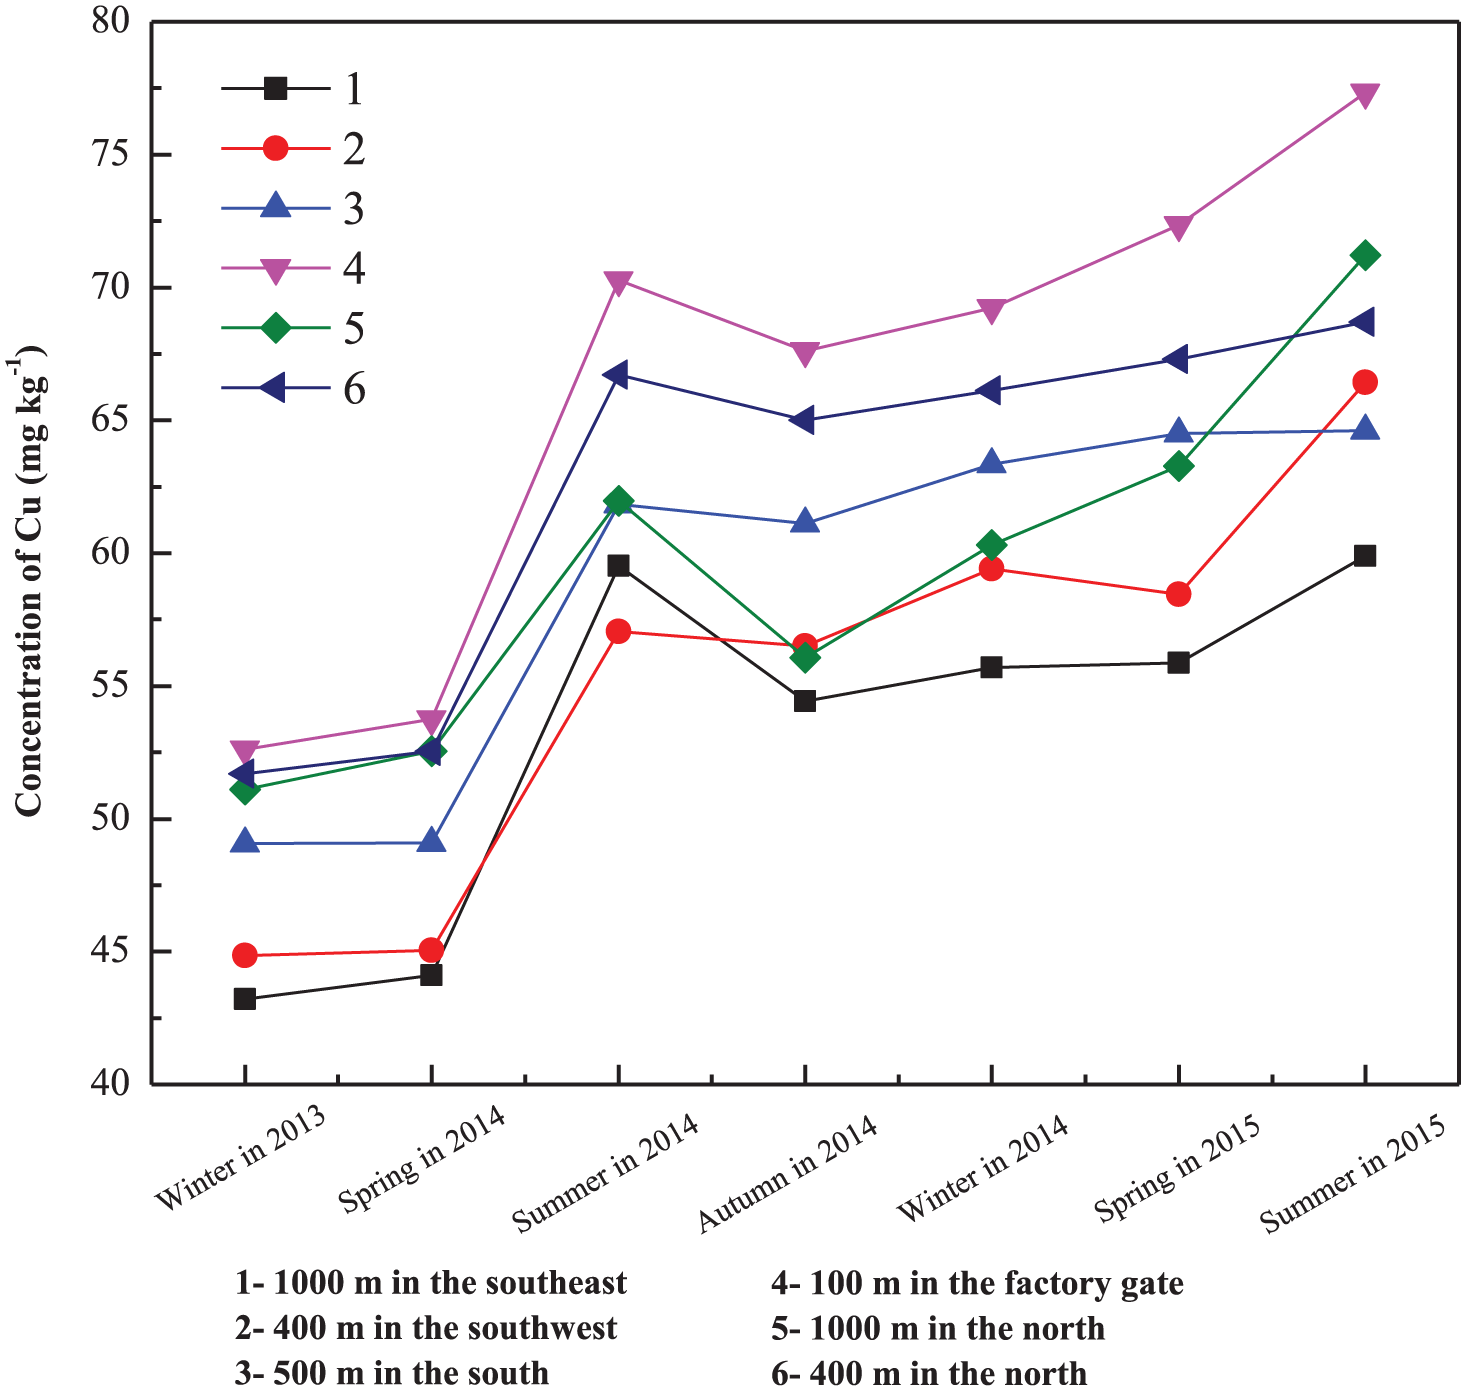
Variation of copper concentration over time.
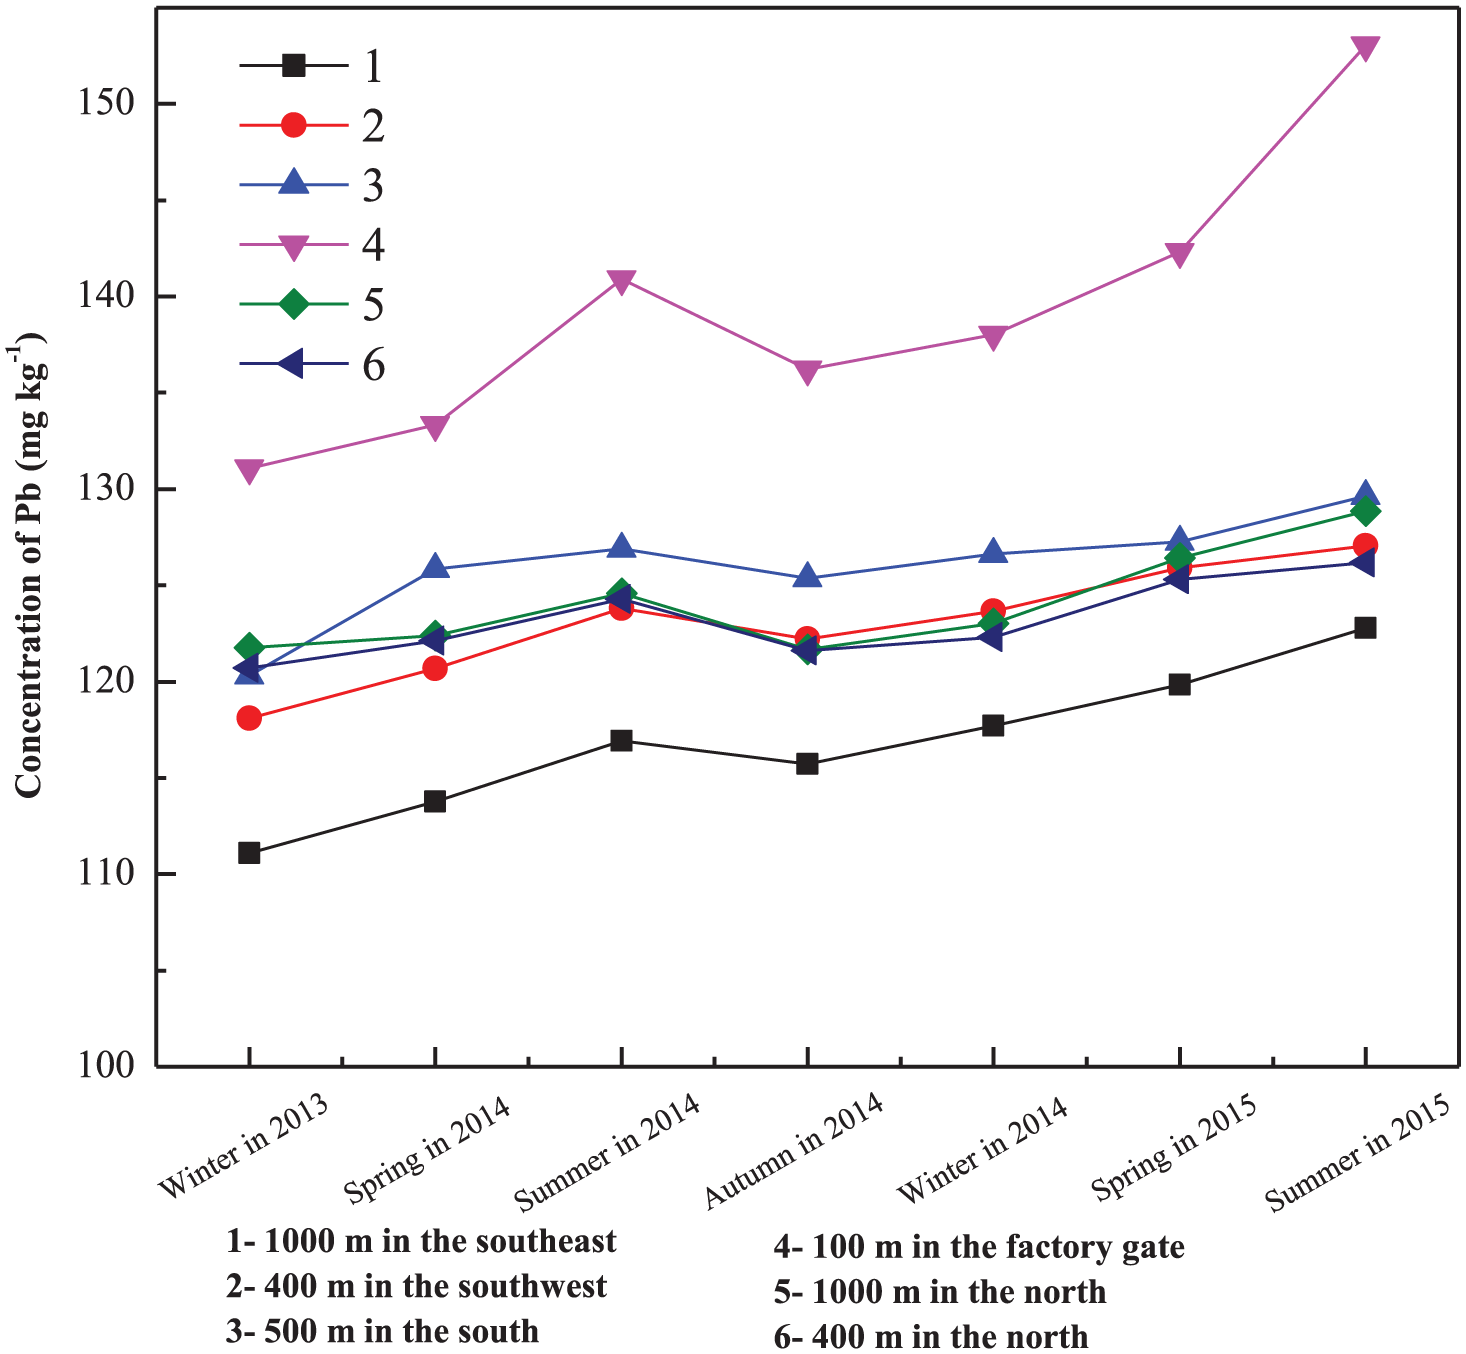
Variation of lead concentration over time.
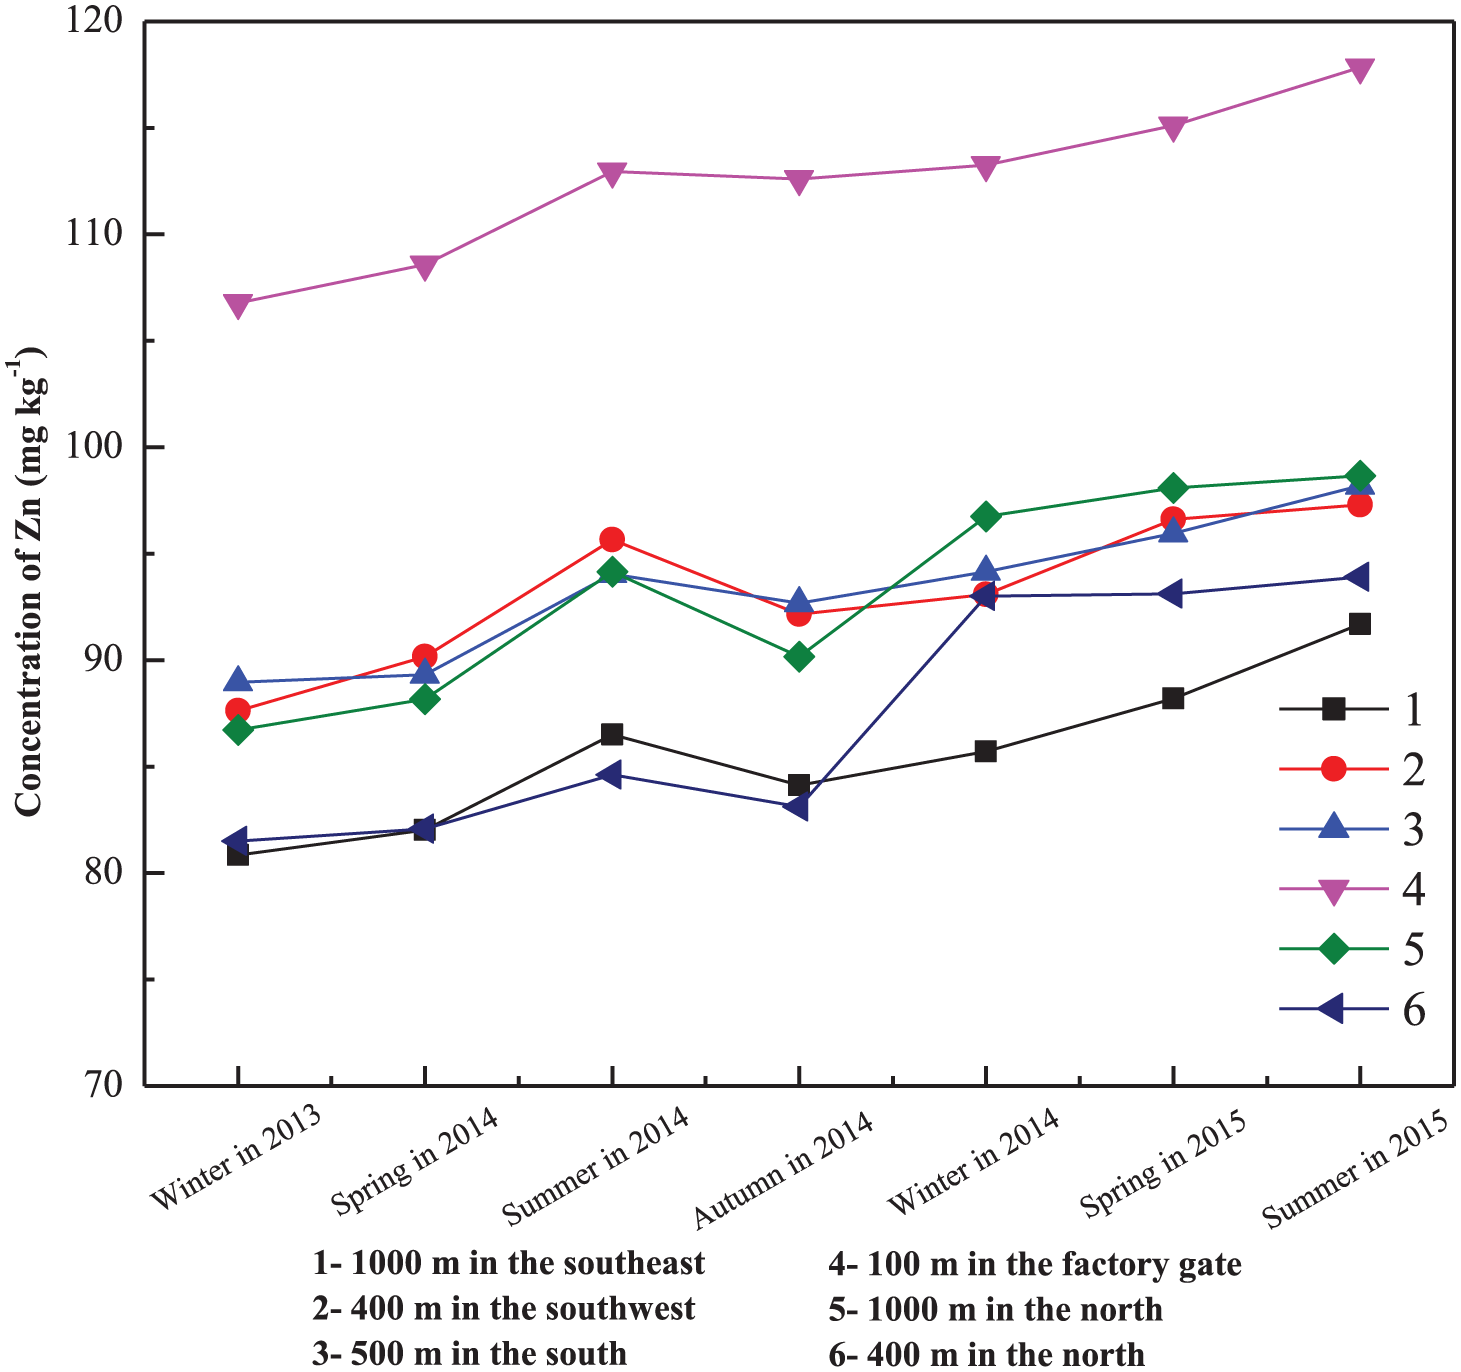
Variation of zinc concentration over time.
Concentration of heavy metals
The statistical results of heavy metal concentrations are shown in Table 7. The average concentrations of arsenic, cadmium, copper, lead, zinc, and chromium were 73.31, 1.71, 46.35, 48.43, 63.33, and 76.74 mg kg−1 in 2014, while the values of them were 58.13, 3.39, 28.38, 50.31, 127.89, and 138.53 mg kg−1 in the first half of 2015. Comparing the results, the concentrations of arsenic and copper were decreased by 15.18 and 17.97 mg kg−1, respectively, and the concentrations of cadmium, zinc, and chromium were increased by 1.68, 1.68, and 64.56 mg kg−1. However, the concentration of lead remained unchanged. Compared with the data of CEQSS, the values of arsenic and cadmium in 2014 exceeded 2.93 and 2.85 times, respectively. While in the first half of 2015, they were 2.33 and 5.65 times higher than that of CEQSS, respectively. The concentrations of copper, lead, zinc, and chromium were between 0.14 and 0.55 times of the CEQSS. Variation coefficient reflects the variation degree of a sample statistic. Variation coefficients of cadmium and zinc were larger than other heavy metals, and they reached 0.60 and 0.78, respectively. Results showed that the concentrations of cadmium and zinc in the soil might be greatly influenced by the external environment, and the main possible source might come from WEEE.
Statistic parameters of heavy metals in soil.
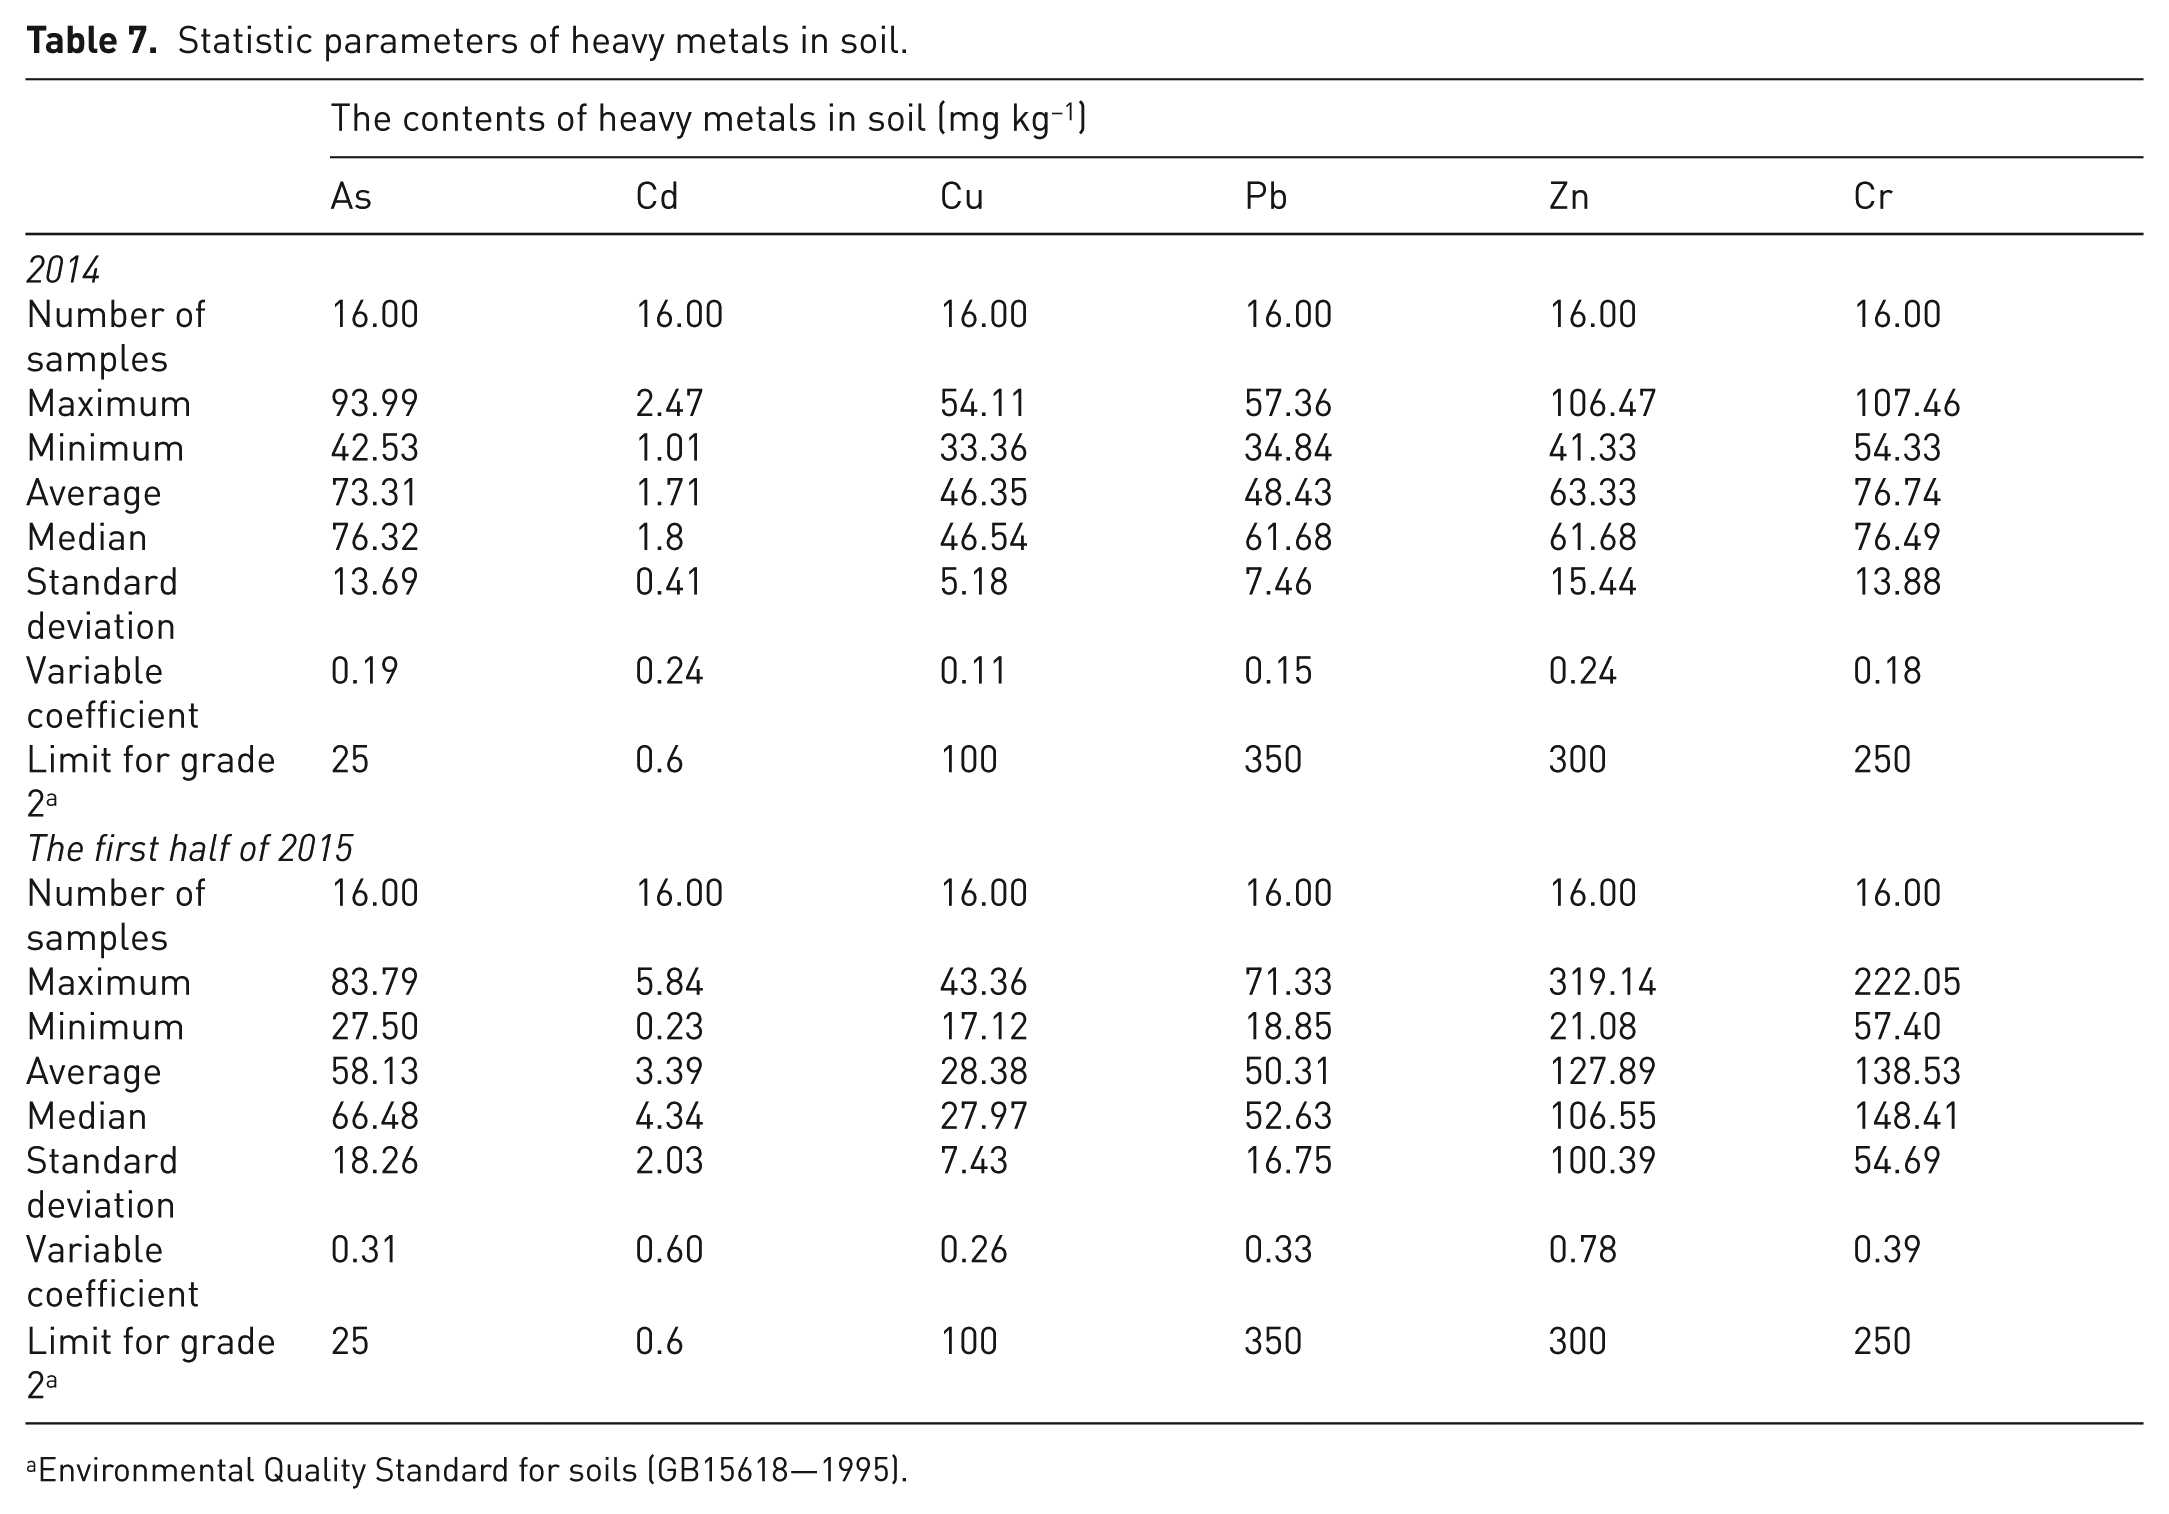
Environmental Quality Standard for soils (GB15618—1995).
Evaluation of heavy metals in soil
The results of the single and comprehensive factor pollution indexes are shown in Figures 7 and 8. The sequence of the average value of single factor pollution index was cadmium (9.50) > arsenic (8.33) > lead (2.85) > copper (1.74) > chromium (1.03) > zinc (0.81) in 2014, while in the first half of 2015, it was cadmium (18.82) > arsenic (9.50) > lead (1.06) > chromium (1.64) > zinc (1.86) > copper (2.96). Comparing the average single factor pollution indexes in 2014 and first half of 2015, the indexes of arsenic and cadmium reached the level of heavy pollution, lead reached moderate pollution, copper, zinc, and chromium were light pollution. The comprehensive factor pollution index in 2014 ranged from 0.34 to 2.92 with an average value of 1.34, while it ranged from 0.39 to 0.34 in the first half of 2015, and actually the average value was 1.61. The results of single and comprehensive factor pollution indexes revealed that the soil in different directions of the WEEE processing area suffered from inorganic pollution, which includes heavy metals (cadmium, copper, lead, zinc, and chromium) and metalloid (arsenic). Especially, the pollution degrees of arsenic and cadmium were relatively serious.
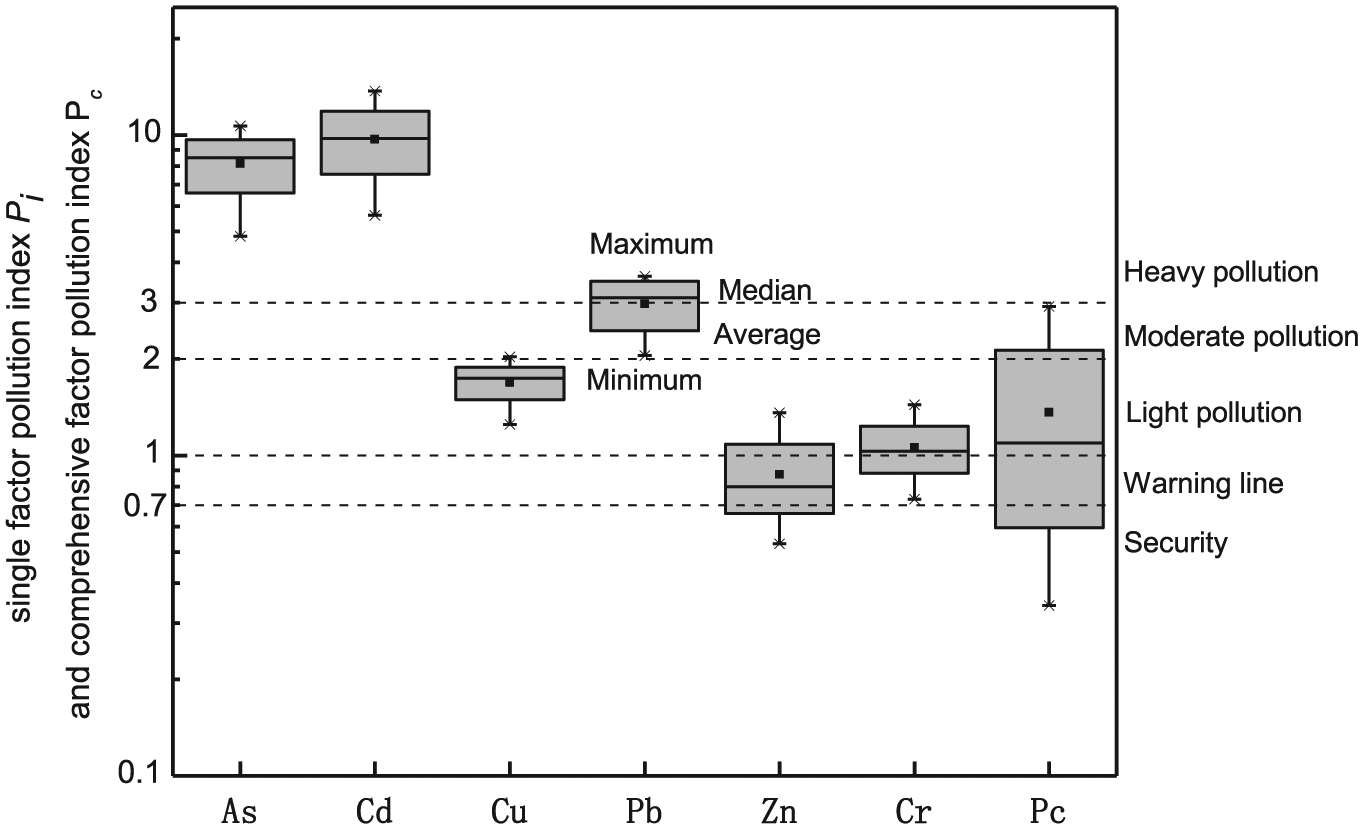
Evaluation of heavy metals in soil in 2014.
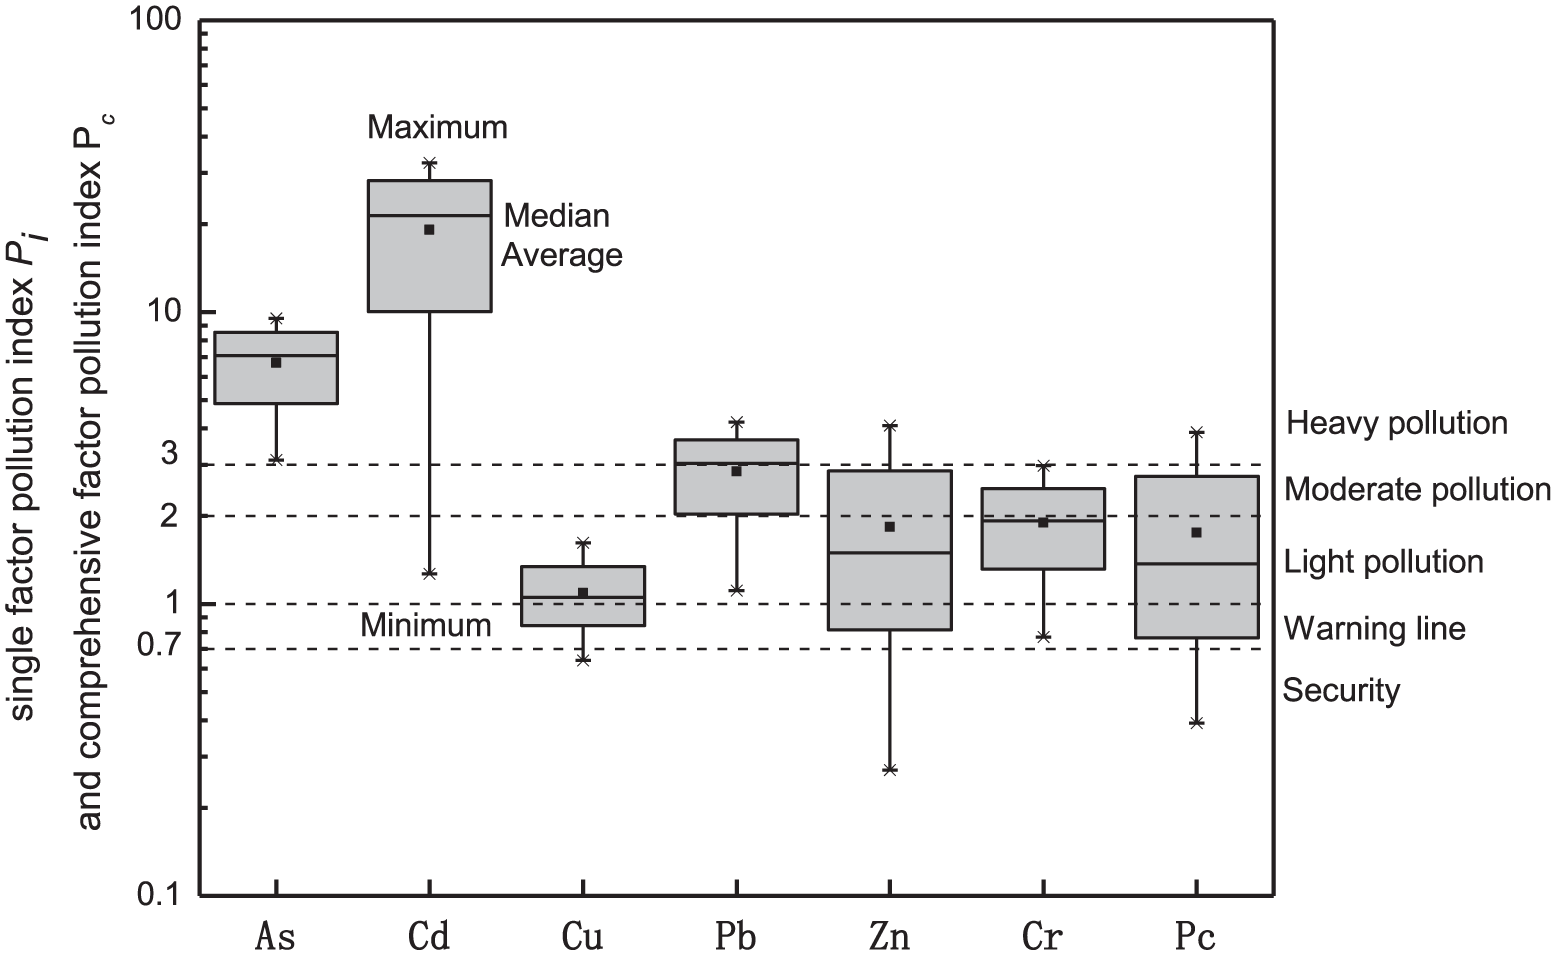
Evaluation of heavy metals in soil in the first half of 2015.
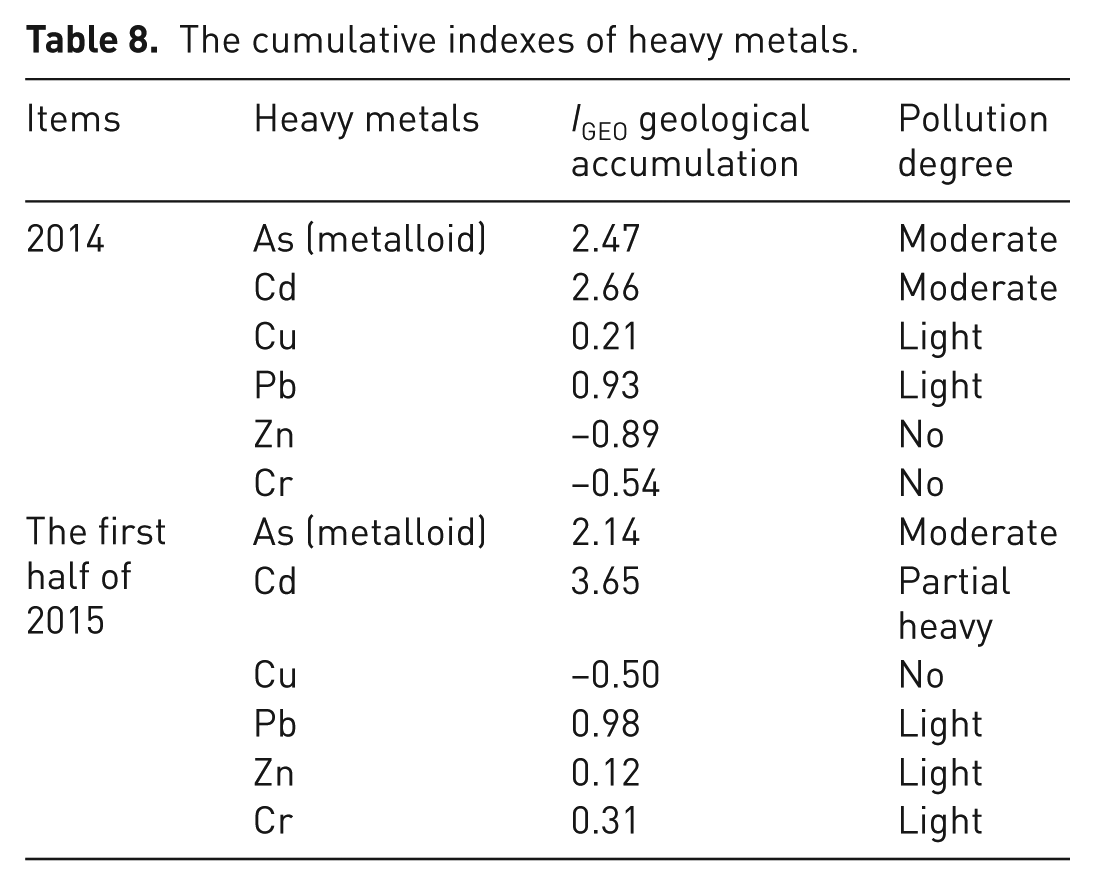
The cumulative indexes of heavy metals in soil are shown in Table 8. The accumulation indexes of arsenic and cadmium were 2.47 and 2.66, respectively, in 2014, all of them belonged to moderate pollution level. The accumulation indexes of arsenic and cadmium were 2.14 and 3.65, respectively, in the first half of 2015, and the pollution of arsenic reached at a moderate degree, while cadmium pollution was a heavy degree. In general, the pollution degree of arsenic and cadmium was relatively heavy.
The cumulative indexes of heavy metals.
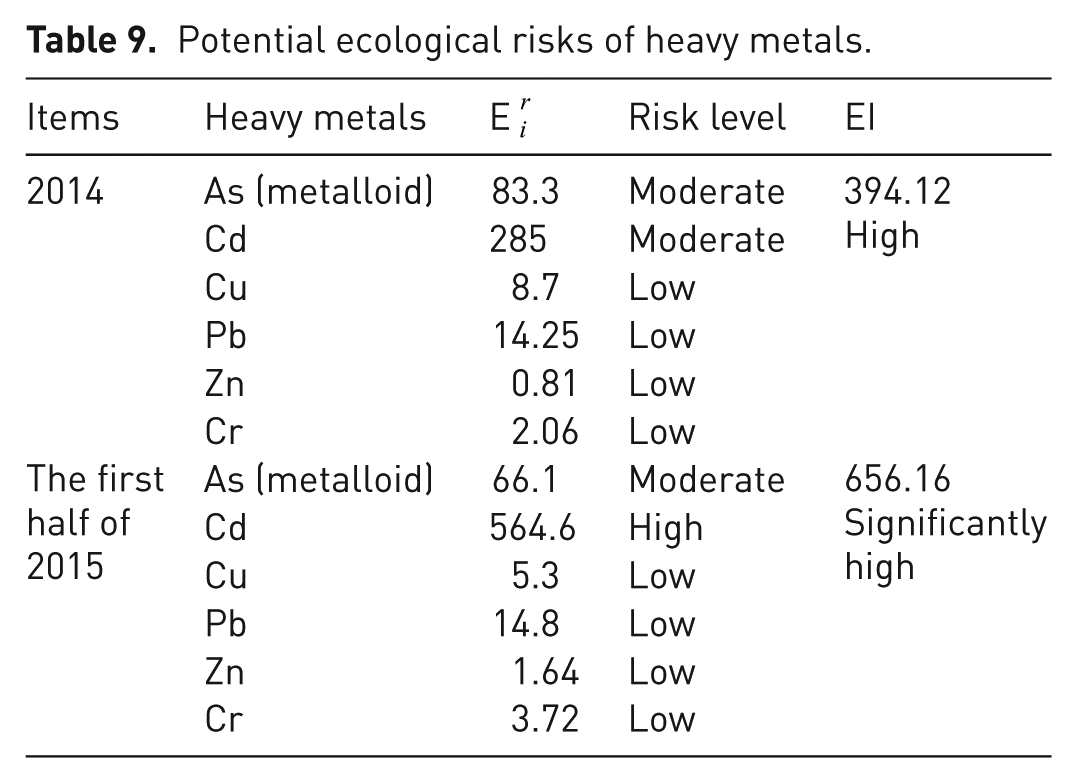
The results of potential ecological risk analysis (Table 9) revealed that the total ecological risk index of heavy metals was 394.12 in 2014, and 656.16 in the first half of 2015; these meant the level of metal pollution was definitely increased. The ecological risk index of cadmium increased from 285 to 564.6, and it increased from moderate potential ecological risk to high potential ecological risk. Other ecological risk indexes of heavy metals had different variations, but the degrees of risk basically remained unchanged. In general, ecological risk indexes of arsenic and cadmium were relatively high, but the ecological risk indexes of copper, lead, zinc, and chromium were low, and it had mild ecological damage to the soil environment. The contribution rates of arsenic and cadmium were 21.14% and 72.31% in 2014, while these were 10.07% and 86.05% in the first half of 2015.
Potential ecological risks of heavy metals.
Conclusion
The results revealed that the soil at the WEEE processing area suffered from the contamination of arsenic, copper, cadmium, lead, chromium, and zinc. The variation tendency of heavy metals in this area was increased over time. The average value of the metalloid (arsenic) was 73.31 mg kg−1 in 2014 and 58.31 mg kg−1 in the first half of 2015, and it was 2.93 times and 2.33 times higher than that of the CEQSS accordingly. The integrated ecological risk indexes of heavy metals (cadmium, copper, lead, zinc, and chromium) and metalloid (arsenic) were 394.10 in 2014 and 656.16 in the first half of 2015, thus it had a strong ecological risk. Therefore, it is necessary to take steps to control the pollution that derives from the dismantling and transporting operations in WEEE plants.
Footnotes
Declaration of conflicting interests
The authors declared no potential conflicts of interest with respect to the research, authorship, and/or publication of this article.
Funding
The authors disclosed receipt of the following financial support for the research, authorship, and/or publication of this article: The authors gratefully acknowledge the financial supported by National Natural Science Foundation of China [21307080], Knowledge Service Platform Project in Shanghai [ZF1224], and the key subject of Shanghai Polytechnic University [XXKZD1602].