
Abstract
Social factors have not been sufficiently explored in municipal solid waste management studies. Latin America has produced even fewer studies with this approach; technical and economic investigations have prevailed. We explored the impacts of socioeconomic factors on municipal solid waste generation in Greater Sao Paulo, which includes 39 municipalities. We investigated the relations between municipal solid waste generation and social factors by Pearson’s correlation coefficient. The Student’s t-test (at p ← 0.01) proved significance, and further regression analysis was performed with significant factors. We considered 10 socioeconomic factors: population, rural population, density, life expectancy, education (secondary, high and undergraduate level), income per capita, inequality and human development. A later multicollinearity analysis resulted in the determination of inequality (rp = 0.625) and income per capita (rp = 0.607) as major drivers. The results showed the relevance of considering social aspects in municipal solid waste management and isolated inequality as an important factor in planning. Inequality must be used as a complementary factor to income, rather than being used exclusively. Inequality may explain differences of waste generation between areas with similar incomes because of consumption patterns. Therefore, unequal realities demand unequal measures to avoid exacerbation, for example, pay-as-you-throw policies instead of uniform fees. Unequal realities also highlight the importance of tiering policies beyond the waste sector, such as sustainable consumption.
Keywords
Introduction
Ma and Hipel (2016) showed that only 0.69% of municipal solid waste management (MSWM) studies relate to social aspects. Few studies have considered policies, attitudes and behaviours, which are important aspects of waste management failures (Su et al., 2007; Van der Klundert and Anschütz, 2001). Latin America has produced the smallest number of studies concerning social aspects, almost two times less than Africa, which has produced the next smallest number.
Integrated sustainable waste management (ISWM) offers a framework that aims to integrate a diversity of factors in solid waste management. ISWM considers three dimensions: elements, aspects (social, environmental, political, economic and institutional) and stakeholders (Schübeler, 1996; Van der Klundert and Anschütz, 2001; Wilson et al., 2012, 2013).
The lens of ISWM provides an important approach for moving towards solutions involving populations and stakeholders and acknowledges socio-cultural and other MSWM aspects (Fischer et al., 2013; Van de Klundert and Anschütz, 2001; Wilson et al., 2012). MSWM problems relate to more than money and equipment; they include social and cultural relations of local society, such as man–woman relationships, education and beliefs (Coffey and Coad, 2010; Read, 1999; Van de Klundert and Anschütz, 2001).
Social aspects are evident when recycling is the focus in developing countries. Low- and middle–low-income countries have recycling rates of 85% only in the informal sector, in contrast to the formal sector in high-income countries (Gupta et al., 2015; Scheinberg et al., 2010; Wilson et al., 2012).
Brazil, a middle–high-income developing country, is at the beginning of the struggle to overcome the barriers of sanitation concerns in MSWM. A national framework law (Federal Law nº 12.305) was only developed in 2010, after 20 years of debate in the national congress. The most relevant advance in Brazil’s MSWM was biogas collection in controlled dumps and sanitary landfills (Jacobi and Besen, 2011) because recycling rates in the country do not yet exceed 3% (SNIS, 2016). Efforts have been concentrated on technical and economic aspects, except for informal-sector recycling incentives.
Despite some advances towards enhancing environmental protection, rapid urbanisation and inequality in the developing world makes the collection of MSW even more difficult (Coffey and Coad, 2010; Marshall and Farahbakhsh, 2013; Scheinberg et al., 2010); this is the case in Greater Sao Paulo and most metropolises in Latin America and Africa (UNDP, 2015). The unsuccessful implementation of pure technical engineering models to the developing world has spurred the development of the ISWM framework. However, most efforts have not recognised local cultural characteristics or social dynamics (Guerrero et al., 2013; Van der Klundert and Anschütz, 2001; Wilson et al., 2013).
A variety of social, economic and cultural aspects have been appraised in the literature of MWSM. Read (1999) noted the role of education in MSWM. Su et al. (2007) also highlighted the lack of communications in not-in-my-backyard (NIMBY) opposition to state-of-the-art incinerators in unfavourable media coverage. MSWM systems have specific dynamics and are essentially local issues. Tourism in Italy is an important driver (Mazzanti et al., 2008), as is immigration in Mexico (Buenrostro and Bocco, 2003) and the rainy season plus food availability in Africa (Getahun et al., 2012).
Municipal solid waste (MSW) generation is crucial for MSWM planning and is affected not only by deviation during time, as for the factors previous mentioned, but also by individual characteristics. MSW generation changes according to average family size (Khan et al., 2016; Ojeda-Benítez et al., 2008), energy source (Hoornweg and Bhada-Tata, 2012; Khan et al., 2016) and education (Monavari et al., 2012; Sujauddin et al., 2008). Social, cultural and economic characteristics equally affect MSW composition (Hoornweg and Bhada-tata, 2012; Sujauddin et al., 2008; Suthar and Singh, 2015; Wilson et al., 2012).
Although there are a variety of factors, studies have identified economic status as a major driver positively correlated with municipal or household solid waste generation (Afroz et al., 2011; Guerrero et al., 2013; Hockett et al., 1995; Sujauddin et al., 2008; Wilson et al., 2012). Income or sales are preferable to per capita gross domestic product (GDP) in the estimation of MSW generation because they show consumption ability more effectively (Hockett et al., 1995; Liu and Wu, 2010; Wilson et al., 2012). This trend characterises our model of consumer society and makes MSW generation rates grow faster than populations (Hoornweg and Bhada-tata 2012) because of rapid population growth and increased unsustainable consumer practices, which raises MSW generation rates. Additionally, there is no evidence of the decoupling effect between economic growth and waste generation; rather, a stability point has been estimated (Mazzanti et al., 2008), with few exceptions (Monavari et al., 2012).
Environmental protection by regulation and public awareness has led developments in MSWM in the recent history of developed countries (Wilson, 2007), and understanding local social factors is vital to implement successful regulatory systems. Successful systems involve extended producer responsibility (EPR), landfill and incineration taxes and the pay-as-you-throw (PAYT) policy (Demajorovic, 1995; Fischer et al., 2013; Olofsson et al., 2005; Singh et al., 2014).
In Brazil, most work has focused on the role of community-based organisations for recycling. Few studies have focused on the socioeconomic and cultural aspects of MSW generation (Dias et al., 2012; Medeiros et al., 2015; Melo et al., 2009). MSWM advances demand studies to promote public policies in developing countries (Wilson et al., 2013) because there are no ‘quick fixes’ (Wilson, 2007: 205).
In this study, we investigated the impact of socioeconomic factors in MSW generation and their consequences for waste planning. Our results may help not only Greater Sao Paulo but also other developing metropolises and developed countries to consider the social dimensions in their MSWM strategies.
Materials and methods
Study area
Greater Sao Paulo, or Sao Paulo’s Metropolitan Region, is the largest Brazilian metropolitan area legally institutionalised by national law (Complementary Federal Law nº 24/1973). Greater Sao Paulo is inside Sao Paulo State (see Figure 1). The region includes 39 municipalities with a variety of socioeconomic statuses, including the capital, Sao Paulo. The area has 20.4 million habitants, approximately 10% of the total national population and 20% of Brazil’s GDP in barely 0.1% of the national land. The capital alone has 11.9 million habitants (IBGE, 2015a, 2015b).
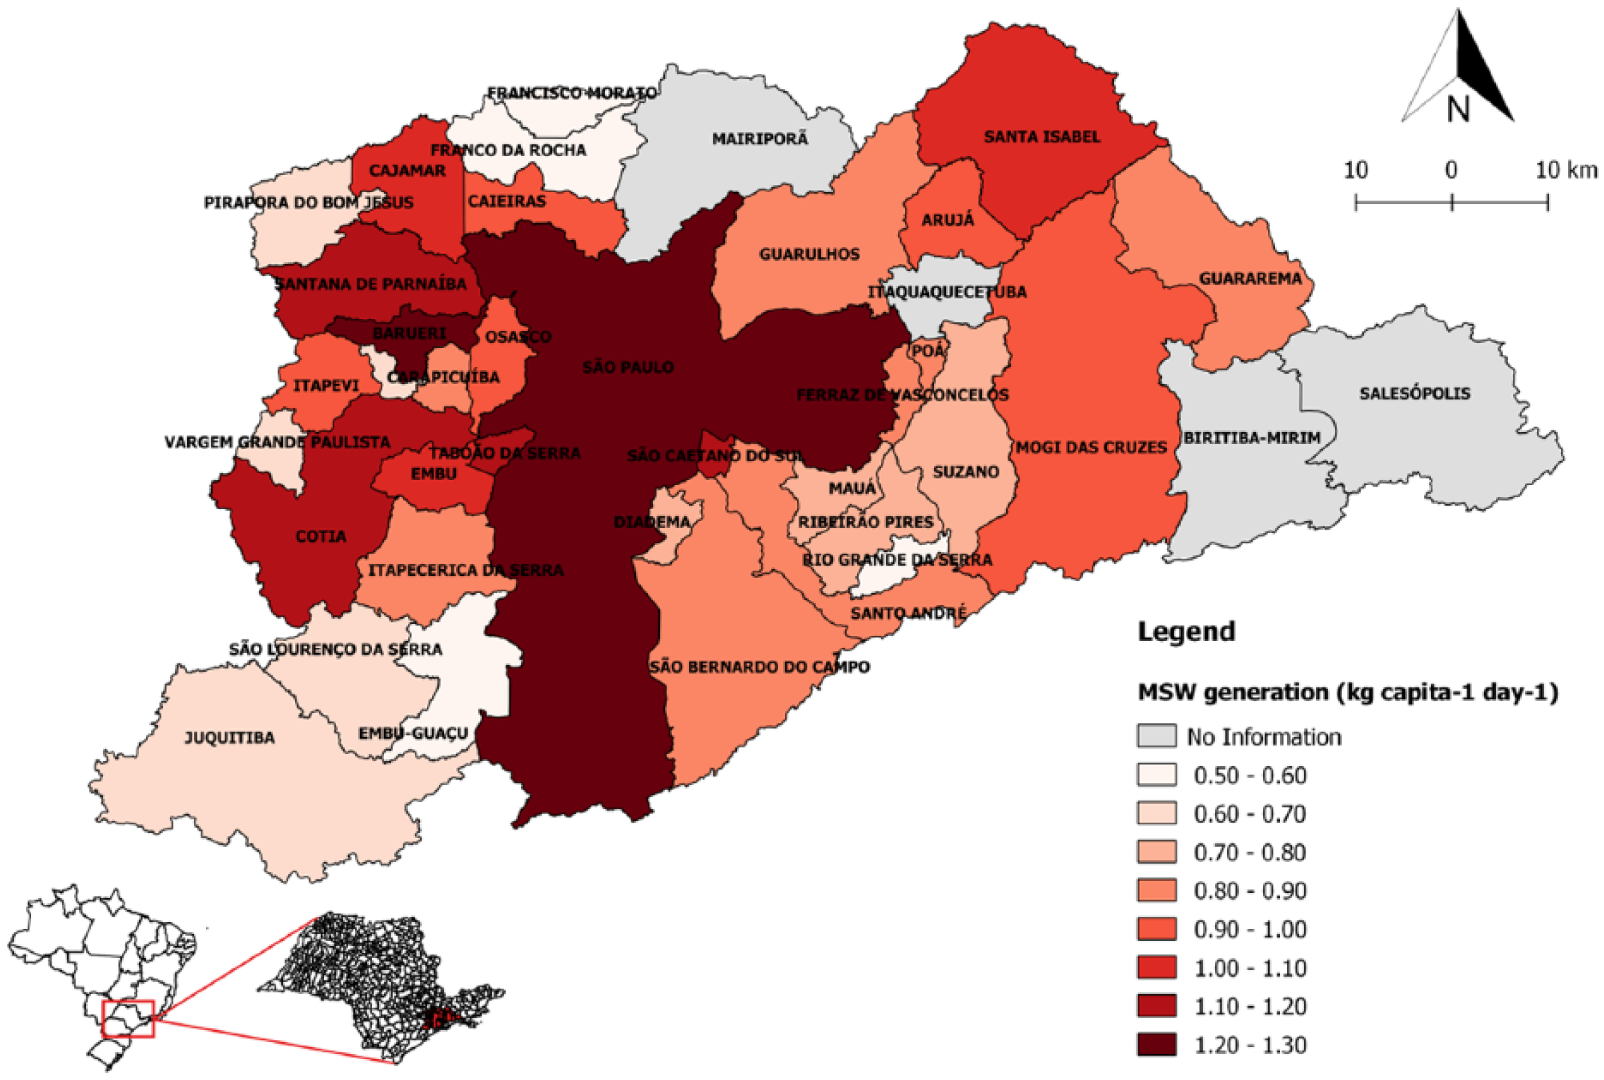
SPMR location, municipalities and respective MSW per capita generation rates.
Data collection
We collected socioeconomic data in the Atlas of Human Development in Brazil, which includes data from municipalities based on the National Census of 2010 (UNDP et al., 2013). MSW generation data were collected from Brazil’s National System of Information about Sanitation (SNIS, 2016).
We considered 10 variables for correlation with MSW per capita generation. We considered different socioeconomic dimensions, such as education, health, demography, economy and inequality (Table 1), to evaluate the widest range of variables.
Factors considered for analysis, description and distribution range at the municipal scale.
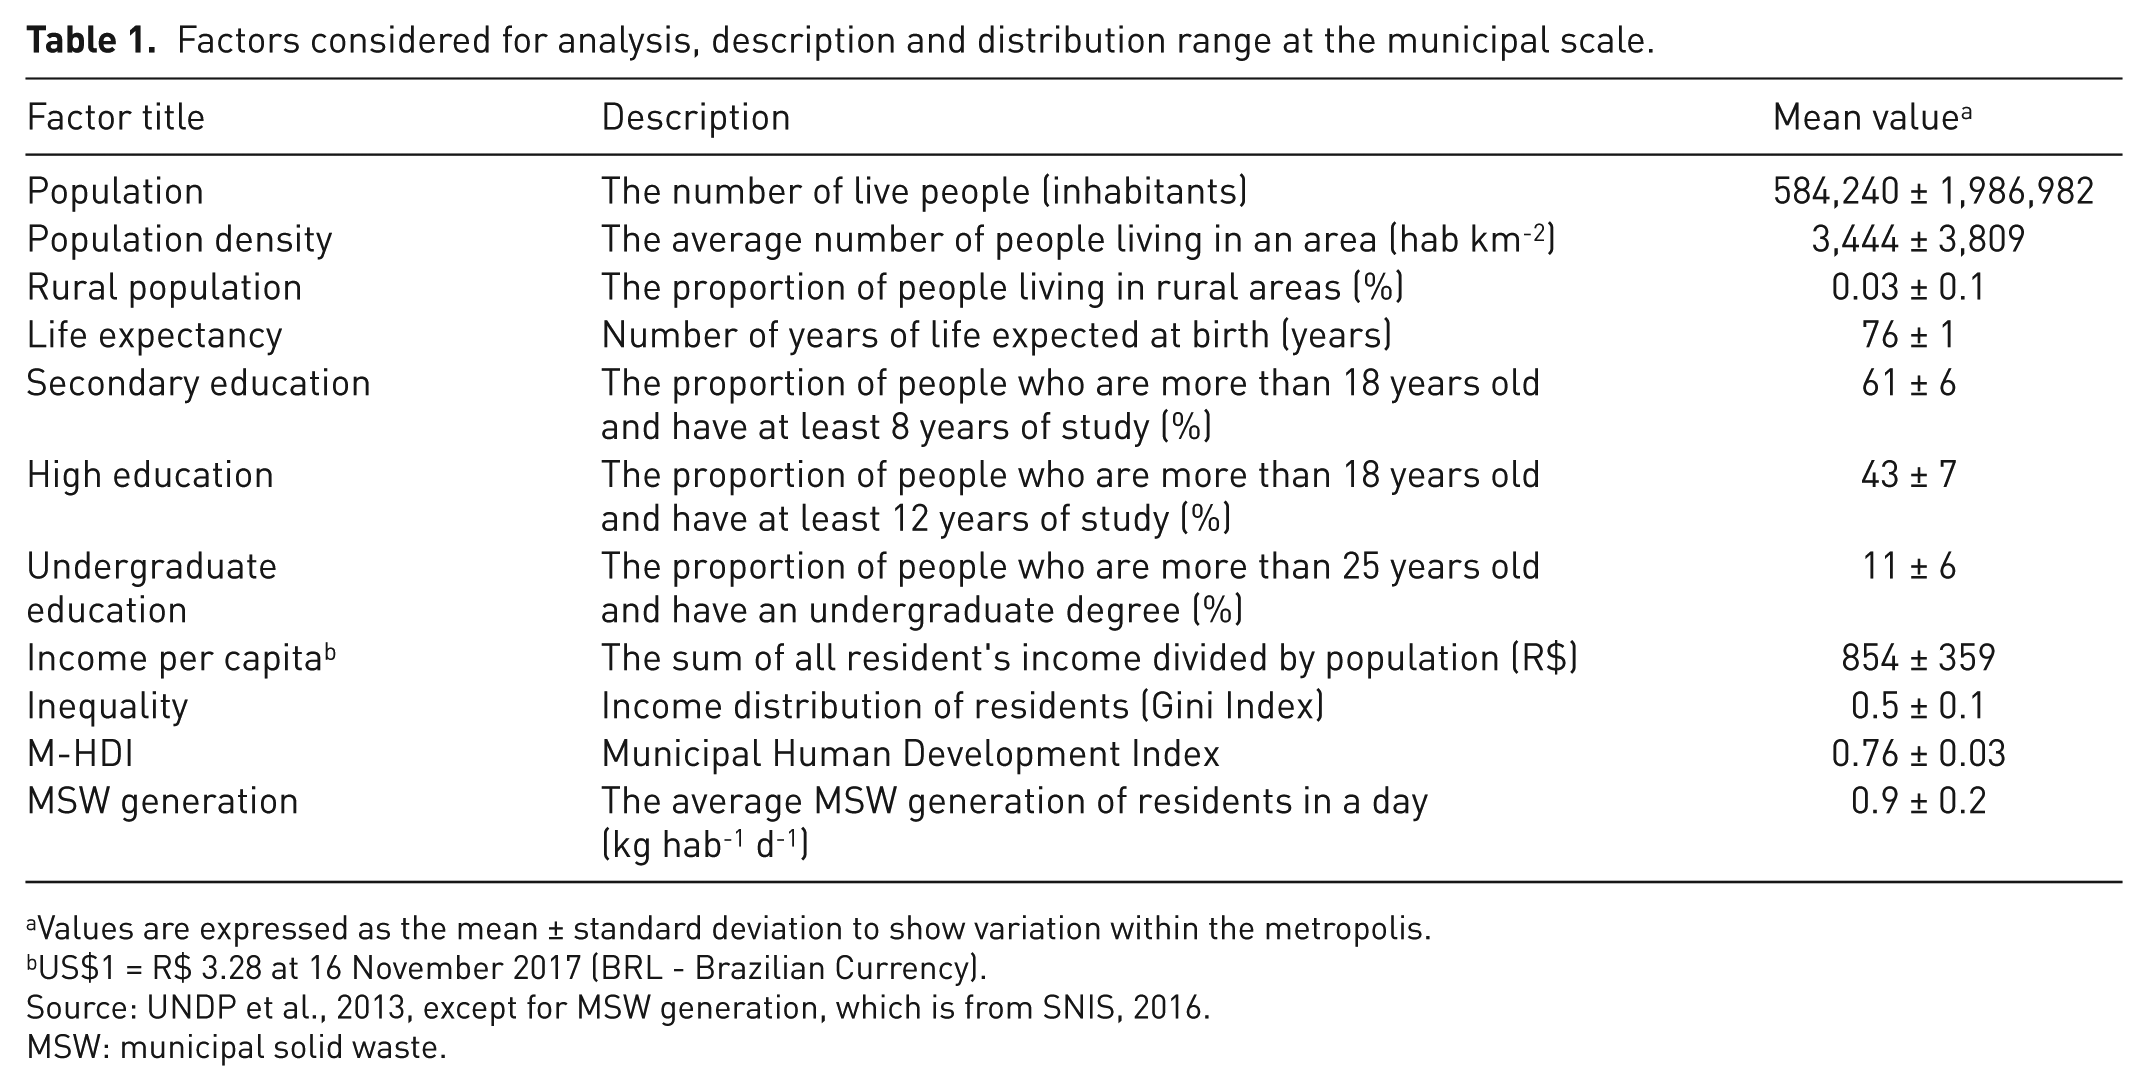
Values are expressed as the mean ± standard deviation to show variation within the metropolis.
US$1 = R$ 3.28 at 16 November 2017 (BRL - Brazilian Currency).
Source: UNDP et al., 2013, except for MSW generation, which is from SNIS, 2016.
MSW: municipal solid waste.
Data treatment and statistical analysis
We excluded doubtful data when the municipality provided per capita MSW generation outside the range of the mean ±3 standard deviations. Furthermore, municipalities with no weight machine in waste facilities were excluded from analysis. This resulted in the exclusion of only one municipality: Biritiba-Mirim. Three other municipalities did not provide information: Itaquaquecetuba, Mairiporã and Salesópolis. Finally, final data was matched with environmental agency reports on waste facilities to validate generation data.
The impact of factors was evaluated by correlation between the socioeconomic factors in Table 1 and MSW generation by means of Pearson’s correlation coefficients (rp). Student’s t-test (two-tailed) for p ← 0.01 and n = 35 determined the significance of the correlations.
Finally, we crossed all socioeconomic factors by multicollinearity analysis, as well as by Pearson’s correlation coefficients. This aided the exploration of factors that were correlated with others and thus induced correlation with MSW generation.
Results and discussion
Significant socioeconomic factors
Student’s t-test showed that six out of 10 variables were significant (rp ≥ 0.430 for p ← 0.01, n = 35), as shown in Table 2. Only rural population was inversely correlated with MSW generation, which demonstrated the rural characteristic of natural recycling routes predominantly for organic content, as observed by Wilson et al. (2012) and Khan et al. (2016). Rurality proved not statistically significant because of a limited number of municipalities with rural population, although it might show important dynamics in rural areas on further exploration.
Correlation of socioeconomic factors and significance to MSW generation.
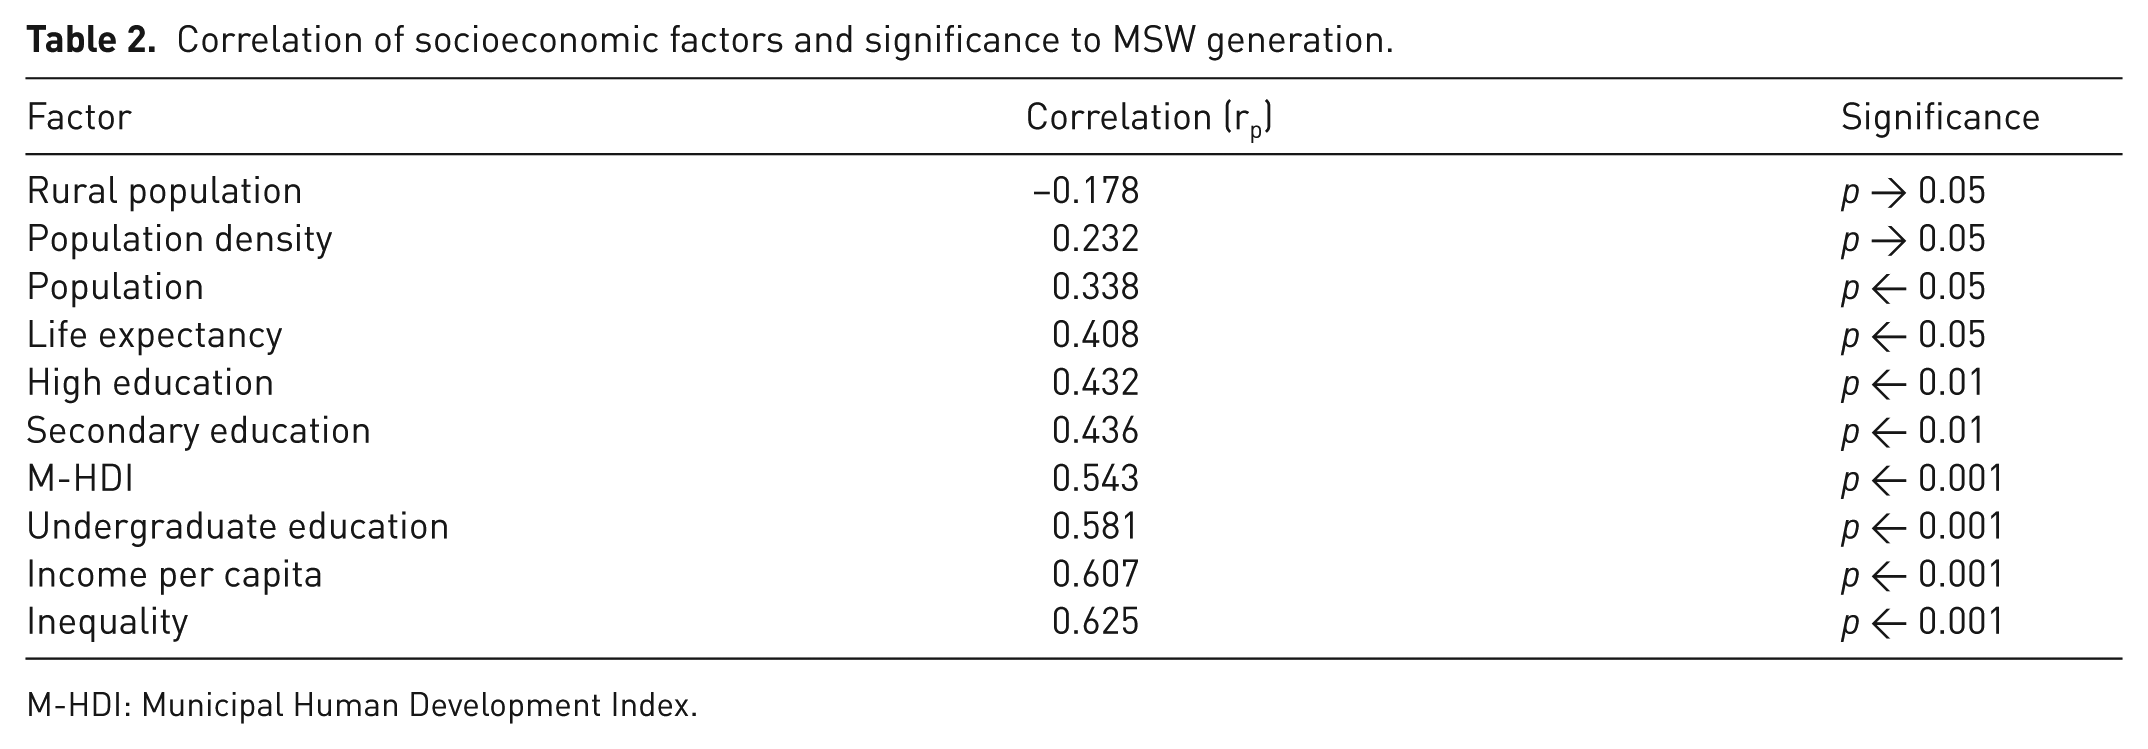
M-HDI: Municipal Human Development Index.
The results showed population to be insignificant to per capita MSW generation, which corroborated other studies (Hocket et al., 1995), although it is a common practice in the Brazilian public sector (SNIS, 2016). Education and economic dimensions have proven to be important factors for MSW generation, as observed in other countries; however, inequality had the greatest correlation.
This suggests a question for further inquiry: does a single primary factor lead other factors to correlate with MSW generation? Moreover, if it does spur correlation with other factors, what are they? To explore this question, we determined the multicollinearity between significant factors presented in Table 3.
Multicollinearity analysis between significant socioeconomic factors.
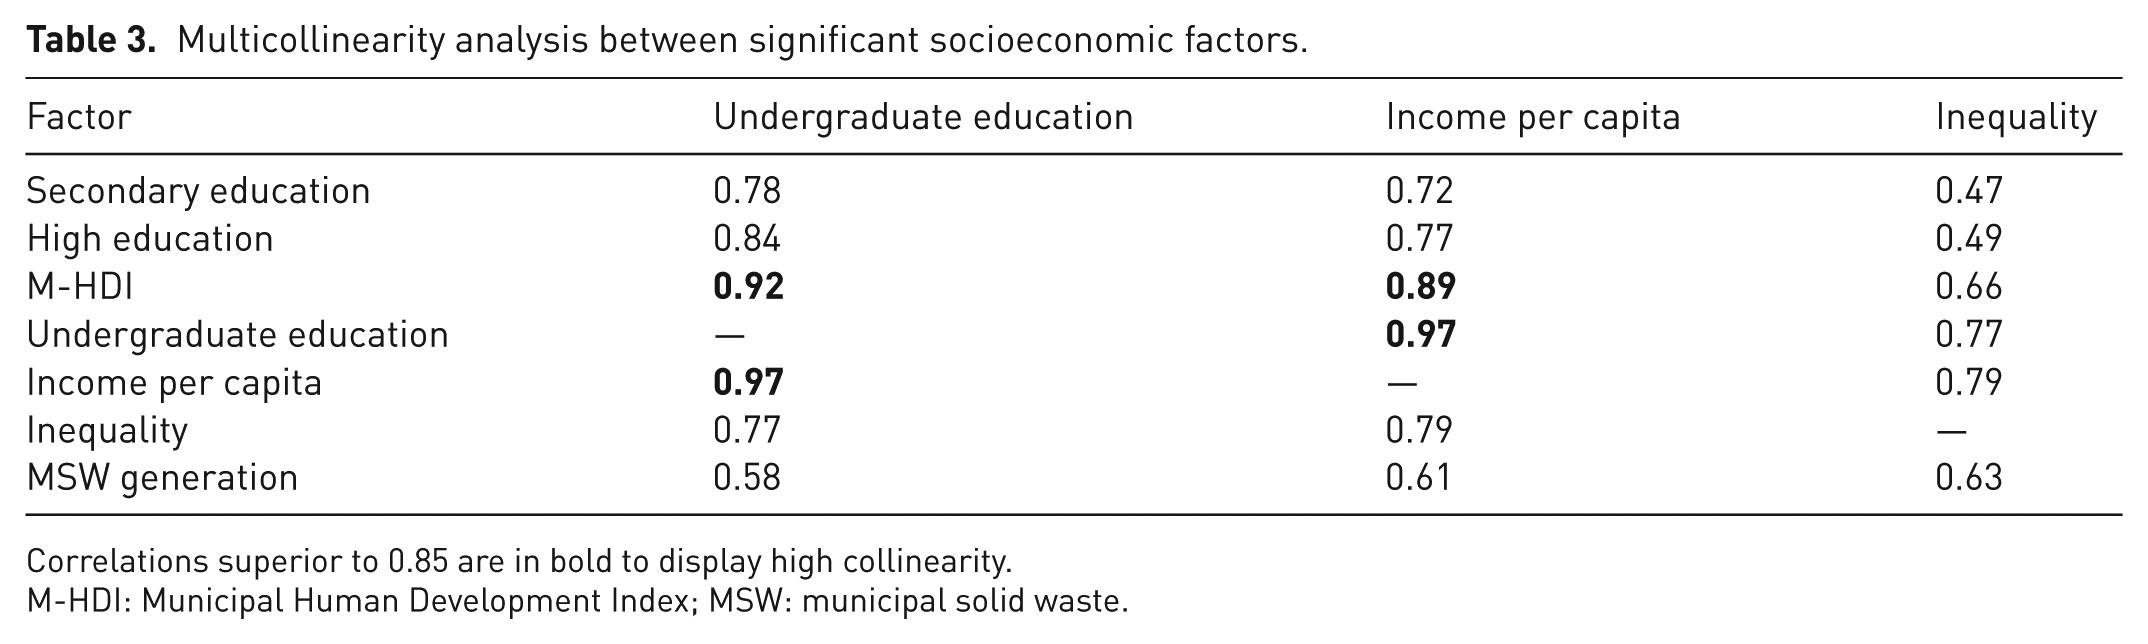
Correlations superior to 0.85 are in bold to display high collinearity.
M-HDI: Municipal Human Development Index; MSW: municipal solid waste.
Several studies have recognised economic status as the major driver of MSW generation (Guerrero et al., 2013; Hocket et al., 1995; Sujauddin et al., 2008; Wilson et al., 2012). Our results corroborate this conclusion, since income per capita had the second greatest correlation, but we also added inequality. Moreover, income incorporates loadings of education and development, as both presented high collinearity with income in this study. High correlation between income and education reveals how access to education in Brazil is restricted by income, primarily at the undergraduate level. Multicollinearity analysis exposed income as a common cause. For example, if we had not performed this analysis, we would still have considered income and education to be major drivers. Nonetheless, education was correlated to MSW generation because of its prior relationship to income patterns.
In this context, inequality proved to be a new variable in addition to income per capita. Inequality had the greatest correlation to MSW generation and low correlation to other socioeconomic factors, even with income per capita. Therefore, we explore the importance of inequality and its relationship to income in the next section.
The importance of inequality: A complement to income and a social dimension of waste
Income integrates the impact of different dimensions as a means of access to quality education and health, typically in developing countries (OECD, 2015; UNDP, 2015). Nonetheless, income does not express how it is distributed (Figures 2 and 3).
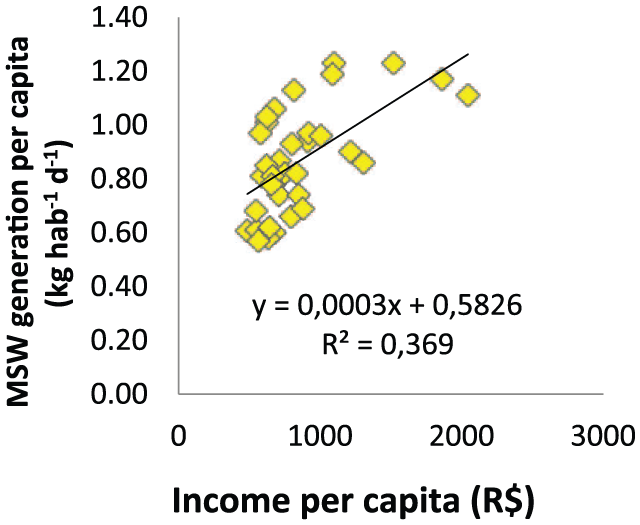
MSW per capita generation and income.
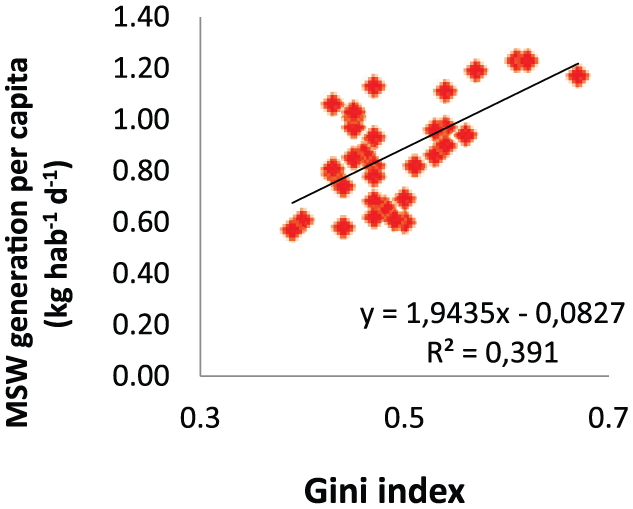
MSW per capita generation and inequality.
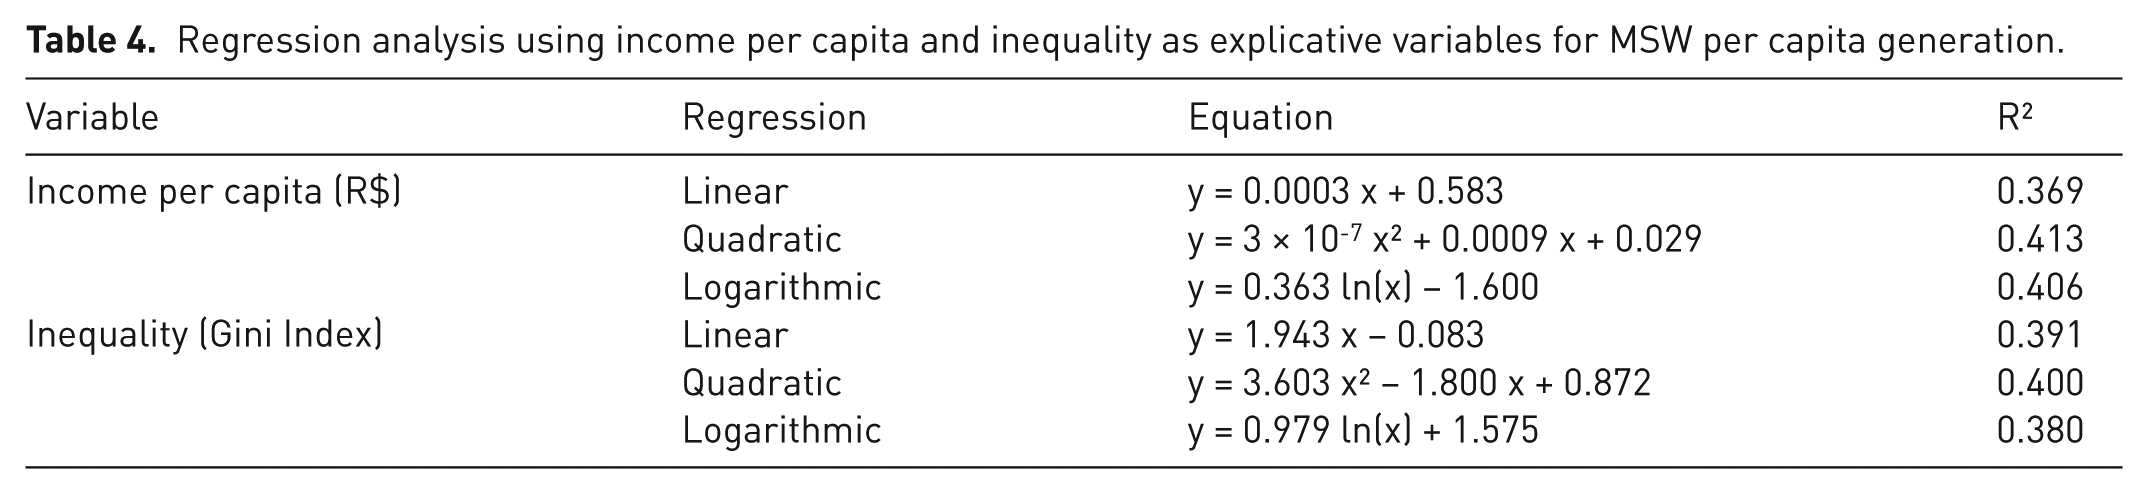
Logarithmic and quadratic relationships between MSW generation and income (Dias et al., 2012; Mazzanti et al., 2008; Wilson et al., 2012) express the limitations of average per capita indicators. Mean indicators underestimate the MSW generation of the richest regions and overestimate that of the poorest regions, for example, the MSW generation in Derahun, India, of 0.055 kg capita-1 day-1 (Suthar and Singh, 2015). Regression analysis did not prove significant differences in linear, logarithmic and quadratic regression models in our area of study (see Table 4), probably because of the limited ranges of income and inequality indexes.
Regression analysis using income per capita and inequality as explicative variables for MSW per capita generation.
The impact of inequality on MSW generation has also been observed within high-income countries (Dorling, 2014). Explanation of this effect relies on the fact that societies with higher inequality stimulate consumption and produce more waste (Dorling, 2014; Wilkinson and Pickett, 2011;). Wilkinson and Pickett (2011) also associated higher recycling rates between more equal countries, such as Sweden and Japan, when compared with the United States and Great Britain (the same countries appear in Dorling (2014) for MSW generation).
Inequality ultimately complements income or other economic status; it summarises income distribution in society and social dynamics that encourages waste generation, limits access and hinders policy implementation. Inequality must not be used by itself or it would fail. For example, consider a perfectly equal society with high income. A model based only on inequality fails because consumption still exists and, consequently, MSW generation. Moreover, inequality does not have the same flexibility of income for use at different scales from person to country, continent or world; it depends on the complex availability of data at a minimum territorial scale, which restricts its use.
How does inequality change waste management policies in Brazil and around the world? What are the consequences of inequality on the waste sector? We discuss our findings and implications on policies, particularly in the developing world, in the next section.
Contributions for ISWM: Inequality in perspective
Most MSWM systems have adopted non-integrated approaches, and integrated systems have lately been developed to fill this demand (Morrissey and Browne, 2004; Pires et al., 2011). The developing world has introduced different scenarios and challenges for waste management, and non-integrated and pure technical engineering systems have thus failed (Morrissey and Browne, 2004; Van der Klundert and Anschütz, 2001). Therefore, the social dimension plays a crucial role when elaborating policies. As considered here, income inequality condenses a set of aspects of local social structure. Our results corroborate the significance of inequality and the need for adopting inequality as a factor for ISWM.
Financial sustainability is a key aspect of good waste governance; however, the affordability for a population must be evaluated (Wilson et al., 2012). Brazil, most Latin American countries and developing countries face high inequality rates (OECD, 2015; UNDP, 2015), and such unequal conditions require unequal policies to address them. Based on this premise, Chu et al. (2017) showed how differentiated taxes in waste generation blocks may efficiently reduce waste generation and advance environmental justice. This model reduces the burden of low-income families, which have less disposable income. Almost 60% of Brazilian municipalities do not have waste fees, and within the 40% that do, not even 1% have specific waste fees that include other urban services, such as property taxes, waste, fresh water and sewage fees (SNIS, 2016).
Waste fees should be levied via PAYT policies in volume-based models, which have been successful policies in other countries (Dahlén and Lagerkvist, 2010; Park and Lah, 2015). Moreover, other policies should focus on mechanisms, such as landfill taxes and EPR, to achieve environmental protection. Although, it is still a difficult task to do so in developing countries due to lack of institutional capacity to implement and supervise.
Conclusion
The analysis of social aspects at the local level has proven essential for the design of consistent policies and plans. This consideration guarantees higher efficiency and effective paths towards sustainable solutions. Technological and economic analysis would not provide the results achieved in this study.
Inequality was introduced as an important factor for MSW generation that complements income and other individual economic indicators. By so incorporating inequality, waste fees should be levied via PAYT systems to not overwhelm the poorest people. Inequality impacts in MSW generation and MSWM dynamics, as well as the impacts of other social factors, must be better explored in future worldwide research.
Combatting inequality does not belong to the range of waste policies, although its impact should be better assessed. Combatting inequality shows the importance of tiered policies in social and environmental dimension, as sustainable consumption and inequality struggle in the search for sustainable development.
Footnotes
Declaration of conflicting interests
The authors declared no potential conflicts of interest with respect to the research, authorship, and/or publication of this article.
Funding
The authors received no financial support for the research, authorship, and/or publication of this article.