
Abstract
In bioreactor landfill, moisture content is one of the most important factors affecting the migration of leachate. The migration characteristics of leachate in the Sudokwon landfill site was estimated by examining relationships among self-loading weight of waste (waste weight load), bulk density, hydraulic conductivity and moisture content of the landfilled waste. Experimental zones in the Sudokwon landfill were divided into leachate recirculation zones (3-C and 4-C zone) and reference zone (3-D zone). The volume of the leachate recirculation was 207 m3 d-1 for 12 months in the 3-C zone and 190 m3 d-1 for 3 months in the 4-C zone. A logarithmic graph can describe the relationship between waste weight load and bulk density by moisture content. However, both the relationship between bulk density and hydraulic conductivity and the relationship between hydraulic conductivity and waste weight load can be expressed by an exponential graph. Through these relationships, generalised equations for hydraulic conductivity were established using moisture content and waste weight load. The hydraulic conductivity calculated from the generalised equation in the leachate recirculation zone was estimated to be 6.27 × 10⁻⁴ cm s-1 in the 3-C zone and 4.43 × 10⁻⁴ cm s-1 in the 4-C zone. The migration time of leachate in the leachate recirculation zone was estimated to be 64.2 days in the 3-C zone and 94.5 days in the 4-C zone, respectively.
Introduction
In developed countries, wastes are considered as resources to sustain recycling and to reduce the amount of landfilled waste by substituting the use of natural resources. Most developing countries have used landfilling as a means of waste management and treatment because they have a low level of recycling technologies and have non-efficient incineration facilities. Even though the resources recirculation is the highest priority of the waste management in most countries, the final sink of wastes should be established in every country because recycling and thermal treatment are not appropriate for all wastes. The end of waste criteria (EoWC) was established to distinguish whether discharged materials are managed as wastes or resources. If some wastes are not satisfied with the EoWC, the wastes may be landfilled eventually. Therefore, the wastes should be environmentally landfilled, and the landfill process should be economical, sanitary and efficient.
United States (US), European Union (EU) and other developed countries have been using bioreactor landfill, which has a concept of decomposing organic wastes by recognising the landfill site as a giant bioreactor, to maximise the generation rate of landfill gas and to stabilise landfill prematurely (Huang et al., 2012; Pacey et al., 1999; Sanphoti et al., 2006). The bioreactor landfill method can be classified into two types; aerobic bioreactor landfill method with oxygen injection and anaerobic bioreactor landfill method with leachate recirculation. The aerobic bioreactor landfill method has the potential advantage of stabilisation in a very short period. However, it has the disadvantage of high maintenance cost and risk of fire owing to oxygen injection (Fadel et al., 2013; Warith et al., 2005). A more potent greenhouse gas than methane and carbon oxide may be emitted (Berge et al., 2006). The anaerobic bioreactor landfill method has the potential advantage of low maintenance cost through the recovery of energy resources such as methane and the improvement of the water quality by leachate recirculation. However, it has the disadvantage of odorous substances generation, such as ammonia and hydrogen sulphide.
The choice of the two methods depends on economic feasibility, such as availability of the land after post-management and the maintenance cost of bioreactor landfill. It was reported that annual cost savings varied from US$75,000 to US$500,000 in full-scale operating anaerobic bioreactors (Reinhart et al., 2002). Recently, the development of renewable energy has become an international concern because of the climate change and fossil fuel depletion (Stern, 2006; Trenberth et al., 2007). The anaerobic bioreactor landfill method can recover methane from landfilled wastes and methane can be used as a renewable energy source (Amini and Reinhart, 2011; Lakshmikanthan and Sivakumar Babu, 2017; Rhee et al., 2003a; Rhee et al., 2012). Also, carbon emission rights can be acquired by greenhouse gas reduction using the anaerobic bioreactor landfill method. The anaerobic bioreactor landfill method has been used steadily and expanded gradually because the maintenance cost required to stabilise the landfill is low, and it satisfies international trends, such as climate change.
In bioreactor landfill, the influence factors for the decomposition of organic wastes are moisture content, toxic substances, oxygen concentration, etc. and moisture content is one of the most important factors (Reinhart et al., 2002; Rhee, 2010; Rhee et al., 2003b; Xi and Xiong, 2013). The decomposition of organic wastes in the bioreactor landfill is enhanced by injecting leachate into wastes in the landfill to ensure leachate recirculation. Therefore, the residence time of leachate is an important factor to distribute an appropriate range of moisture content (40~70%) in the bioreactor landfill (Boopathy, 2000; Han et al., 2016; Law et al., 2011). The residence time can be decided by Darcy’s law with a hydraulic conductivity of the wastes in the bioreactor landfill (Hettiarachchi et al., 2007). Since wastes in the landfill are compressed by its self-loading weight, the wastes settled gradually. Therefore, the bulk density of wastes is increased as the depth of the landfill increases, and the hydraulic conductivity is decreased by settling the wastes.
Many researchers have studied the migration characteristics of leachate. Stępniewski et al. (2011) studied the effect of bulk density on the hydraulic conductivity of various porous materials. They used various soils in the experiment to obtain hydraulic conductivity, which sharply decreased with an increasing bulk density of soil. They also found that hydraulic conductivity increased with an increasing leachate content. Ebina et al. (2004) studied the correlation between hydraulic conductivity and vertical pressure using various clay. The vertical pressure applied clay was increased with a decreasing hydraulic conductivity. Yang et al. (2018) reviewed the comparison of saturated permeability coefficient in several municipal solid waste (MSW) landfills. They found that the saturated permeability coefficient decreased with landfill depth. Machado et al. (2010) reviewed the geotechnical properties of MSW in various landfills. They examined the relationship between permeability, landfill depth, density and vertical pressure. Some researchers have studied the relationship between hydraulic conductivity and bulk density according to the landfill depth. However, few studies have evaluated the residence time as an important factor by applying the relationship to the bioreactor landfill on a full scale.
In this study, at first, the composition of landfilled waste was investigated at three different depths (3 m, 8 m and 13 m) to estimate the characteristics of waste. The migration characteristics of leachate in the landfill were estimated by measuring hydraulic conductivity and bulk density of the landfilled waste in the Sudokwon Landfill site, in which bioreactor landfill technology was applied by leachate recirculation. The relationship between the bulk density and the hydraulic conductivity of the landfilled waste was examined. Finally, the migration time of leachate in the Sudokwon Landfill site was evaluated by applying bioreactor technology with leachate recirculation in a real scale.
Materials and methods
Site selection and materials
To evaluate the relationship between bulk density and hydraulic conductivity of the landfilled waste, the waste sampling area was selected at the second landfill site in the Sudokwon landfill located in Incheon, Korea (Republic of), in which bioreactor landfill technology was applied. The location and the schematic diagram of the full-scale landfill are shown in Figure 1. The bioreactor landfill was composed of seven layers and each layer consisted of a waste layer and a cover material layer, and the length of each layer is shown in Figure 1(a). The cover material was composed of waste mixtures, such as waste soil, construction waste, ash and sludge. The leachate recirculation was performed by a leachate recirculation pump located at the top of the layer W7. The sampling sites were selected at 3-C (300 m × 300 m), 4-C (300 m × 300 m) and 3-D (300 m × 300 m) zones as shown in Figure 1(b).
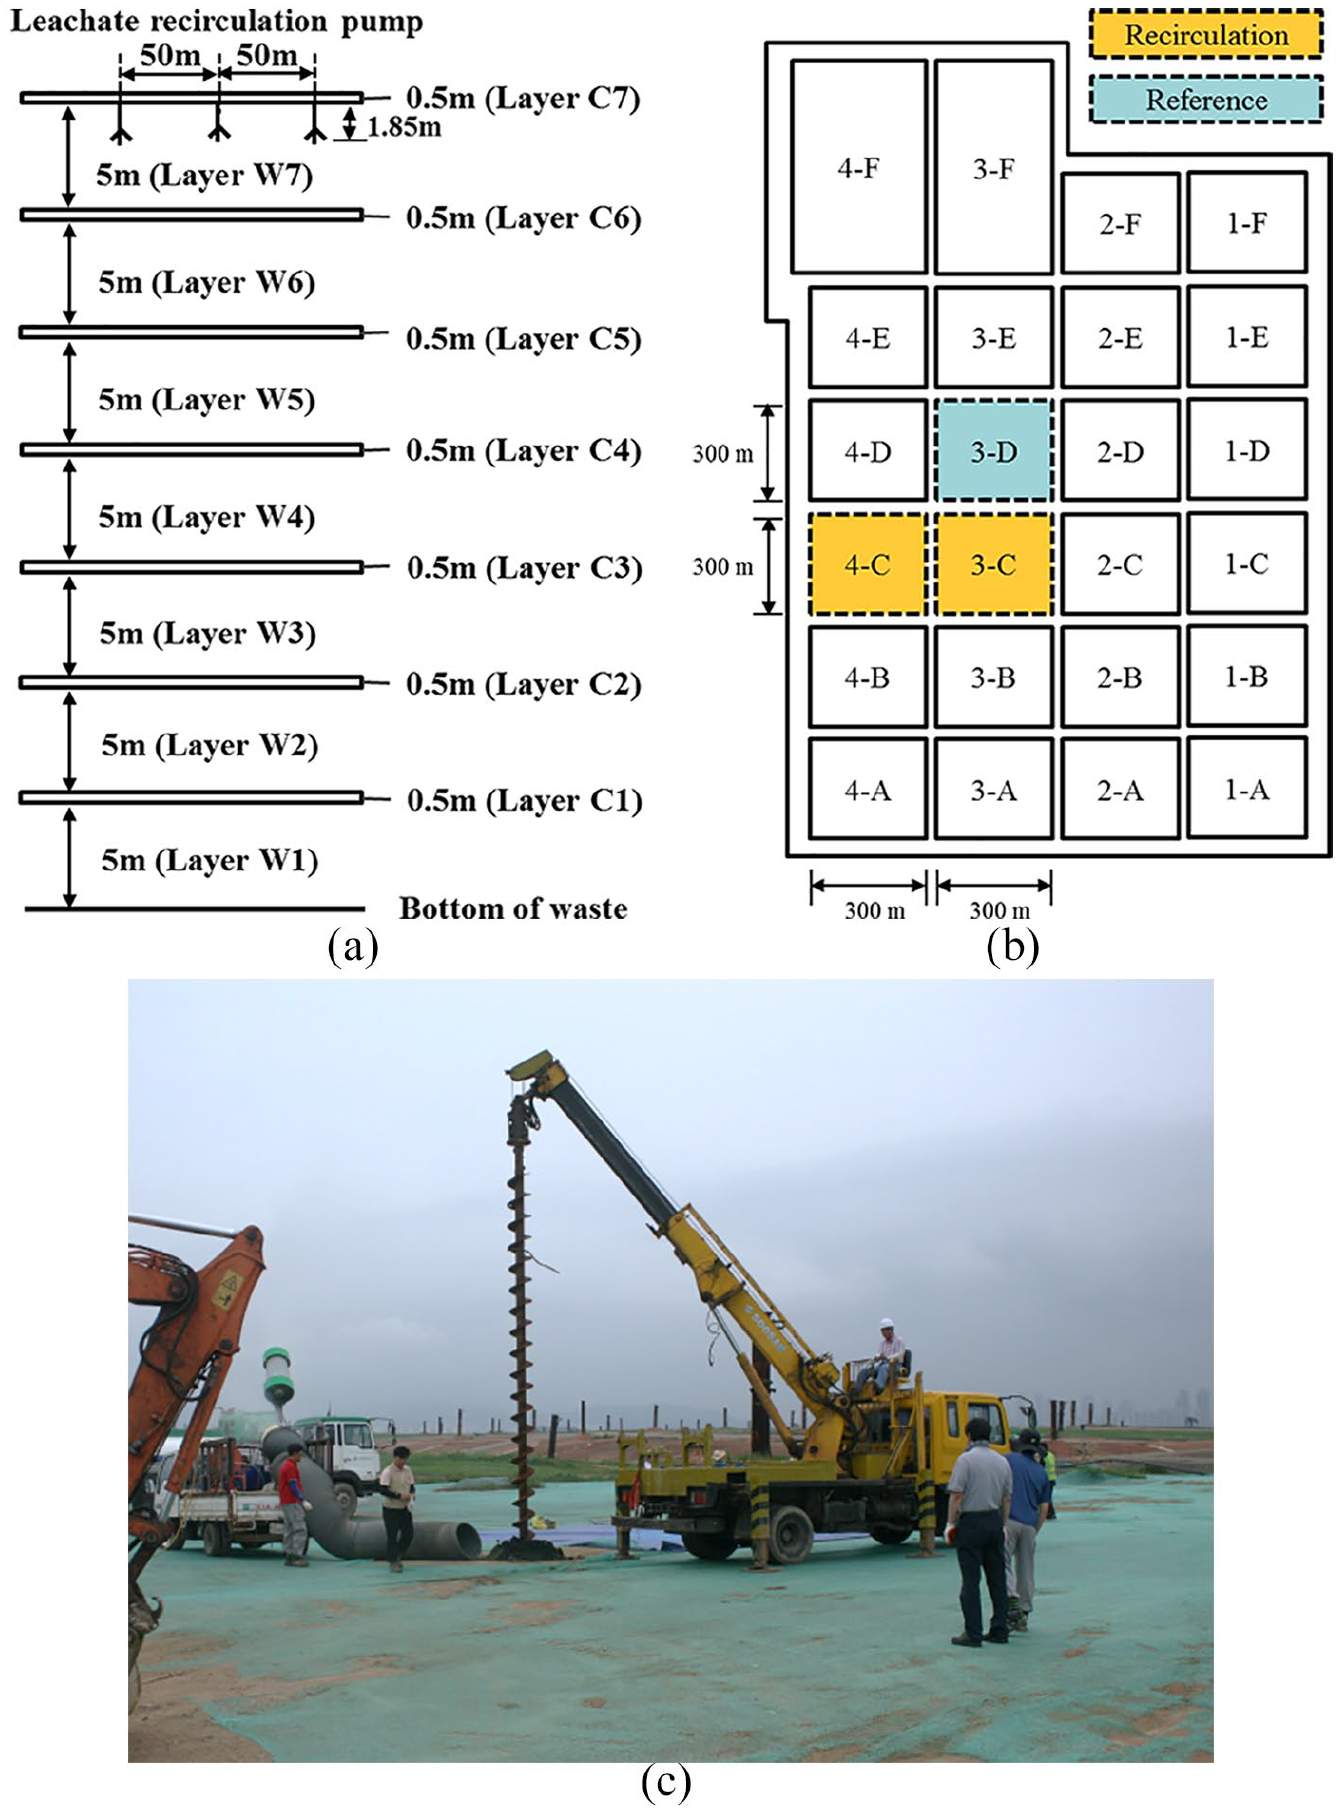
A schematic diagram of landfill sampling. (a) Waste Landfill site. (b) Sampling site. (c) Waste sampling.
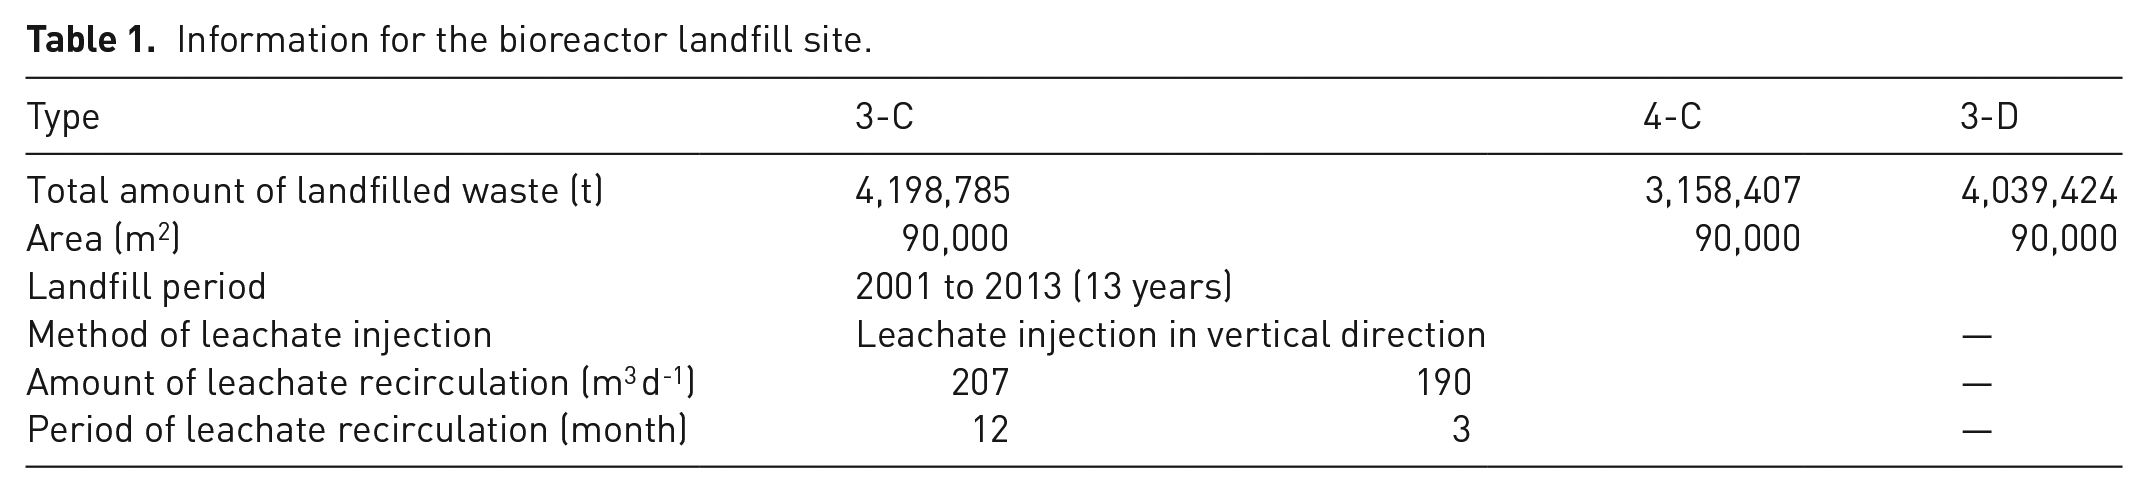
The 3-C and 4-C zones are bioreactor landfill sites with recirculating leachate, while the 3-D zone is the reference landfill zone that does not recirculate leachate. The distance between injection wells for recirculating leachate in the bioreactor landfill site was 50 m. The information on 3-C, 4-C and 3-D zones are shown in Table 1. The landfill period of the Sudokwon landfill site was 13 years from 2001 to 2013. The total amount of landfilled waste was about 4199 thousand tonnes for the 3-C zone, about 3158 thousand tonnes for the 4-C zone and 4039 thousand tonnes for the 3-D zone. Therefore, a 3-D zone with a similar amount of landfilled waste to the 3-C zone was set as the reference zone. The average precipitation in the Sudokwon landfill site was 1237 mm (Korea Meteorological Administration, 2018). Initially, the amount of leachate recirculation was about 200 m3 d-1 in 3-C and 4-C. It was changed slightly by the condition of the real landfill site. The average amount of the leachate recirculation was 207 m3 d-1 for 12 months in the 3-C zone and 190 m3 d-1 for 3 months in the 4-C zone. It was tried that the leachate characteristics were compared for 12 months in the 3-C zone and 3 months in the 4-C zone. The characteristics of recirculated leachate are shown in Table 2. Since the sustainable solid (SS) was 205.4 mg L-1 in recirculated leachate, the flow of leachate in the bioreactor landfill site may not be affected by SS in leachate. Sampling was performed at 10 m away from the leachate recirculation pump. The waste samples were taken at a depth of 3 m (intermediate in layer W7), 8 m (intermediate in layer W6) and 13 m (intermediate in layer W5) using an auger drilling machine, as shown in Figure 1(c).
Information for the bioreactor landfill site.
The characteristics of leachate in the bioreactor landfill site.
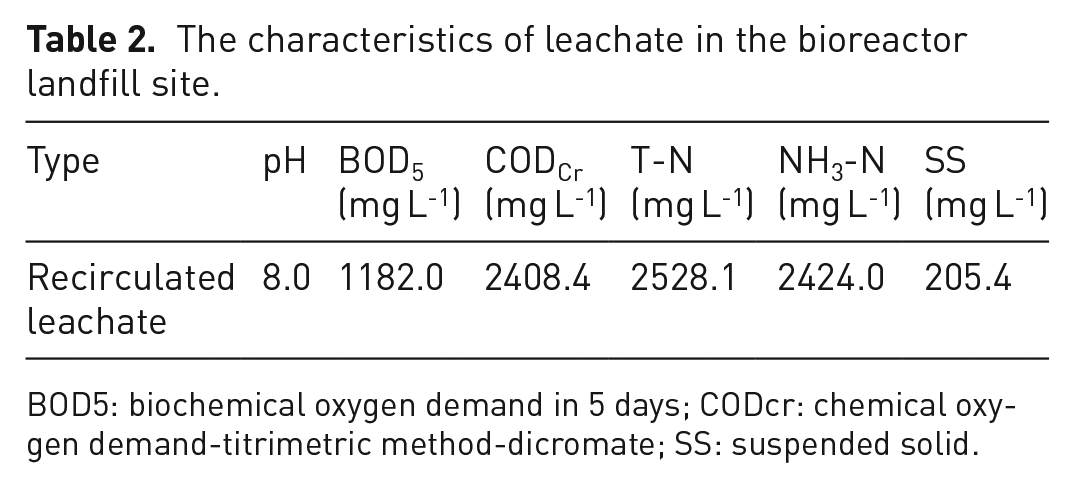
BOD5: biochemical oxygen demand in 5 days; CODcr: chemical oxygen demand-titrimetric method-dicromate; SS: suspended solid.
Methods
To estimate the average hydraulic conductivity of the bioreactor landfill, it is necessary to know the hydraulic conductivity of the wastes layer and cover material layer. The hydraulic conductivity of waste in each layer is evaluated by the interrelation between the hydraulic conductivity and bulk density affected with waste weight load.
Since the hydraulic conductivity of wastes is influenced by the type and characteristics of the wastes, the type and characteristics of waste samples were examined by composition, bulk density and proximate analysis. The moisture content was determined according to ASTM D 3173-11, the volatile matter content was determined according to ASTM D 3175-11 and determination of the ash content was carried out according to ASTM D 3175-11. The bulk density was determined according to KS I ISO 11508 and KS I ISO 11508 and compressive strength testing equipment (JSV-1000) was used to measure the bulk density. To measure the hydraulic conductivity in a laboratory test, the falling head test was used by changing the bulk density (0.7~1.1 g cm-1). The experiment of the falling head test was performed on the assumption that the waste in the bioreactor landfill was saturated by sufficient recirculating leachate.
Since the depth of cover material may not change very much in each layer with time, the hydraulic conductivity of the cover material in each layer can be applied as a constant value with time. The bulk density of cover material is 0.81 g cm-3 on a dry basis, and the moisture content of cover material can be applied as that of landfilled waste.
The hydraulic conductivity of each layer may depend on the physico-chemical characteristics of the wastes in the landfill. The hydraulic conductivity in the bioreactor landfill, which has multilayer with different hydraulic conductivity, can be estimated using the hydraulic conductivity and depth of each layer, as shown in equation (1):
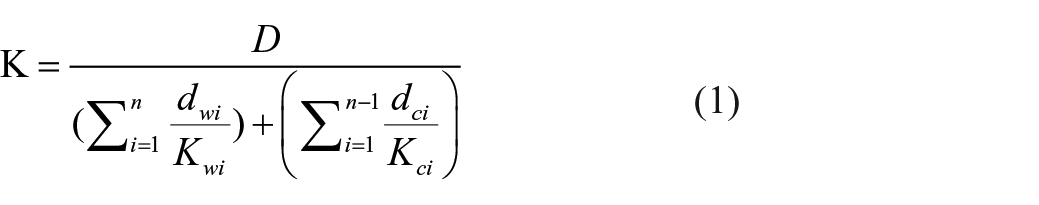
where D is the total depth of all layers, K is the hydraulic conductivity for the system of total layers, dwi and Kwi is thickness and hydraulic conductivity of waste layer. dci and Kci is thickness and hydraulic conductivity of the cover material layer. Since part of layer W7 and layer C7 were not in contact with recirculated leachate, they were excluded from equation (1).
Since the depth of waste layers (dwi) can be reduced by waste weight load, it can be estimated by equation (2):
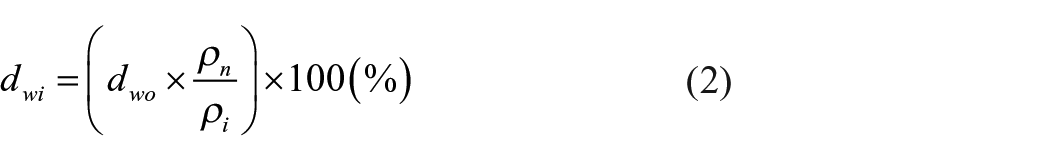
where dwo is the original depth of each waste layer, ρi is the bulk density of each waste layer and ρn is the bulk density of the topmost waste layer.
Result and discussion
Waste composition in the bioreactor landfill
The waste composition in the bioreactor landfill is shown in Table 3. The average weight fraction of biodegradable wastes in the bioreactor landfill accounted for about 81.8%. The biodegradable wastes were mainly composed of wood wastes, humus, papers and fibres. Food waste was not detected because the Ministry of Environment (Korea) has prohibited the direct landfill of food waste with the Waste Management Act to prevent adverse environmental effects, such as the generation of odour and leachate from food waste by 2005. The average weight fraction of non-biodegradable wastes was about 18.2%. But it can be changed slightly by varying the areas and depths, because the landfilled wastes are not homogeneous.
Waste composition in the bioreactor landfill site.
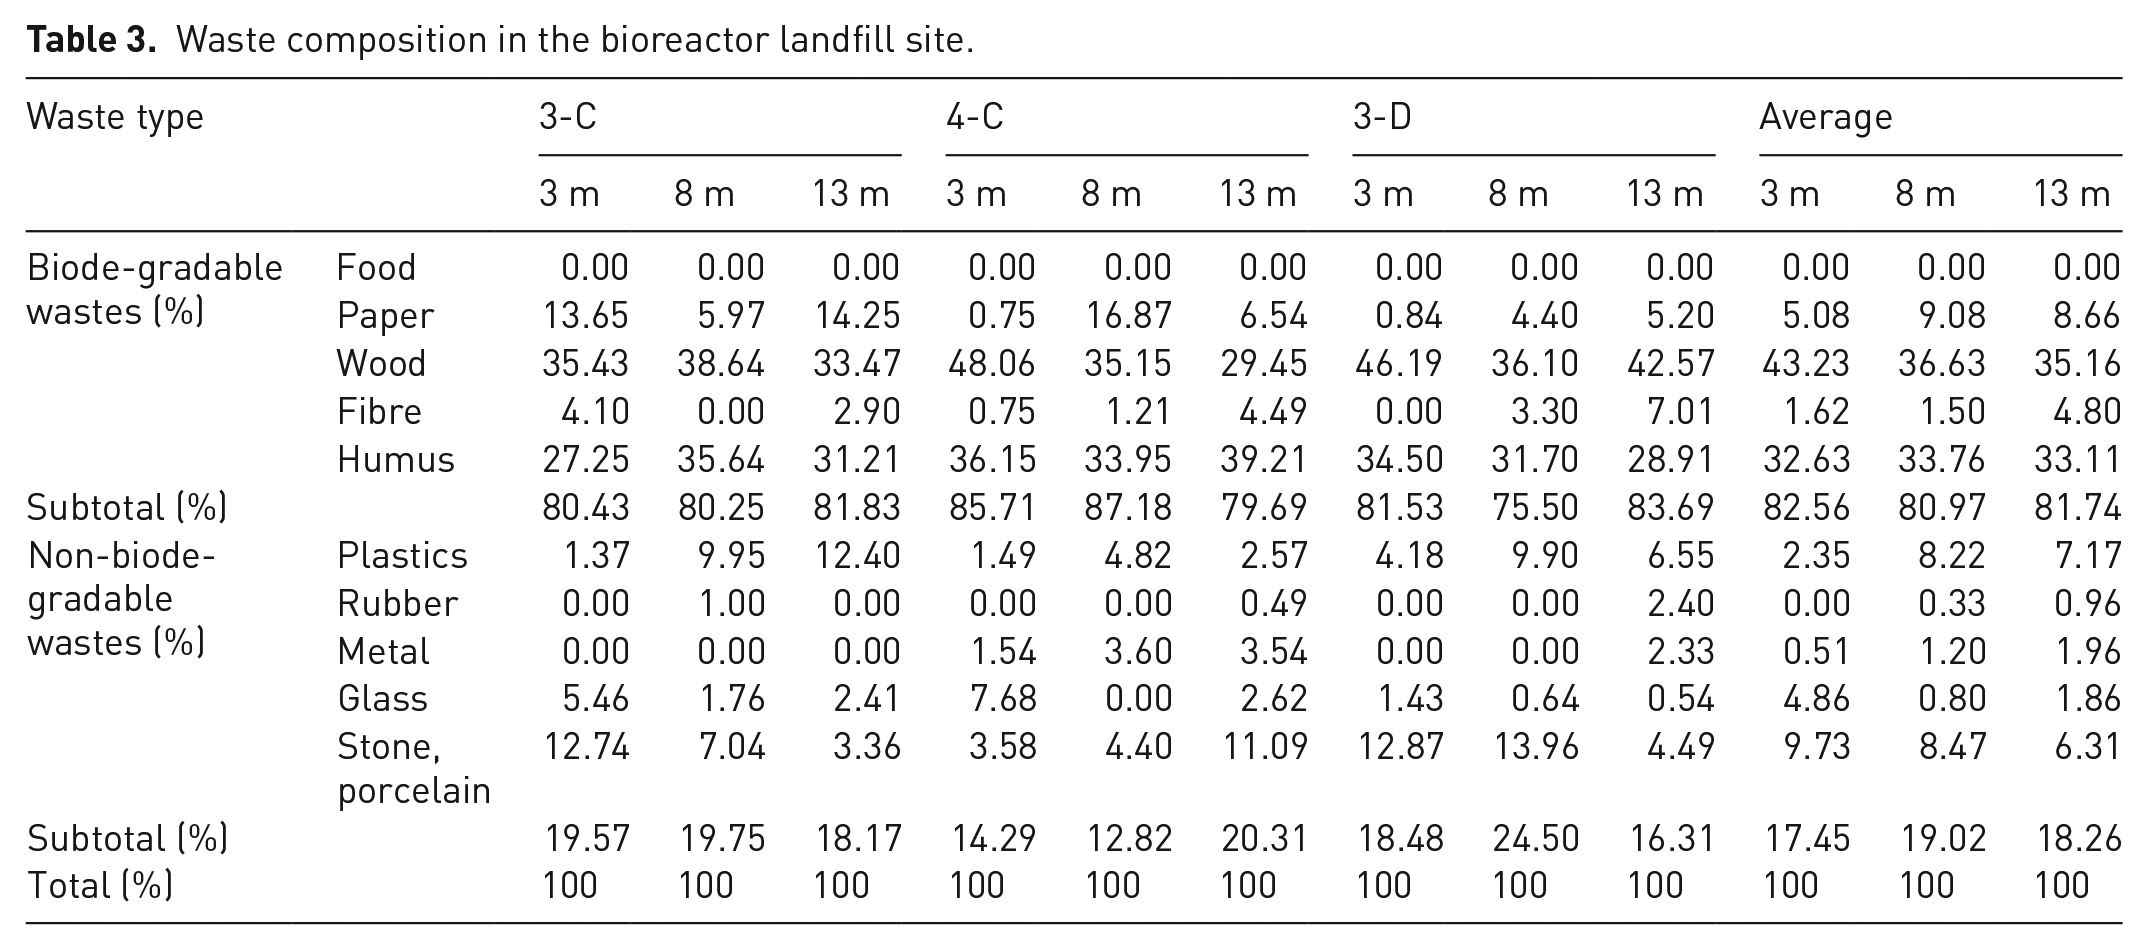
The results of proximate analysis and bulk density of waste with depth are shown in Table 4. The moisture content of the waste in the recirculation zones with depth showed a large difference from 36.9% to 41.2% in the 3-C zone and from 29.8% to 34.1% in the 4-C zone, respectively. Since the leachate recirculation period and amount in the 3-C zone were longer and larger than those in the 4-C zone, the moisture content in the 3-C zone was large compared with that in the 4-C zone. The moisture content in the reference zone did not change significantly with depth. From many literature reviews, the moisture content of the bioreactor landfill is adequate at 40% to 70% (Boopathy, 2000; Han et al., 2016; Law et al., 2011). In the USA, the moisture content of waste in bioreactor landfill is regulated as 50% or less by 40 CFR 258.41 (US Government Publishing office, 2018). In Korea, the moisture content in the landfill site is also regulated as 50% or less by the Waste Management Act (Ministry of Environment, Korea, 2018). In the bioreactor landfill site, the bulk density of the waste is greater as the depth of the wastes is greater. Also, the bulk density of the reference zone is less than that of leachate recirculation site because of its low moisture content.
The characteristics of wastes in the bioreactor landfill site.
Relationship between waste weight load and bulk density
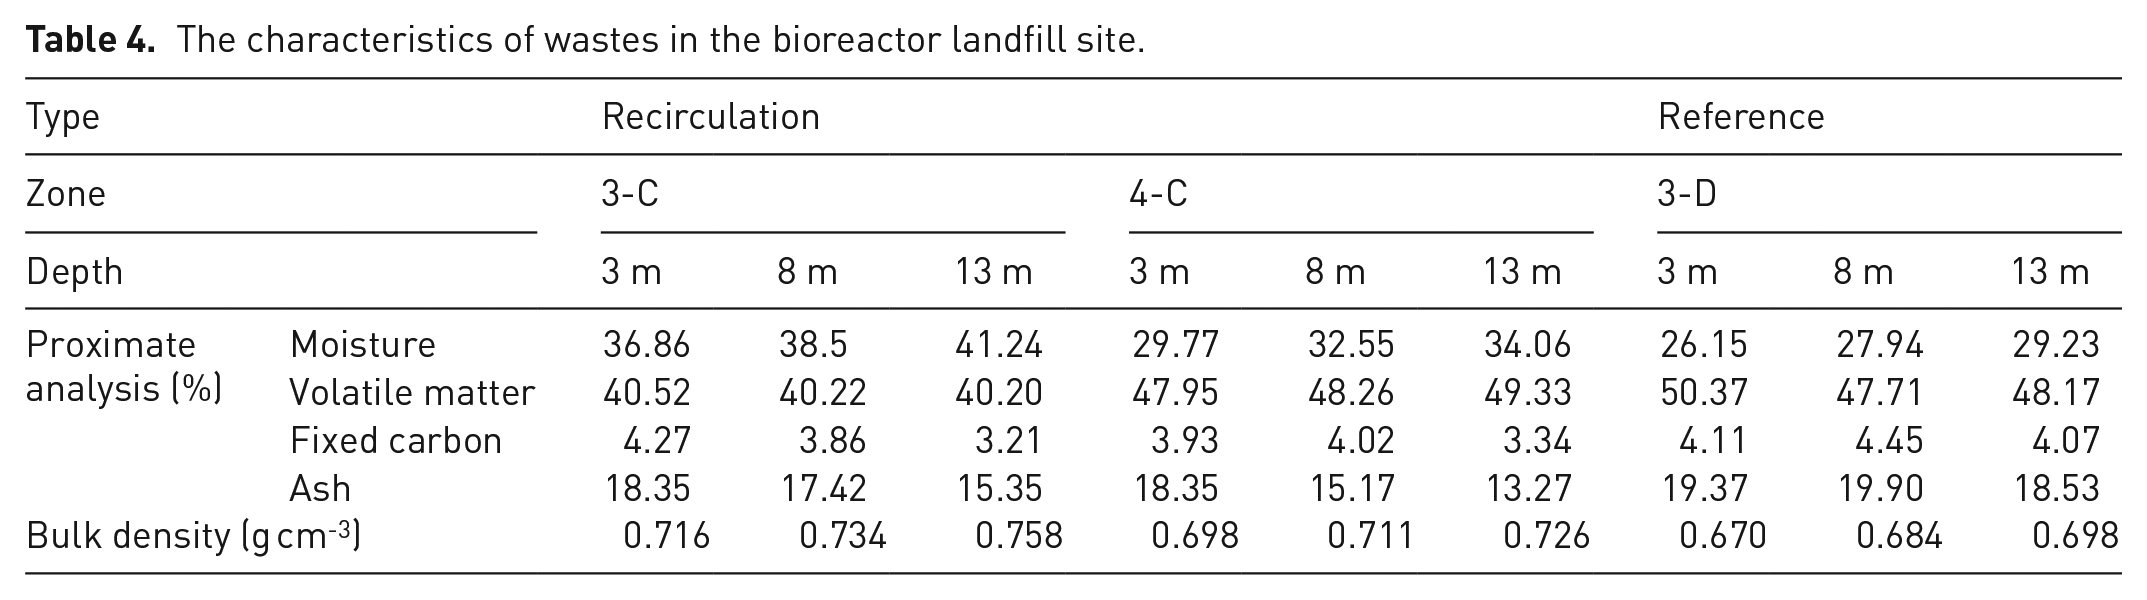
To estimate the effect of change in bulk density with increasing waste weight load, wastes were sampled from 3 m, 8 m and 13 m in the depth of the recirculation zone and the reference zone. The migration characteristics of leachate at the bioreactor landfill can be determined by the waste composition, the bulk density and the moisture content of wastes. Since the waste composition by the depth was not significantly different between the recirculation zone and reference zone, the waste composition is used as an average value. The moisture content of the bioreactor landfill is larger than 30% in the leachate recirculation zone and is legally limited to 50%. The bulk density with increasing waste weight load by moisture content from 30% to 50%, is shown in Figure 2(a). The relationship between the waste weight load (x) and the bulk density (y) can be described by the logarithmic equation, such as ’y = A1 ln(x) + B1’ where A1 and B1 are coefficients of the bulk density. The relationship between the waste weight load and the bulk density is shown as ‘y = 0.0778 ln(x) + 0.6983’ at 30% of the moisture content and ‘y = 0.1029 ln(x) + 0.8287’ at 50% of the moisture content. Since the moisture content in the bioreactor landfill can vary on the depth and the characteristics of the waste, a generalised equation should be derived by considering bulk density, waste weight load and moisture content as factors. The coefficients A1 and B1 obtained from the logarithmic equation in Figure 2(a) are changed by moisture content, as shown in Figure 2(b). The A1 is evaluated to be ’A1 = 0.0013M + 0.0384’ where ‘M’ is moisture content. Also, B1 is estimated to be ’B1 = 0.0065M + 0.5029’. Finally, the relationship between the waste weight load and the bulk density was evaluated in a generalised formula at the bioreactor landfill, as shown in equation (3):

The relationship between the waste weight load and the bulk density. (a) Relationship between the waste weight load and the bulk density. (b) Relationship between the coefficients of the logarithmic equation in (a).
Reddy et al. (2009) estimated that the correlation between compressive strength and bulk density of landfilled MSW from Orchard Hills landfill, USA. As the compressive strength was increased from 0.68 kgf cm-2 to 2.80 kgf cm-2, the bulk density increased from 0.85 g cm-3 to 1.02 g cm-3. The correlation between the bulk density (y) and compressive strength (x) was expressed by ‘y = 0.1205 ln(x) + 0.8957’. According to Reddy et al. (2009), the bulk density of MSW in Orchard Hills landfill is greater than that of waste at 8 m depth in this study because the MSW in Orchard Hills landfill contained 26.6% of non-biodegradable waste, which is higher than that in this study. Powrie and Beaven (1999) estimated that correlation between compression (x) and dry density of household waste (y), which was used to implicate liquid flow in landfills, was expressed by ‘y = 0.1277 ln(x) + 0.4997’. According to them, the dry density was evaluated to be strongly influenced by the landfilled depth of waste. The dry density with compression was affected by depth in the landfill, but it depended on the waste composition significantly.
Relationship between bulk density and hydraulic conductivity
To estimate the relationship between bulk density and hydraulic conductivity, the waste composition was used at an average value and moisture content was controlled between 30% and 50%. The relationship between the hydraulic conductivity and the bulk density can be described by the exponential equation. The exponential equation has been converted to natural logarithms and it is shown in Figure 3(a). The relationship between the bulk density (y) and the hydraulic conductivity (z) can be described by an exponential equation, such as ’ln(z) = A2 y + B2’ where A2 and B2 are coefficients of the hydraulic conductivity. The relationship between the hydraulic conductivity and the bulk density is expressed as ‘ln(z) = −5.5629y – 3.6557’ at 30% of moisture content and ‘ln(z) = −6.1822y – 0.7732’ at 50% of moisture content. To obtain the generalised equation according to the moisture content in the relationship between the bulk density and the hydraulic conductivity, the coefficients A2 and B2 can be considered a linear equation. The coefficient of A2 and B2 in the relationship between the bulk density and the hydraulic conductivity is shown in Figure 3(b). The A2 is evaluated to be ’A2 = −0.0310M – 4.5537’ where ’M’ is moisture content. Also, B2 is estimated to be ’B2 = 0.1441M – 8.0460’. Finally, the relationship between the bulk density and hydraulic conductivity was estimated in a generalised formula at the bioreactor landfill, as shown in equation (4):

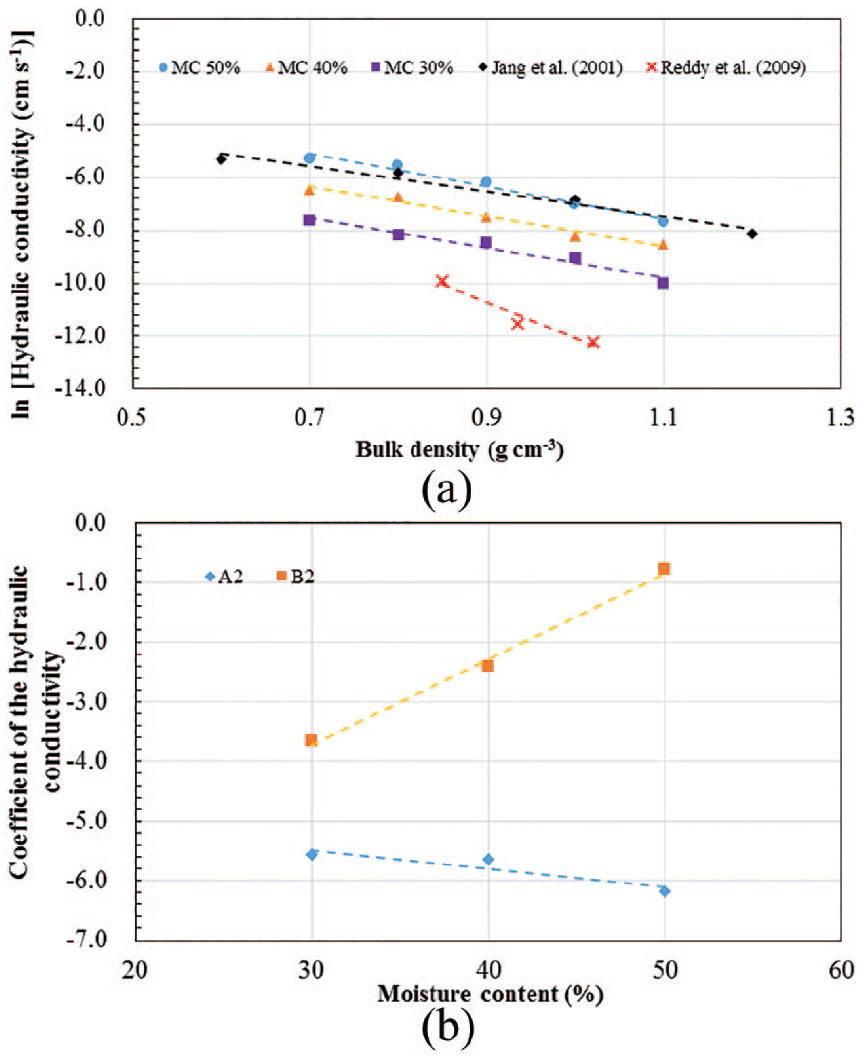
The relationship between the bulk density and the hydraulic conductivity. (a) Relationship between the bulk density and the hydraulic conductivity. (b) Relationship between the coefficients of the exponential equation in (a).
Jang et al. (2001) reported the relationship between the bulk density and the hydraulic conductivity using landfilled wastes in Kimpo Metropolitan Landfill (Korea). They found that the relationship was expressed by an equation of ‘ln z = −4.7729y ‒2.2310’. Reddy et al. (2009) were reported that the relationship between the hydraulic conductivity and the bulk density was described by an equation of ‘ln z = −13.5450y + 1.4567’. The relationship between the hydraulic conductivity and the bulk density can be greatly depending on the waste composition.
Relationship between hydraulic conductivity and waste weight load
The relationship between the hydraulic conductivity and the waste weight load can be evaluated using the relationship between the waste weight load and the bulk density (equation (3)) and the relationship between the bulk density and the hydraulic conductivity (equation (4)). The generalised equation for the relationship between the hydraulic conductivity and the waste weight load is expressed by putting equation (3) into equation (4), as shown in equation (5):
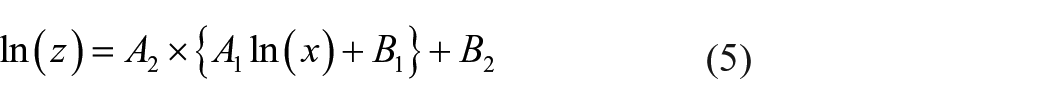
where, z is the hydraulic conductivity, x is the waste weight load and A1, A2, B1, B2 are coefficients. An exponential equation can express the relationship between hydraulic conductivity and the waste weight load. Therefore, since B3 is a negative number, the hydraulic conductivity is decreased exponentially by increasing the waste weight load.
Moisture content in each waste layer
The relationship between the waste characteristics and the moisture content of the landfilled waste was examined and moisture content was used as an important factor. To estimate the migration characteristics of leachate, the moisture content of each waste layer is shown in Figure 4. The moisture contents in layer W5 to layer W7 were measured, and those in layer W1 to layer W4 were obtained by linear regression analysis using the measured data. In the reference zone, the moisture content of landfilled waste increased from 26.2% in layer W7 to 35.5% in layer W1. From the year 2002 to 2016, the moisture content of the landfilled wastes into the bioreactor landfill was about 21.9% (Sudokwon Landfill Site Management Corporation, 2017). During the same period, average annual precipitation in the bioreactor landfill site was 1237 mm. It was estimated that about 15% of the precipitation infiltrated into the landfill (Rhee, 2017). In the leachate recirculation zone, the moisture content of landfilled waste in layer W7 was 36.9% in 3-C zone and 29.7% in 4-C zone, respectively. In layer W1, the moisture content of landfilled waste was 49.8% in 3-C zone and 42.9% in 4-C zone, respectively. This indicates that the moisture content in the leachate recirculation zone was greatly increased compared with that in the reference zone. The 3-C zone with a large amount of leachate recirculation contained approximately 2.28 million tonnes of waste, and the recirculation amount of leachate was approximately 75,600 m3 for 1 year. The moisture content of the 3-C zone could be increased up to about 3% owing to leachate recirculation. However, the moisture content of the 3-C zone was over 10% larger than the moisture content of the reference zone because the sampling area was near the leachate recirculation pump.
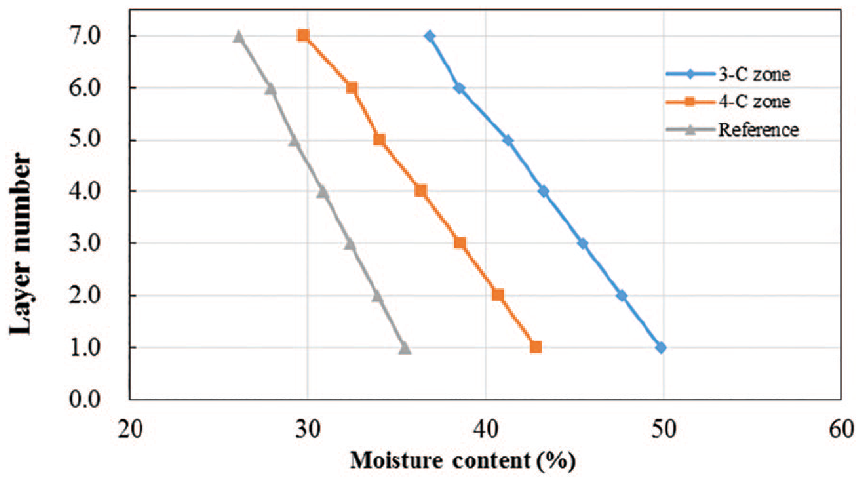
The moisture content of each waste layer in leachate recirculation and the reference zone.
Zornberg et al. (1999) analysed the moisture content of wastes in situ for up to a depth of about 60 m in a landfill located in southern California. They reported that the moisture content was generally in the range of 10% to 40% (average 28%), and the moisture content tended to increase linearly with an increasing depth of landfilled waste. Kumar et al. (2009) assessed the moisture content of landfilled waste using resistance-based sensors (RBS) by injecting 23,700 m3 of water into 0.60 million tonnes of wastes at New River Regional Landfill (NRRL) in Florida, USA. They reported that the moisture content of landfilled waste increased from 27.4% to 44.4%. If 23,700 m3 of water was added to 0.60 million tonnes of wastes, the moisture content should be increased to 30.2%. Since RBS is located within 8 m from the vertical wells injecting water, the moisture content was as high as 44.4%. Also, Kumar et al. (2009) reported that the moisture content in the bioreactor landfill increased from 23% at a depth of 4.5 m to 46% at a depth of 15 m.
Depth reduction of the waste in each waste layer
Since wastes in the bioreactor landfill were compressed by its self-loading weight, the depth reduction of the wastes is highly dependent on the bulk density and depth of landfilled waste. When waste was landfilled in the Sudokwon landfill site, the compaction was carried out using a 10 t vibration roller (Sudokwon Landfill Site Management Corporation, 2015). The depth reduction of the waste was performed by a waste weight load and a load by the vibrating roller. The load by the vibrating roller had a significant influence on the compression of the waste at the upper part of the landfill, and the effect was smaller owing to the dispersion of the load as it went downward (Kazimierowicz-Frankowska, 2007; Love et al., 1987). Therefore, the load by the vibrating roller was not considered to estimate the depth of each waste layers at the bottom. To evaluate the depth of each waste layer, the measured bulk density was used in upper layers (layer W5 to W7) and the bulk density in bottom layers (layer W1 to W4) was estimated as shown in Figure 2. The depth reduction of each waste layer according to equation (2) and equation (3) is shown in Figure 5. In the leachate recirculation zone, the total depth of waste layers is estimated to decrease from 33.2 m to 28.3 m in the 3-C zone and 28.9 m in the 4-C zone. The reduction rate of total depth for waste layers is estimated to be 14.7% in the 3-C zone and 12.7% in the 4-C zone, respectively. The total depth of waste layers in the reference zone was estimated to decrease from 33.2 m to 29.3 m. In the reference zone, the reduction rate in depth was only 11.5%. It indicates that the wastes are more compressed by increasing the amount of recirculated leachate and the waste weight load.
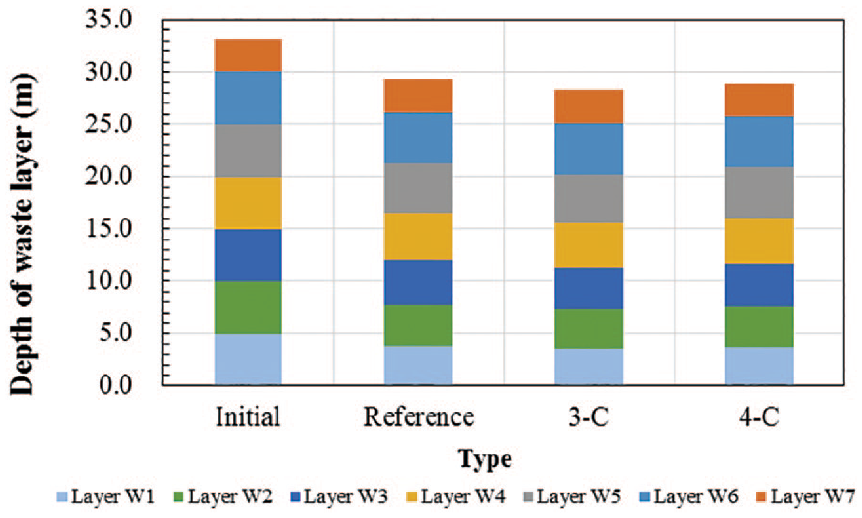
The depth of waste layer in a bioreactor landfill.
Migration characteristics of leachate
Hydraulic conductivity expressed the migration characteristic of leachate in each layer, as shown in Table 5. The hydraulic conductivity of each waste layer could be estimated by equation (5). The hydraulic conductivity of the waste layer in the 3-C zone was estimated to increase from 1.03 × 10⁻³ cm s-1 in layer W7 to 1.38 × 10⁻³ cm s-1 in layer W5. The hydraulic conductivity of the waste layer in 3-C was estimated to decrease from 1.38 × 10⁻³ cm s-1 in layer W5 to 9.10 × 10⁻⁴ cm s-1 in layer W1. This trend was similar to the 4-C zone and the reference zone. The hydraulic conductivity in the unsaturated zone decreased by increasing the bulk density of landfilled waste and increased by increasing the moisture content of wastes. The increase rate in hydraulic conductivity owing to the increase of moisture content in the low moisture content region, such as layer W5 to W7, is larger than that owing to the increase of moisture content in the high water content region, such as layer W1 to W4 (Jackson et al., 1965; Kazimoglu et al., 2006; Meerdink et al., 1996). The decreased rate in hydraulic conductivity with an increasing bulk density of landfilled waste was relatively constant (Jang et al., 2001; Reddy et al., 2009; Rhee, 2017). Therefore, the hydraulic conductivity in layer W5 to W7 was greatly influenced by the increase of moisture content, while the hydraulic conductivity in layer W1 to W4 was greatly influenced by bulk density.
The hydraulic conductivity of the waste layer and cover material after leachate recirculation.
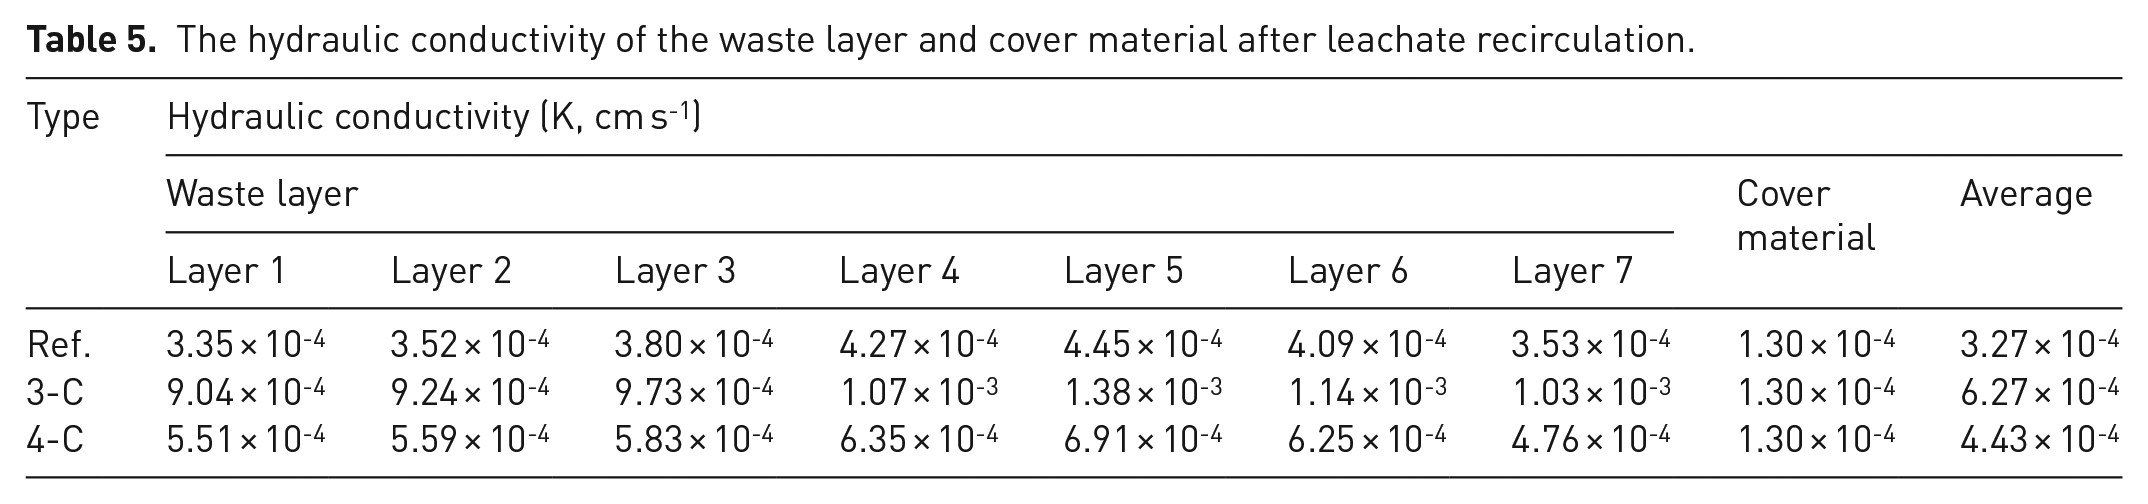
The average hydraulic conductivity of the bioreactor landfill, including the cover material and waste layers, was estimated by equation (1). Since the hydraulic conductivity of cover material was measured to be 1.30 × 10⁻³ cm s-1, the average hydraulic conductivity in the leachate recirculation zone was estimated to be 6.27 × 10⁻⁴ cm s-1 in the 3-C zone and 4.43 × 10⁻⁴ cm s-1 in the 4-C zone, respectively. In the reference zone, the hydraulic conductivity was estimated to be 3.27 × 10⁻⁴ cm s-1, which was smaller than the leachate recirculation zone. The average hydraulic conductivity was similar to the designed value of the hydraulic conductivity (5.36 × 10⁻⁴ cm s-1) in the bioreactor landfill site (Sudokwon Landfill Site Management Corporation, 2011).
Durmusoglu et al. (2006) conducted the hydraulic conductivity test for MSW in Rock Prairie Road Landfill in Texas, and the range of hydraulic conductivity was estimated from 4.70 × 10⁻⁴ cm s-1 to 1.24 × 10⁻² cm s-1. Wysocki et al. (2003) estimated the hydraulic conductivity for a MSW landfill in New York using a variety of pumping tests and reported that the hydraulic conductivity was estimated from 1.2 × 10⁻⁵ cm s-1 to 6.3 × 10⁻⁴ cm s-1. Hence, it is found that the hydraulic conductivity in this study is within the range of the hydraulic conductivity of MSW landfills in other literature.
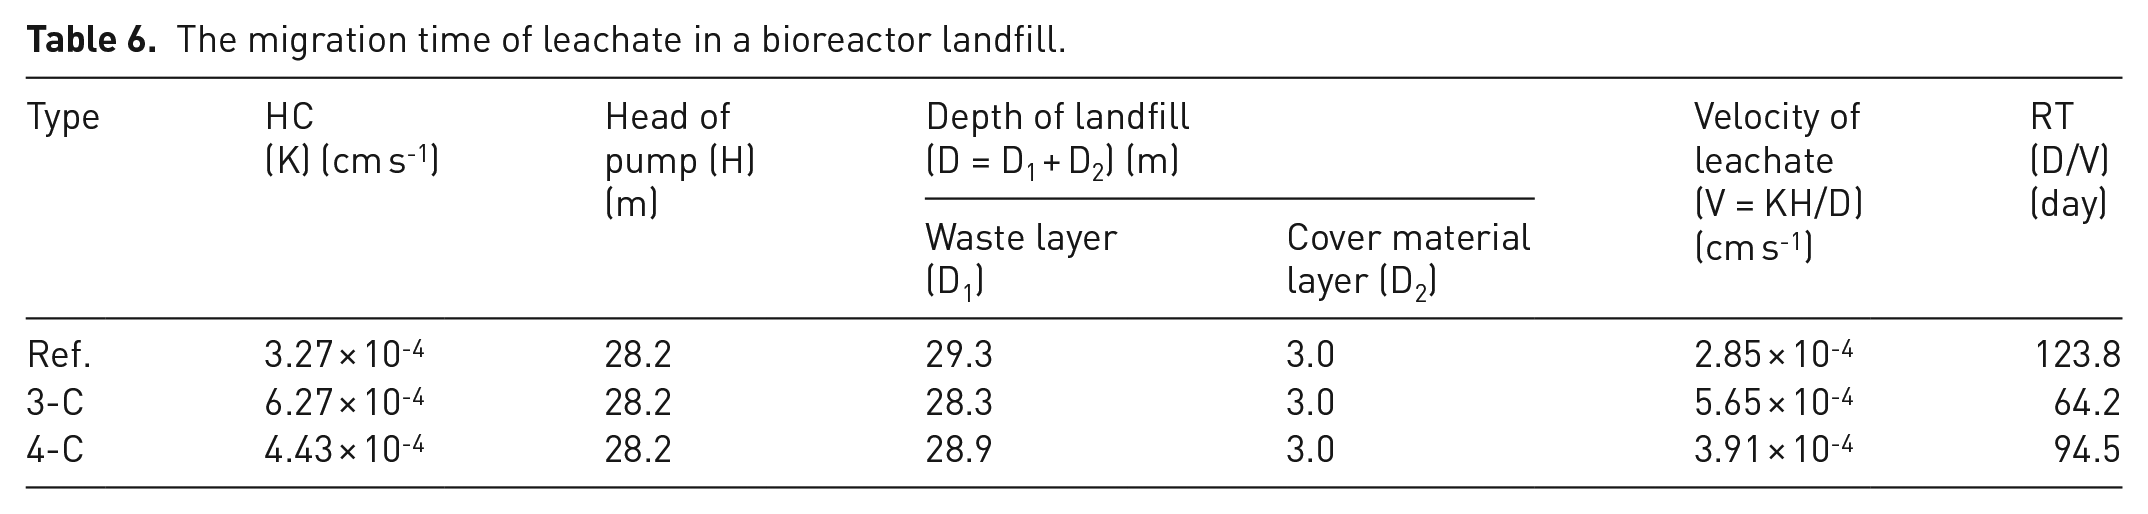
The migration time of leachate in the bioreactor landfill is shown in Table 6. The velocity of the leachate in the bioreactor landfill was estimated by Darcy’s law (Darcy, 1856). The water head of the leachate recirculation pump was estimated to be 28.2 m, and the velocity of the leachate in the recirculation zone was evaluated to be 5.65 × 10⁻⁴ cm s-1 in the 3-C zone and 3.91 × 10⁻⁴ cm s-1 in the 4-C zone, respectively. The velocity of the leachate in the reference zone was estimated to be 2.85 × 10⁻⁴ cm s-1, which was slower than the leachate recirculation zone. The migration time of leachate in the leachate recirculation zone was estimated to be 64.2 days in the 3-C zone and 94.5 days in the 4-C zone, which were very small compared with that in the reference zone (123.8 days). Therefore, the increase in the amount of leachate accelerated the velocity of leachate. Fellner et al. (2009) evaluated the migration time of leachate by injecting leachate containing uranine as a tracer at the landfill in Austria. They found that it took about 2 months for the tracer to move from the 12 m depth of the landfill.
The migration time of leachate in a bioreactor landfill.
Conclusion
To estimate the migration characteristics of leachate at the bioreactor landfill, the characteristics of waste, such as waste composition, the bulk density, waste weight load, moisture content and hydraulic conductivity, was estimated. The study showed the following.
The average composition of landfilled wastes in the Sudokwon landfill site was 81.8% of biodegradable waste and 18.2% of non-biodegradable waste. However, the landfilled waste composition can be varied by area and depth in the landfill site.
As waste weight load was increased, the bulk density increased logarithmically and as the bulk density increased, the hydraulic conductivity was decreased exponentially. Through these relationships, generalised equations have been established that hydraulic conductivity was decreased exponentially by increasing the waste weight load.
As depth of landfilled waste increased, the moisture content of the waste in the 3-C zone was increased from 36.9% (layer W7) to 49.8% (layer W1) and the moisture content of the waste in the 4-C zone was increased from 29.7% (layer W7) to 42.9% (layer W1).
The reduction rate for the depth of the waste layer was estimated to be 14.5% in the 3-C zone and 12.7% in the 4-C zone. Since the wastes were compressed by the waste weight load including the weight of recirculated leachate, the reduction rate for the depth of waste layer in the 3-C zone was greater than the reduction rate for depth of waste layer in the 4-C zone.
The hydraulic conductivity considering the waste weight load, the bulk density and the moisture content was estimated to be 6.27 × 10⁻⁴ cm s-1 in the 3-C zone and 4.43 × 10⁻⁴ cm s-1 in the 4-C zone, respectively. Therefore, the migration time of leachate was estimated to be 64.2 days in the 3-C zone and 94.5 days in the 4-C zone, respectively.
Footnotes
Declaration of conflicting interests
The author(s) declared no potential conflicts of interest with respect to the research, authorship, and/or publication of this article.
Funding
The author(s) disclosed receipt of the following financial support for the research, authorship, and/or publication of this article: This work was supported by Kyonggi University Research Grant 2017.