
Abstract
Landfill mining is a prospective tool for the recycling of valuable materials (waste-to-material) and secondary fuel (waste-to-energy) from old, therefore more or less stabilised municipal solid waste landfills. The main target of Horizon 2020 ‘SMARTGROUND’ R&D was improving the availability and accessibility of data and information from both urban landfills and mining dumps through a set of activities to integrate all the data – from existing sources and new information retrieved with time progress – in a single EU database. Concerning urban landfills, a new sampling protocol was designed on the basis of the current Hungarian national municipal solid waste analysis standards, optimised for landfill mining. This protocol was then applied in a sampling campaign on a municipal solid waste landfill in Debrecen, Hungary. The composition and parameters of the landfilled materials were measured as a 12-year timescale. The total wet and dry mass of the valuable components possible for utilisation was estimated.
Introduction
Secondary raw materials are becoming more and more important for the EU economy in the spotlight of a circular economy. Rational waste management practices could lead to a more efficient use of raw materials and to the waste reduction. If considering that in Europe there are about 150,000–500,000 landfills, the EU secondary raw materials potential is very significant. The deposited wastes, especially many residual municipal solid waste (RMSW) landfills, represent a large amount of secondary raw materials for later utilisation, as well as environmental problems. The ‘landfill mining’ concept targets the extraction, processing and primary commodity materials recycling from the deposited wastes (Hernández Parrodi et al., 2018). Decomposition processes in municipal solid waste (MSW) landfills result in the formation of heat, leachate and landfill gas (Faitli et al., 2015a, 2015b). After a certain time period, the majority of the biologically degradable components will decompose, therefore the environmental hazard potential decreases and the landfilled useful materials could become more accessible. Secondary raw materials are getting a more and more important role in waste-to-material and waste-to-energy production. Recently, recultivated landfills have contained a large amount of non-degradable materials, which could be utilised as secondary raw materials or fuels (Krüse, 2015). There are many case studies in the literature reporting data of technical and economic considerations about possible landfill mining (Hermann et al., 2014; Hernández Parrodi et al., 2018; Krook et al., 2012; Tielmans and Laevers, 2010; Wolfsberger et al., 2015). It is obvious that lots of information about the materials and their conditions is necessary for being able to decide whether it would be worth mining a landfill and to design the mining and processing technologies. Furthermore, the analytical methods have to be developed and optimised for this task. Such sampling methods as reported by Aldrian et al. (2016) and Faitli et al. (2018) can be good starting points, but these methods have to be adapted for such a specific task. If sampling serves enough information, cost-benefit analysis can be performed (Krüse, 2015; Zhou et al., 2015) for economic considerations. The work of Zhou et al. (2015) applied a cost-benefit analysis model for assessing the economic feasibility, which is important for promoting landfill mining. Their model includes eight indicators of costs and nine indicators of benefits. Four landfill-mining scenarios were designed and analysed based on field data. The economic feasibility of landfill mining was then evaluated by the indicator of net present value. If sampling serves enough information, the real challenge is the development of the technology by which the exploited material can be processed and commodity materials can be produced for later utilisation. According to Krook et al. (2012), simple soil excavation and screening equipment have typically been applied, often demonstrating moderate performance in obtaining marketable recyclables, but there are more advanced options too. Hernández Parrodi et al. (2018) summarised the state-of-the-art of landfill mining in a recent article focusing on the results of many landfill analyses and especially focusing on the processing and utilisation options of the fine fraction.
This article focuses on the sampling and analyses of the MSW landfill in Debrecen as a case study on the basis of a newly developed sampling and sample preparation protocol. Material composition of the landfill and its variations, as well as the estimation of the total amount of various material categories is presented.
Area of case study, the RMSW landfill in Debrecen
The examined RMSW landfill is located in the south-western part of Debrecen (East-Hungary) over a total area of about 230,000 m2 (GPS: North 47.491882; East 21.595435). A.K.S.D. Ltd, the operator of the Debrecen landfill, was established in 1991 (51% Austrian and 49% city municipality ownership). Its main activity is transportation, processing and disposal of MSW according to European standards arisen in Debrecen and its agglomeration. This company also collects and handles wastes from industrial sources to a lesser extent. The Regional Waste Management Facility of Debrecen was established in 1991 and a 20.1-ha area for waste disposal landfill (with combined insulation system) was built. Figure 1 shows the schematic map of the Debrecen RMSW landfill. At the time of sampling, landfill sections III and IV were fully uploaded and more than 10m in depth of RMSW had been landfilled into landfill section V.
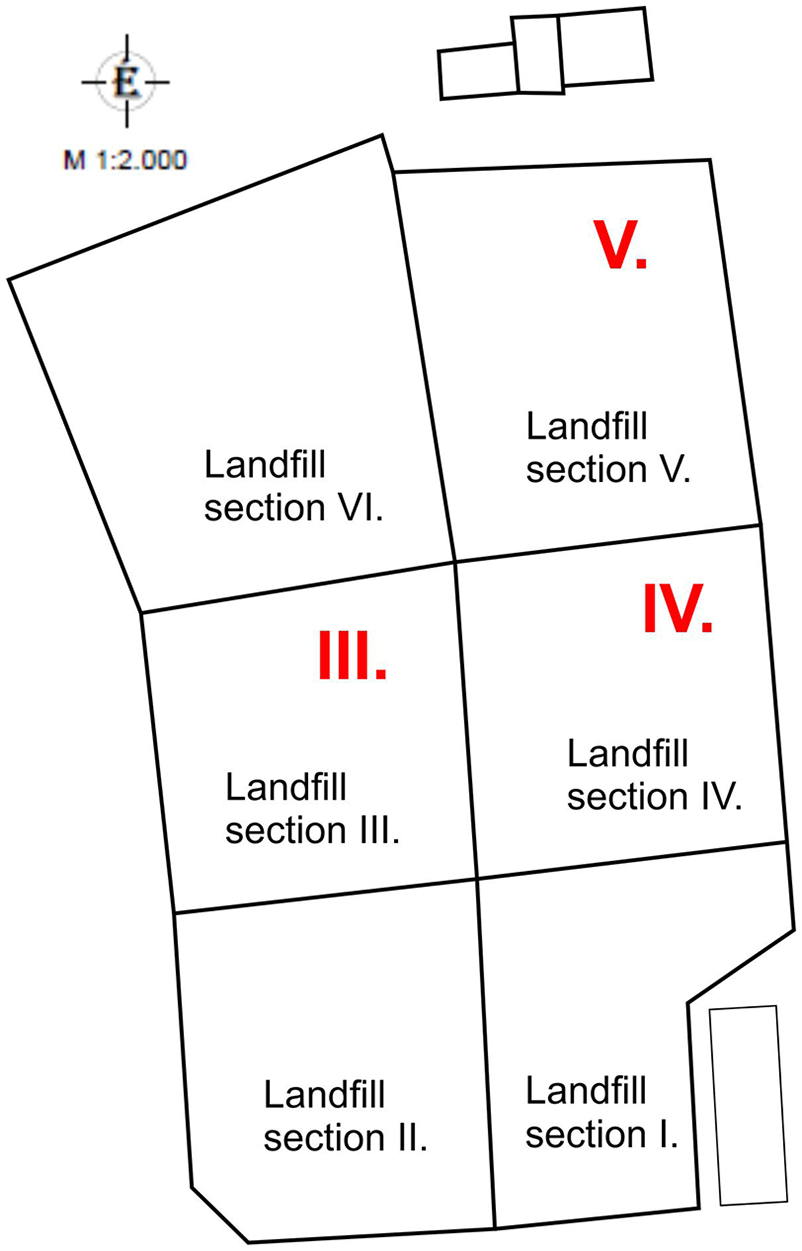
Schematic map of the Debrecen RMSW landfill.
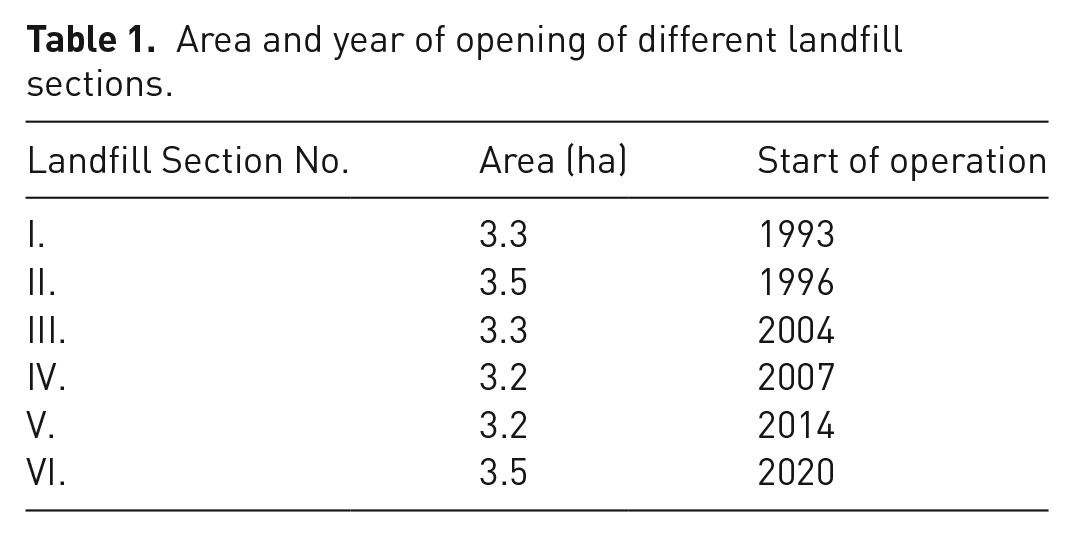
Active use of the first 3.3-ha area section of the landfill was started in 1993 and then it was followed by further sections (Table 1).
Area and year of opening of different landfill sections.
Approximately 2,423,970 m3 (3,746,090 t) of waste was landfilled into sections I–V until the end of 2016. It means that the average annual landfilling waste amount was 162,800 t. The designed maximal height of this landfill is 25 m, measured from the insulation layer, so the capacity of sections I–VI together is totally near 4.2 million m3. Assuming the same annual amount of deposition, the landfill will be closed in 2028. The following types of wastes had been deposited in the landfill.
Residual MSWs, landfilled without sorting and preparation, originated from Debrecen and its agglomeration (annual amount: 60–70 kt y−1).
Non-hazardous industrial wastes (drilling sludge, scrap products, insulation materials, packaging, other production wastes (10–15 kt y−1).
Inert wastes, their annual amount has decreased from 50–60 t to 20 t y−1 recently. Reasons of the decrease are the so-far built processing capacities and the introduced state landfilling fee. Separate collection of packaging materials (dry or non-contaminated by food wastes) was introduced in Debrecen only in 2014.
Materials and methods
Standard sampling protocols
The quality and quantity of the generated MSW changes all around the globe, so the applied sampling methods are different too. One of the first European standards was probably the French standard NF X30-413 (2006) derived from the MODECOM methodology. The MODECOM methodology was developed on the basis of Gy’s (1979) sampling theory. This method is based on collecting vehicles sampling. Another generally applied method is the so-called SWA-Tool developed by a European project consortium (EU Project Report, 2004). Weichgrebe et al. (2017) carried out a detailed RMSW sampling campaign in West-Zone Bangalore, India, on the basis of the SWA-Tool and the German Standard LAGA PN 98 (2001). AbdAlqader and Hamad (2012) carried out a RMSW campaign in the Gaza Strip based on the previous version of the ASTM D5231-92 (2016) Standard. These standards give guidelines about the stratification of the examined population, the substance of sampling (e.g. collecting vehicles or collecting bins), the number and quantity of single and mixed (average) samples, the sorting and screening protocol, the sorted material categories and sub-categories, the taking and preparation of sub-samples for drying and chemical analysis and so on. The comparison of the results of the different methods is difficult, because of the different definitions of the methods and terms. For example, each mentioned protocol defines the so-called ‘fine’ material category, but the size differs (<20 mm in NF X30-413, <14 mm according to Weichgrebe et al. (2017), <10 mm in SWA-Tool, etc.). It is clear that everyone has to follow its own national requirements.
The current Hungarian Standards MSZ 21420 Parts: 28 and 29 (2005) regarding the analysis of MSWs were introduced in 2005. The developed sampling protocol – applied here – optimised for analysing earlier landfilled waste is based on these standards; therefore it is appropriate to briefly describe them. The Hungarian Standards are based on Gy’s sampling theory and the MODECOM methodology (Gy, 1979), but details were tailored to the Hungarian situation in 2005. Waste collecting vehicles were selected for sampling. The raw sample in a vehicle characterised the sector (lot or stratum), namely the area from where the waste had been collected. The total unloaded waste had to be put over by a ~250-L volume bucket loader. Randomly, 10 increments (single samples) were selected and mixed together forming the gross (averaged or simply the average) sample. In this way, the minimal mass of the average sample of MSW was 500 kg, comprising ten 50-kg single samples (MSZ 21420-28). The flowsheet of the standard average sample preparation is shown in Figure 2 (MSZ 21420-29).
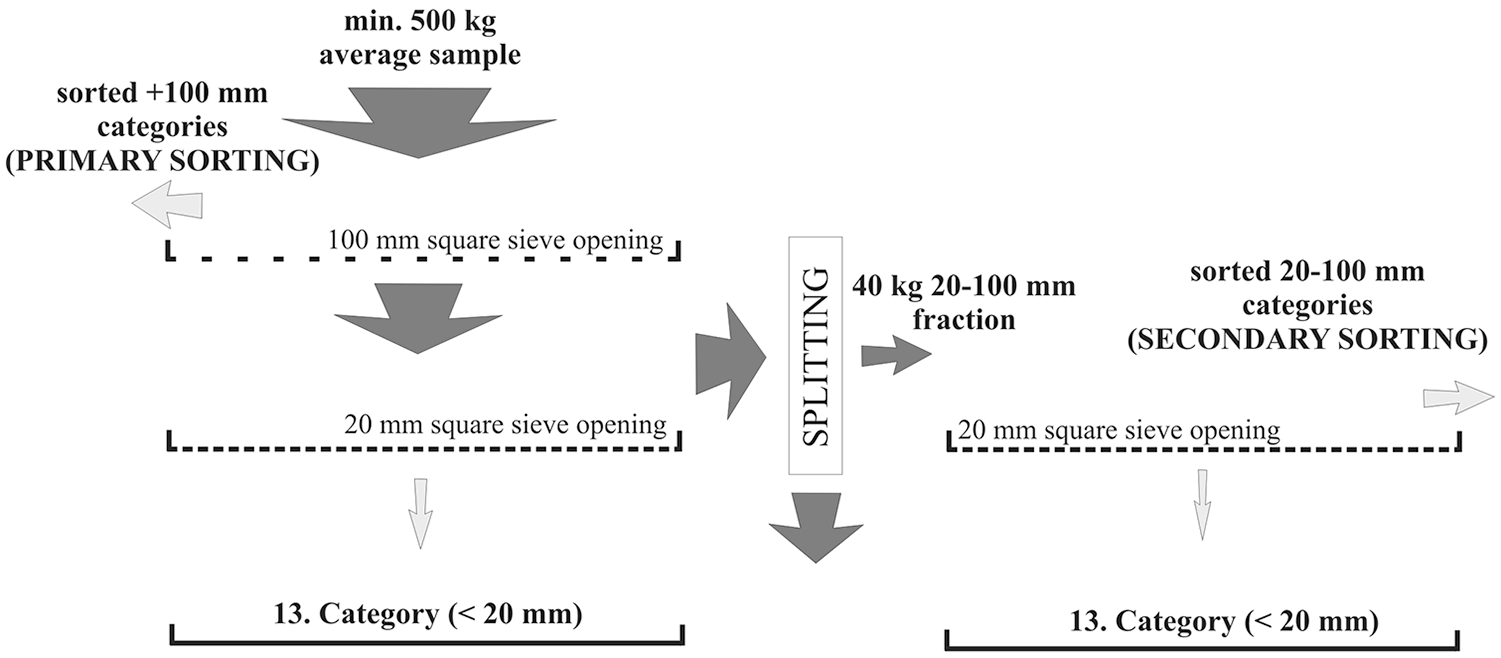
Sampling protocol according to Hungarian Standards MSZ 21420 Parts: 28 and 29.
The sample preparation consisted of two parts, namely the primary and the secondary sorting. During the primary sorting, a 100-mm square opening sieve was positioned on top of a frame, below there was a 20-mm square opening sieve and underneath there was a tray. The total average sample was fed partially onto the 100-mm sieve. During simultaneous sorting and sieving the oversize fraction was sorted into 12 material categories. The standard material categories according to the MSZ 21420 Parts: 28 and 29 Standards are: 1, Bio (biologically degradable materials, food residues, plants, etc.); 2, Paper; 3, Cardboard; 4, Composite (multi-components layered packing materials); 5, Textile; 6, Hygienic (diaper, tampon, tissue paper, etc.); 7, Plastics; 8, Combustible (other uncategorised combustibles, wood, leather, etc.); 9, Glass; 10, Metals; 11, Non-combustible (other uncategorised non-combustibles or inert, stone, brick, etc.); 12, Hazardous (medicine, batteries, etc.). The 13th material category was the 20-mm square openings sieve undersize, called fines. According to the sample nomogram for MSW the minimal processed mass for the 20–100 mm size fraction was lower, therefore this fraction could be split, and only a 30–40 kg subsample should be fed onto the 20 mm square openings sieve for the secondary sorting. The dry substance composition had to be measured by drying of the given quantities of each category in a heated chamber at 105°C until mass equilibrium. The necessary minimal masses for dry matter and chemical analyses were 20 kg of the Bio; 4.5 kg of the Fine and 2 kg of all other material categories. If someone wanted to measure a mechanical, biological or chemical property of the sampled MSW, the laboratory analytical samples would have to be prepared using the sorted material categories separately. The quantity and quality, namely the particle size of a given analytical sample was determined by the applied laboratory instrument. However, as a rule of thumb, the subsample of each examined material category has to be ground below 1 mm. The suitable comminution device depends on the material; cutting mills, planetary ball mills, crushing rolls, rotary shredders, etc. are generally used. After the sample preparation of each material category, only the prepared individual powders could be mixed again according to their measured mass concentrations. This mixed powder was then supplied to the laboratory for the analysis.
Development of a new sampling protocol for landfill mining
In the spotlight of landfill mining, the so-far-described standard sampling protocol (MSZ 21420 Parts: 28 and 29) needed to be modified and optimised for the given task.
Tailoring the taking of the average sample into cases of old landfills instead of collecting vehicles.
Improving the average sample preparation protocol: Adopting it for the dirty state of material in old landfills.
Improving the average sample preparation protocol: Optimising screening, sorting and splitting, when only the minimum but statistically correct amount of subsamples are processed in all steps.
Tailoring the sorted material categories as a function of size fractions for the main aims of landfill mining, namely waste-to-material and waste-to-energy.
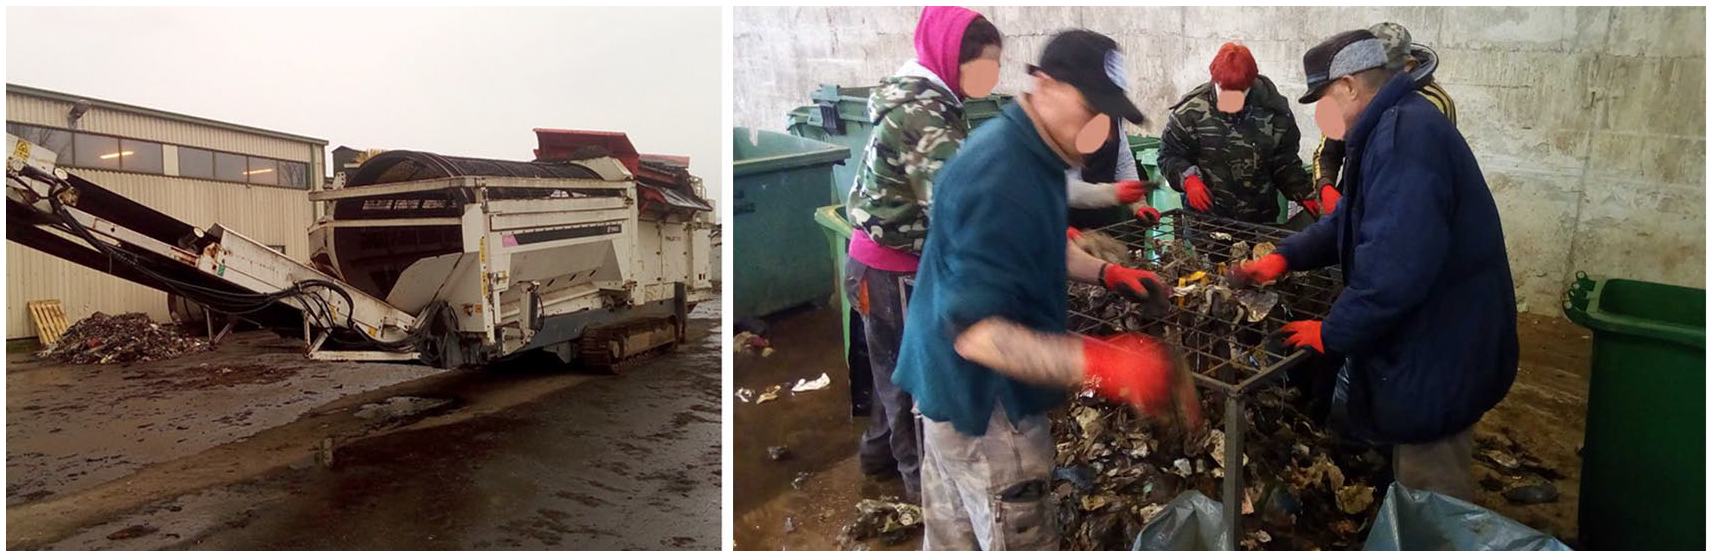
The average sample could not be taken with the application of a bucket loader; the suitable tool might be an auger. Core drilling is widely applied for geological surveys, but there might be technical problems during drilling of the non-brittle MSW. Figure 3 (left) shows a machine equipped with a screw auger applied for the construction of landfill gas wells.
Auger (left) and average sample III/M (right).
The 0.8-m diameter screw rotates in the material. It is then – with the sample – torn out upward by the machine. In this way, the various depths of landfill could be sampled. In addition to the standard analysis, it was necessary to measure material composition as a function of some discrete size fractions too. This knowledge is necessary for the design of the waste processing technology of valuable materials. Figure 3 (right) shows the III/M (borehole in landfill section III, middle part) sample as an example. This sample was wet and dirty; therefore, the handsorting of it was rather difficult. For this reason, the application of a drum sieve was beneficial because it loosened the material and the dirty fine fractions could be removed as well. This method increased the safety of the sorting workers and the accuracy of sorting too. Figure 4 shows the designed flowsheet for the average sample preparation.
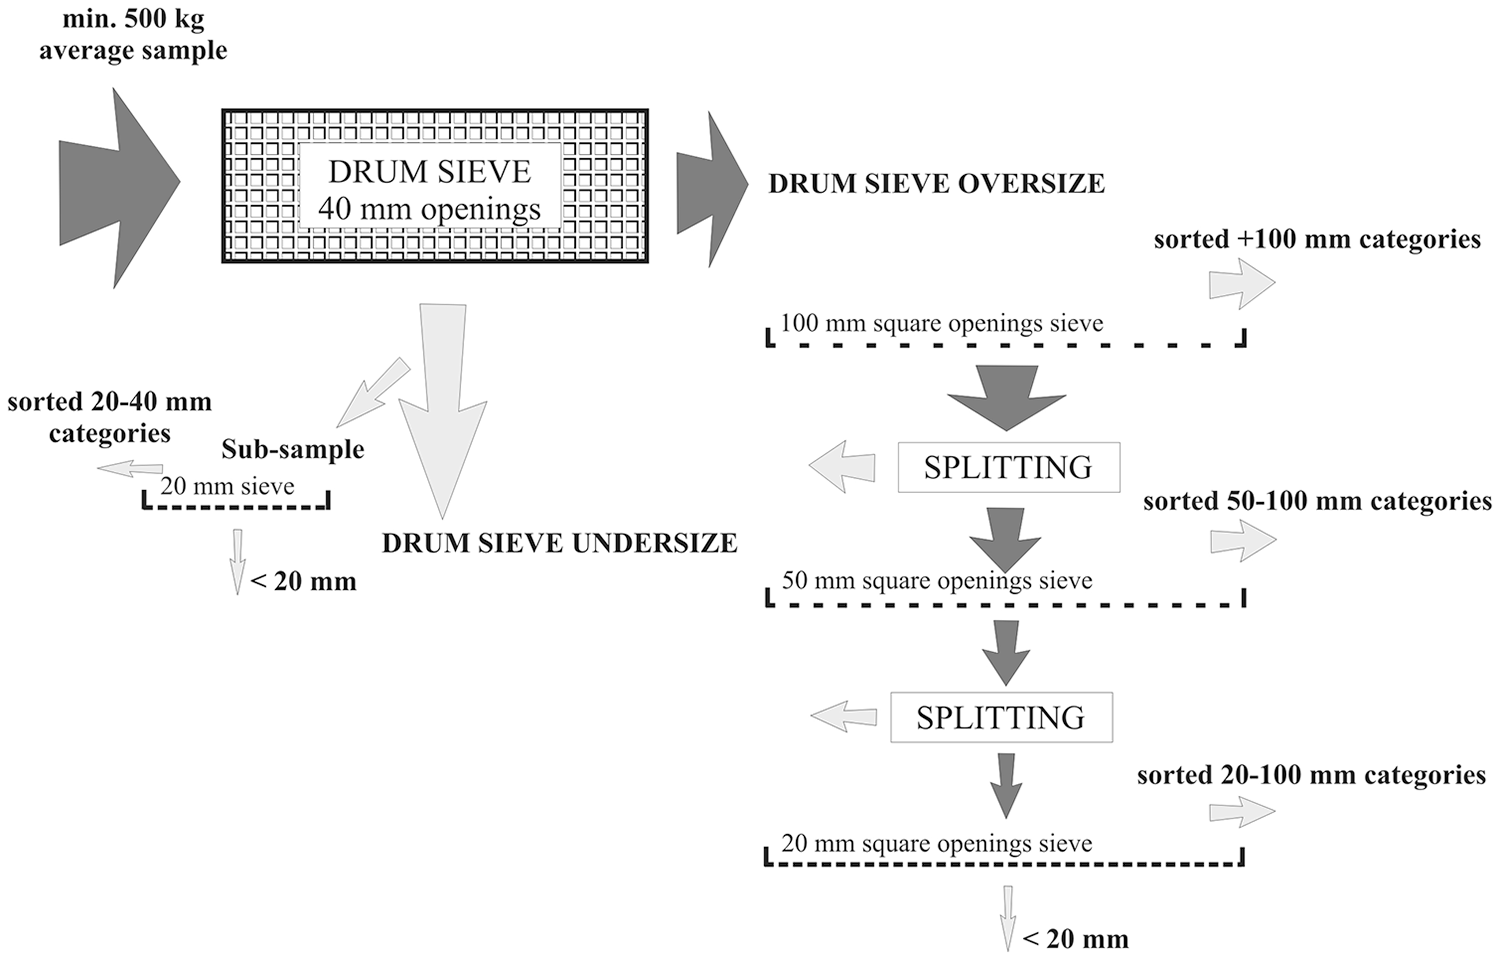
The developed sampling protocol for landfill mining.
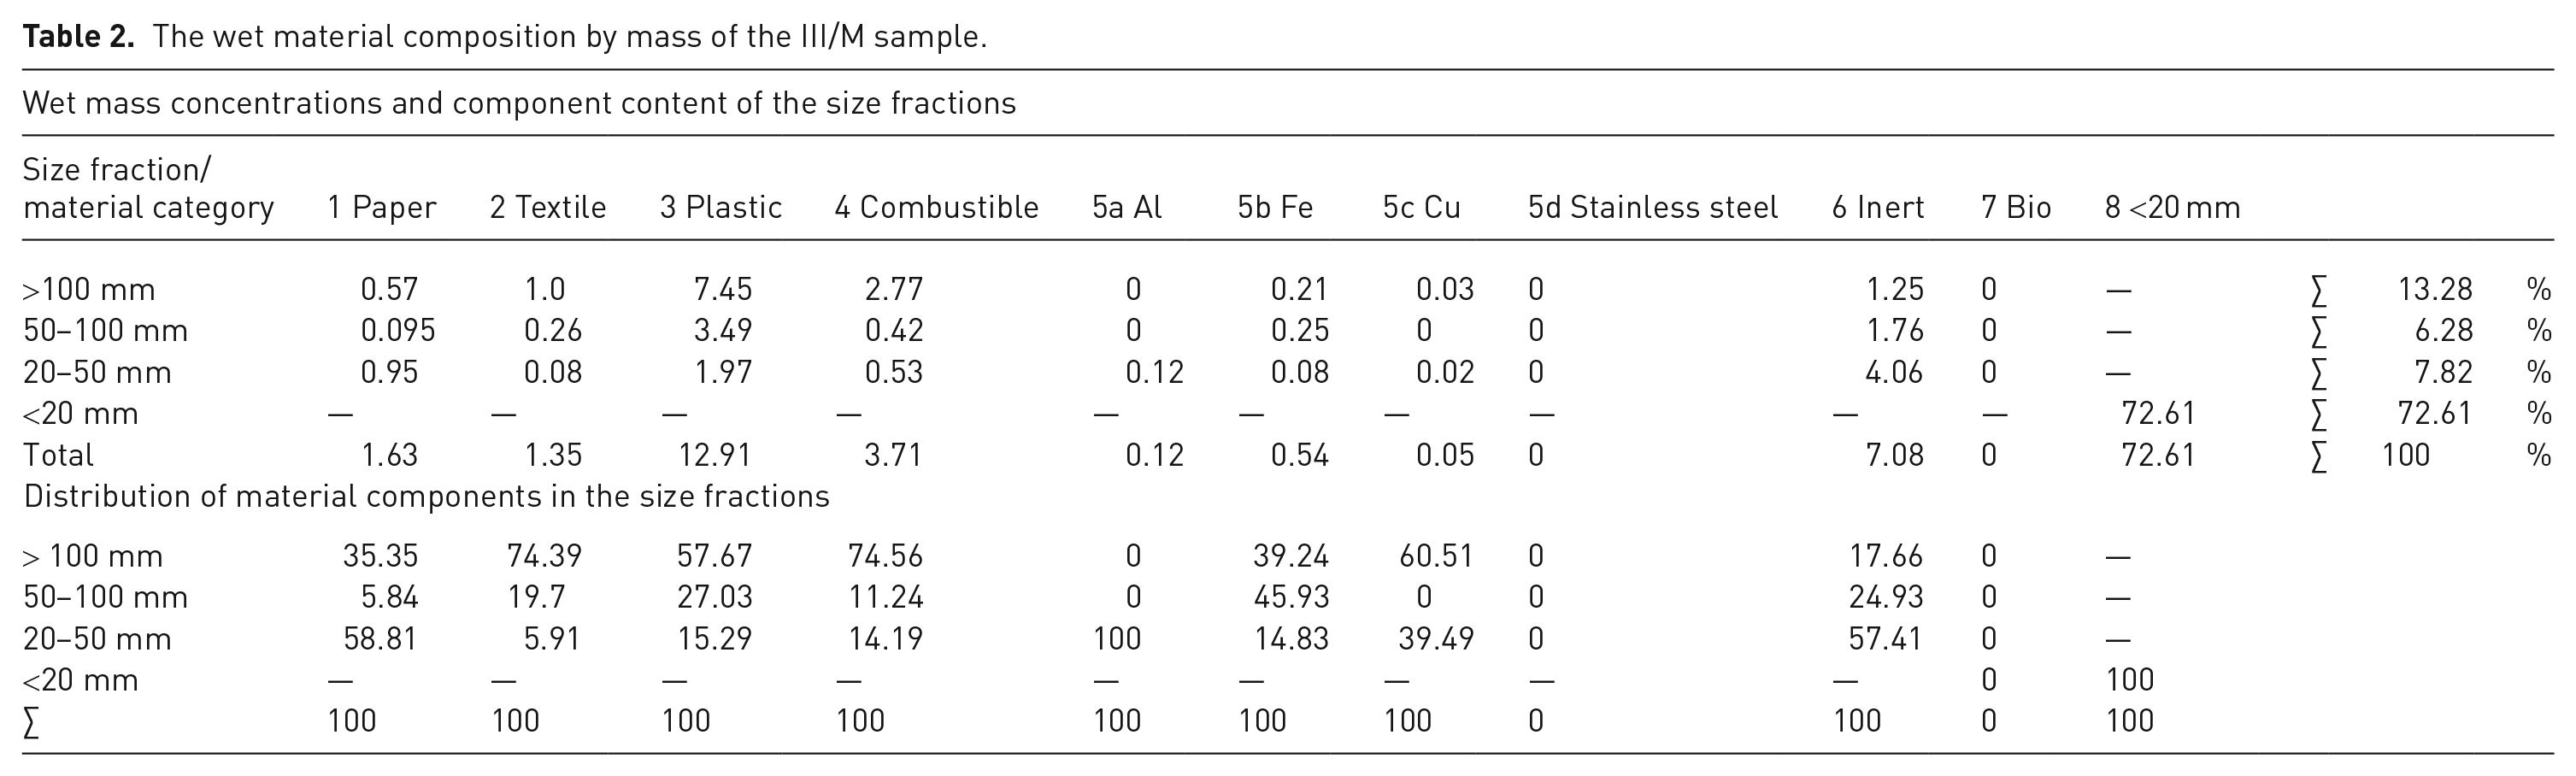
Each average sample gained from the drilling was sieved by a drum sieve machine equipped with 40 × 40 mm square openings (Figure 5, left). The mass of the total drum sieve undersize (<40 mm) fraction was measured by an appropriate scale. A minimum 5 kg sub-sample was taken from this material stream at the drop-off end of the belt conveyor. This 5 kg <40 mm subsample was sieved at 20 mm and the 20–40 mm fraction was hand sorted. The total drum sieve oversize (>40 mm) fraction of the average sample was processed as follows. The sample was gradually sieved and hand sorted simultaneously from coarser into finer particle sizes. Simple 1.2 × 1.2 m sieve frames were used; the applied square opening sizes were 100, 50 and 20 mm. This is a ‘2’ sieve series, where the width of size fractions practically doubles. The most important advantage of the developed average-sample-preparation protocol shown in Figure 4 is that only the minimal, but still statistically correct quantities, of subsamples were processed in every preparation step. The new protocol (Figure 4) is principally different from the standard one (Figure 2). The mass of each sample portion was measured during its feeding into the analysis according to the standard one (Figure 2). On the contrary, the mass of the analysed sample portions (sorted and split components as well) was measured after processing. Therefore, the evaluation of the new protocol was a little bit harder, because the split and thrown out coarser fractions contained finer particle size fractions too, but this could be solved during the build-up of the complete mass balance of the sample. The sorted material components and their numbering are shown in Table 2. The number of the standard material categories (MSZ 21420 Parts: 28 and 29) was considerably reduced, because the two most important aims of landfill mining are the waste-to-material and waste-to-energy. The sorted material categories were as follows: 1. Paper (paper, carton, composite together); 2. Textile (textile, clothes); 3. Plastic; 4. Combustible (wood, leather, sponge, rubber, bone); 5a. Al (aluminium); 5b. Fe (iron/steel); 5c. Cu (copper); 5d. Stainless steel; 6. Inert (stone, tile, brick, ceramic, concrete); 7. Bio (biologically degradable wastes) and 8. Fines or <20 mm. The metal category was sub-sorted into four sub-categories because these categories were potential raw materials for waste-to-material utilisation.
Drum sieve (left) and sorting on the 100 mm sieve frame (right).
The wet material composition by mass of the III/M sample.
The developed sampling protocol was flexible because after each sieve the mass of the undersize fraction could be reduced by sample splitting. If the recommendation (500 kg sample mass for 100 mm grain size) of Gy (1979) is accepted the following sampling nomogram can be applied:
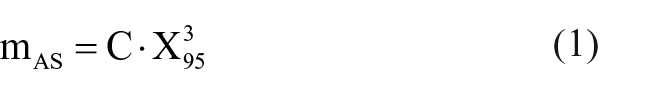
The constant for RMSW in equation (1) is C = 500 t m−3, X95 is the 95% particle size and mAS is the minimal mass of the average sample. According to Gy’s sampling theory, the necessary minimal mass of a single sample (increment) and the average sample (gross) primarily depend on the mass of the coarsest particle in the sampled granular population. The coarsest particle cannot be determined in practice, therefore the so-called ‘characterising coarsest particle’, namely the 95% particle size, is used as the basis for the sampling nomogram. In many practical cases, the 95% particle size is determined by a preliminary on-site sampling to be able to design the sampling protocol. The necessary minimal mass of the average sample depends on many factors according to Gy (1979): Namely the number of material components, the mass concentration distribution of the material components, the granular size distribution, the liberation and intergrown ratio of given materials and so on. Furthermore, the most important factor is the acceptable statistical error. The result of Gy’s calculations for residual MSWs is 500 kg average sample. This result had been applied in the Hungarian standard MSZ 21420-28 (2005). The given constant in equation (1) contains all these mentioned factors. According to this sampling nomogram, the minimal processed material is 63 kg in the case of the 50 mm sieve and 4 kg in the case of the 20 mm sieve.
Drilling was carried out in Debrecen on 9 February 2017, in landfill sections III, IV and V. The average borehole depth was about 12 m. The lower, middle and upper parts of the exploited material of each borehole were processed separately, therefore nine discrete average samples were analysed. Roman numbers indicate the borehole and capital letters indicate the vertical position; the III/M sampling was carried out in landfill section III from the middle part of the borehole from a depth of 5–7 m, for example. The materials of these samples were landfilled between 2004 and 2016, therefore the obtained data represents a 12-year timescale.
Material characterisation
Moisture contents were measured by drying at 105°C according to the standards (Hungarian Standard MSZ 21420 Parts: 28 and 29, 2005). Many different subsamples were made afterwards to gain data, characterizing different portions of the material (waste-to-material components, waste-to-energy components, <20 mm fraction) and different parts of the landfill (time scale). The so-called ‘waste-to-energy’ subsamples were prepared by mixing the following sorted material categories: plastics, paper, combustible and textile according to the measured dry composition of the analysis. In the case of the waste-to-energy components, the calorific value measurements and elementary chemical analyses of the ash were carried out. Some of the examined elements are on the 2017 EU list of critical raw materials. The resources of these elements, called shortly ‘critical elements’, are limited; therefore, any secondary raw material source is beneficial. The <20 mm fine fractions were analysed for the followings: total organic carbon (TOC), dissolved organic carbon (DOC), elemental chemical analysis and leaching behaviour (EN 14429). TOC and DOC were measured by an ELEMENTAR Vario TOC device. Different units, namely a Perkin Elmer FIMS 400 Hg-analyser, a Perkin Elmer Optima 5300 DV ICP-OES device, an UNICAM UV2-200 UV/VIS spectrophotometer, a CEM Mars 5 and a Perkin Elmer 2400 Series II CHNS/O Analyser, were used for chemical analysis. An e2k Combustion Calorimeter (MSZ EN 15400:2011) was used to measure calorific values. A VWR DL-53 drying cabinet was used to measure moisture content.
Results
The wet mass composition of all the nine average samples was measured. Only the results of sample III/M are shown in Table 2 as an example.
Each drilling characterises the given landfill section and the three drillings characterise the total landfill, therefore the wet and dry average composition of the nine samples were calculated and this data is shown in Table 3.
Average material composition by mass of the nine samplings.
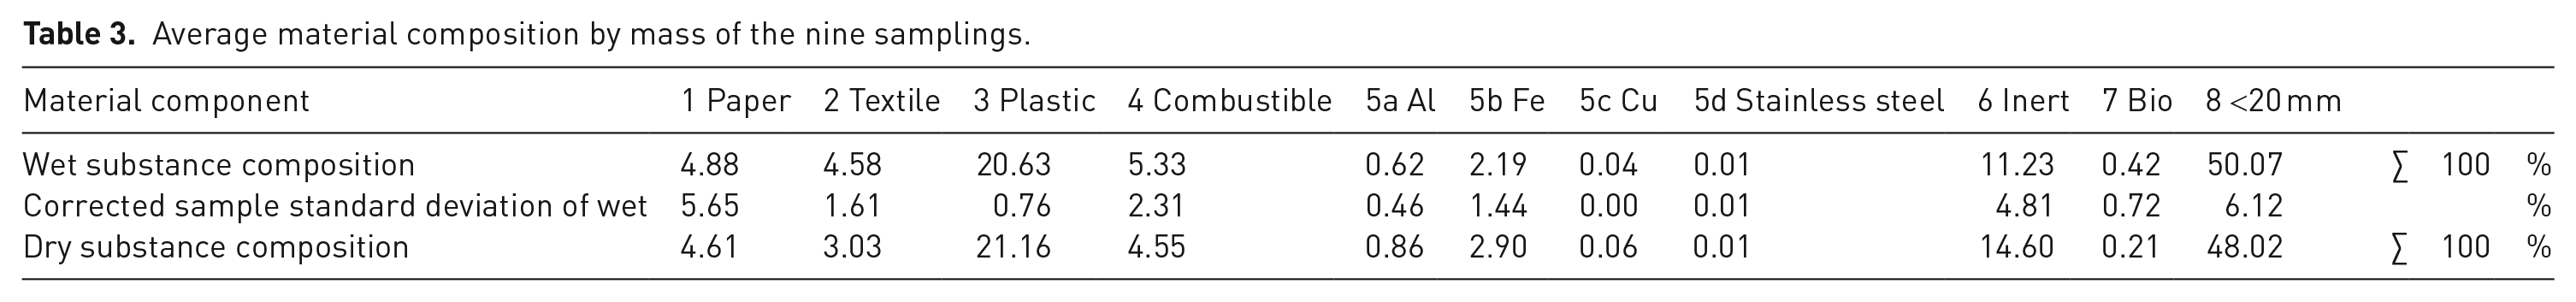
Van Vossen and Prent (2011) summarised composition data of 60 landfill mining projects. Data in Table 3 agrees well with the data of Van Vossen and Prent. Just one example, they defined the ‘fine’ material category as <24 mm and reported 54.8% wet mass concentration for this material stream. The fine fraction of a sample from each drilling was extensively tested in the laboratory; the results of the chemical analyses are shown in Table 4.
Result of chemical analysis (TOC, DOC, elemental analysis of the <20 mm fractions).
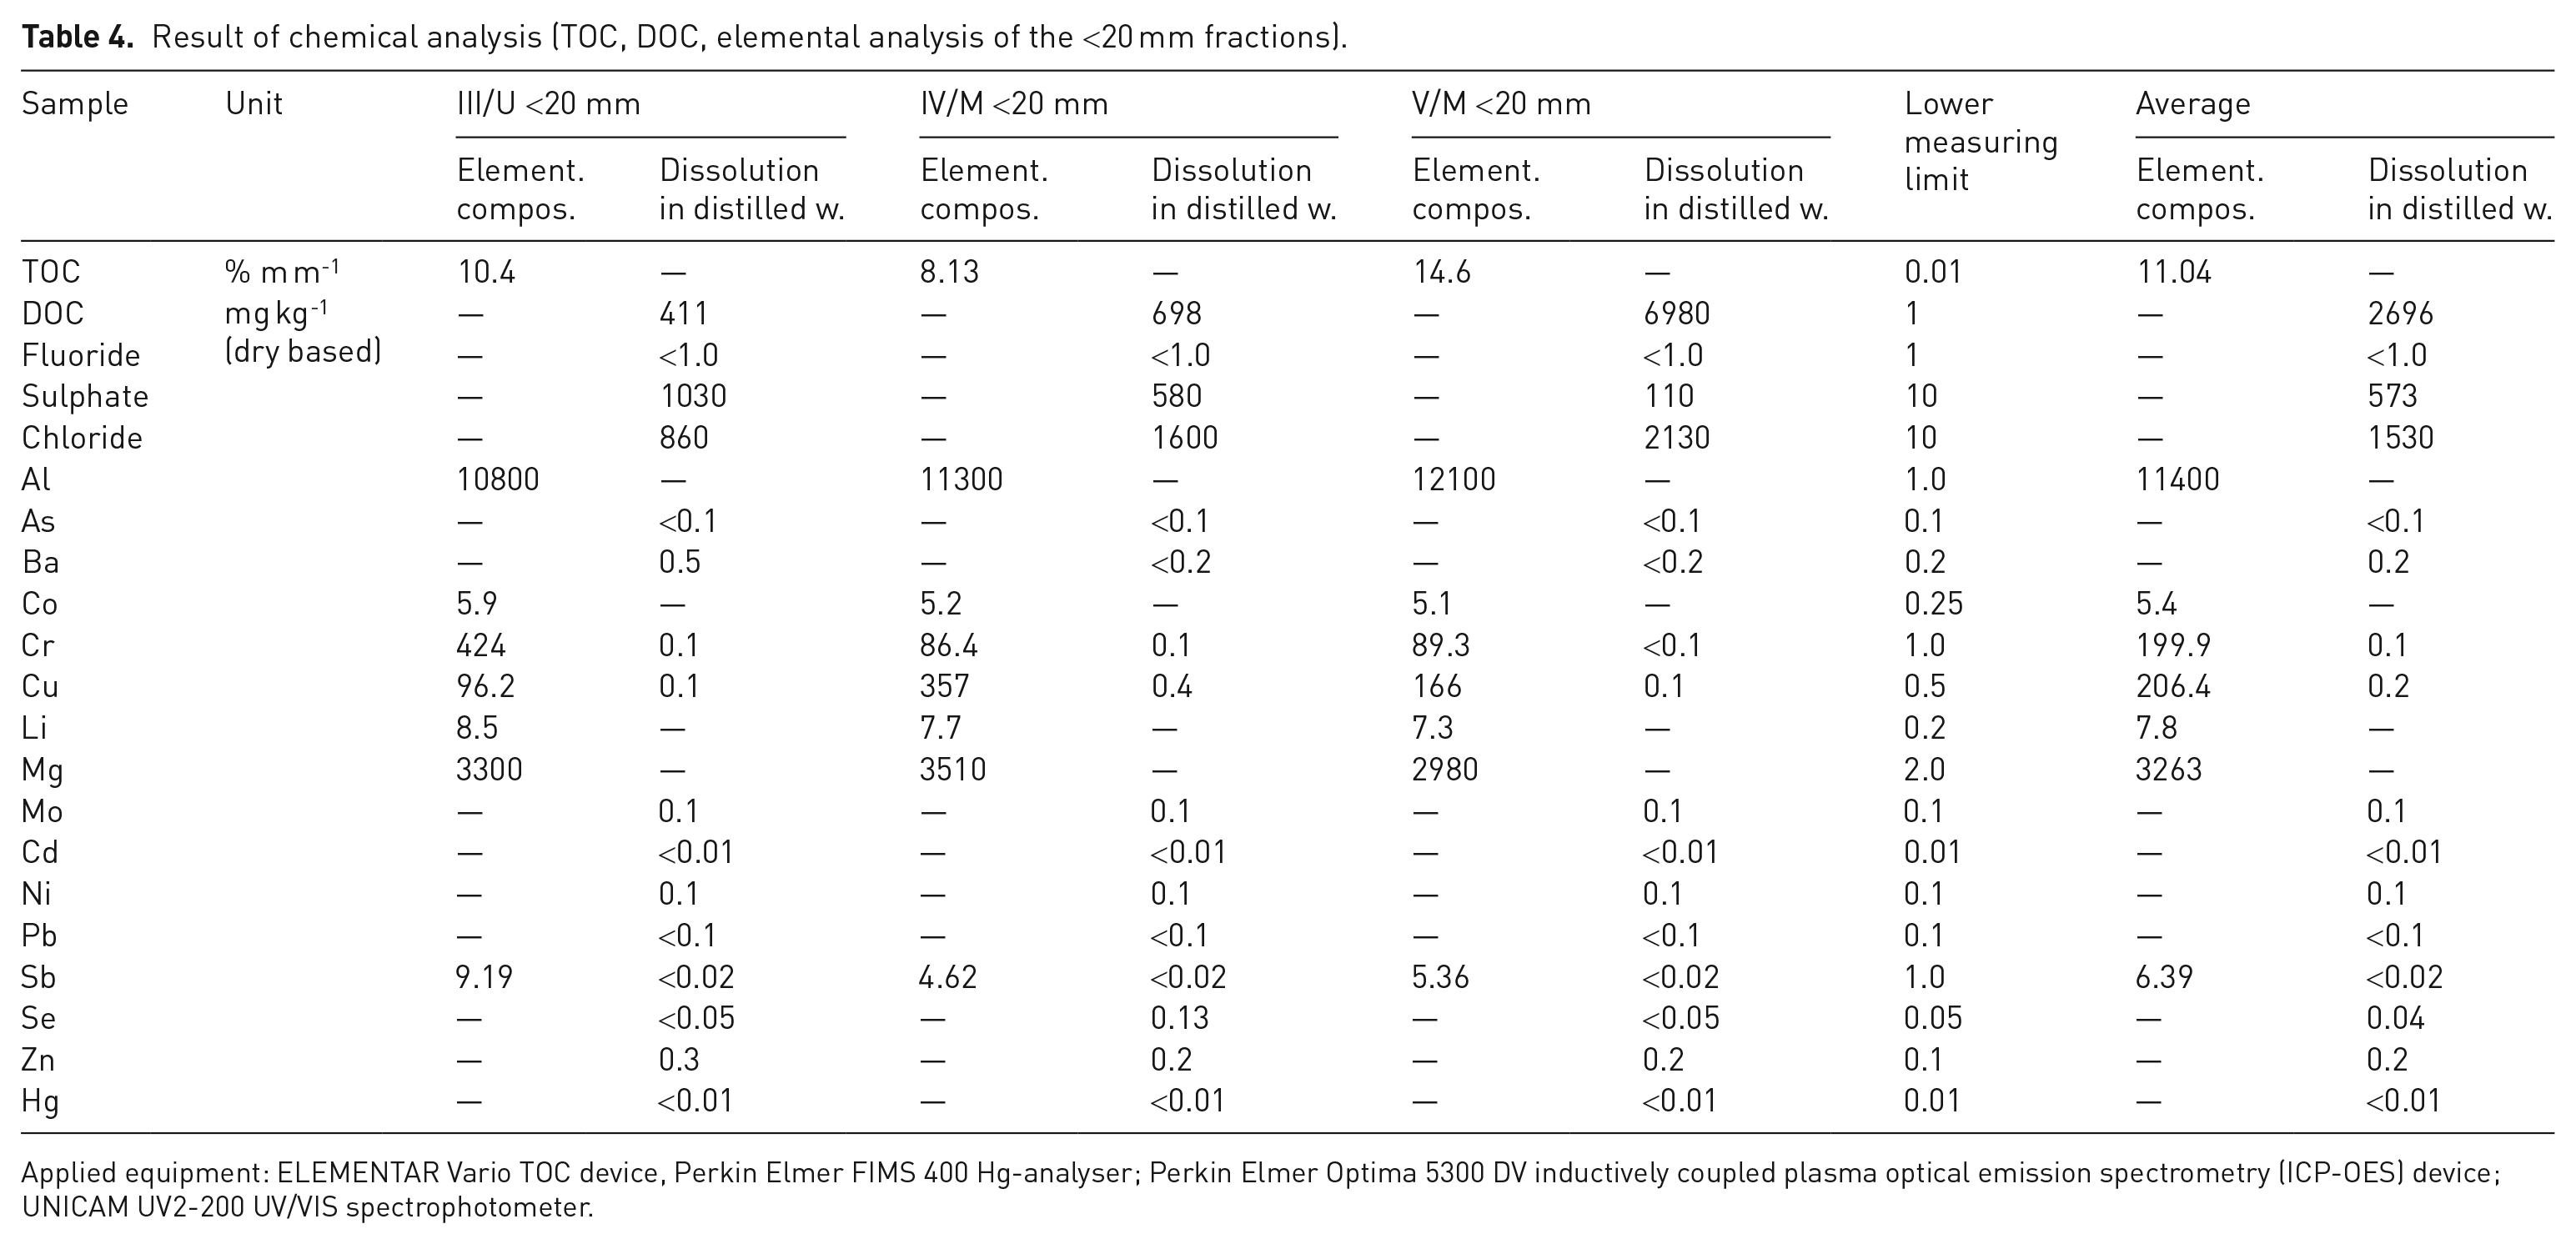
Applied equipment: ELEMENTAR Vario TOC device, Perkin Elmer FIMS 400 Hg-analyser; Perkin Elmer Optima 5300 DV inductively coupled plasma optical emission spectrometry (ICP-OES) device; UNICAM UV2-200 UV/VIS spectrophotometer.
The average TOC content of the <20 mm fractions is 11.03%, DOC is 2696 mg kg−1. The newest landfill section (V) has the highest DOC and chloride content and the lowest sulphate content. The aluminium and magnesium contents are high: cAl = 1.14% and cMg = 0.33% according to Table 4. Table 5 shows the analytical results of chemical analysis targeting into critical elements in the fine fractions.
Result of chemical analysis (critical element content of the <20 mm fractions).
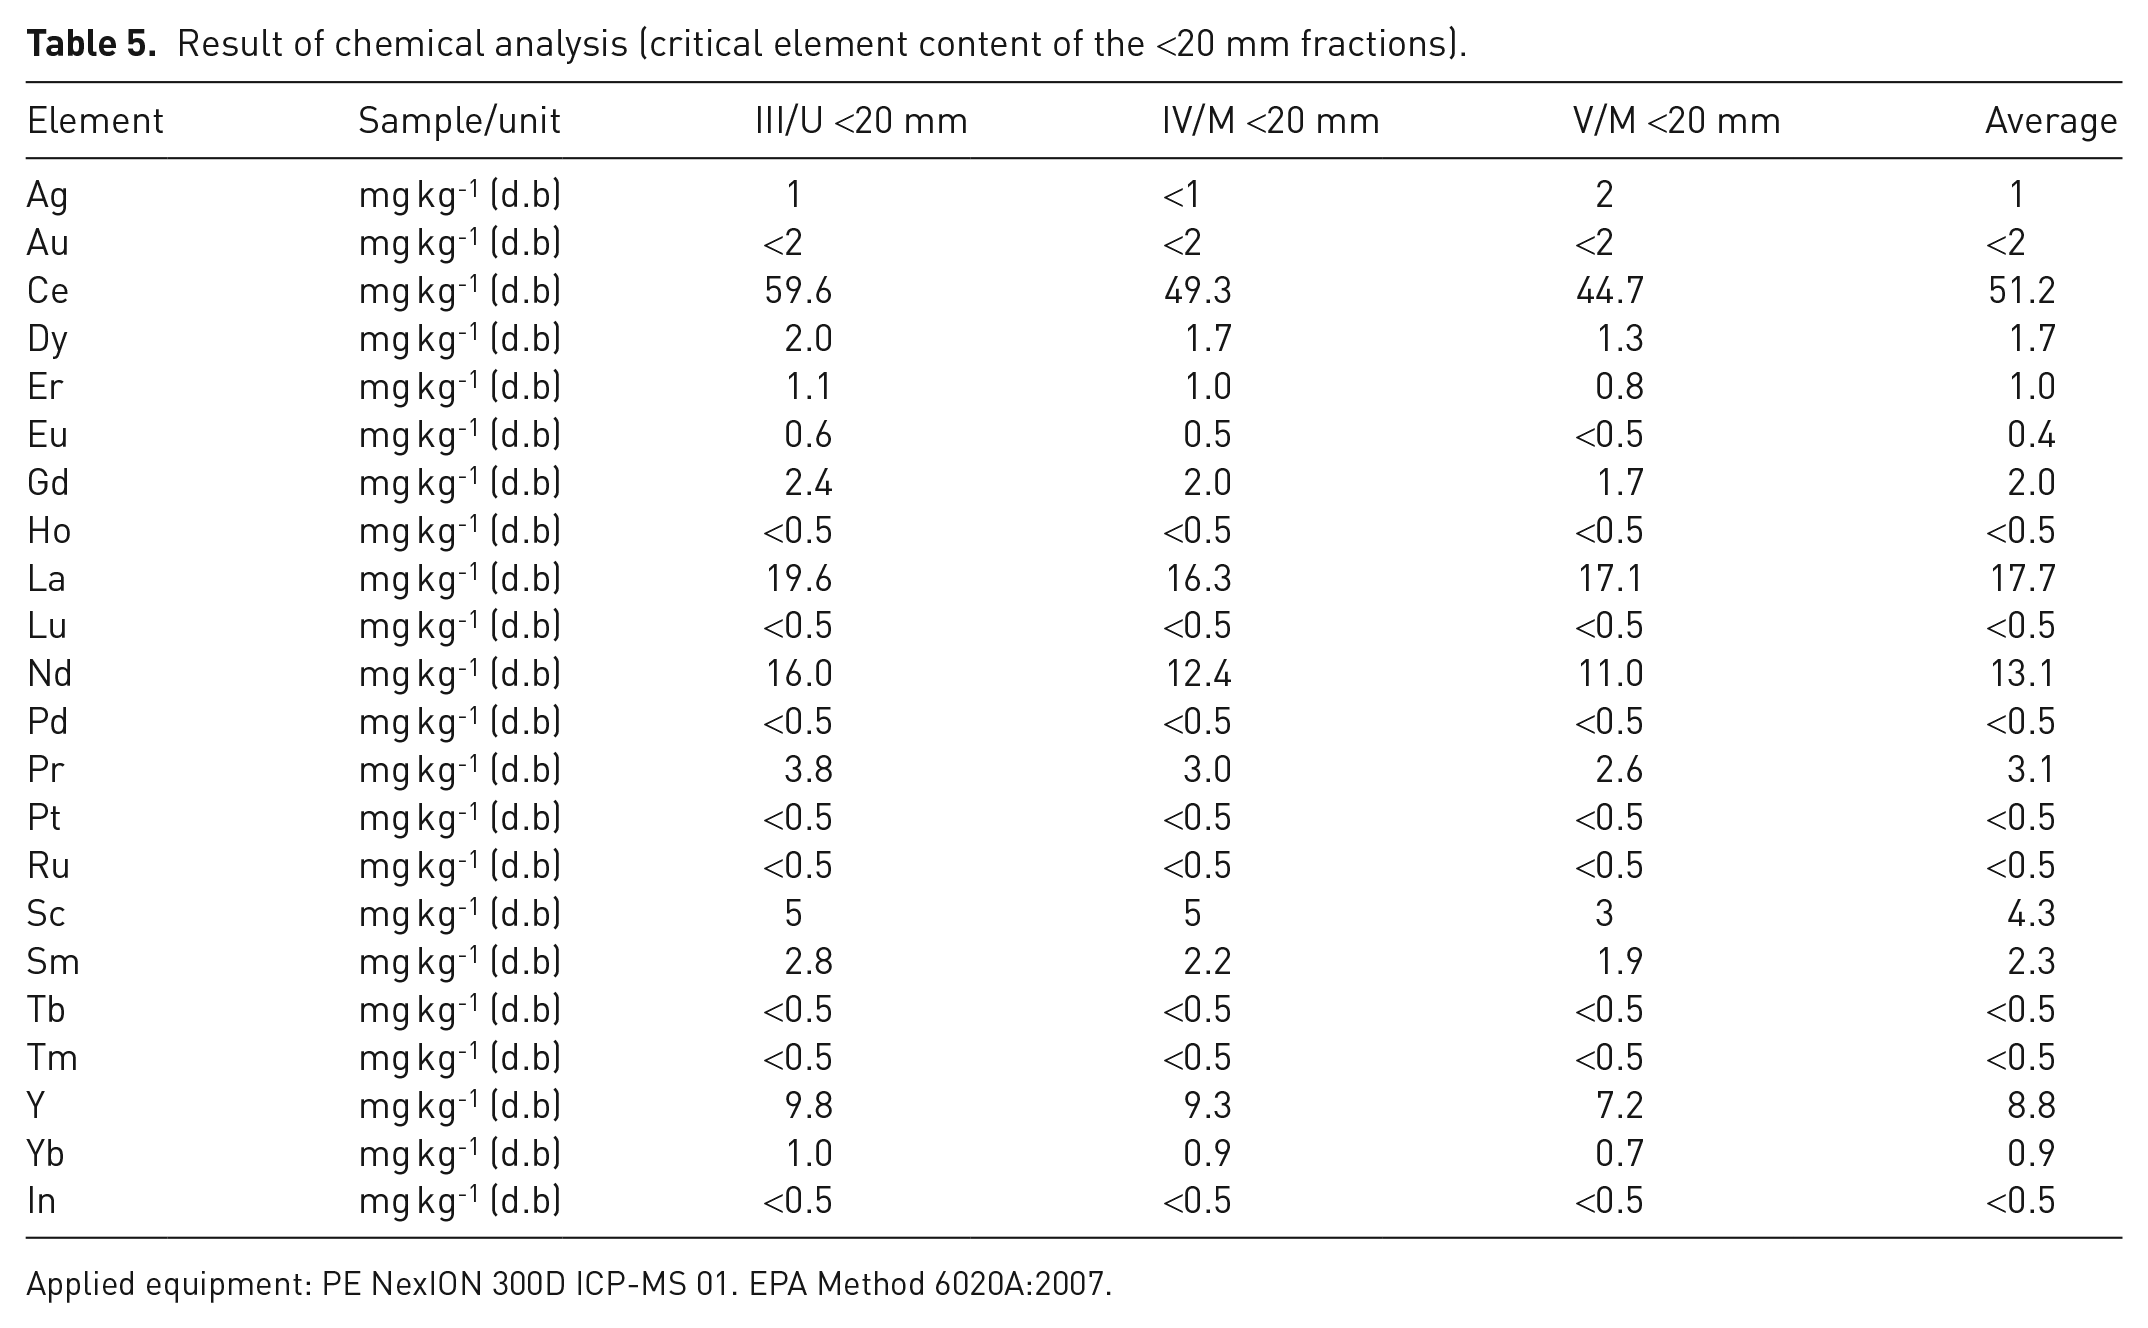
Applied equipment: PE NexION 300D ICP-MS 01. EPA Method 6020A:2007.
According to Table 5, three critical elements have a greater concentration than 10 mg kg−1; they are cerium, lanthanum and neodymium. The measured concentrations of these critical elements can be compared with their Clarke values for evaluating the critical raw material potential of the examined MSW landfill. The Clarke value is the average concentration of an element in the earth crust (Zepf, 2013). The Clarke value of Cerium is 43 mg kg−1, 20 mg kg−1 for lanthanum and also 20 mg kg−1 for neodymium. The measured concentration value of cerium in the Debrecen MSW landfill fine fraction exceeds its Clarke value, indicating a potential source. The concentrations of lanthanum and neodymium are also close for their Clarke values, respectively.
The other important utilisation of the landfill mined materials might be the waste-to-energy utilisation, therefore the sorted and dried energetic components of a sample of each drilling were mixed together and analytical samples were prepared. Table 6 shows the calorific value results of these laboratory tests.
Measured calorific values of waste-to-energy fractions.
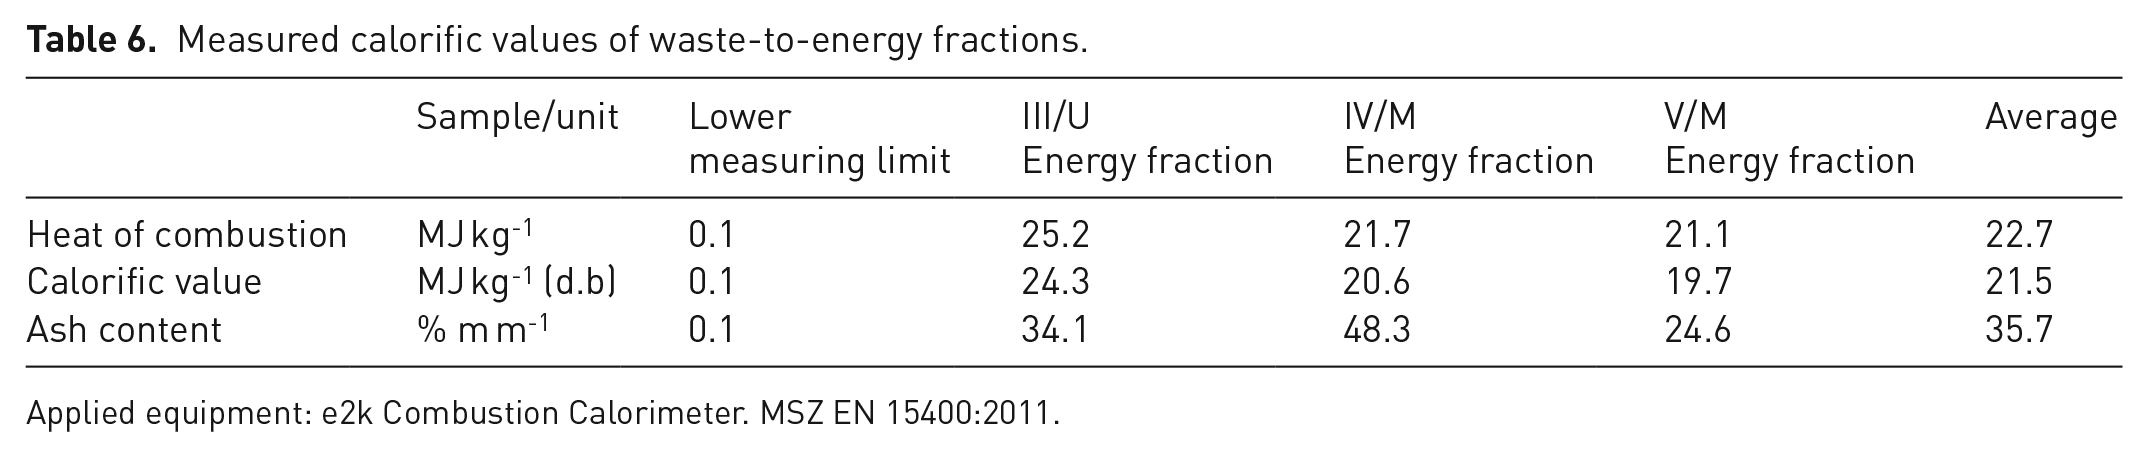
Applied equipment: e2k Combustion Calorimeter. MSZ EN 15400:2011.
The average values of the tests are: 22.7 MJ kg−1 heat of combustion, 21.5 MJ kg−1 calorific value and 35.7% m m−1 ash content. The analysed samples in the lab were dried during a period of previous determination of the moisture content. The deviation of ash content values is high. The heavy metal contents of the mixed energetic material components for each drilling were measured; results are shown in Table 7.
Result of chemical analyses (elemental analyses of energy fractions).
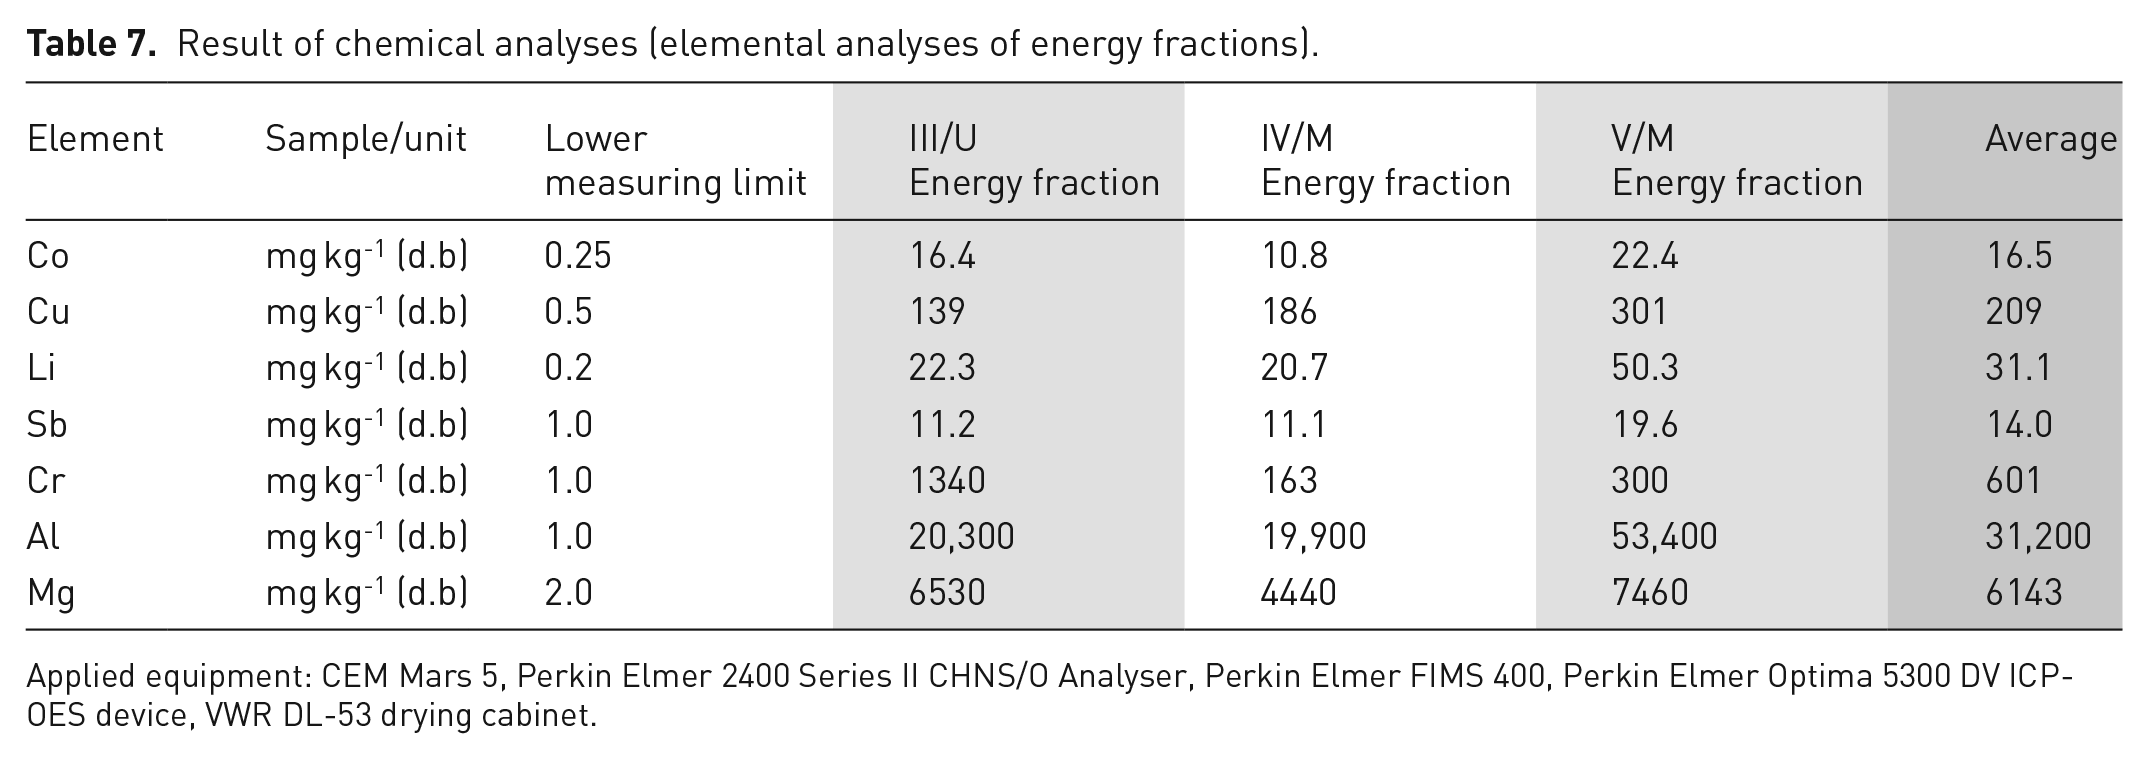
Applied equipment: CEM Mars 5, Perkin Elmer 2400 Series II CHNS/O Analyser, Perkin Elmer FIMS 400, Perkin Elmer Optima 5300 DV ICP-OES device, VWR DL-53 drying cabinet.
The aluminium and magnesium contents are significant in the energetic components: cAl = 3.12% and cMg = 0.61% according to Table 7. The aluminium and magnesium contents in the energetic components are much higher than in the <20 mm fine fraction. The reason might be the large composite packaging material content in the energetic components. Skutan and Brunner (2012) studied metal contents of different RDFs (refuse-derived fuels processed from MSW). They pointed out the difficulties of sampling and producing of the analytical samples for metal chemical analysis. According to their data, the RDF aluminium concentration generally does not exceed 26 g kg−1. The high aluminium content of the waste-to-energy components in the Debrecen landfill will have to be taken into account during the design of the preparation technology.
Discussion
Tendencies in material categories
On the basis of the information obtained by the sampling campaign, the total quantities of the landfilled materials in the Debrecen RMSW Landfill were estimated. These data can be used for economical calculations and for technology design. Beyond these, interesting trends of the composition of the landfilled RMSW have been revealed; the point of the introduction of the selective waste collection system by the municipality of Debrecen in 2014 can be well detected on the time function plots of the different material categories. The wet substance composition of each landfill section (drilling) was averaged on the basis of the results of the relevant three samplings (Figure 6).
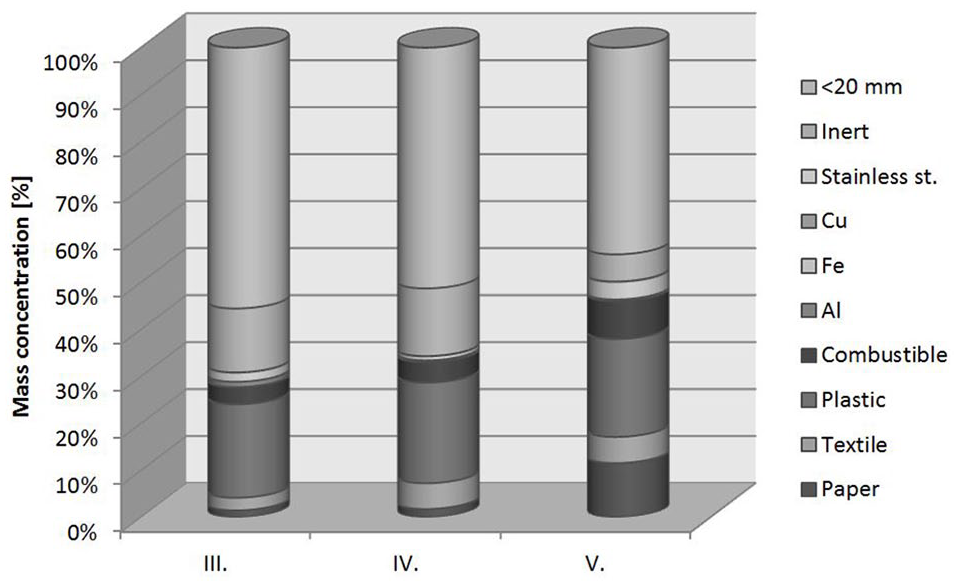
Wet substance composition of landfill sections III, IV and V.
As time progresses, more components are degraded, therefore the fine fraction and the inert component of the older landfill sections are higher. There were almost no sortable biologically decomposable categories on the samples; however, the fresh RMSW – at landfilling – generally contains significant amount of biomaterials. Probably the decomposed biomaterials had become part of the fine fraction.
According to Figure 7, the concentration of paper, textile and combustible categories did not changed much between 2004 and 2008, and then it increased until 2010. Since 2014 there is a clearly visible decreasing trend for these material categories. Regarding the plastic category, its concentration first decreased, then from 2005 increased until 2014, then significantly decreased owing to the introduction of the separate waste collection system for the dry materials.
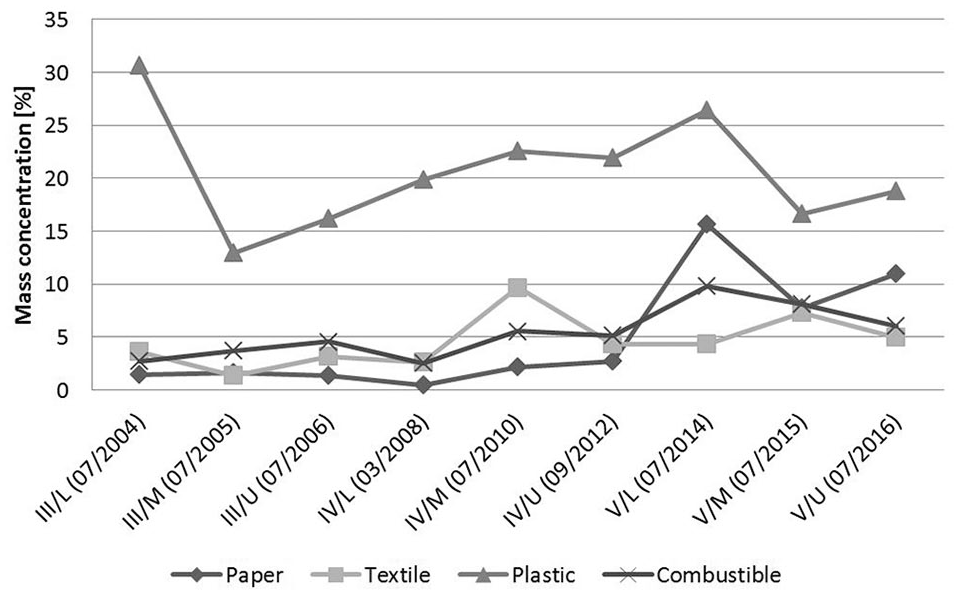
Timescale variation of waste-to-energy components.
According to Figure 8, the mass concentration of the inert category increased as function of the deposition time. The measured concentration of the sortable biologically degradable category was almost zero. Processes taking place inside of the landfill have not been examined here, but this observation indicates that biodegradation must have happened, because most of the high bio content of the deposited RMSW had disappeared or degraded into the fine (<20 mm) fraction. Landfill gas generation is a consequence of the biodegradation and this observation is consistent with landfill gas prognosis models in the literature (Faitli et al., 2017; Tabasaran and Rettenberger, 1987; Tintner et al., 2011). The introduction of the separate collection of green wastes further decreased the quantity of bio-materials in the landfill. Concentration of the fine fraction significantly varies with time, but the landfill section average of it decreased, as shown in Figure 6.
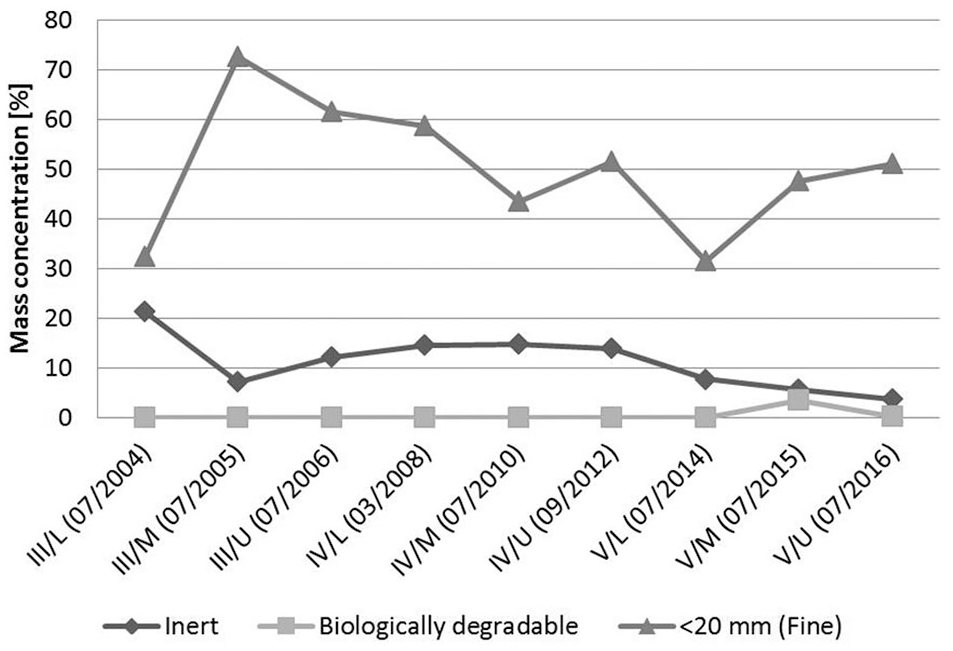
Timescale variation of the residual components.
Amount of different material categories
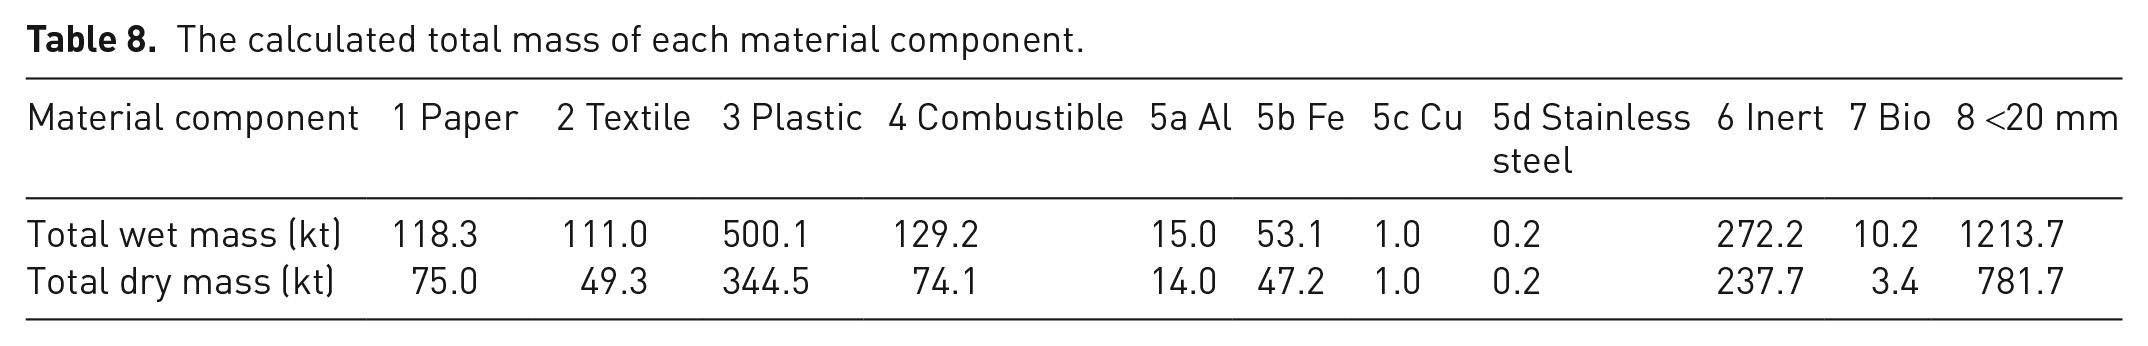
Based on the results of sampling, the total dry and wet mass of the examined material components was calculated for landfill sections I–V (Table 8). The total volume of landfill sections I–V was VT = 2,423,970 m3 and bulk density of the landfilled MSW–RMSW was approximately ρ = 1000 kg m−3. These data were served by A.K.S.D. Ltd, the operator of the Debrecen Landfill. Table 8 shows that the estimated amount of plastic is the highest (regardless of the <20 mm fraction) 500,000 t. Mass of stored metals in landfill sections I–V is 69,300 t and the estimated total mass of the ‘energetic fraction’ is 858,600 t.
The calculated total mass of each material component.
Conclusions
Our case study on the Debrecen Municipal Solid Waste Landfill, on landfill sections III–V containing RMSW deposited from 2004 up to 2016, showed that the concentration of plastics in the stored waste is the highest (regardless of the <20 mm fraction): 20.63 % m m−1 dry. The average concentration of the waste-to-energy components is 35.42% m m−1 dry, while that of metals content is only 2.86% m m−1 dry.
Regarding the time of landfilling – namely the age of the landfilled waste – different tendencies can be observed. The mass concentration of paper, textile and combustible did not changed much between 2004 and 2008, and afterwards they increased until 2010. Since 2014 there is a clearly visible decreasing trend for these material categories. Regarding the plastic category, its content first decreased, then from 2005 increased until 2014, then significantly decreased owing to the introduction of the separate waste collection system for the dry materials.
According to the results of samplings, the estimated wet amount of the fine fraction (<20 mm) was 1,213,700 t, plastics was 500,000 t, metals was 69,300 t and 858,600 t energetic fraction (paper, textile, plastic and combustible) were landfilled in sections I–V. These results provid a good basis for later cost-benefit analysis and process technology design.
A new sampling and average sample preparation protocol was designed for landfill mining analysis. The carried measurements have proven that the protocol is well suited and flexible for the practical application.
Footnotes
Declaration of conflicting interests
The authors declared no potential conflicts of interest with respect to the research, authorship, and/or publication of this article.
Funding
The author(s) disclosed receipt of the following financial support for the research, authorship, and/or publication of this article: The SMARTGROUND R&D Project was funded by the European Union’s Horizon 2020 Research and Innovation Programme under Grant Agreement No 641988. The described work/article was carried out as a part of the ‘Sustainable Raw Material Management Thematic Network – RING 2017’, EFOP-3.6.2-16-2017-00010 project in the framework of the Széchenyi 2020 Program. The realisation of this project is supported by the European Union, co-financed by the European Social Fund.