
Abstract
Biomass is considered as the largest renewable energy source in the world. However, some of its inherent properties such as hygroscopicity, lower energy content, low mass density and bio-degradation on storage hinder its extensive application in energy generation processes. Torrefaction, a thermochemical process carried out at 200–300°C in a non-oxidative environment, can address these inherent problems of the biomass. In this work, torrefaction of bagasse was performed in a bench-scale tubular reactor at 250°C and 275°C with residence times of 30, 60 and 90 mins. The effects of torrefaction conditions on the elemental composition, mass yield, energy yield, oxygen/carbon (O/C) and hydrogen/carbon (H/C) ratios, higher heating values and structural composition were investigated and compared with the commercially available ‘Thar 6’ and ‘Tunnel C’ coal. Based on the targeted mass and energy yields of 80% and 90% respectively, the optimal process conditions turned out to be 250°C and 30 mins. Torrefaction of the bagasse conducted at 275°C and 90 min raised the carbon content in bagasse to 58.14% and resulted in a high heating value of 23.84 MJ/kg. The structural and thermal analysis of the torrefied bagasse indicates that the moisture, non-structural carbohydrates and hemicellulose were reduced, which induced the hydrophobicity in the bagasse and enhanced its energy value. These findings showed that torrefaction can be a sustainable pre-treatment process to improve the fuel and structural properties of biomass as a feedstock for energy generation processes.
Introduction
The world is facing serious issues of air pollution and global warming resulting from the extensive use of fossil fuels for energy generation. These challenges and limited resources of fossil fuels have forced the researchers to utilize renewable energy (RE) resources such as solar, wind, biomass, hydrothermal etc. for energy generation. With the expected 56% increase in the energy demand by 2040 (da Silva Perez et al., 2015), numerous technologies are underway to partially or completely replace the non-RE resources (Naqvi et al., 2018). Among all RE resources, biomass is a low-cost, easily accessible, sustainable, carbon-neutral and abundantly available resource. In this regard, it is expected that biomass will generate 50% of the world’s energy demand (Hossain and Badr, 2007). However, some inherent drawbacks of biomass such as hygroscopic nature, low energy value, high moisture contents and low bulk density inhibit its application in energy generation processes (Chang et al., 2012; Mosier et al., 2005; Sung et al., 2016). The above described issues reduce the process efficiency and give rise to problems such as degradation and self-heating of the biomass during storage, which increase the handling, transportation and storage costs (Oliveira Rodrigues, 2009). The fixed carbon and volatile matter in the biomass are in the range of 0.5–20 wt.% and 67–88 wt.%, respectively (Chew and Doshi, 2011), as compared to coal which contains 0.9–50 wt.% fixed carbon and 42–92 wt.% volatile matter, respectively. (Parikh et al., 2005). On the other hand, the elemental carbon and oxygen contents of biomass vary between 39–50% and 37–50%, respectively, while those are between 64–92% and 1–25%, respectively, in coal. Considering the lower values of fixed carbon and elemental carbon, the higher heating value (HHV) of raw biomass is 1.67–1.75 times lower than that of coal (Parikh et al., 2005). In the light of these shortcomings of the biomass and to increase its utilization in the energy generation processes, it must be upgraded using some pretreatment process. Various biomass pretreatment processes include biochemical, mechanical and thermochemical processes. The biochemical processes consume a lot of time and mechanical processes are energy-intensive. Among different thermochemical processes, although drying removes moisture from the biomass at 100°C, it does not make biomass hydrophobic while pyrolysis and carbonization occur at the higher temperature (> 400°C). In this regard, torrefaction, which involves thermal degradation of biomass at 200–300°C in an oxygen-deprived environment, is an efficient way to improve its fuel quality. High temperature and inert environment help to release free and bound moisture and volatile matter from the biomass using this process. This results in oxygen and hydrogen removal from the biomass and produces a fuel with lower oxygen/carbon (O/C) and hydrogen/carbon (H/C) ratios (Saleh et al., 2013). The O/C and H/C ratios are indirectly linked with energy density and HHV and have a positive impact on biomass pyrolysis products (Chang et al., 2012). Since torrefaction produces biomass with low moisture content, hydrophobic nature, resistivity to fungal attack and less smoke formation, it becomes an attractive pre-treatment technology prior to combustion and gasification systems (Patel et al., 2011; Ru et al., 2015). Several scientists have devoted their efforts to the field of the biomass torrefaction (Bai et al., 2018; Mamvura, et al., 2018; Parikh et al., 2005; Patel et al., 2011). Table 1 summarizes and compares current research work and some previous studies that focused on the torrefaction of bagasse. These studies were mostly on the identification of significant process parameters, their effects on elemental composition, O/C and H/C ratios, heating value, mass and energy density, as well as the structural properties of the biomass. Few were based on the effect of torrefaction severity on the change in the physiochemical characteristics of the biomass. However, the effect of torrefaction severity on upgrading biomass towards the level of commercially available coal is scarcely reported.
Torrefaction of bagasse: effect of operating parameters.
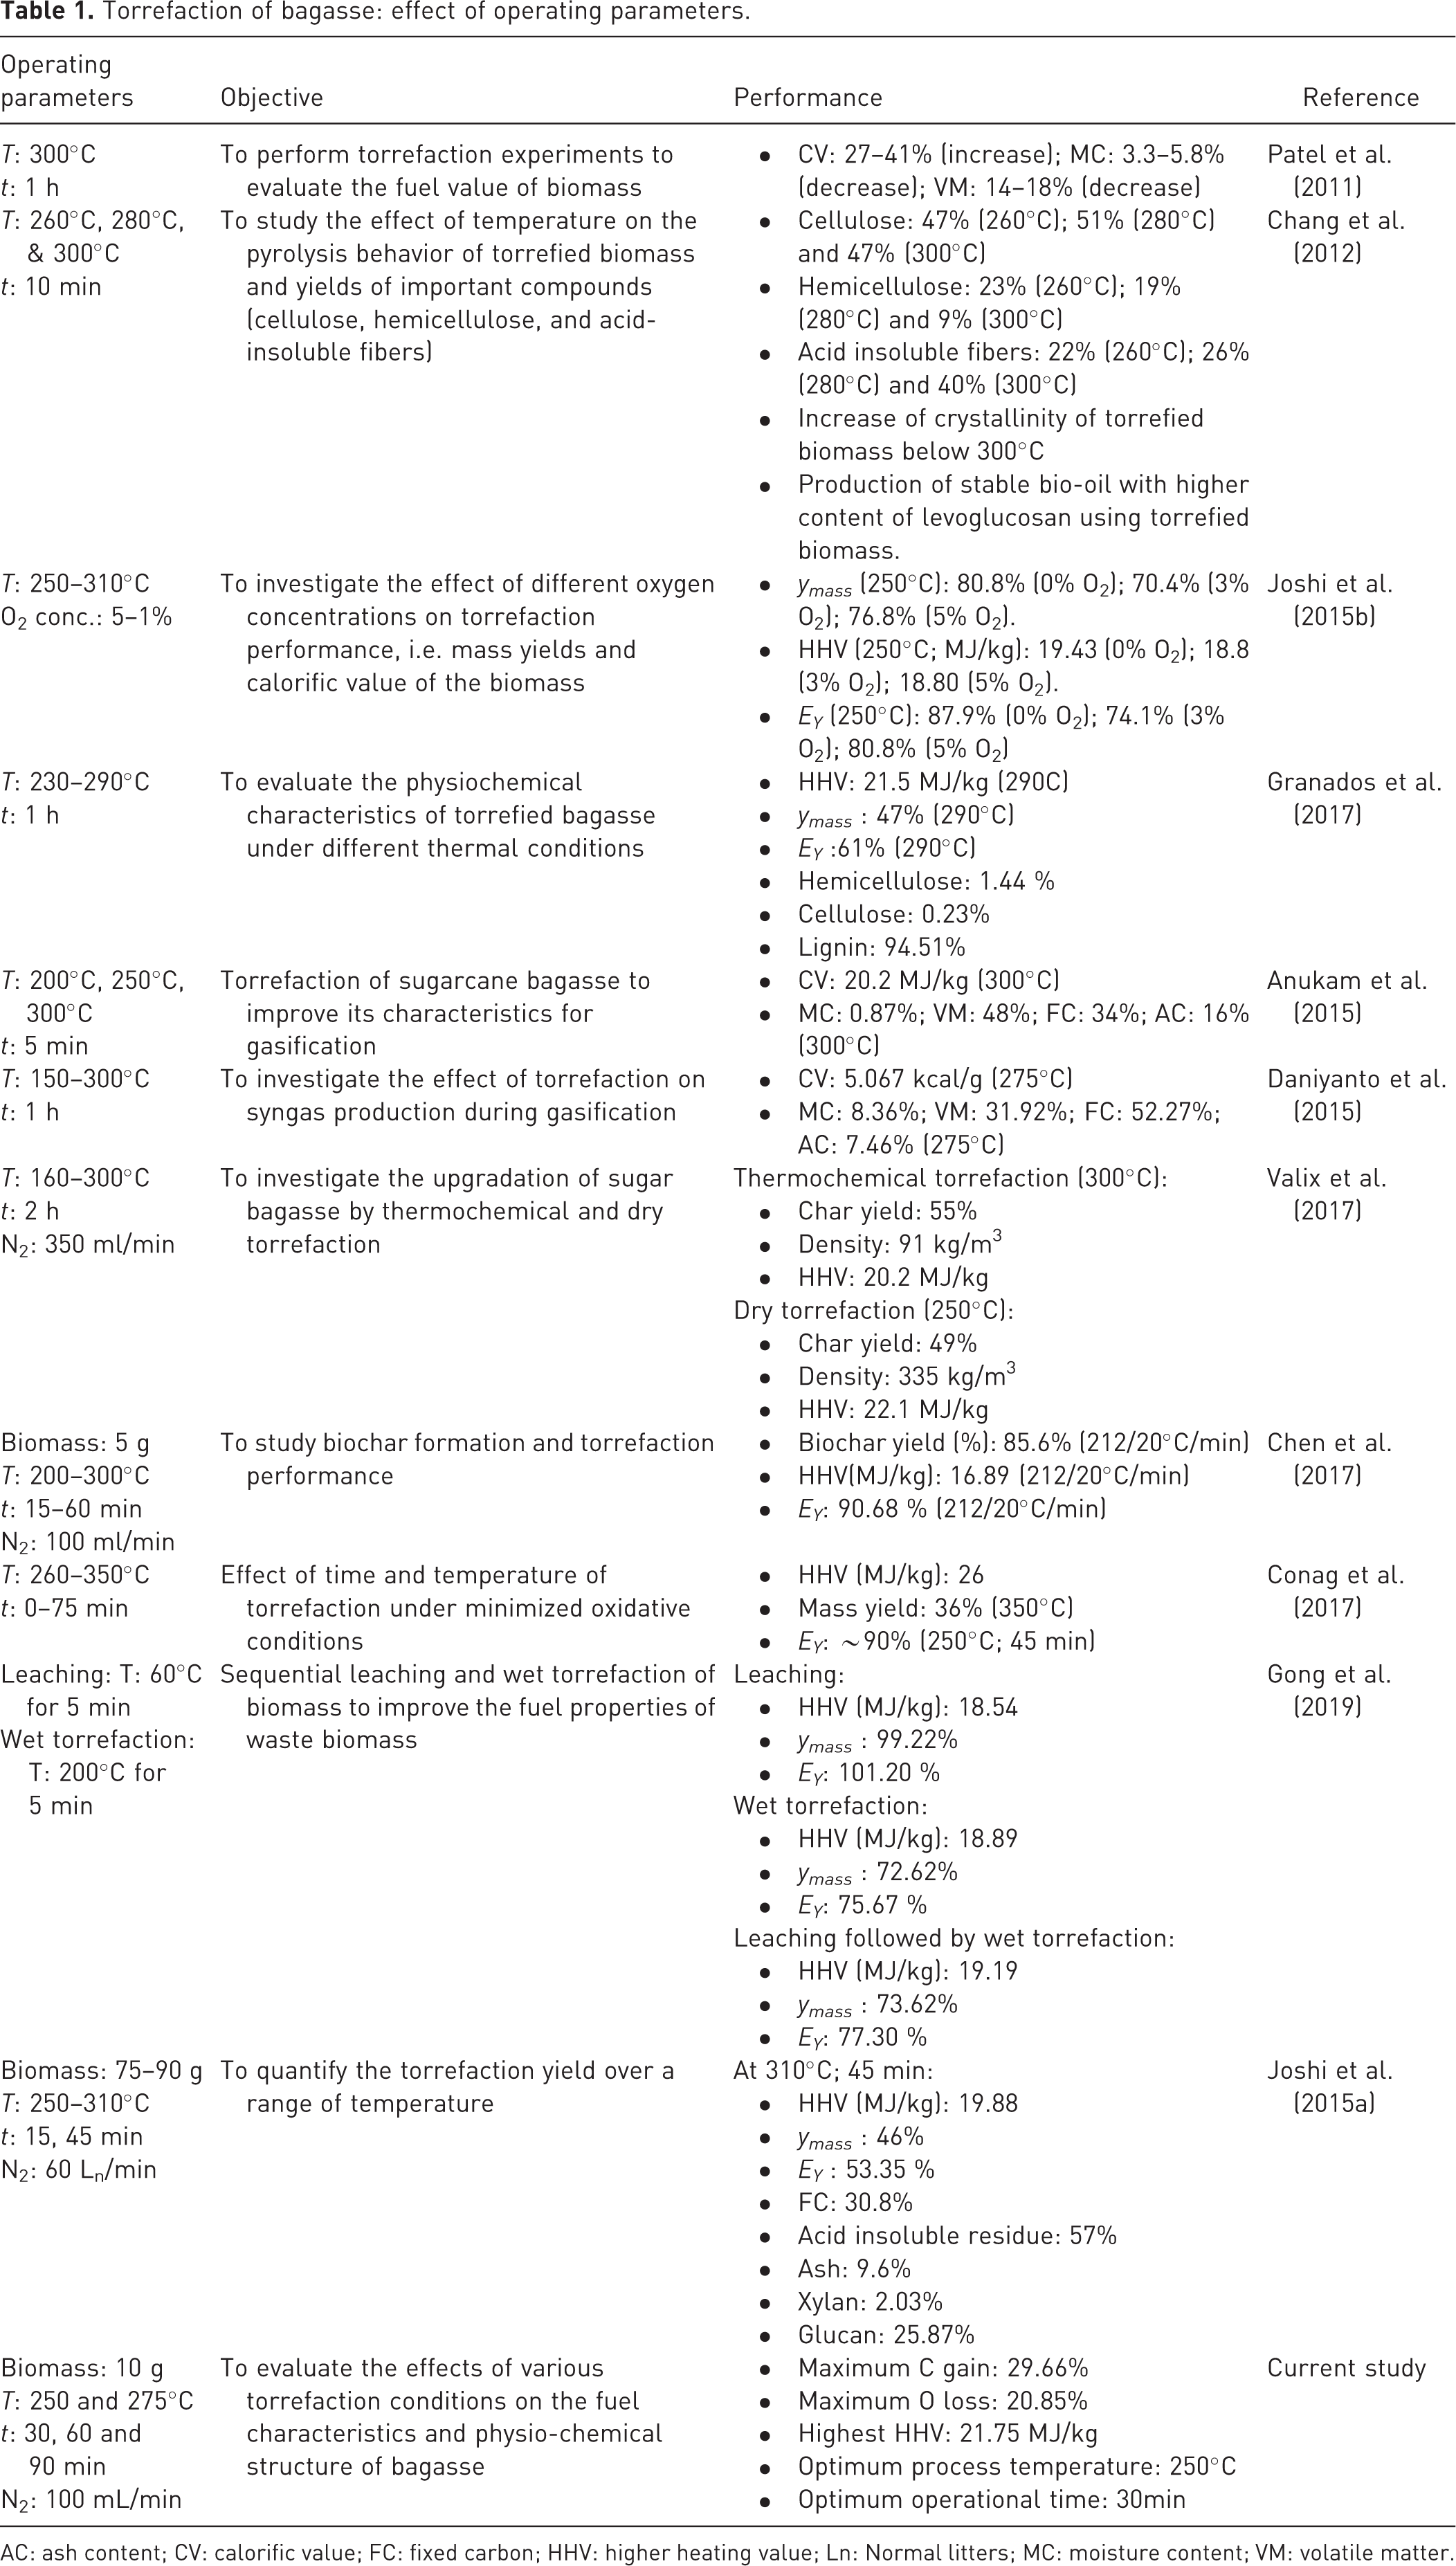
AC: ash content; CV: calorific value; FC: fixed carbon; HHV: higher heating value; Ln: Normal litters; MC: moisture content; VM: volatile matter.
Pakistan, being an agrarian country, produces tons of farm waste with the potential to be used for energy conversion. According to the World Bank report, Pakistan has 2.6 × 10¹¹ m2 land under cultivation and most of the crop’s residue is directly utilized by rural people for their basic energy needs or as cattle feedstock (Iftikhar et al., 2019). As Pakistan generates 79% of its total energy from fossil fuels, the energy production cost is very high as most of the fuel is imported and at the same time, the country is facing an energy crisis. The contribution of RE resources in Pakistan’s energy mix is negligible (Aslam et al., 2019). In 2010–2011, Pakistan produced 6.4 × 10¹⁰ kg of sugarcane, generating waste of around 5.8 × 10⁹ kg (Naqvi et al., 2018). Thus, the potential of using bagasse, an agricultural waste, after its pretreatment as a substitute to non-RE resources is huge. Therefore, this work intends to (a) perform non-oxidative torrefaction of indigenous bagasse in a laboratory-scale tubular reactor by varying the process parameters such as temperature and residence time; (b) investigate the changes in the chemical composition, heating value, mass and energy yields upon torrefaction, and compare with commercially available coal; (c) study the changes in structure and thermal stability upon torrefaction.
Materials and method
Material acquisition
The biomass sample used in this study was bagasse, a fibrous residue remaining after the extraction of the sugar-bearing juice from sugarcane. These residues were collected from a local sugarcane juice machine in the district of Kasur and washed with distilled water. The washed samples were sun-dried in a rectangular-shaped solar greenhouse dryer for 3 days. The dryer was made up of a steel frame with transparent polyethylene walls and roof to minimize the contact of biomass with the environment. Ventilation holes were provided around all sides of the dryer for air circulation. Later, the dried biomass sample was sieved in a sieve shaker to obtain the particle size distribution between 10 mm and 8 mm. The sun-dried and sieved samples were then stored in airtight plastic containers to avoid moisture absorption before experiments. Furthermore, ultra-pure nitrogen (99.99%) procured from Linde (Pakistan) was used to ensure the inert environment during torrefaction.
Experimental set-up for torrefaction
Figure 1 shows the schematic diagram of the torrefaction unit used in this study. This system consisted of a bench-scale tube furnace (CARBOLITE CTF12/TZF 12, Germany), a stainless-steel tube reactor and a gas cylinder. The stainless steel-316 tube with an outer diameter of 35 mm and 300 mm in length was placed in a tube furnace and connected with a rotameter and gas cylinder for nitrogen supply.
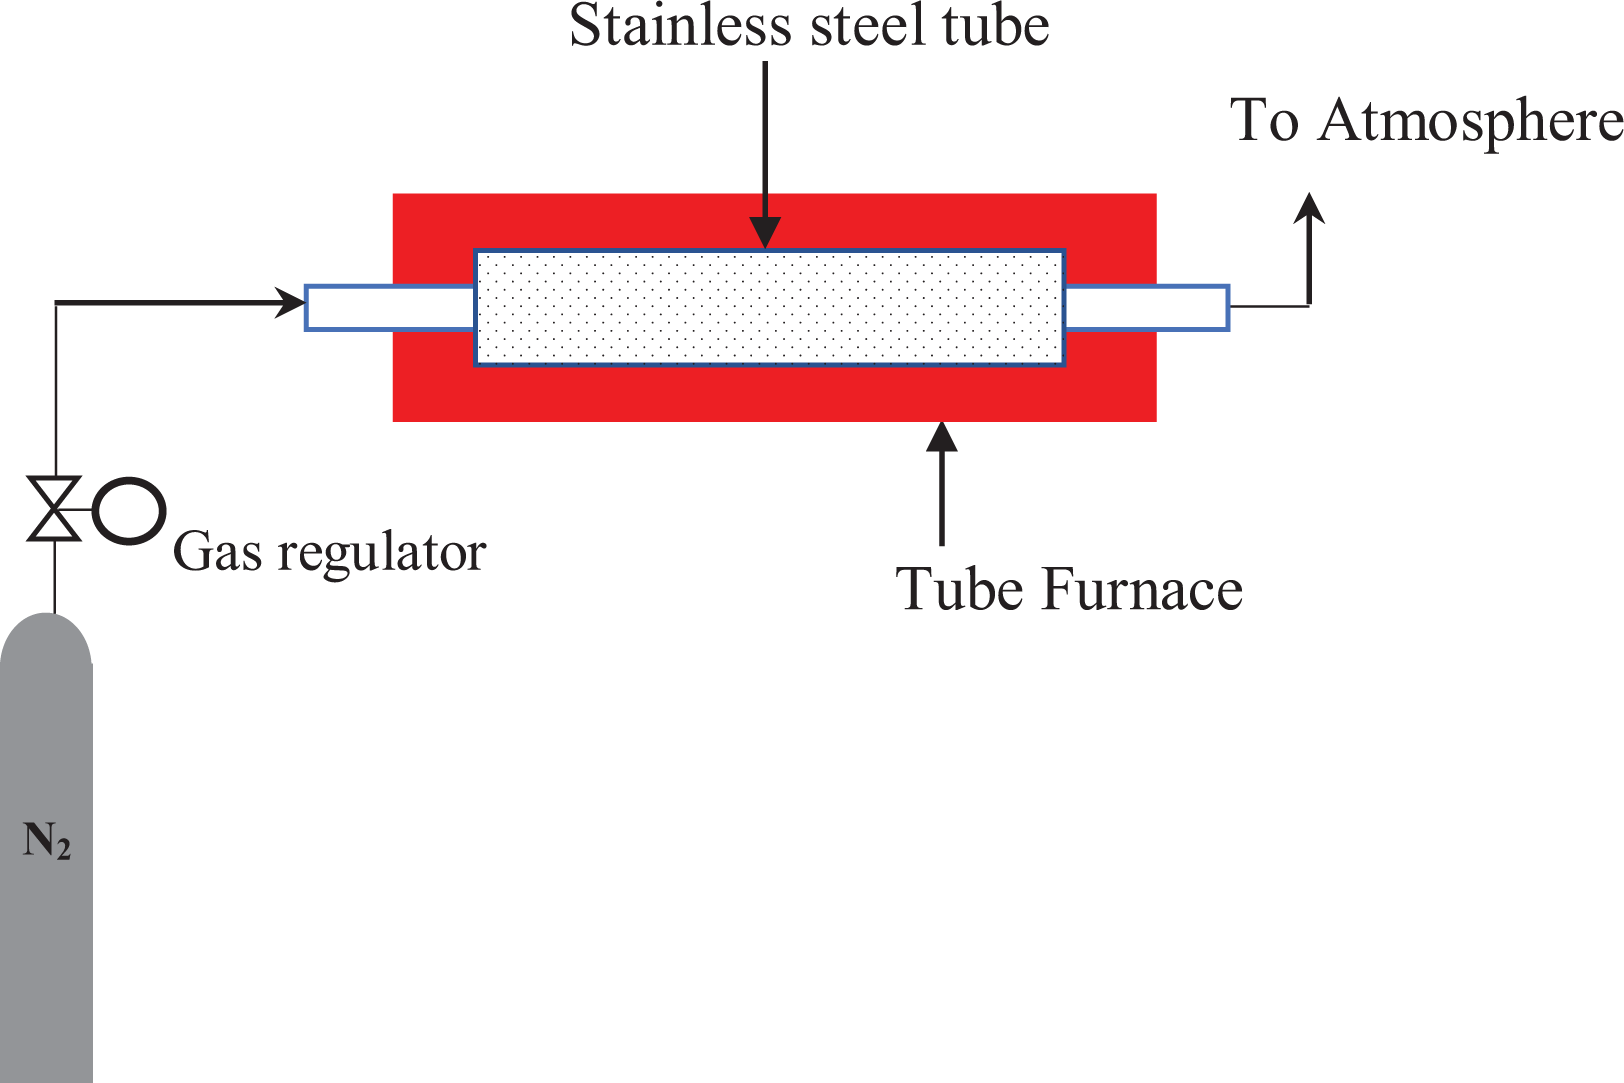
Schematic representation of torrefaction unit.
In each experiment, 10 g of sun-dried biomass was placed in the 300 mm-length of the reactor. The nitrogen was purged into the reactor at a flow rate of 100 mL/min in order to maintain the inert environment during the torrefaction process. For even distribution of incoming nitrogen gas, a cotton swab was placed at the upper end of the stainless-steel tube and a similar arrangement was done at the lower end to block the flow of entrained biomass. Each biomass sample was heated up to the desired temperature (250°C and 275°C) and a lower heating rate of 10°C/min was selected for each experiment. In this study, a lower heating rate was selected because torrefaction is a low heating rate pyrolysis process and higher heating rates could result in non-homogeneous temperature and reaction distribution. At low heating rates, the torrefaction process reduces the rate of lignocellulosic polymer depolymerization and dehydration into volatiles and as a result, more of the char or solid phase is produced (Chew and Doshi, 2011; Patel et al., 2011). Thus, after holding for different residence times of 30, 60, and 90 min (the time to reach the set temperature is not included), the solid product was cooled down to room temperature in a nitrogen atmosphere. The product was then weighed and stored in airtight plastic bags for further analysis and characterization. All analyses were performed according to standard American Standard of Testing Method (ASTM) procedures and corresponding calculations were performed on a dry basis.
Sample analysis
Higher heating value
The HHVs of both raw and torrefied biomass were determined using LECO isoperibol bomb calorimeter (model AC-500) following the standard procedure described in ASTM D-1989 standard.
Compositional analysis
Proximate analysis (moisture content, volatile matter, fixed carbon and ash content) of the samples was performed according to the referred ASTM standards, i.e. ASTM-E871, ASTM-E1755 and ASTM-E872. The measured quantity of the samples loaded in a crucible was placed in a vacuum oven which was maintained at 103 ± 2°C for 5 h and then moved to a desiccator containing silica gel for cooling. The cooled samples were re-weighed, and the values were recorded. The procedure was repeated several times until constant weights were achieved for three consecutive readings. Thus, the change in the initial (m1) and final weight (m2) was reported as percentage moisture following ASTM-E871. The volatile matter of the raw and torrefied biomass samples was determined by following ASTM-E872 standard. The covered crucibles containing samples were fired at 970°C for 7 min. After cooling in a desiccator, the change in the weight was noted and used to calculate the percentage volatile content. For calculating the ash content, oven-dried raw and torrefied samples were burnt at 575±5°C for 1 h in a muffle furnace (ASTM-E1755). The samples were moved to the desiccator for cooling. The samples were weighed, and the same procedure was performed until a constant weight was obtained. Following the procedure provided in ASTM-E1755, the percentage ash contents of the samples were obtained. Furthermore, the fixed carbons of the solid samples were obtained by excluding the ash, moisture and volatile matter from 100%. The ultimate analysis, percentages of carbon, hydrogen, nitrogen and sulfur of raw and torrefied bagasse samples were determined using CHNS elemental analyzer (Elemetar Analysensysteme GmH-Vario MICRO cube CHNS elemental analyzer) according to the ASTM D5291 method. The percentage of oxygen was calculated by subtracting carbon, nitrogen and hydrogen from 100%.
Energy density, energy yield and mass yield
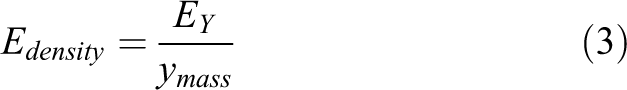
Mass yield (ymass ), energy yield (EY ) and energy density (Edensity ) are critical parameters used to determine the physical characteristics of torrefied biomass. The prime objective of the torrefaction process is to increase the energy yield through a simultaneous increase in heating value and decrease in mass yield (Mamvura et al., 2018). The energy yield of torrefied biomass samples was calculated as follows (Chen et al., 2013):
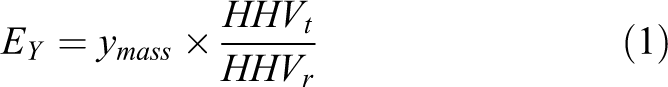
where HHVt and HHVr are the higher heating values of torrefied and raw biomass samples. ymass denotes the mass yield (ymass ) as a result of torrefaction and can be calculated as (Lee and Lee, 2014):
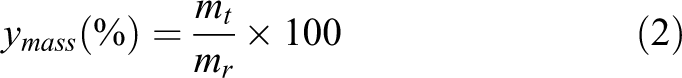
where mt and mr are the masses of torrefied and raw biomass samples measured in grams. Subsequently, the energy density can be calculated as (Lee and Lee, 2014):
Water absorption test
To compare the water absorption tendency of raw and torrefied biomass samples, approximately 2 g of biomass samples were immersed in deionized water at room temperature for 24 h. After a specified time, the biomass samples were filtered and weighed to determine the amount of water absorbed by the biomass samples. The percentage absorption can be calculated as:

where mf and mo are the final and initial weight of the samples measured in grams.
Structural composition analysis
Fourier Transform Infrared (FTIR) spectra of raw and torrefied biomass samples were recorded using Agilent Cary 630 FTIR Spectrometer. The spectra were recorded in the region of 900–4000 cm−1 and believed to be accurate within ±1 cm−1.
Thermogravimetric analysis (TGA)
Non-isothermal thermogravimetric analysis (TGA) of raw and torrefied biomass samples was performed using a Thermogravimetric Analyzer SDT Q600 from TA Instruments (New Castle, Delaware, USA). About 10 mg of each sample placed in a platinum crucible was loaded in a furnace of the SDT Q600 analyzer. In the first phase of heating, the temperature was ramped up to 110°C at a rate of 10°C/min under the N2 at a flow rate of 50 mL/min. Here, isothermal conditions were maintained for 5 min. The temperature was then increased to 500°C in the presence of O2 and the isothermal conditions maintained for 7 min. In the last stage, the temperature was ramped up to 950°C in the presence of O2 and maintained at this temperature for 10 min. The mass change with respect to the temperature was measured internally by the TGA SDT Q600 analyzer.
Results and discussion
Compositional analysis
Ultimate analysis
Table 2 presents the details of the ultimate analysis of raw and torrefied bagasse samples produced at two different temperatures (i.e. 250°C and 275°C) with three residence times (i.e. 30, 60 and 90 min). The ultimate analysis of the torrefied bagasse samples shows an overall trend towards an increase in carbon content and a decrease in oxygen and hydrogen content. The trend was similar when both temperature and time were increased. The percent elemental carbon gain for torrefied bagasse was 16.35% and 28.90% when the torrefaction was performed at 250°C and 275°C respectively, over an extended duration of 90 min. These findings are consistent with the study performed by Granados et al. (2017). They reported an increased release of volatile compounds with high oxygen and hydrogen content, which subsequently resulted in a decrease of elemental oxygen and hydrogen and an increase of carbon in the substrate.
Ultimate analysis of raw and torrefied bagasse.
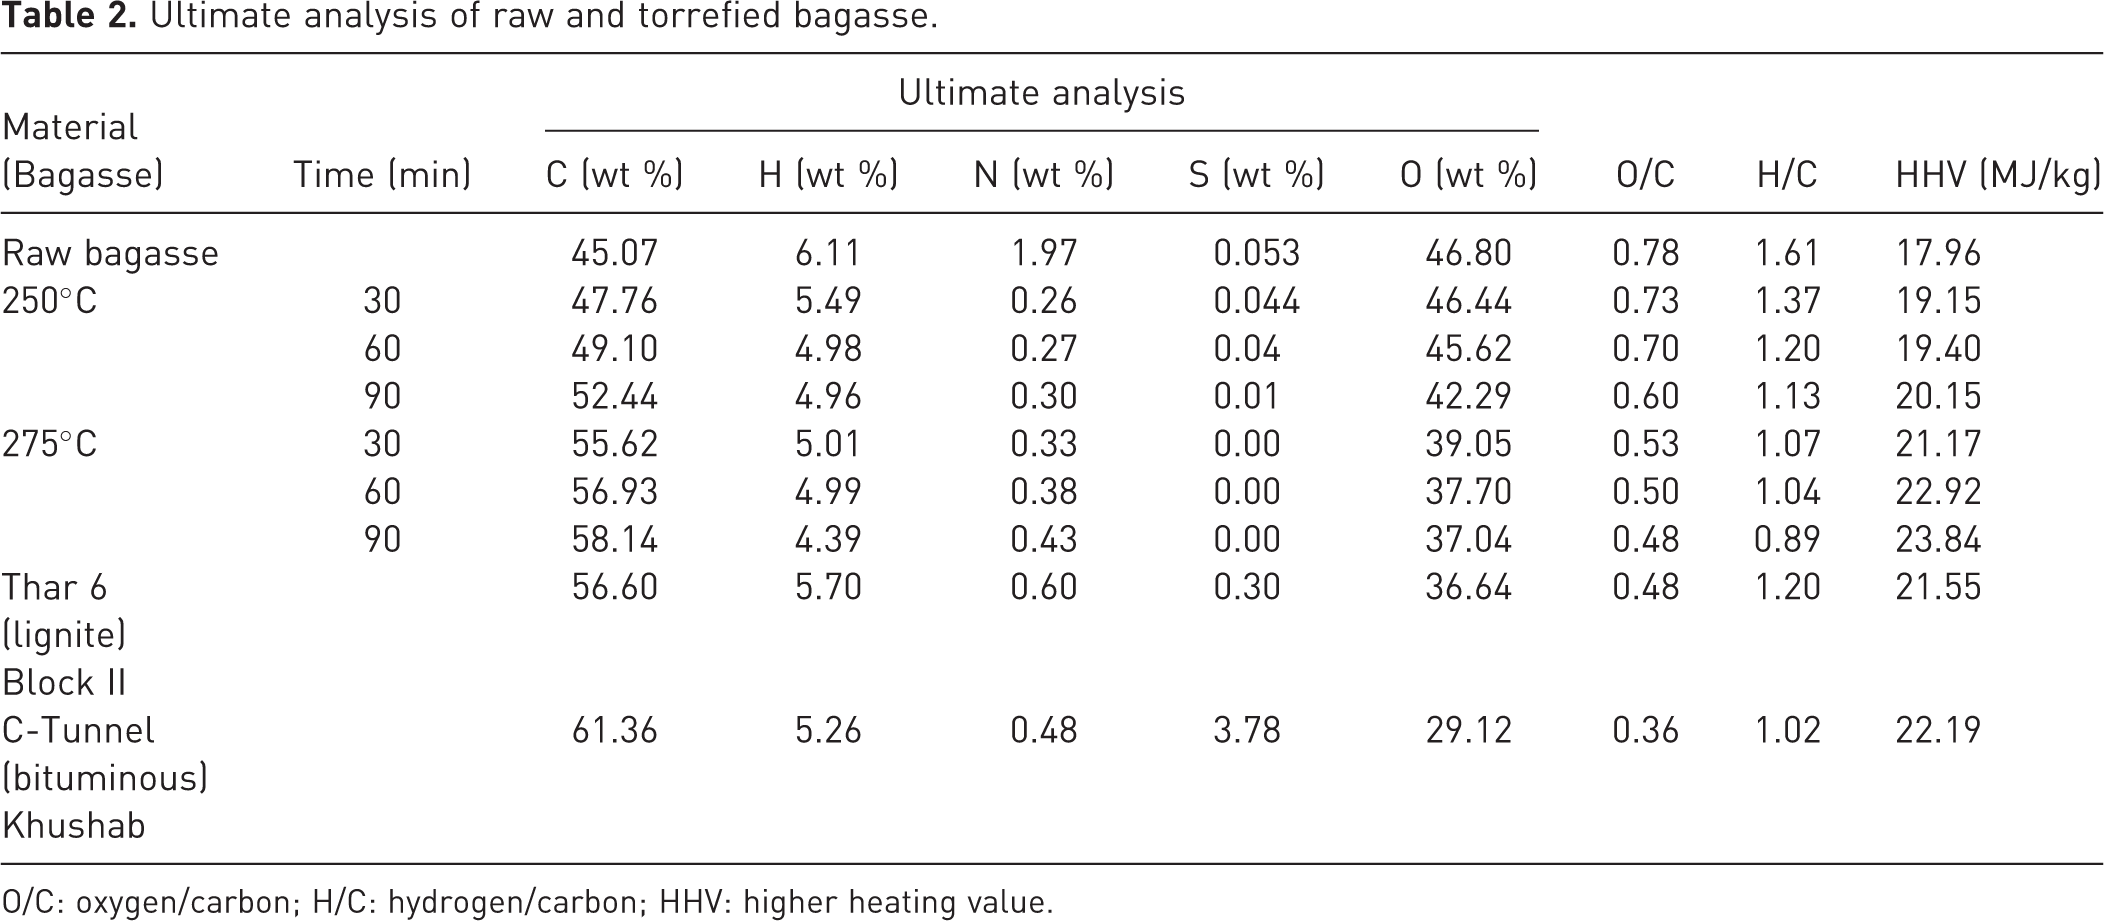
O/C: oxygen/carbon; H/C: hydrogen/carbon; HHV: higher heating value.
The average hydrogen and oxygen wt.% for raw bagasse were about 6.11% and 46.80%, respectively. During torrefaction, the percent hydrogen loss was 18.82% and 28.15%, respectively, at the final torrefaction temperatures of 250°C and 275°C. Under the corresponding temperatures, the percent elemental oxygen loss was 9.2% and 20.85% respectively. The reduction in percentage composition of elemental hydrogen and oxygen in torrefied samples is mainly due to the decomposition of carbohydrate and decarboxylation reactions from volatile components during torrefaction (Yue et al., 2017). From the ultimate analysis provided in Table 2, the percent compositions of nitrogen and sulfur in raw bagasse are very low, i.e. 0.053% and 1.97% respectively. Torrefaction under the said conditions resulted in the reduction of elemental nitrogen to 0.3% and 0.43% at 250°C and 275°C respectively. Due to the presence of sulfur at a very low concentration, the torrefaction process resulted in 100% removal of sulfur. From existing literature, it is found that the complete removal of sulfur was hardly reported. For instance, Granados et al. (2017) reported an increase in percent sulfur content from 0.12% to 0.16% with an increase in torrefaction severity. In contrast, Anukam et al. (2015) observed a 66% (from 0.03 to 0.01 wt%) reduction in sulfur content when torrefaction was performed over a temperature range of 200–300°C. However, neither of the published works reported a complete removal of sulfur content.
From the ultimate analysis, the atomic O/C and H/C ratios of raw and torrefied bagasse are reported in Table 2. The overall trend shows that the reduction of atomic O/C and H/C ratios in the torrefied samples caused the increment of HHV. Overall, 12.19% and 32.73% increase in HHV of bagasse was found with an increase in torrefaction severity at 250°C and 275°C respectively. Furthermore, with increase in time and temperature, percent decreases of 23.07% and 38.46% were observed in the O/C ratio. Similarly, the H/C ratio was found to show a decline of 29.81% and 44.72% respectively. The decrease in H/C and O/C with the simultaneous increase in HHV is attributed to the dehydration and decarbonization of raw biomass during torrefaction (Anukam et al., 2015). As a result, torrefied biomass (char) with greater charring and aromaticity is formed, which reflects greater energy densification, as observed in this study and some previous works (Granados et al., 2017; Joshi et al., 2015a; Valix et al., 2017). From the values provided in Table 2, it is observed that an increase in torrefaction severity resulted in an overall increase in HHV due to cleavage of C-O bond with simultaneous accumulation of C-C and C-H bond having higher energy values (Bai et al., 2018). The torrefaction performed at 275°C and 30 mins resulted in HHV of 21.75 MJ/kg, which was closer to both ‘Thar 6’ and ‘C-Tunnel’ coal. Therefore, biomass pre-treatment by torrefaction has the potential for use as an alternative fuel to coal.
The Van Krevelen diagram, illustrated in Figure 2, shows the changes in elemental compositions of raw and treated samples as a function of torrefaction temperature and time. The thermal treatment resulted in the reduction of the H/C and O/C ratios of the biomass and as a result, the torrefied biomass started to approach the properties of the coal (Thar and C-Tunnel) as shown in Figure 2. At 275°C, the decline in the atomic H/C and O/C ratios of the treated biomass was more than 250°C, which is attributed to the greater loss of moisture and lighter volatiles from the biomass that contains more hydrogen and oxygen (Granados et al., 2017). Based on O/C and H/C ratios provided in Table 2, it was found that bagasse torrefied at high temperature has O/C and H/C ratios closer to ‘Thar 6’ and ‘C-Tunnel’ coal with less mass and energy yields than low temperature torrefaction and it can be concluded that torrefaction of the biomass is a sustainable approach to utilize the biomass as a substitute for coal.
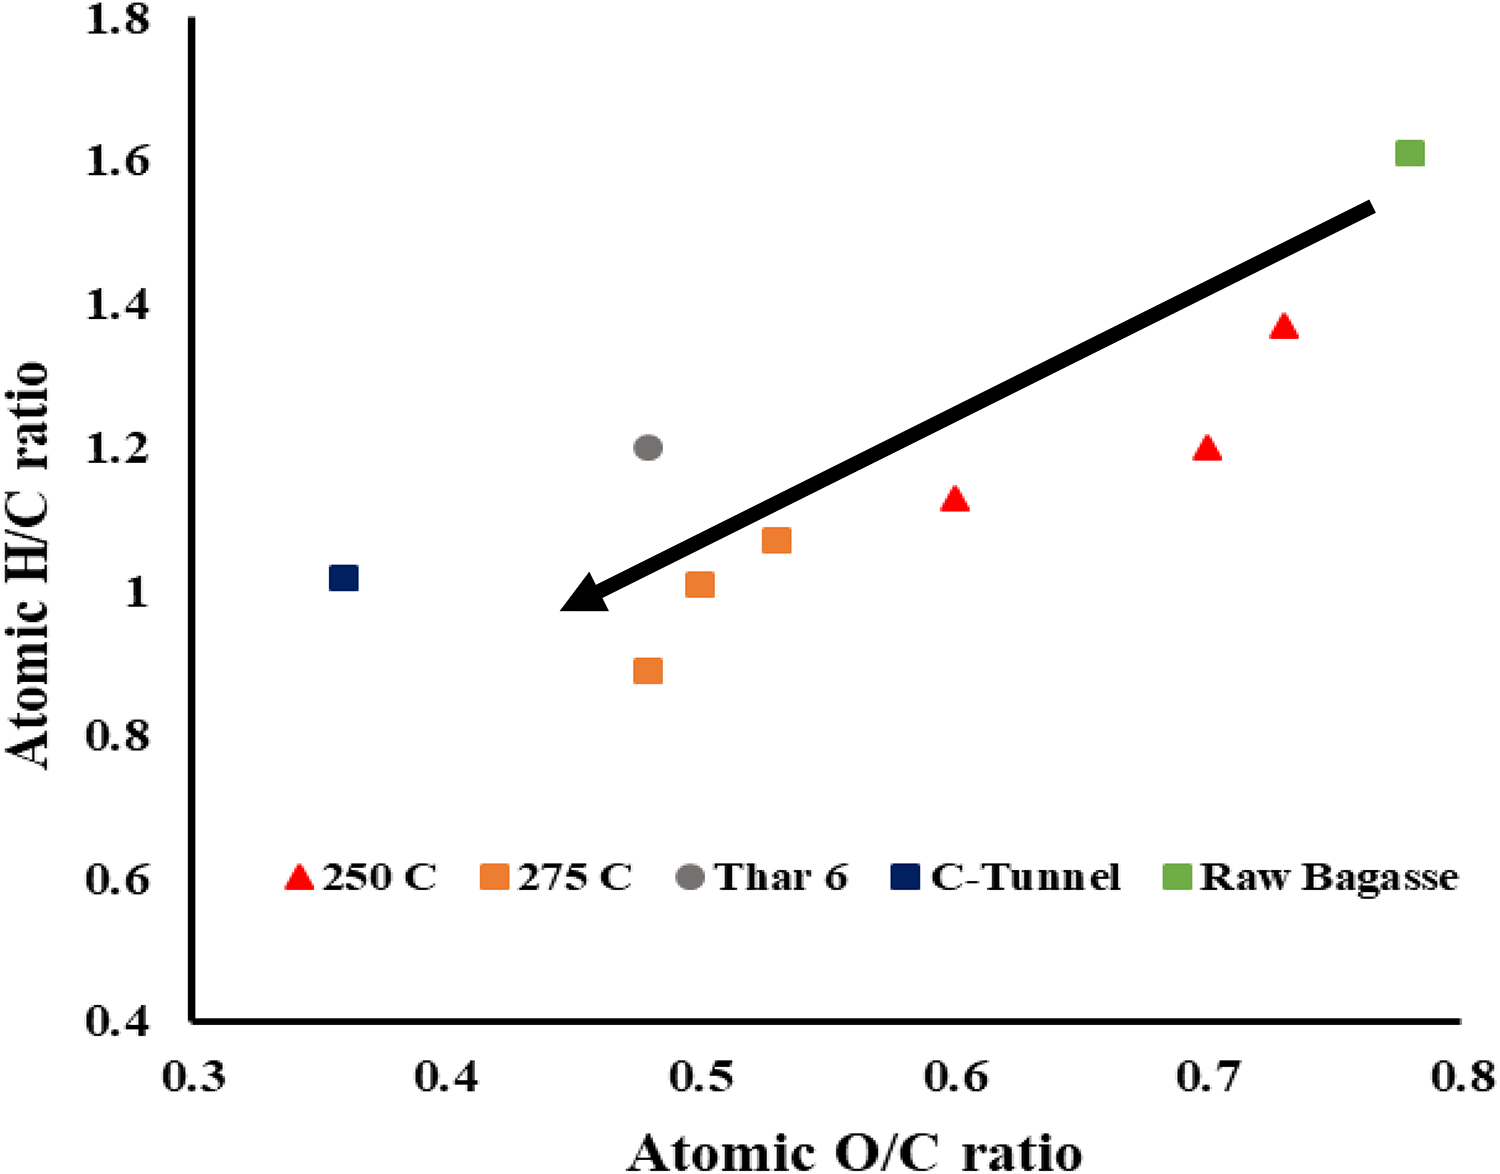
Van Krevelen diagram of raw and torrefied bagasse. H/C: hydrogen/carbon; O/C: oxygen/carbon.
Proximate analysis
The results of the proximate analysis of raw and torrefied bagasse as a function of temperature and residence time are shown in Table 3. The volatile matter of the torrefied biomass decreased with an increase in torrefaction temperature and time. At a temperature of 250°C, the volatile matter decreased from 68 to 61 wt.%, while it declined to 52% when the temperature and time were increased to 275°C and 90 mins respectively. Concurrently, the fixed carbon of bagasse appeared to increase from 22 to 34 wt% after torrefaction was performed at 250°C and varying the residence time between 30 – 90 min. In addition, a profound increase of fixed carbon to 42 wt % was observed when the final torrefaction temperature was fixed at 275°C. It was likely due to the release of moisture and light volatiles during torrefaction, which results in an increase of the fixed carbon (Chew and Doshi, 2011). It has also been reported that during torrefaction, physical and chemical properties alter in the biomass which causes an increase in its fixed carbon and energy density (Patel et al., 2011).
Proximate analysis of raw and torrefied biomass.
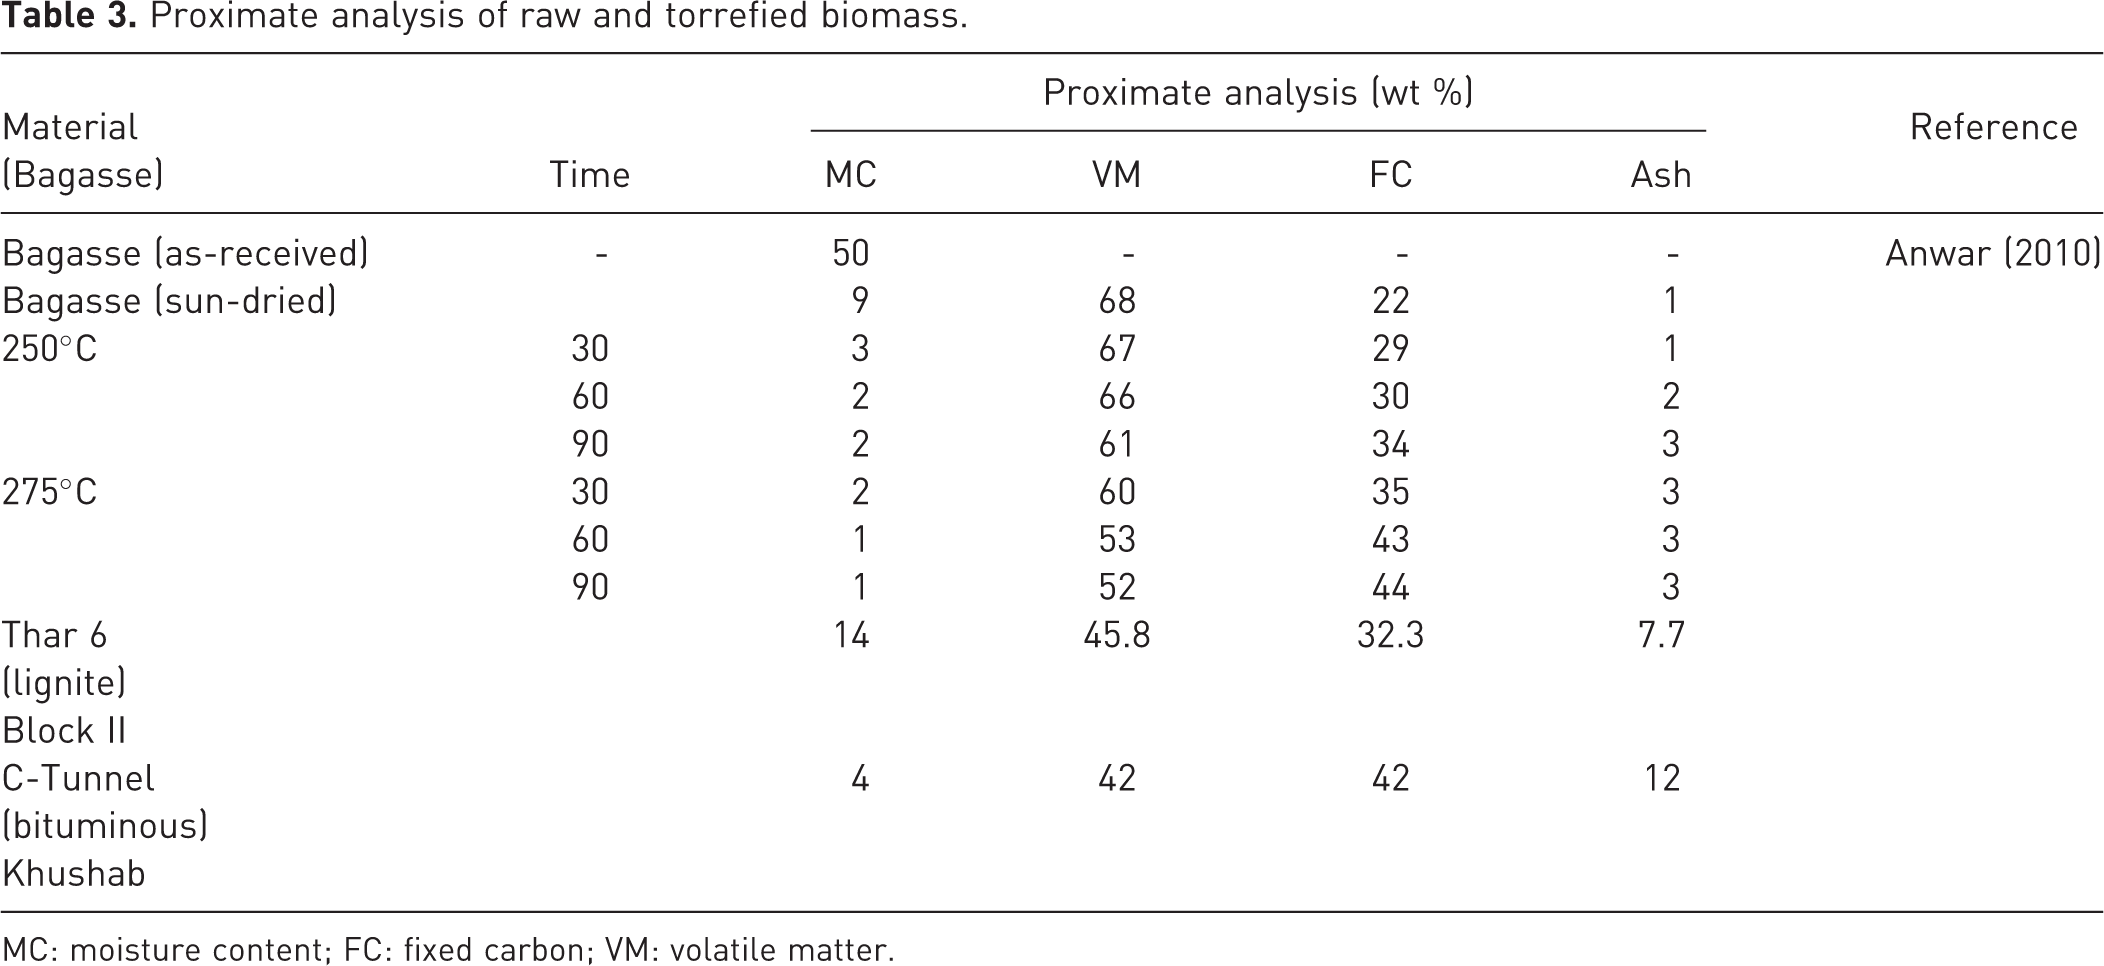
MC: moisture content; FC: fixed carbon; VM: volatile matter.
The ash content was also observed to show an increasing trend with the increase in both torrefaction temperature and time. A three times increase in ash content was observed when the bagasse was torrefied with a final torrefaction temperature of 275°C for 30 min. This finding is consistent with the study performed by Granados et al. (2017), who observed a doubling of ash content with an increase in torrefaction temperature. The increase in ash content was likely due to the loss of organic content resulted from the decomposition of hemicellulose and partial depolymerization of cellulose in the torrefied samples (Zhang et al., 2015).
Mass yield and energy yield
In Table 4, the results of mass yield (ymass ), energy yield (EY ) and energy density (Edensity ) of raw and torrefied samples are presented. The values showed a linear correlation with both final torrefaction temperature and time. The reported values of ymass and EY showed a decreasing trend while the Edensity increased with an increase in process temperature and time. The reduction in ymass is mainly attributed to the devolatilization and thermal cracking of the biomass (Crawford et al., 2016). The maximum ymass obtained is 66.14% and 51.54% when final torrefaction temperatures of 250°C and 275°C were set respectively as presented in Table 4. It can also be seen from the results that at the higher temperature of 275°C, the rate of change of ymass decreased marginally from 55.48% to 51.54%. Similarly, EY , calculated by ymass and HHV data, was found to be 74.2% and 68.41% respectively at the torrefaction temperatures of 250°C and 275°C respectively and residence time of 90 min. The declining trend of both ymass and EY led to increased Edensity (equation (3)). At 250°C, the Edensity was increased from 1.07 to 1.12 when residence time was increased from 30 to 90 mins. Meanwhile, under a similar time and at a higher temperature of 275°C, a 33% increase in Edensity was observed. The increase in Edensity is higher than the values reported for torrefied bagasse in published works. For instance, Granados et al. (2017) obtained Edensity of 1.28 when torrefaction was performed at 270°C for 1 h. In another study, Joshi et al. (2015a) performed torrefaction at 250°C for 45 min and obtained Edensity of 1.08, which is lower than that obtained in this study (250°C for 30 min). In addition, Granados et al. (2017) examined physiochemical characteristics of torrefied bagasse under different thermal conditions (230–290°C) and obtained the highest Edensity of 1.29 at a temperature of 290°C. Chen et al. (2017) investigated the torrefaction performance and obtained an EY of 1.09 at a temperature of 212°C. The resulting values are comparable with those published in the literature. Therefore, torrefaction of the bagasse under mild torrefaction temperature is a recommended pretreatment method to upgrade the fuel characteristics of bagasse for producing renewable fuel. However, to maintain a balance between torrefaction severity and energy consumption, it is necessary to identify the optimum torrefaction temperature and time. From literature, the widely accepted optimal balance of mass and energy for biomass torrefaction is 80% of mass yield and 90% of energy yield (Álvarez et al., 2018; Arias et al., 2008). The results showed that mass and energy yields are close to the target values when torrefaction was performed at 250°C with a residence time of 30 min. Therefore, this temperature and time are selected as the optimum conditions for the torrefaction of the biomass.
Mass and energy yields and higher heating value (HHV) values for optimal torrefaction temperature determination (dry basis).
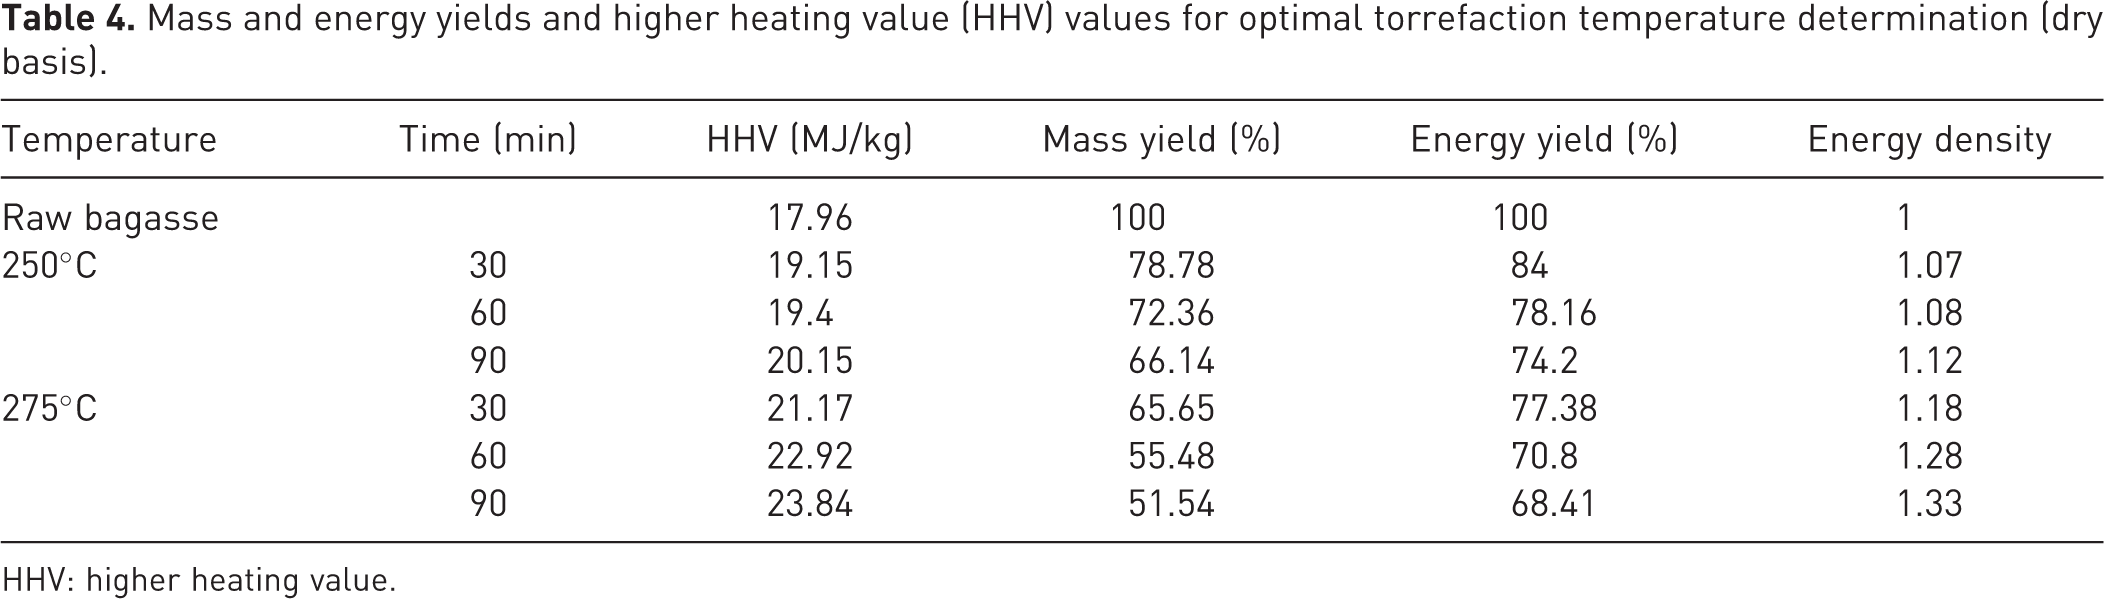
HHV: higher heating value.
Water absorption test
Water uptake test is usually performed to analyze the hydrophobic nature of the torrefied product. The moisture absorption capability of the virgin and torrefied samples in terms of percentage increase in weight is shown in Figure 3. As expected, raw bagasse has higher water absorbance with a total weight gain of 90.30%. The treated samples showed lower water-absorbing capacity than the raw bagasse, which is probably caused by the dehydroxylation and decarboxylation of polysaccharides during torrefaction. It can be observed that the water absorption declined to 76% and 72 % when torrefaction was performed at 250°C and 275°C respectively. The non-oxidative thermal treatment of the biomass reduced its ability to form a hydrogen bond with water by removing the O-H groups present in virgin biomass (Acharya et al., 2012). The changes in lignocellulosic polymers during torrefaction result in the formation of unsaturated non-polar structures. These non-polar structures are produced as a result of partial condensation of tar on the torrefied biomass and thus, prevent the absorption or condensation of moisture in the pores of the biomass (Shankar et al., 2011; Suarez and Luengo, 2003).
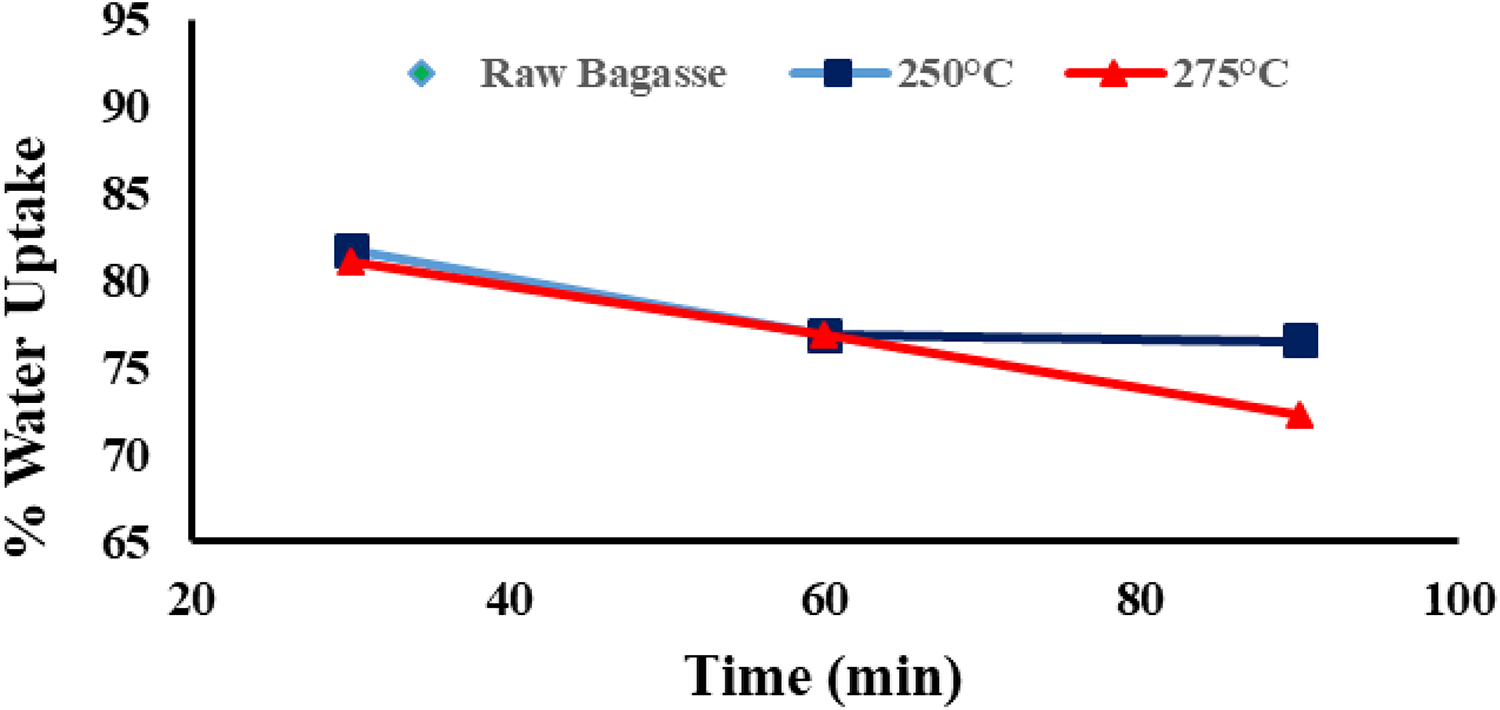
Water uptake – immersion test of raw and torrefied bagasse.
Besides torrefaction temperature, residence time was also observed to have a significant impact on the water uptake capability of the bagasse. At lower temperatures (i.e. 250°C), the results showed insignificant changes after 60 mins of residence time. However, at higher torrefaction temperature (i.e. 275°C), the percent water up-take was observed to show a declining trend with an increase in residence time. At 275°C, the percent water uptake was reduced from 82% to 72% when the residence time was increased from 30 min to 90 min. This can be associated with the high decomposition rate of hemicellulose content at intense torrefaction process conditions (Zheng et al., 2017). Further evidence from the study performed by Zheng et al. (2015) showed the reduction in hemicellulose content from 77% to 48% with an increase in temperature from 210°C to 270°C. The reduction was observed to change from 56.7% to 47.2% when residence time was changed from 20 min to 60 min (at T: 270°C). Thus, this observation shows the implication of residence time on the reduction of hemicellulose content, which was observed in the form of reduction in water uptake in this study.
Structural composition analysis
FTIR analysis was performed to inspect the chemical changes in the bagasse induced by the torrefaction. The FTIR spectra of the raw and torrefied biomass are provided in Figure 4. To explain some important structural changes, some well-defined peaks were labeled and assigned to different functional groups as follow (Pandey, 2003; Popescu et al., 2010): 3300–3500 cm−1 (a) for the vibration of O-H bond (Kanwal et al., 2019; Liu et al., 2008), 2900 cm−1 (b) for C-H stretching in lignin (; Aslam et al., 2019; Xiao et al., 2015), 1750–1800 cm−1 (c) for unconjugated C=O valence vibration of aromatic rings (Zheng et al., 2014), 1400–1350 (d) for C-H bond vibrations and 1000 cm−1 (e) for C-O, C=C, C-C-O groups present in cellulose, hemicellulose and lignin (Chang et al., 2012; Yang et al., 2007). From Figure 4, the obvious changes in the IR spectrum of the torrefied bagasse can be noticed when compared with the raw biomass and a decrease in the intensity of all the peaks was observed as the process conditions were intensified.
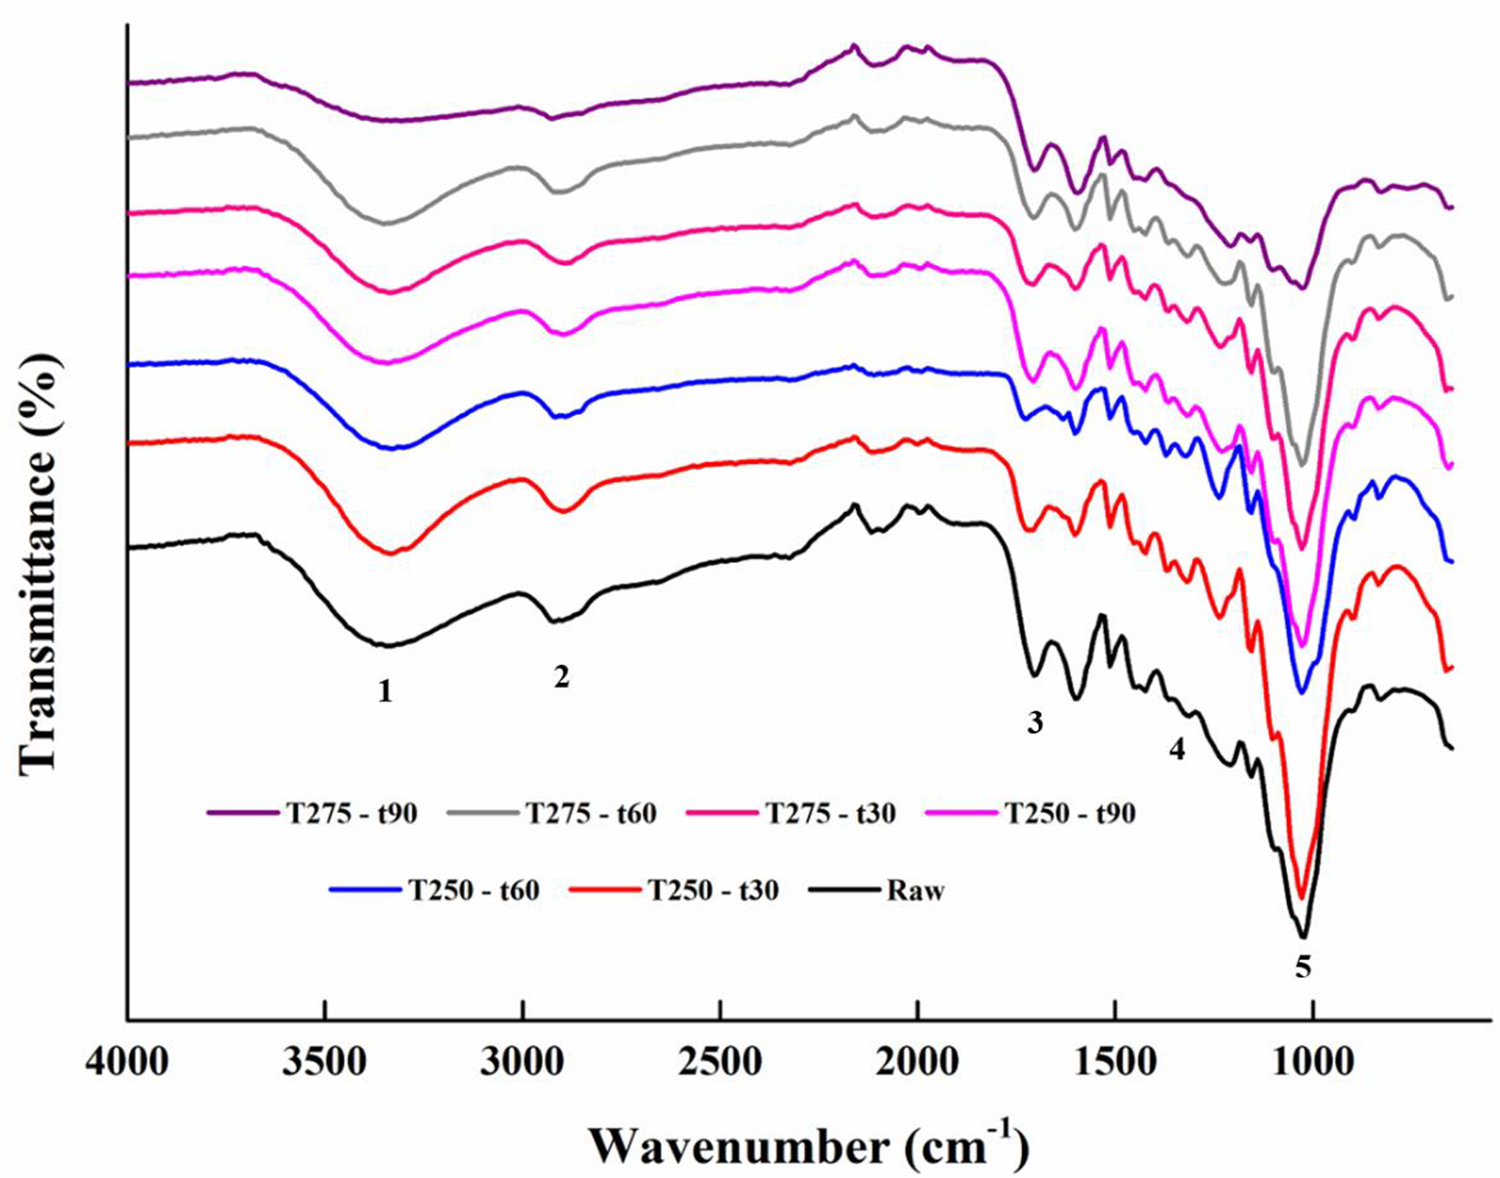
Fourier Transform Infrared (FTIR) spectra of raw and torrefied bagasse.
In Figure 4, the broader band between 3300–3500 cm−1 is attributed to the vibration of O-H bonds. The presence of OH group is probably due to the presence of alcoholic, hydroxyl and phenolic group attachments in carbohydrate and lignin content of the biomass (Liu et al., 2008). With the increase in the process temperature and time, the peak intensity was reduced due to the occurrence of methylation reaction during the torrefaction process. The loss of this functional group is beneficial since it enhances the hydrophobicity of the torrefied biomass (Ghaffar and Fan, 2013). In addition, the weak signal against C-H stretching of aliphatic groups, observed at 2900 cm−1, disappeared due to dehydration reaction at higher temperatures. The bands at 1750–1800 cm−1 originated from conjugated C=O stretching associated with aromatic ring and C=O stretching of ketones. These bands were strengthened as the torrefaction temperature and time were increased. This increase in the intensity of the peak around 1775 cm−1 is due to the dehydration of cellulose and hemicellulose, which resulted in the reduction of OH group intensity, the formation of C=O and strengthening of C=O vibration intensity (Ru et al., 2015).
Soft vibrations associated with the C-H bond were observed around 1400–1350 cm−1. The vibrations were smoothed with the increase in torrefaction time and temperature and can be associated with the deformation of amorphous cellulose. The vibrations at 1000 cm−1 occur due to the presence of C-O, C=C, and C-C-O groups in cellulose, hemicellulose or lignin. The decrease in this peak intensity, with the increase in torrefaction severity, inferred disruption of lignin caused by the degradation of aromatic compounds linked with it (Yang et al., 2007). The decrease in the intensity of different peaks in the torrefied samples in comparison to virgin biomass, confirms the structural changes in the various chemical compounds present in bagasse such as ketones, aromatic compounds, esters, aldehydes etc. and these changes validated the reduction in the water absorption capability of the torrefied biomass.
Thermogravimetric analysis
Thermogravimetric analysis of raw and torrefied biomass was performed to investigate the thermal stability and pyrolysis behavior of raw and samples thermolyzed at 250°C and 275°C for 30, 60 and 90 mins. Figure 5 represents the TGA and weight loss rate (differential thermogravimetry, DTG) curves for raw and torrefied samples. In all the samples, three distinct stages of weight loss, with different elapse time, can be observed. These stages are also recognizable in the DTG plot. The first small peak below 100°C and approximately closer to 75°C is attributed to the evaporation of moisture in the samples. For the torrefied samples, this peak is less pronounced due to the release of absorbed water and some volatiles during the torrefaction process. Consistent with TGA/DTG results, the FTIR analysis showed the reduction of the peak signal associated with O-H functional groups (3300–3500 cm−1). As discussed earlier, it may be due to the transformation of polar functional groups to non-polar as hydroxyl groups, which are responsible for the formation of hydrogen bonds with water, are removed making the torrefied biomass less hygroscopic (Conag et al., 2017). In this study, 69–88% moisture content was removed from the biomass as a result of torrefaction. Despite this marginal change, the curves representing the raw and torrefied samples appeared very close to each other. The appearance of the curves at such close intervals may have been due to the utilization of a small amount of biomass during analysis. Following moisture evaporation, the main thermal degradation step started at the onset temperature of 208°C, 8% weight loss was observed for the raw bagasse. A prominent peak corresponding to the maximum weight loss rate appears in the region of 200–400°C in the DTG curve. Here, the main decomposition step takes place as a two-step process. In the first step, a shoulder is deformed around 230°C due to the decomposition of hemicellulose in the bagasse and then, the main degradation of the cellulosic structure takes place and a maximum peak appears around 320°C (Aslam et al., 2016; Poletto et al., 2012). In FTIR, these steps are reflected by the strengthening of the signals around 1750–1800 cm−1 and weakening of the peak intensities around 1400–1350 cm−1, thus signifying the dehydration of hydroxyl in hemicellulose and deformation of amorphous cellulose. The presence of a sharp peak in the DTG curve indicates the presence of high hemicellulose content in the bagasse. However, with the increase in torrefaction severity, a sharp decline in the peak values was observed. It means that the decomposition of hemicellulose in biomass was accelerated by the increase in the torrefaction severity, where the integrity of biomass is probably disturbed and linkages between the main chemical components are weakened (Chang et al., 2012). Compared to the DTG curve for raw bagasse, the temperature for maximum weight loss rate in the DTG curve for torrefied samples is higher, which is also indicative of higher thermal stability of the torrefied samples. The third stage (400–550°C) in the DTG curve stems from the degradation of the lignin content of the bagasse. Like cellulose and hemicellulose, the increase in torrefaction severity results in the significant reduction of the lignin content in bagasse. As observed in structural composition analysis (Figure 4), the peak signal (1000 cm−1) associated with C-O, C=C and C-C-O of lignin appeared to have been reduced with torrefaction severity. Therefore, it signifies the degradation of aromatic compounds associated with lignin content.
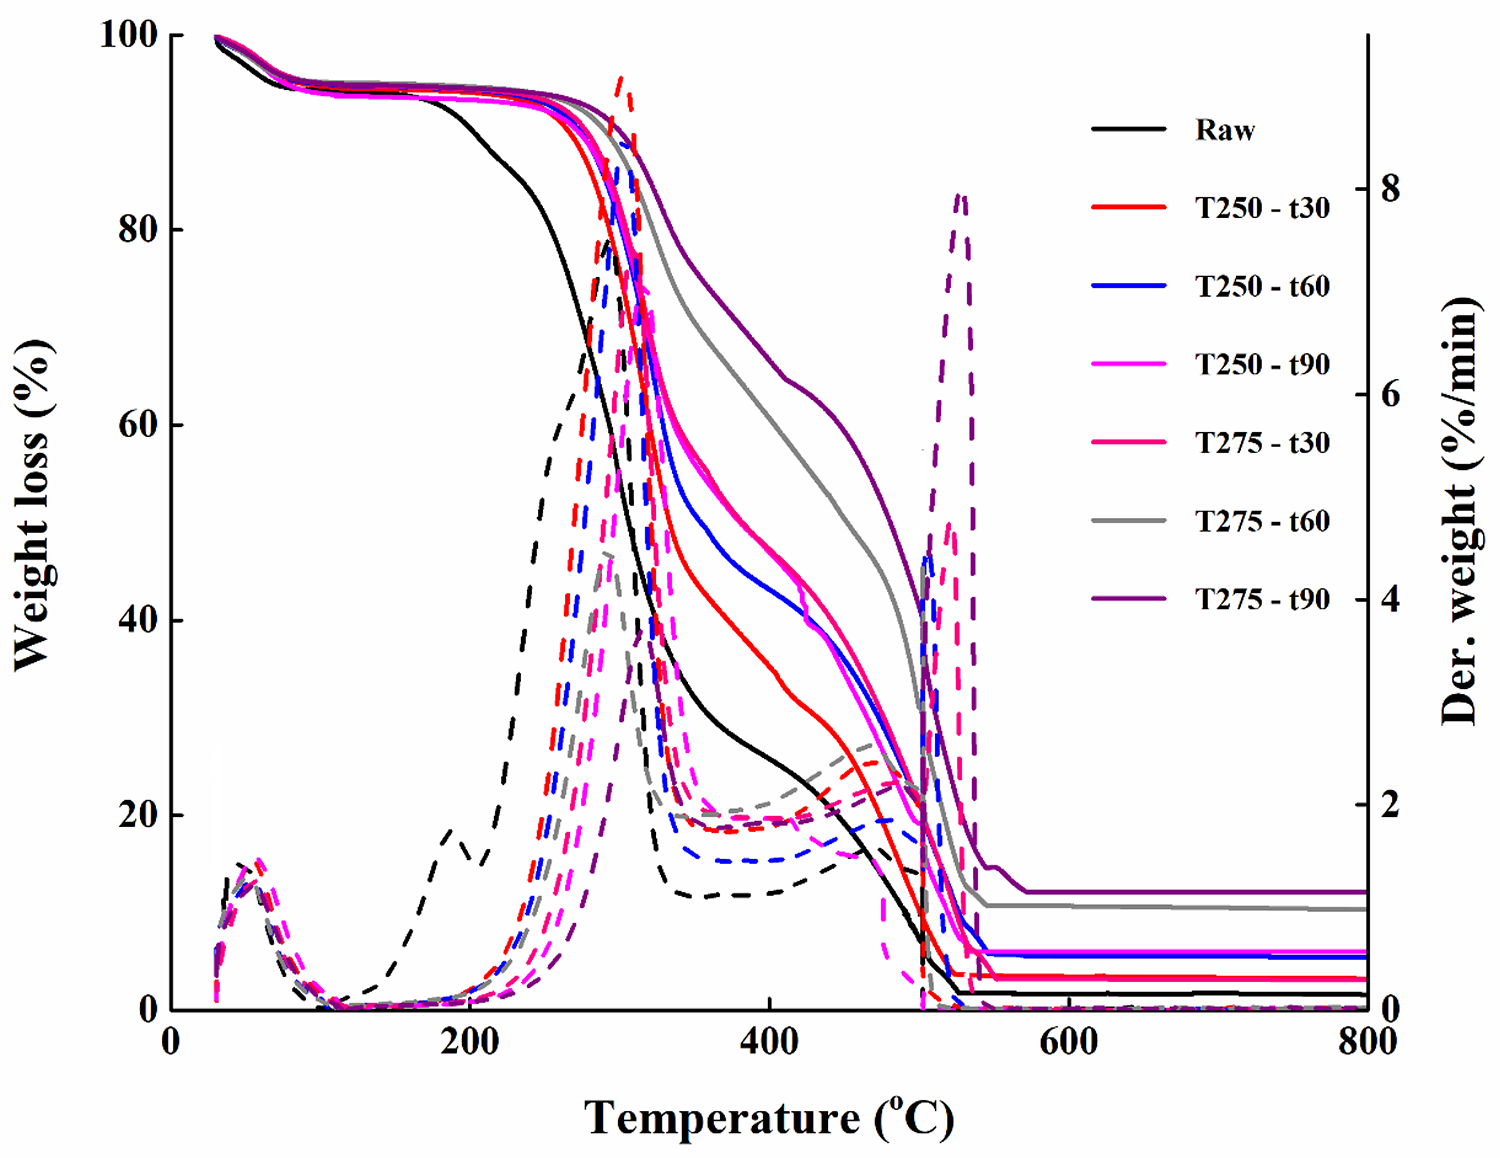
Thermogravimetric weight loss (TGA) and differential thermogravimetry (DTG) results of raw and torrefied bagasse samples.
From the aforementioned discussion, it is found that torrefaction changes the devolatilization characteristic of the virgin biomass. The findings from the detailed analysis of TGA and DTG curves are inconsistent with those of FTIR spectra. From the overall discussion, it is concluded that the weight loss in TGA is a valuable measure of the torrefaction intensity and is mainly due to the thermal deterioration of hemicellulose and short-chain lignin components which are released in the form of gaseous products (Chang et al., 2012). The delay in the weight loss in TGA curves of torrefied biomass thus appears as a consequence of the reduction in hemicellulose content in the treated samples. From the overall discussion, it can be concluded that during torrefaction, hemicellulose is the most reactive segment of the biomass and may produce significant results on the sustainable use of biomass as fuel.
Economic viability
Biomass is not only a RE source but also a carbon-neutral fuel that allows its application as a substitute for fossil fuels. The torrefaction process can enhance the fuel characteristics of the biomass by increasing its energy value, but the economic advantage of this process is solely dependent on the final utility of the torrefied biomass. Generally, torrefaction of the biomass is followed by a palletization process which improves the supply chain logistics by increasing energy and mass density of the biomass (Batidzirai et al., 2013; Rudolfsson et al., 2017). In the combined process, biomass will undergo the following steps; grinding, screening, torrefaction, milling and palletization. The major cost involved in this process includes the biomass purchase, supply, storage and grinding, capital and operational expenditure, maintenance cost, energy requirement, transportation and labor cost.
The cost of indigenous biomass torrefaction is higher than the local coal available at present but the environmental concerns and implementation of the carbon credit market make this process attractive for business. The carbon credit can increase the income of the plant, net present worth and internal rate of return. In the long run, the scaling up of the torrefaction process technology can cut down the total cost by reducing the production costs but this is still uncertain. That is why the laboratory-scale torrefaction reactor plays an important role in the development of the torrefaction process protocols.
Conclusion
The torrefaction process had a great impact on the fuel characteristics of the bagasse and changes in these characteristics were more extensive at severe process conditions. The compositional analysis of the torrefied bagasse indicated a maximum carbon gain of 29.66% at 275°C and 90 mins. Subsequently, percent hydrogen and oxygen loss were 20.15% and 20.85% respectively. The Van Krevelen diagram demonstrated a decrease in H/C and O/C atomic ratios in torrefied biomass samples, which indicates that after the application of the torrefaction process, the behavior of the biomass tends to move towards the behavior of coal. The maximum HHV, i.e. 23.84 MJ/kg, was shown by the biomass sample torrefied at 275°C and 90 mins. The optimal torrefaction temperature conditions turned out to be 250°C and 30 mins for the targeted mass and energy yields of 80% and 90%, respectively. The structural and thermal analysis of torrefied bagasse exhibited significant reductions of hemicellulose and cellulose fractions, which render torrefied product hydrophobic. Thus, the results obtained in this study showed that torrefaction can be a sustainable treatment process to upgrade the fuel characteristics of biomass. However, a simulation study of scaling up the torrefaction process, having the ability to handle various input biomasses and constant product quality, may be carried out.
Footnotes
Acknowledgements
The authors are grateful to the Department of Chemical Engineering, University of Engineering and Technology, Lahore, Pakistan which financially supported this work.
Declaration of conflicting interests
The authors declared no potential conflicts of interest with respect to the research, authorship, and/or publication of this article.
Funding
The author(s) disclosed receipt of the following financial support for the research, authorship and/or publication of this article: The research work was supported by University of Engineering and Technology, Lahore, Pakistan vide Letter No. ORIC/94-ASRB/136.