
Abstract
A solution strategy based on integer linear programming models has been developed for leaf sweeping operations in the Argentine city of Trenque Lauquen. The aim is to achieve efficiency in the assignment of sweepers to city blocks, the identification of leaf bag deposit points and the routes to be followed by collection trucks for leaf bag pickup. Previous to this strategy, sweeper assignments were improvised and inefficient, with blocks often left unswept. Furthermore, no method was available for accurately determining the number of sweepers needed to ensure either full coverage of all city zones within the working day or a balanced work load distribution across all sweepers. Application of the solution strategy by the city has resulted in efficient definitions of sweeper requirements while optimizing sweeper assignments such that all blocks are covered. Once the strategy is fully implemented, the number of bag deposit points under the manual definitions should be reduced by roughly one-half and the total travel distance of the truck routes, modelled as an asymmetric travelling salesman problem, should be cut by 10–15% with the consequent savings in time, vehicle use and fuel consumption.
Introduction and description of the problem
Some 445 km west of the Argentine capital of Buenos Aires lies the city of Trenque Lauquen, home to 33,442 residents (2010 National Census) distributed across its surface area of about 400 hectares. A distinctive characteristic of the city is the wide medians running down the centre of most streets that have been planted with a diverse range of tree species. In all, there are 616 street blocks with treed medians. The result is a high ratio of green space per inhabitant, but also a constant need for street sweeping and collection to prevent leaves from accumulating along the kerbs, blocking storm drains and making road surfaces slippery. Ideally, every block should be swept at a set frequency (e.g., every day, every other day, etc.), depending on the part of the city it is located in.
The Trenque Lauquen municipal authorities operate two different leaf sweeping systems. One is mechanical, which consists of using street cleaning vehicles to sweep the median kerbs. Parking along them is prohibited so the vehicles can proceed unobstructed. The present study, however, is confined to the other system, which uses human sweepers equipped with brooms and bag-lined leaf collection carts to pick up the leaves, papers and other organic or similar waste that collects along the kerbs bordering the sides of each block. Over the entire city there are approximately 1800 such block sides that must be swept manually. Each sweeper begins their route at one of four starting points around the city. The carts are of limited capacity (approximately 10 kg), so multiple times per route the sweeper has to deposit a full bag at a street corner and install a new bag in the cart before continuing on their rounds. When work on this study began, the manual collection system employed 84 sweepers deployed across three leaf sweeping zones into which the city is divided. Each one was supervised by a zone captain who assigned sweepers to specific block sides on a daily basis, often in response to calls or complaints from local residents. Zone 1 had 21 sweepers and 629 block sides, Zone 2 had 35 sweepers and 678 block sides and Zone 3 had 28 sweepers and 507 block sides. This zonal division, shown on the map in Figure 1, is maintained by the municipal authorities for administrative reasons and is considered for present purposes as a given. The four sweeper route starting points are also indicated on the map.
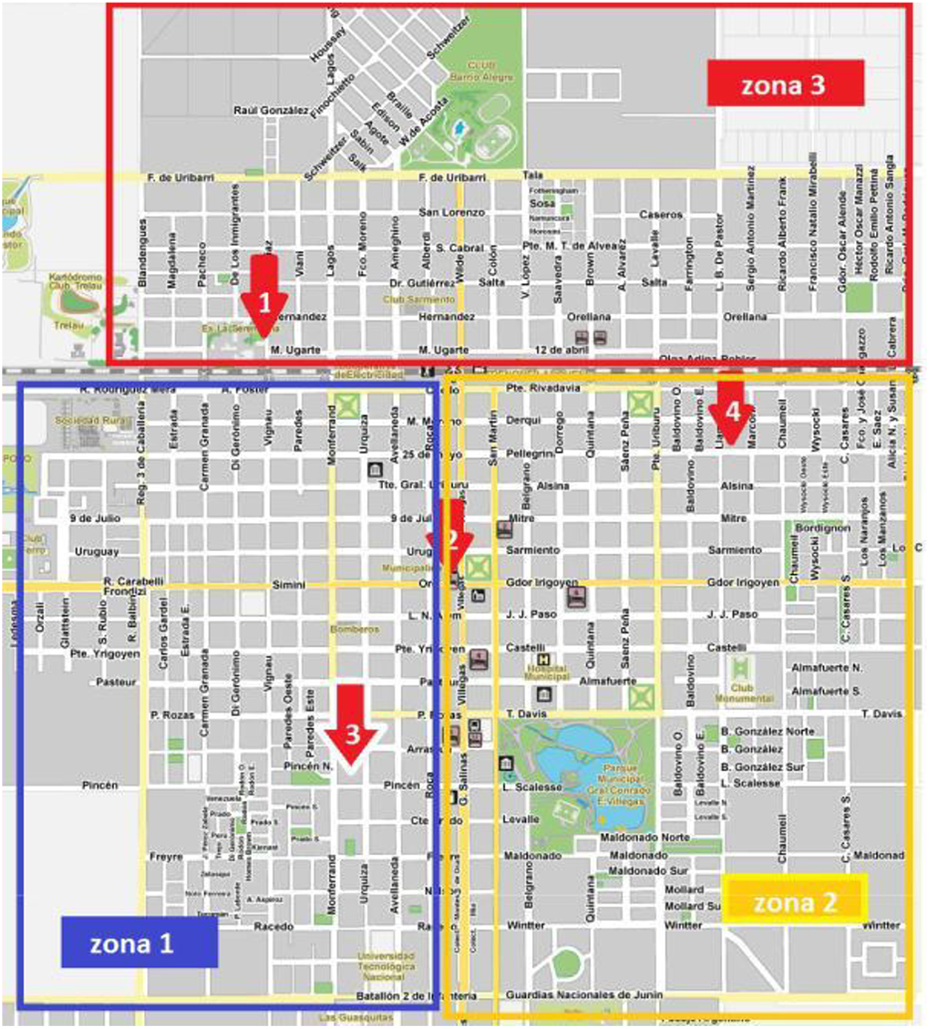
City leaf sweeping zones and sweeper route starting points.
The result of this daily assignment system was that each sweeper tended to improvise their own routes as they went, depositing bags of leaves at any and every intersection. Bag pickup in each zone was handled by two trucks, each manned by a driver and an assistant.
This “manually” organized setup previous to the strategy developed in this study was unsatisfactory for a number of reasons, among which were the following:
In light of these deficiencies, the objectives set for the solution strategies presented in this study were as follows. Determine whether the number of sweepers under the manual system was sufficient (this was the main objective of the municipal authorities). Generate a leaf sweeping plan and feasible sweeper routes that would satisfy the desired sweep frequencies for each block. Also, the routes generated had to satisfy a certain level of elegance or simplicity (this point is examined in detail in the Stage I: Assignment of block sides to sweepers section). Determine the intersection corners where sweepers were to deposit the leaf bags in containers placed there by the municipality for the purpose. The number of corners would have to be such that sweepers could deposit full bags frequently enough to ensure the capacity of their carts was never exceeded, yet small enough that efficient collection truck routes could still be implemented. Define collection truck routes that optimized vehicle use and work time.
The solution to the problem posed by these objectives was subject to the following considerations, which were incorporated with the agreement of the municipality.
The remainder of this study is organized into four sections. The second section surveys the related literature, the third section details the solution strategies for each of the three stages into which the problem will be divided, the fourth section sets out the results and the fifth section presents the conclusions and some possibilities for future research.
Survey of the literature
A number of works in the literature on the type of problem addressed here and related issues are worthy of mention. Certain of them display key similarities to the specific characteristics of the present problem and contributed appreciably to the development of our modelling.
Eglese and Murdock (1991) reported on the implementation of a routing programme in a rural area of northwest England. Each district of the area has a single street sweeping vehicle that begins its route at the start of the working day from a depot. Since the vehicles’ capacity is limited, defining the routes in this case is a non-deterministic polynomial-time hard (NP-hard) version of the well-known Chinese postman problem. The fact that the districts are rural means that unlike in other studies, there are multiple dump sites, light traffic volumes allowing sweepers to work in either direction on one-way streets and few time constraints on the availability of streets for sweeping. Such time restrictions generally do exist, however, in more urbanized areas where parking regulations limit sweepers’ access during certain hours. The authors solved the problem using a heuristic algorithm to define sweeper routes that minimize dead distance while also ensuring both sides of each street are swept on the same day.
Bodin and Kursh (1978) developed a system of multiple street sweeper vehicles for New York City and Washington, D.C., which differ from the case in Eglese and Murdock (1991) in that they are highly urban areas where most streets are one way and parking restrictions are complex. The latter characteristic is treated using time windows. Two approaches were considered: breaking down the area to be swept into subclusters and solving a single-vehicle routing problem for each one, or solving a single-vehicle routing problem for the entire area and then breaking the route down into subtours each of that would be handled by a single vehicle. The best empirical results in terms of savings in distance covered were obtained with the latter approach.
In Braier et al. (2017), the authors developed linear programming techniques to optimize the collection of recyclable waste in the Argentine city of Morón. The Chinese postman problem is solved using a mixed graph, but with the addition of constraints that capture local traffic regulations given that the waste collection is carried out by trucks. Due to the complexity involved in a mixed graph, the approach also implements search acceleration algorithms that merge the subtours generated by the model solution. A tabu search algorithm is employed to improve the distribution of the collection area among the various trucks.
Bianchetti et al. (2017) studied heuristic algorithms for the division into zones of a waste collection area in a system also using trucks. In addition to identifying tours that delimit the zone to be served by each vehicle, the authors’ model determines how each zone should be covered so as to minimize vehicle wear and tear while obeying traffic regulations.
Finally, in Bonomo et al. (2012), an account is given of the optimization of waste container collection in the southern districts of Buenos Aires. The problem reduces to the well-known travelling salesman problem (TSP), one of the most famous problems in mathematics, which consists of determining the shortest route that visits every member of a predefined set of “customers” (for more on the TSP, see Applegate et al. (2006)). The Concorde solver (Applegate et al., 2001) is used to propose multiple solutions. The model reduces vehicle wear and tear measured in units of mechanical work. The minimization of work aside, this problem is fairly similar to the third stage of the problem studied in the present article.
Methodology
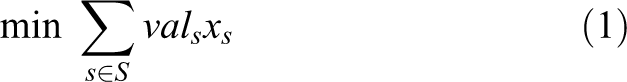
An initial attempt was made to attack the entire leaf sweeping problem by formulating it as a single integer linear programming (ILP) model. ILP is one of the most commonly used techniques for solving a combinatorial optimization problem (for a full technical treatment of ILP, see Schrijver (1998)). An ILP model is set up by first defining a number of variables
Unfortunately, because of the large number of variables and constraints in our problem, the resulting unitary formulation was in practice insoluble. The experimental approach that was eventually adopted involves decomposing the problem into three stages, each of which implements a separate ILP model for each of the three zones of the city. As noted above in the description of the problem, this zonal division was taken as exogenous.
The first stage of the strategy determines which blocks are swept by which sweeper. The set of contiguous blocks assigned to a given sweeper is denoted as a segment. A segment must be swept in its entirety within the day’s working hours. The second stage of the strategy determines the order in which sweepers visit each block side within their assigned segment and the corners at which they deposit the leaf bags in containers placed there by the municipality. Finally, the third stage traces out the routes to be followed by the leaf bag collection trucks. In the following sections, the three stages are expounded in detail.
Stage I: Assignment of block sides to sweepers
In the first stage, the objective is to assign each segment (set of blocks) to a sweeper in such a way that all blocks to be swept in each zone are covered. In doing so, the strategy seeks a distribution of the assignments across all sweepers that is balanced, that is, a work load that does not exceed pre-set limits so it can be completed in 5–6 hours. The model also attempts to define segments that exhibit a certain simplicity or elegance so that the sweepers do not lose their way, which would result in efficiency losses and/or areas left unswept.
The solution approach for this stage is an adaptation of the ILP model that was developed for the 2010 Argentine census to assign enumerators to blocks (Bonomo et al., 2013). Since in that case there was an exponential number of variables, the model was solved iteratively for subsets of them until an overall solution was found. The subsets themselves were generated incrementally by an algorithm that constructed ever larger segments. Although the street sweeping problem is in essence the same as the census case, there are differences mainly in the objective function to be maximized and the way in which the segments are generated. The following is a more formal description of the present model.
Let M be the set of blocks and S the set of possible segments (how the latter are generated is explained in the Heuristic solution of the model section below). Each segment
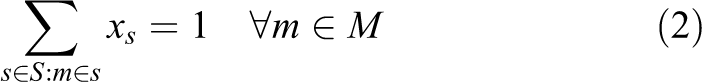
where
Valuation 1: Compactness
This valuation formula expresses the compactness of the segment, the idea being to avoid segments that are highly dispersed or complex in shape. The metric is based on the notion of the moment of inertia of a district composed of census tracts, as defined by Weaver and Hess (1963). The distance between an arbitrary point x in the district and the centre of mass of each census tract is squared and then multiplied by the latter’s population. The sum of the results over all tracts is the moment of inertia of the district about point x. The point that gives the smallest moment is the district’s centre of gravity, which will just be the centre of mass if all tracts have the same population.
In the present case, the districts correspond to our segments and the census tracts to our blocks. For any segment s, the valuation is given by the maximum distance between a segment’s centre of mass and the centres of mass of each of its constituent blocks. In formal terms, we define
As an example, consider the two segments illustrated in Figure 2, both containing four blocks. For each one the compactness valuation is given by the length of the longest distance between a centre of mass of a block and that of the entire segment, and in this case indicates that the segment on the right has the lowest, and therefore the better, valuation.
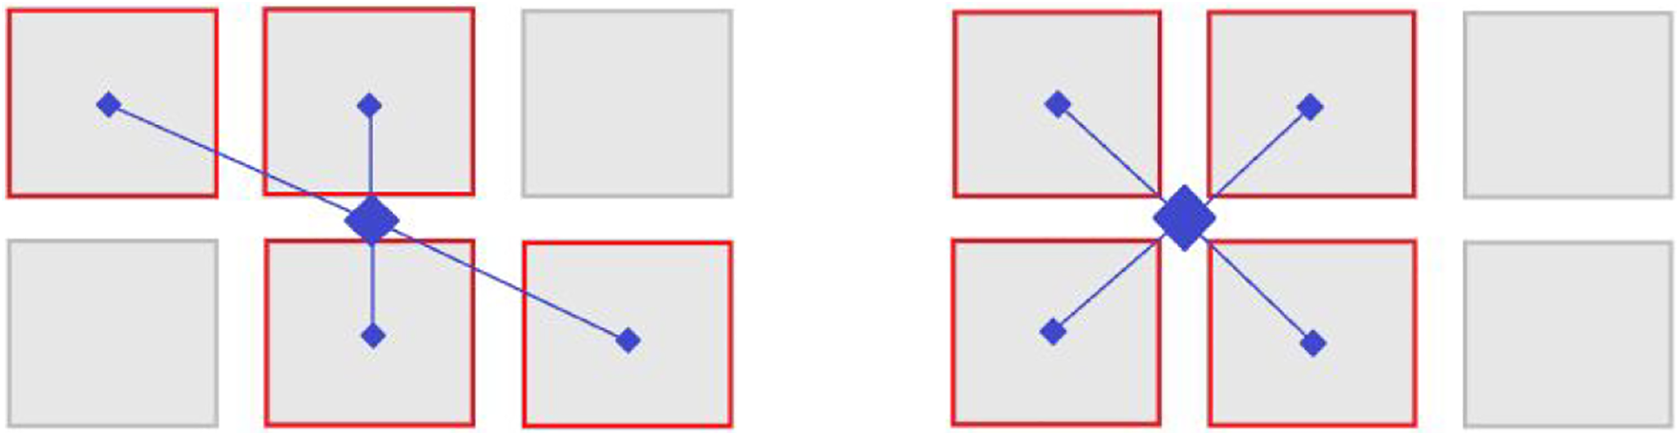
An example of Valuation 1 (Compactness) on two different 4-block segments. The value of a segment is given by the maximum distance between its center of mass and the centers of mass of each of its constituent blocks.
Valuation 2: Convexity
In favouring compact segments, the Valuation 1 formula tends to undervalue other shapes that in fact are also desirable because of their simplicity, such as the single-row segment depicted in Figure 3.

An example on which Valuation 1 (Compactness) may undervalue desirable shapes for segments (in this case, a straight line of blocks).
We thus define a second valuation that compares the area of the convex hull of segment s, denoted area(conv(s)), with its “real” area, denoted area(s) and given by the simple sum of the areas of each segment block. Since the blocks making up a segment must be contiguous, it follows that the more convex a segment, the greater is its simplicity. This valuation can be calculated using either of two different formulas:
Valuation 2a:
Valuation 2b:
Under the first formula, the valuation is always equal to or greater than 0 (because s is included in conv(s), for every segment s), the latter value being the optimum indicating that the segment is convex. Under the second formula, the same is true at the optimal value of 1. In our implementation, the real area is calculated using the Shoelace Formula and the convex hull area using Jarvis’s March algorithm. Details on these can be found in Cormen (2009) and Beyer (1987), respectively.
It can easily be seen that using either of these Valuation 2 formulas, the single-row segment example in Figure 3 would be considered optimal. If applied to the same example used with Valuation 1, we see below that the right-hand segment is again considered optimal, whereas with the left-hand segment there is a difference between the two area measurements. Thus, the convexity-based valuation would choose the very desirable single-row segment shape from Figure 3 while also agreeing with the compactness formula valuation on more complicated shapes (as in Figure 4).
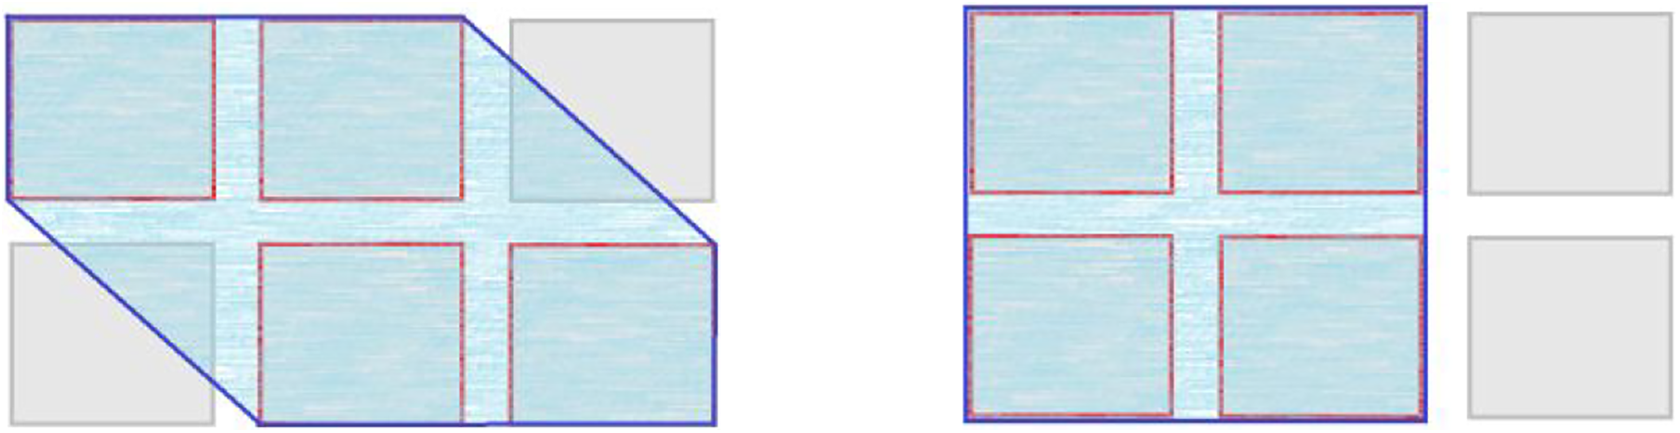
An example of Valuation 2 (Convexity) on the segments from Figure 2. The value of a segment is given by comparing the area of its convex hull (shaded area) with the sum of the areas of each of its constituent blocks.
Heuristic solution of the model
As was the case with the census, the number of variables in the present version of the model is too great to solve it directly; indeed, just generating all of the feasible segments is impractical for real instances. Thus, as in that case we use an algorithm to generate ever greater subsets of the set S of possible segments and then run the model iteratively on these restricted subsets of variables. The algorithm stops once an optimal solution of the restricted model is found. Note, however, that this is not necessarily the optimal solution of the general model executed on all possible segments. In other words, the algorithm approach to solving the problem is heuristic.
The pseudocode for the procedure to generate the segments in each iteration is set out below as Algorithm 1. Starting from a base subset B 1 of segments for a single block, each iteration attempts to extend each previously generated segment by adding one of the blocks adjacent to it. This is continued exhaustively so that if segment s has k blocks adjacent to it, then k new segments built upon s are obtained, one for each of the adjacent blocks. Once these iterations have been applied to all previously generated segments, the model is run with all generated segments that are feasible, that is, that can be swept within the minimum and maximum pre-set sweep times, which as already noted were 5 and 6 hours, respectively.
Incremental generation of segments
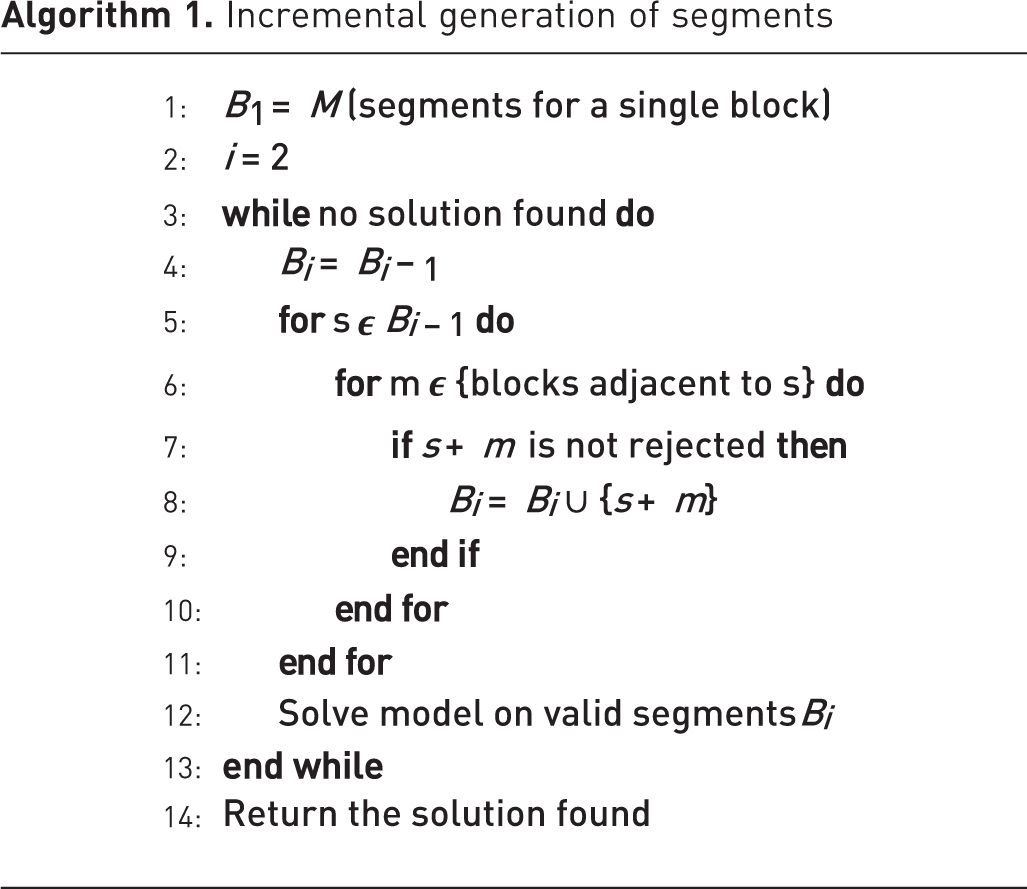
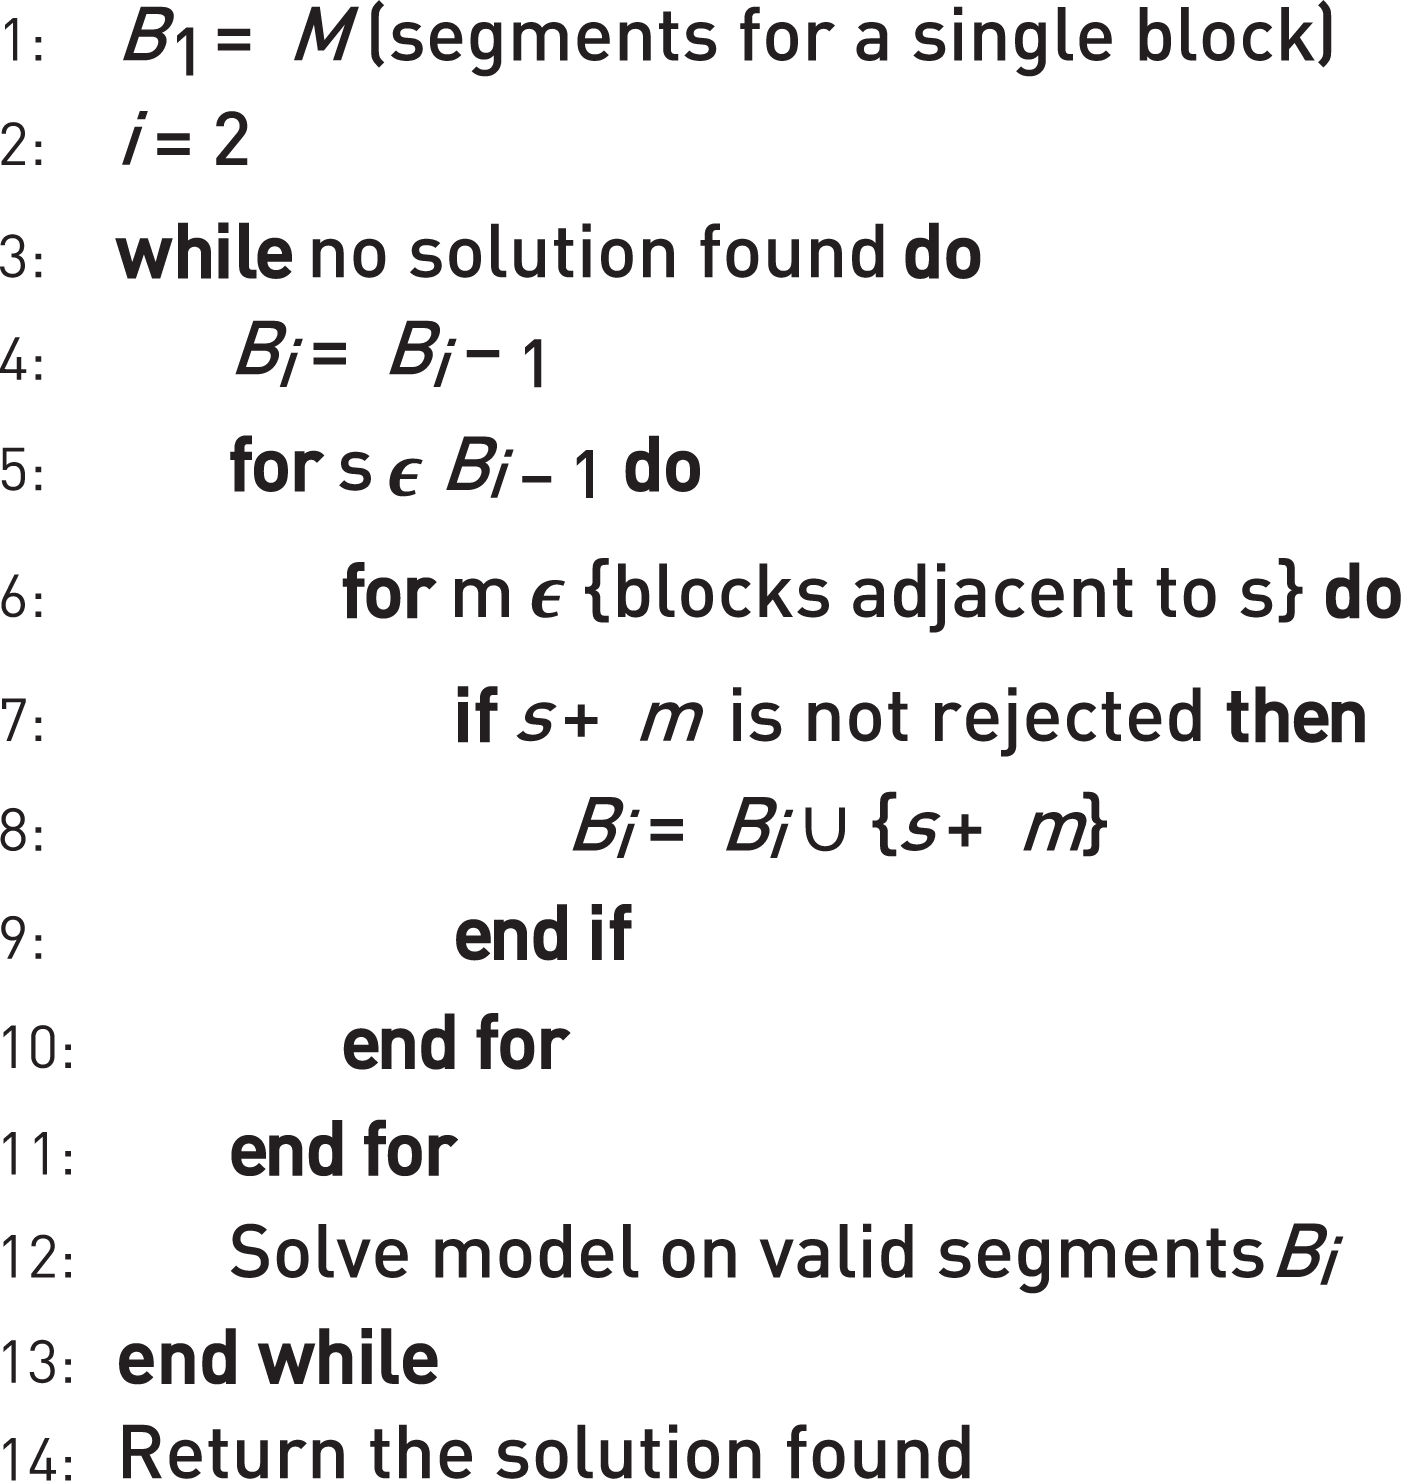
Since the number of generated segments is very large, a constraint is imposed (in Line 7) that rejects as infeasible those whose ratio of convex hull area to real area (that is, using the Valuation 2b formula) is greater than 1.5. This considerably reduces the number of feasible segments, a point that will be further discussed in the Results section.
Stage II: Sweeper route and deposit point (container location) definition
Having now determined which blocks are assigned to each sweeper, the second stage of the solution strategy defines the routes the sweepers are to follow while also determining the street corners at which they are to deposit the bags of leaves (and therefore where containers are to be placed). Recall that the bags are of limited capacity. For modelling purposes, we therefore posit that a sweeper must empty their cart after completing no more than Cmax block sides. For the spring and summer season, which was when the strategy was first implemented, we set this limit at C max = 4; in the autumn when leaf fall is at its maximum, the value will have to be reduced.
Initially, an ILP model was designed to make the decisions regarding the sweeper route and the deposit point locations simultaneously, given that they are highly interdependent. Unfortunately, the size of the resulting formulation meant that in practice it was impossible to solve. We therefore opted for a different approach that first determines each sweeper’s route, that is, the block sweep order, and then decides the corners at which leaf bags are deposited.
Sweeper route definition
By defining the sweeper routes and the leaf bag deposit points separately, each sweeper route can be defined independently of any other. This significantly reduces computation time.
For each sweeper, the route is determined by finding an Eulerian circuit on the graph of the set of blocks the sweeper is assigned to. The process begins with the transformation of that graph into an Eulerian graph by solving the Chinese postman problem using the classic ILP model for the purpose, which is given by Eiselt et al. (1995). The method consists of adding the least number of edges required to make the graph Eulerian. The Hierholzer algorithm (Hierholzer, 1873) is then used to determine in linear time the block sweep order within the sweeper’s assigned segment.
Deposit point (container location) definition
With each sweeper’s route now defined, an ILP model determines the deposit points (and therefore the container locations) in such a way as to minimize the number of containers in each zone. For this purpose, time is discretized and the following parameters are defined.
T: set of time intervals.
V: set of corners in the zone.
B: set of sweepers assigned to segments in the zone.
load(
corner(
For each corner
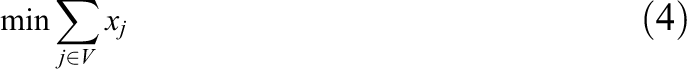


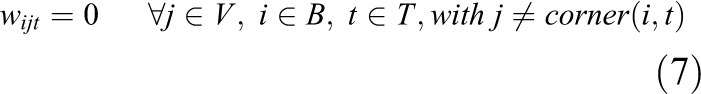
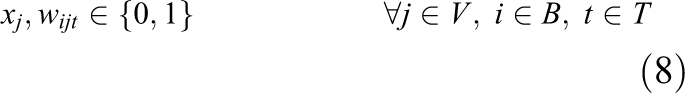
The objective function (4) minimizes the number of containers to be placed at corners. Constraints (5) ensure each sweeper has enough containers along their route so that they never exceed the maximum number of block sides (cart capacity), constraints (6) prevent a sweeper from being assigned to deposit a bag at a corner not assigned to have a container and constraints (7) eliminate variables
The model is too large to be solved for an entire zone so the set of sweepers was partitioned, thus defining within each zone a set of smaller subzones. The model was then run independently on each of these subzones and their individual solutions joined up into a global solution for the zone as a whole.
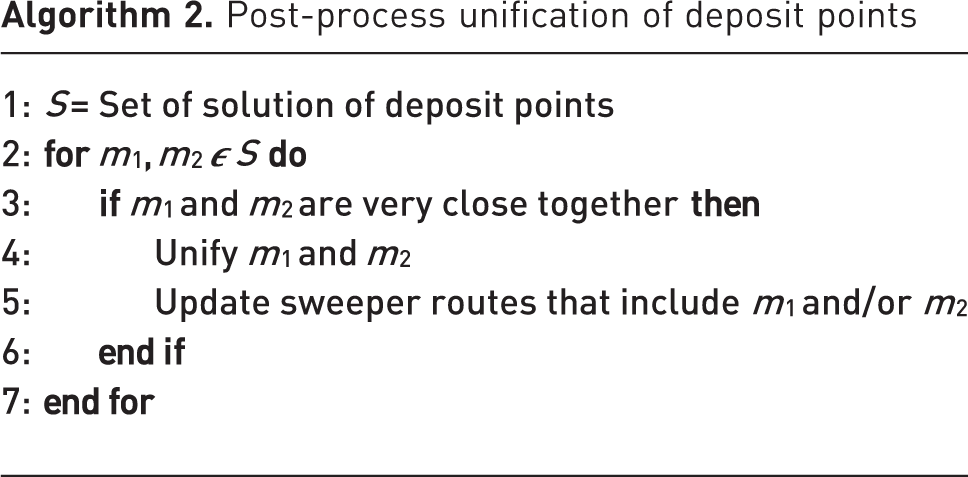
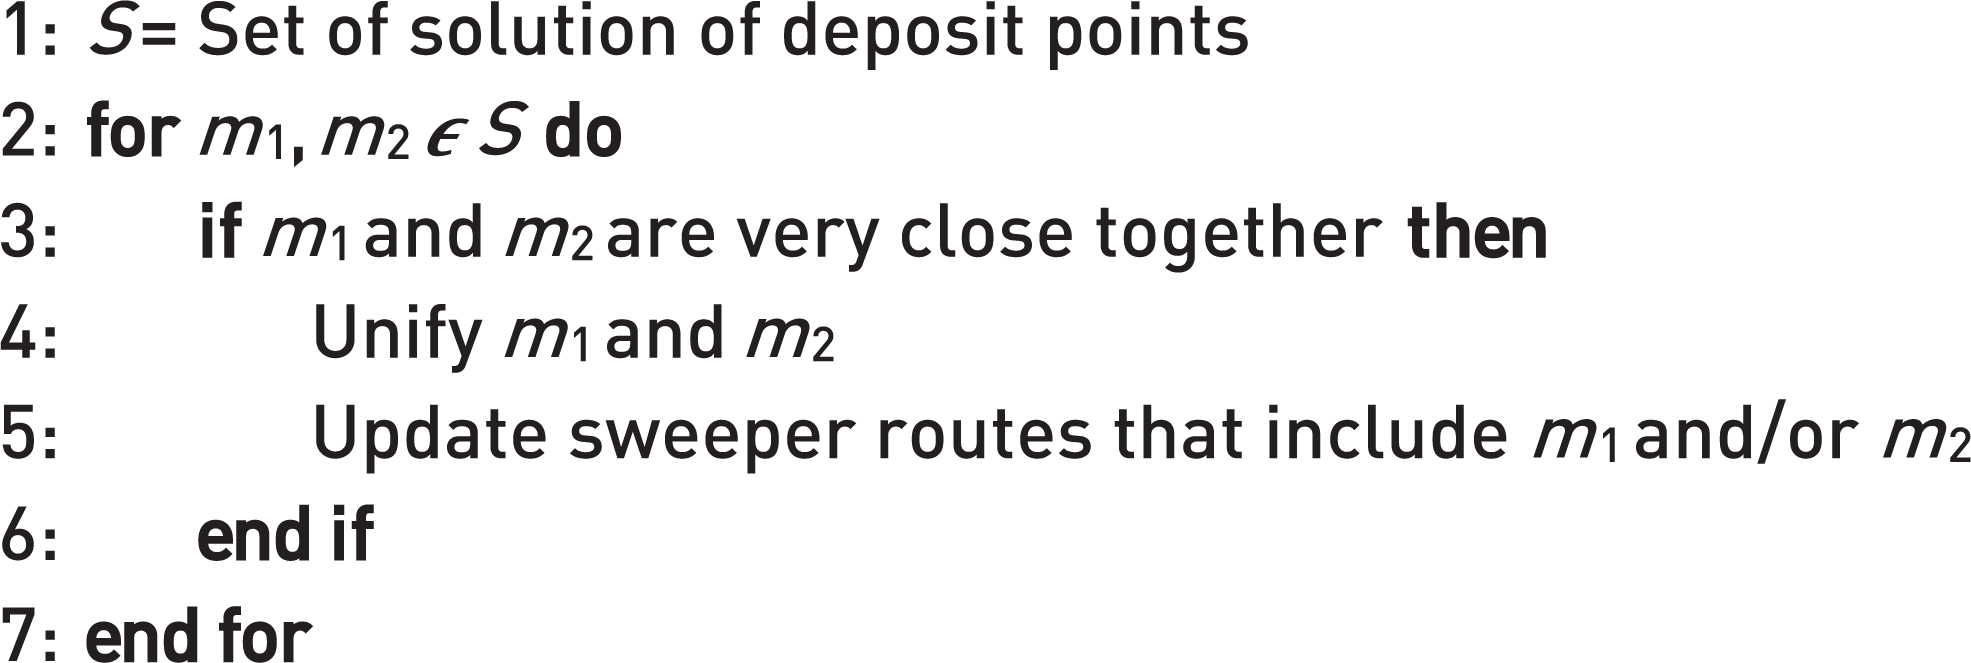
This approach could, of course, lead to suboptimal solutions. This possibility will be analysed in more detail in the fourth section, but an obvious example would be the placement (by two different model runs) of two containers at different corners of the same intersection, a result that would significantly complicate the routes of the collection trucks. To avoid this, a solution post-processing step was designed to improve the global solution heuristically. The algorithm for this step visits each pair of container locations in the solution to check the distance between them, and if it is very small, the locations are unified (i.e., replaced by just one of them) and the sweeper routes on which the two were located are updated accordingly. This updating can always be done quite directly. The pseudocode for the procedure involved is shown in Algorithm 2.
Post-process unification of deposit points
Stage III: Collection truck routes
Once the container locations have been determined, the third and final stage defines the order in which the leaf bags deposited in the containers are collected in such a way as to reduce the collection trucks’ total travel distance. After discussions with municipal officials and at the suggestion of the authors, it was decided that collection would be carried out following the sweepers’ shift with no overlap. This simplifies the modelling of Stage III enormously, for otherwise an individual constraint would have to be imposed on each container’s collection time.
Since this stage of the overall process involves motor vehicles rather than just persons on foot, an additional set of constraints is required to capture the applicable traffic regulations. There are three regulations in particular that must be incorporated: no left turns at traffic lights, no U-turns and no driving against the direction of traffic (“wrong-way driving”) on one-way streets. For the first regulation, a graph is constructed in which edges representing the prohibited turns are omitted. These are identified by a mathematical formula that calculates the angle between any two line segments, which in this case are two adjacent block sides (edges).
Recall that two collection trucks are available for each of the three zones. For simplicity’s sake the containers are divided into two equal areas, one being the north side of the city and the other half the south side.
The distance between any two containers is calculated using a shortest path algorithm (Dijkstra’s in our implementation). The algorithm takes into account the traffic regulations, meaning among other things that the distance from container i to container j is not necessarily the same as the distance from container j to container i.
Once the distances between each pair of containers are calculated, a complete directed graph is generated in which the vertices represent the containers and each edge reflects the distance between the containers it connects. The asymmetric TSP is solved for this graph using the Concorde solver, which implements an ILP model to identify the shortest collection truck route that visits all the container locations.
Results
In this section the results of the solution strategy are presented for each of the three stages in turn. For Stage I, which at the time of writing was in the process of being implemented by the city, the results for all three zones with different parameter sets are given; for Stages II and III they relate rather to a specific case simply in order to demonstrate the potential for improvement once the entire solution strategy is put into practice.
Some technical details of the implementation
The cartographic data required for the construction of the directed graph representing the city street pattern was obtained from OpenStreetMap. Its “.osm” format uses two basic types of data structures that are of interest here. One consists of nodes, which can represent such things as street intersections (i.e., corners) and important sites, such as schools, museums, etc. The other comprises ways that are sets of nodes that represent the various classes of streets in the city. Since the nodes are georeferenced, the distances between them can be measured and incorporated into the construction of the directed graph. To work with this format, the OSMParser from the Python imposm.parser library was used.
Stage I results
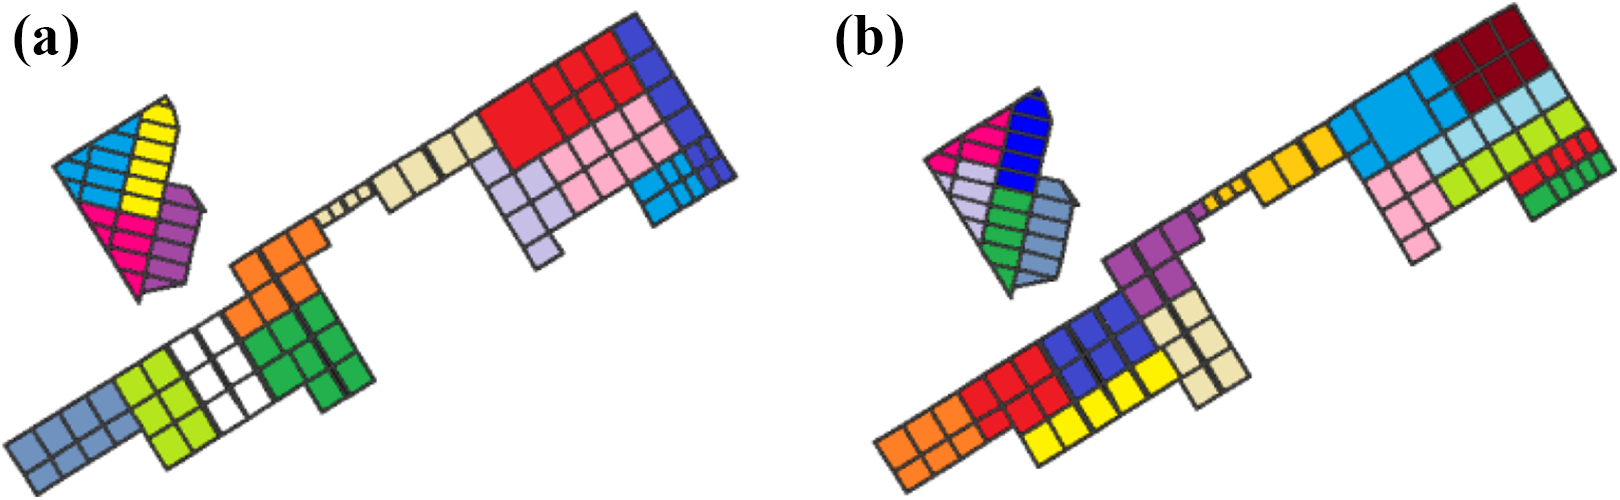
To determine which of the three valuation formulas would be most appropriate, some preliminary results were generated with each one and submitted for review to the municipality. An example of these results is shown for a daily sweep fragment of Zone 3 in Figure 5. Contiguous squares of the same colour represent the blocks constituting a single segment assigned to one sweeper. As can be seen, the segments obtained with Valuation 2a (the centre image in the figure) tended to be more rectangular than those generated by the other two valuations. This won the approval of municipal officials given that their shape makes them easier to monitor for completion of sweep assignments. It was thus Valuation 2a that was chosen for generating the definitive solutions.
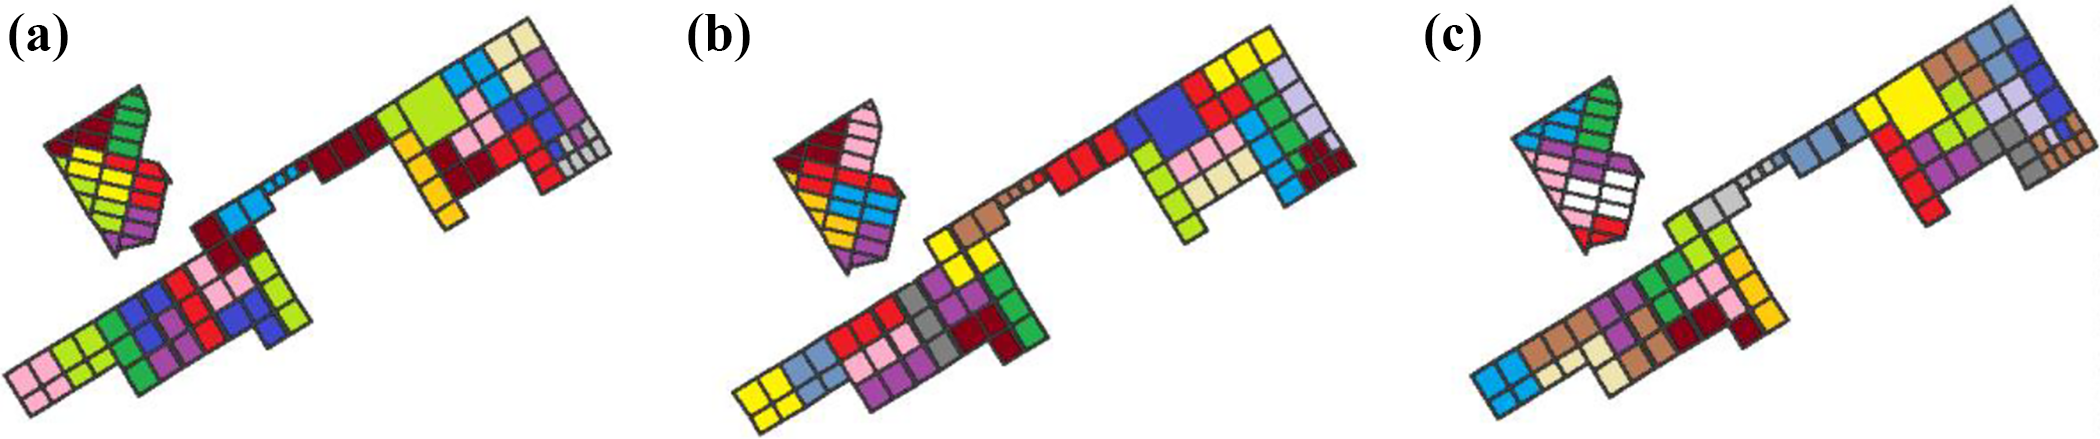
Assignments in fragment of Zone 3 using Valuation 1 (a), Valuation 2a (b) and Valuation 2b (c).
Note also that for the rejection of segments described in the Heuristic solution of the model section, the Valuation 2b formula was maintained given that as a quotient, a constant cut-off value can be used regardless of the size of the segments. Its application reduced the number of segments generated from 803,000 to 225,000 for Zone 1, from 895,000 to 200,000 for Zone 2 and from 129,000 to 73,000 for Zone 3 (all figures are averages over the various instances run under the different scenarios).
Given that actual sweep times for a block or block side may vary depending on the sweeper’s work pace and other factors, it was decided that in addition to the “standard” scenario of 12 minutes per 100 metres, a “fast” scenario (10 minutes per 100 metres) and a “slow” scenario (14 minutes per 100 metres) would also be run. These values have worked well for the seasons during which the model was first implemented (spring-summer). With the arrival of autumn, when leaf fall greatly increases, there will be a significant rise in sweep times and the model will have to be executed again in order to redo the assignments accordingly. This will no doubt require either the addition of seasonal workers or the assignment of extra hours to permanent sweeper personnel.
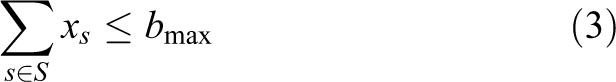
The definitive solution assignments obtained by the model for Zone 1 are shown for the fast, standard and slow scenarios from left to right in Figure 6. The corresponding numbers of sweepers in the three scenarios were 28, 31 and 35, respectively. Since the formulation of the model is such that these sweeper numbers are not necessarily the lowest for which a solution exists (i.e., there may be a solution with fewer sweepers but a worse objective function value), each one was checked by rerunning the model for segments of up to nine blocks with the upper bound on sweepers bmax set at one whole number less. The results, however, were that no solution was possible with these lower numbers for any of the three scenarios in any of the three zones.
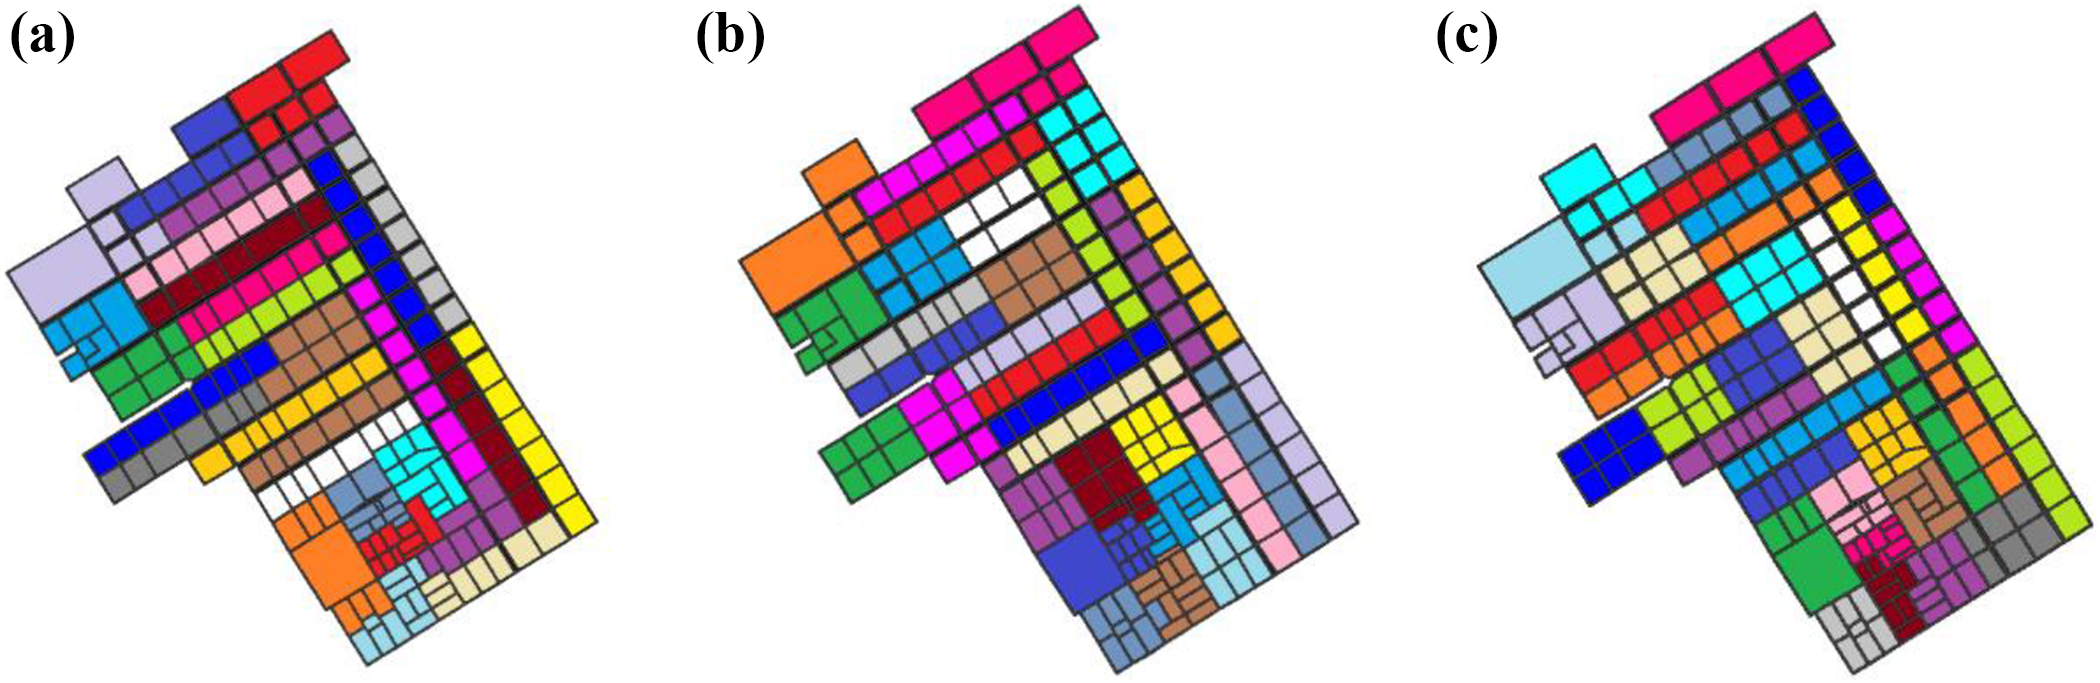
Definitive assignments in Zone 1 for the fast (a), standard (b) and slow scenarios (c).
As for Zones 2 and 3, they differ from Zone 1 in that, as we saw in the introduction, the number of sweepers under the previous manual assignments was low in relation to the number of blocks to be swept. It was therefore decided that for the other two zones only the standard and slow scenarios would be run.
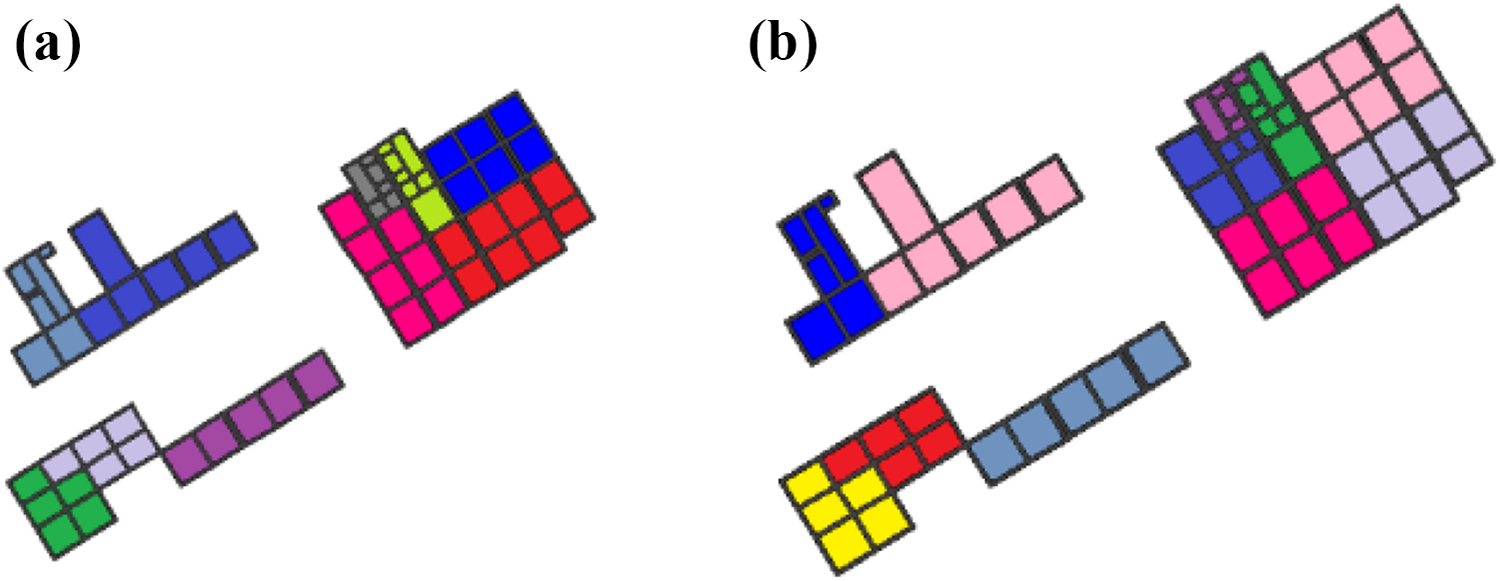
The Zone 2 model assignments are shown in Figure 7 for the standard (a) and slow (b) scenarios using 36 and 40 sweepers, respectively. For Zone 3, where there are both daily and alternate-day sweep blocks, the assignments are shown in the former case for the standard and slow scenarios (15 and 19 sweepers, respectively) in Figure 8 and in the latter case for the same two scenarios (five and six sweepers, respectively) in Figure 9. Note that in the latter figure the number of segments is exactly double the number of sweepers given that, as explained in the first section, the sweep cycle is completed over a two-week period during which the sweepers work on different segments, depending on the day of the week. Each segment in this case was therefore divided into western and eastern halves. The number of sweepers deployed in this zone is thus 20 for the standard scenario and 25 for the slow one.
Definitive assignments in Zone 2 for the standard (a) and slow scenarios (b).
Definitive assignments in the daily sweep areas of Zone 3 for the standard (a) and slow scenarios (b).
Definitive assignments in the alternate-day sweep areas of (b).
An important aspect of the segments generated by the model is that, generally speaking, their shapes are quite simple and elegant and thus easy for the sweepers to follow, a quality that has met with the endorsement of the municipal authorities.
Some data on the number of sweepers before and after the implementation of the model-generated sweeper assignments are assembled in Table 1.
Comparison of manual and model assignments.
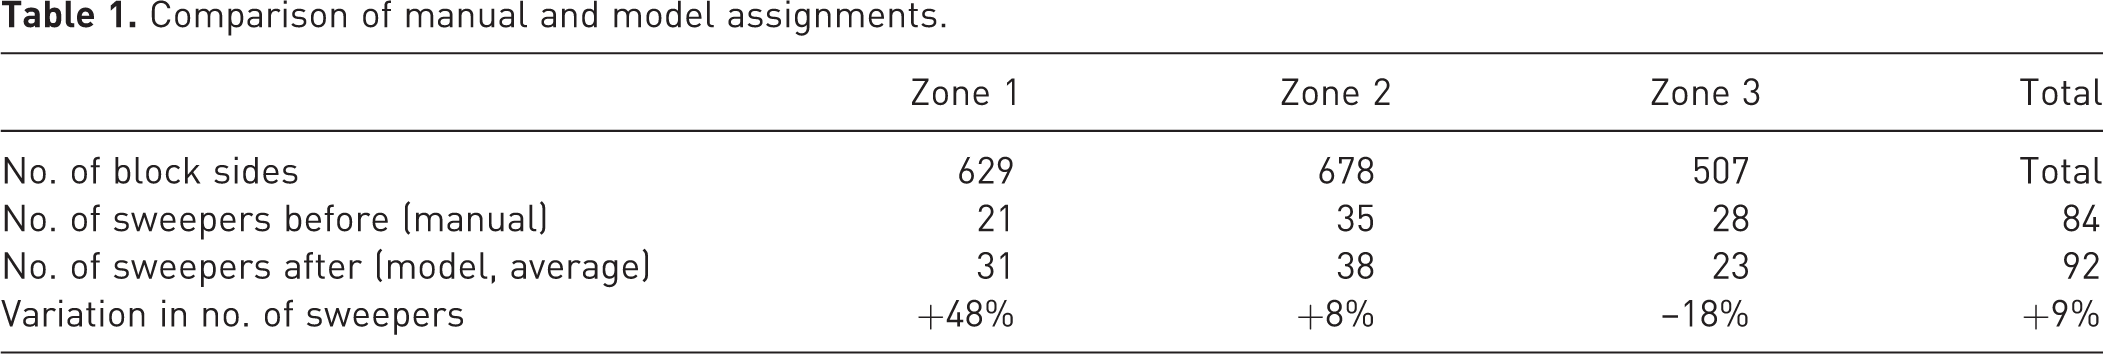
As can be seen, sweeper numbers in relation to the number of block sides were not deployed to the three zones in equal proportion. The change in assigned sweepers under the model implies that the manual Zone 3 assignments were too high while those for Zone 2 were slightly too low and those for Zone 1 significantly too low. Although the disproportions are evident from the figures in the table, the model results reveal how far the appropriate numbers of sweepers are from those with manual assignment. As the table shows, some eight additional sweepers were required, a 9% increase in the total. Block sides left unswept under the manual system have to be covered later through overtime, which is both inefficient and costly. By contrast, the model solutions generated accurate estimates of the number of sweepers required in each zone to ensure all block sides are swept, thereby also indicating how many additional workers were needed.
Stage II results
Since Stage I was still in the process of implementation at the time of writing, the scenario best suited to each zone has not yet been decided so the results for Stages II and III presented here are merely illustrative. They are based on the standard scenario (31 sweepers) for Zone 1 shown in Figure 6(b).
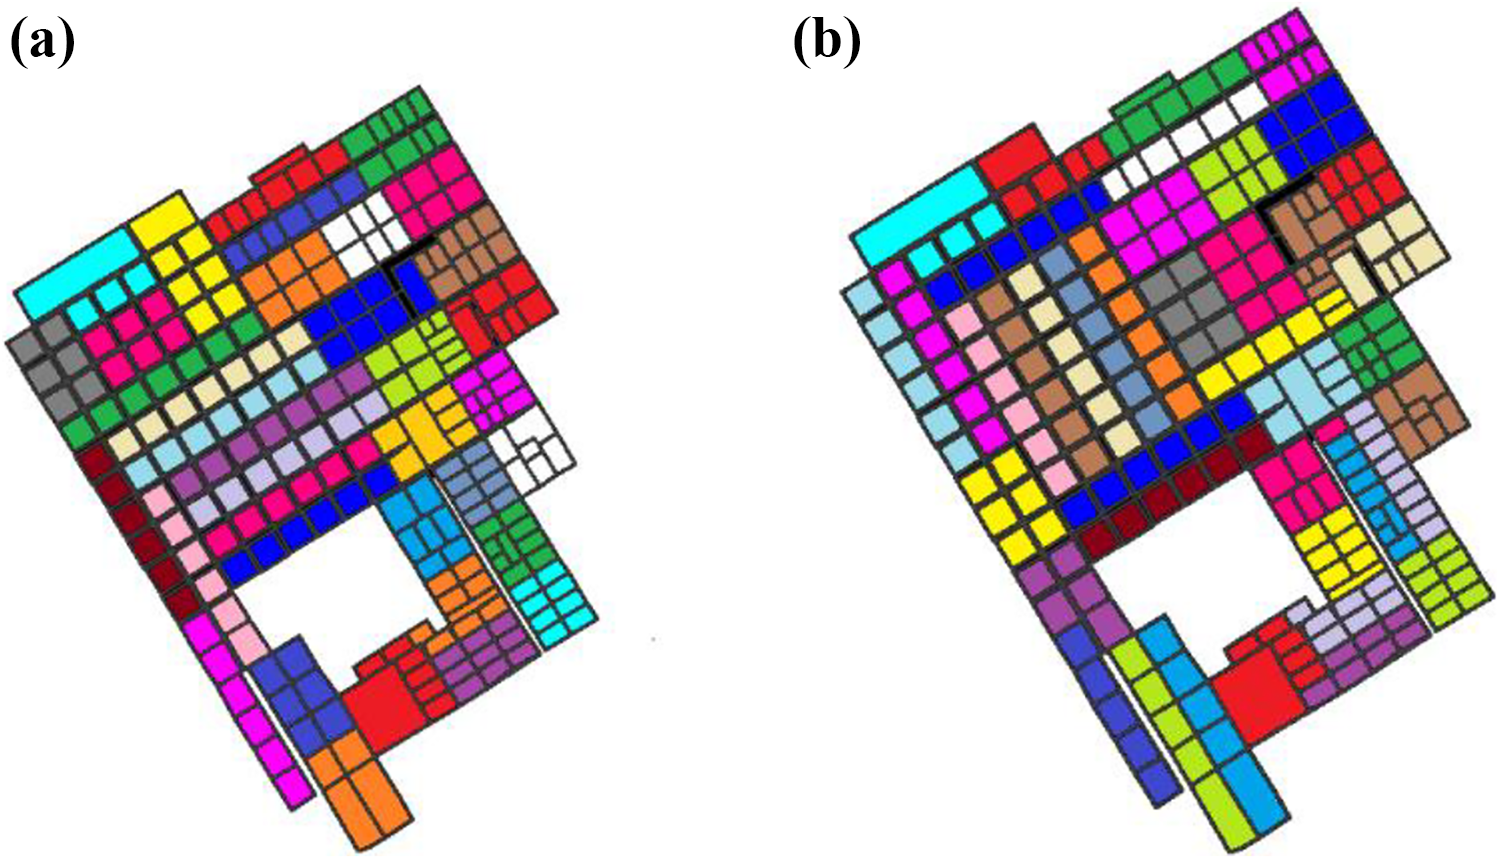
The model generated a solution for this instance that required 117 container locations (i.e., leaf deposit points) before the post-process unification of locations. The definitive solution after post-processing brought that number down to 111, a reduction of 4.2%. These two solutions are displayed in Figure 10.
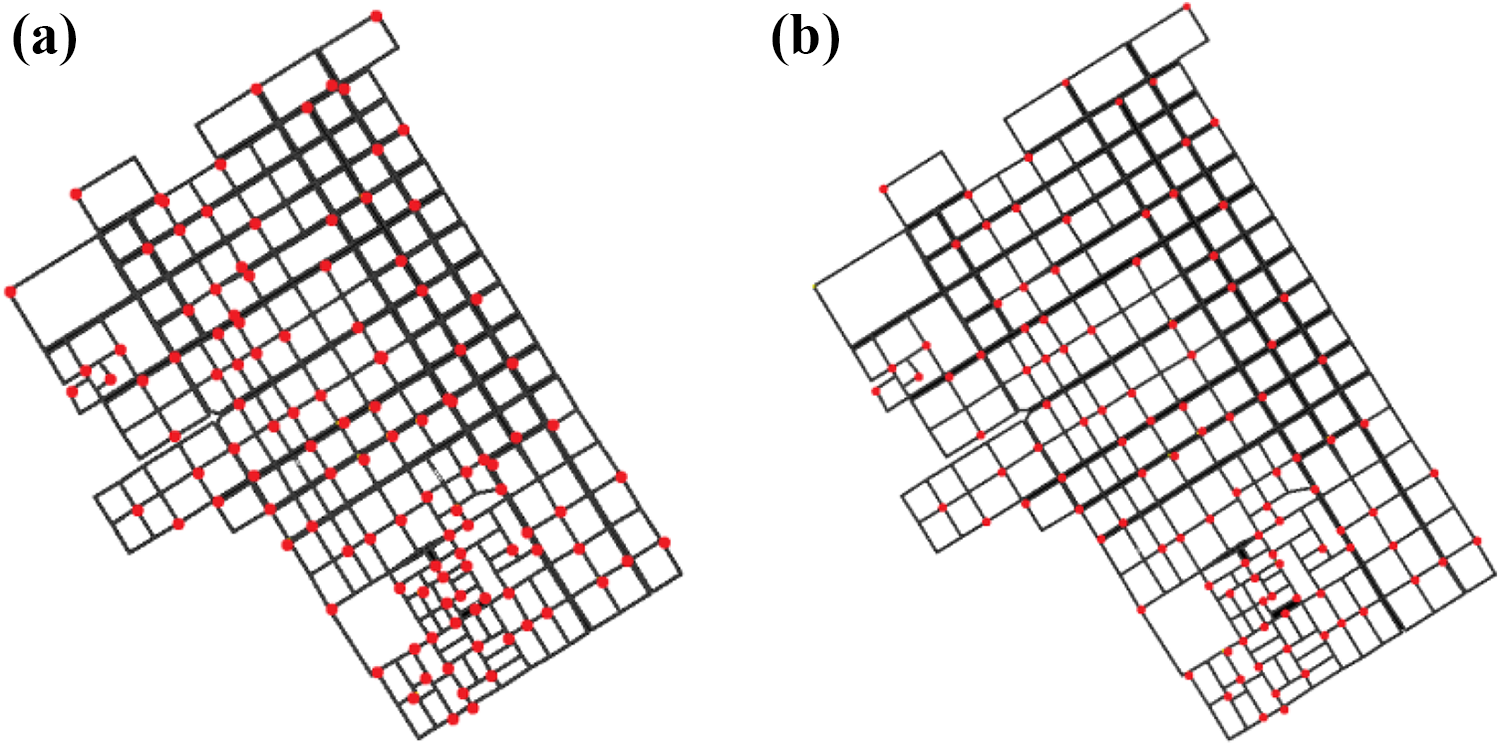
Container locations (deposit points) generated by model for Zone 1 before (a) and after (b) post-processing.
Under the manual system, leaf bags could be deposited at any intersection, an arrangement that clearly is very inefficient. In Zone 1 the number of intersections previously used as deposit points was about 240, more than double the number in the model solution or a reduction of 53.75%.
The overall efficiency of the model solutions can be seen in the example shown in Figure 11 of a segment consisting of seven blocks, which only requires four containers (the sweeper deposits bags in each container more than once over the course of a working day). The starting point is indicated by a star and the block sides are numbered in the order they are swept. The four container locations are indicated by circles. The situation with the other Zone 1 segments is quite similar in that there are only three or four container locations and the sweepers make multiple deposits in them.
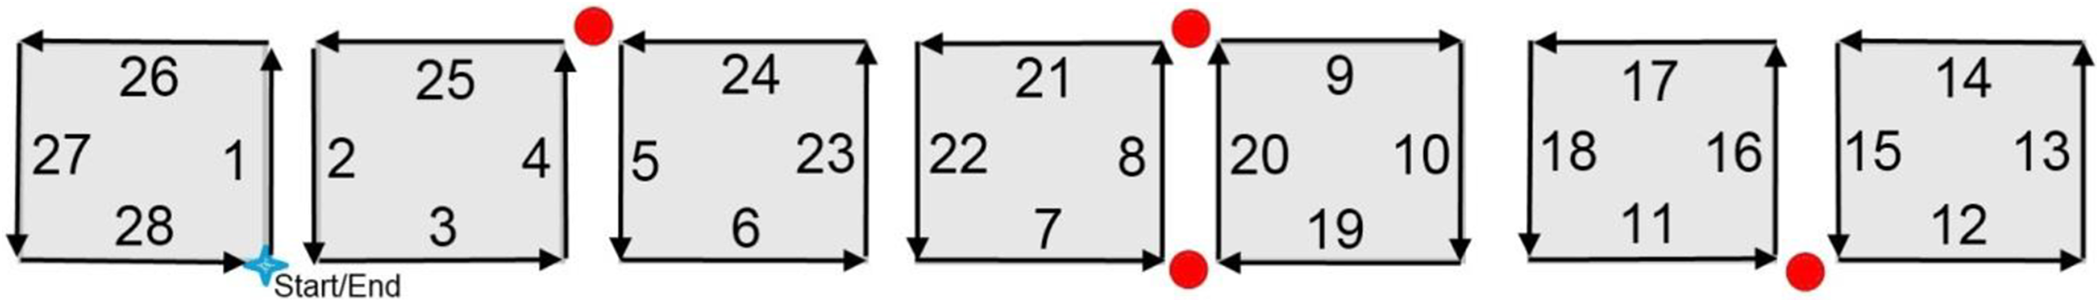
Example of an efficient container location solution generated by the model.
Stage III results
The instances of the collection truck route problem are small and thus were solved by the model in a matter of seconds. The solutions the model generated for Zone 1 under the standard scenario and with the containers already placed (Stage II) are shown in Figure 12. The route in Figure 12(a) is for the northern section of the zone, while the route in Figure 12(b) is for the southern section. Each section is covered by one of the two trucks assigned to the zone. Both trucks begin their routes at a deposit point located in the upper right area of the map closest to the truck garage located northeast of the city. Note that the truck serving the southern section must cover a considerable distance before reaching the deposit point where it makes its first container pickup.
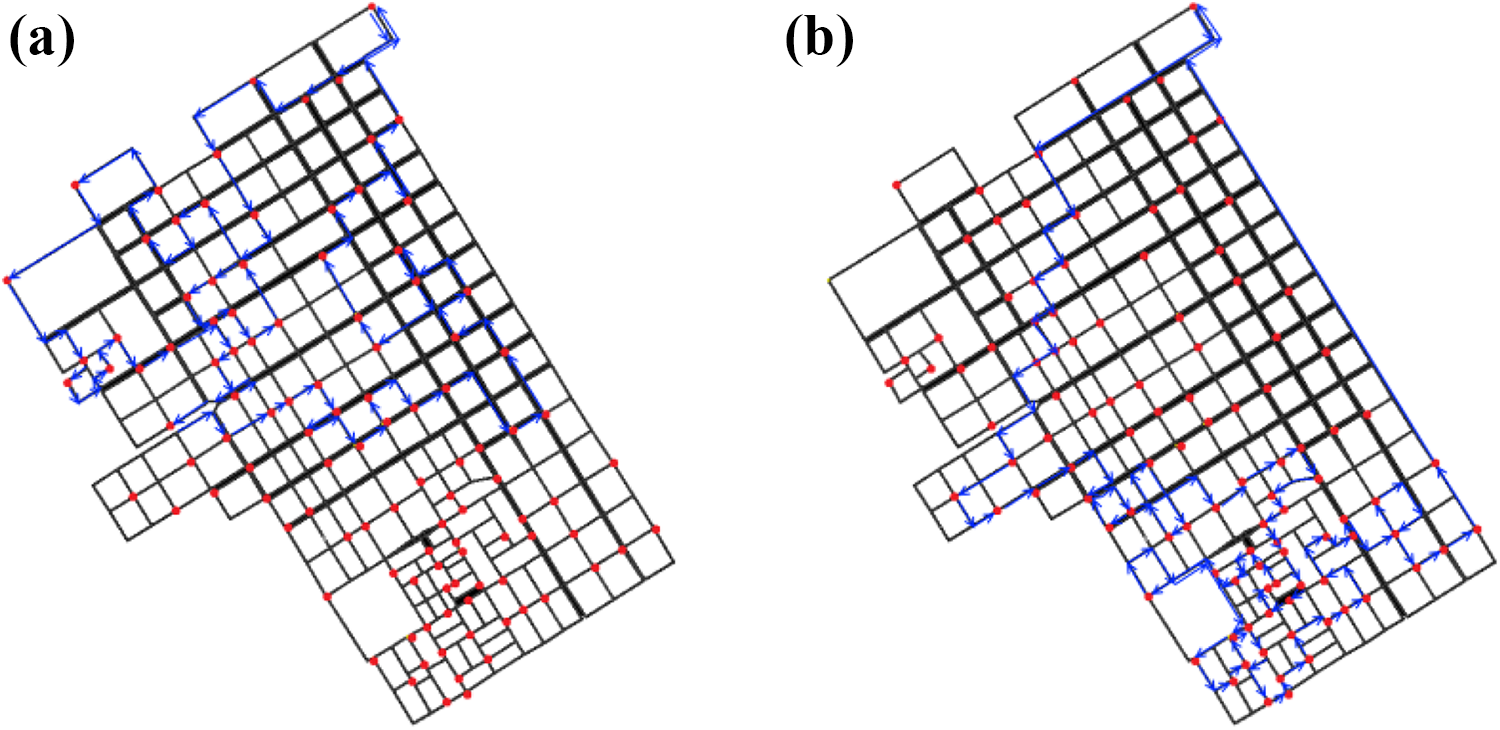
Truck collection routes generated by the model for the northern (a) and southern (b) sections of Zone 1.
Under the manual system, since leaf bags were deposited at any corner, the collection trucks had to zigzag their way along every block side in the city. By contrast, the route determined by the model, although perhaps more irregular in shape, is much shorter. In numerical terms, the reduction for the two trucks used to cover this zone is from 32.2 to 28.4 km (13.7 and 14.7 km for the northern and southern sections, respectively), a saving of 12% in total driving distance with the consequent reduction in fuel consumption.
Conclusions and future work
A solution strategy was presented for the problem of improving leaf and other waste sweeping operations in the Argentine city of Trenque Lauquen. Based on ILP models, the objective was to achieve a high level of efficiency in (a) the assignment of sweepers to segments consisting of multiple city blocks, (b) the identification of leaf bag deposit points and (c) the routes to be followed by collection trucks for leaf bag pickup.
Application of the strategy by the municipal authorities has resulted in efficient definitions of sweeper requirements while optimizing sweeper segment assignments, putting an end to the problem of unswept blocks that plagued the previous system. The model results indicate that full implementation of the strategy should reduce the number of bag deposit points by roughly one-half and total collection truck distance by 10–15%, with the consequent savings in time, vehicle use and fuel consumption.
Furthermore, the model is very versatile in that it can execute a wide range of scenarios with different values for sweep times, block sweep frequencies, seasonal waste volumes and other factors, thus greatly facilitating the municipal authorities’ leaf collection decision-making process.
Finally, although the implementation of the model presented here was tailored for a particular problem in a city in Argentina, the techniques developed could be readily extended to other problems and services anywhere in the world that involve the routing of personnel through the streets of an urban area.
As regards future work and extensions of the strategy, a theoretical possibility, although one perhaps difficult to implement in practice, would be to incorporate an absolute time-based estimate of each block’s difficulty level, calculated separately for each sweeper as the time they take to sweep the block divided by their individual work pace in distance per time unit. With this datum, much more precise solutions could be generated.
Another possible development would be to subject each segment to a time penalty based on the distance between the segment and the starting point of the sweeper assigned to it (see Figure 1). Note, however, that in the present case some sweepers store their leaf collection carts at home, meaning that the starting point varies greatly from one sweeper to the next. To implement this idea, therefore, each sweeper would have to be individually identified by the model, as with the suggestion described in the previous paragraph.
In conclusion, we note that Trenque Lauquen municipal officials are very satisfied with the results of the solution strategy as implemented so far and have expressed an interest in applying Operations Research solutions to other aspects of its daily activities. According to Mayor Miguel Fernández, “we feel this type of analysis allows us to make better-informed decisions and should be considered for application to other areas where there is potential for optimizing the use of available resources”.
Footnotes
Authors’ note
Diego Delle Donne is now affiliated to LIX CNRS, Ecole Polytechnique, Institut Polytechnique de Paris, Palaiseau, France.
Acknowledgements
The work reported in this paper was carried out under a cooperation agreement between the Municipality of Trenque Lauquen and the Instituto de Cálculo of the Faculty of Exact and Natural Sciences at the University of Buenos Aires. The authors wish to thank officials at the municipality for their constant collaboration in bringing this project to fruition. Special thanks are due to Mayor Miguel Fernández; Marcelo Ferreyra, Secretary for Modernization, Science and Technology; and Adhemar Enrietti, Secretary for Public Works and Services. We also want to thank Victor Bucarey López and Kenneth Rivkin for their suggestions that improved the final version of this article.
Declaration of conflicting interests
The authors declared no potential conflicts of interest with respect to the research, authorship and/or publication of this article.
Funding
The authors disclosed receipt of the following financial support for the research, authorship and/or publication of this article: The third author was partially funded by the Complex Engineering Systems Institute (Chile) (grant no. CONICYT PIA/BASAL AFB180003) and by grant nos. UBACyT 20020170100495BA (Argentina), PIDAE-UBA 2018 (Argentina) and ANPCyT PICT 2015-2218 (Argentina).