
Abstract
The contamination of freshwater ecosystems with microfibres has not yet been studied in Poland. We analysed samples from a river and three lakes located in central and northeastern Poland. A significantly higher number of fibres were reported in the river, which runs through large cities, compared with the lake situated within the Landscape Park. Fibres smaller than 1.0 mm dominated, especially in the river where they constituted 39% of all fibres detected. We found more microplastics (⩽ 4930 fibres·m−3) by using a mesh size of 20 µm compared with other studies of inland waters. The use of Raman spectroscopy allowed us to identify conventional plastic polymers: polyethylene terephthalate, polyester and polyurethane. We estimated that up to 25 g of microplastic in the form of fibres might be in the lake water under the surface. We found microplastic fibres in Majcz Lake situated within the Masurian Landscape Park. This suggests that microfibres are carried by the wind and rain and enter freshwater isolated from sewage outlets. By using the control sample and an air-test of microfibres in the laboratory, we observed that there is a high probability of contamination with microplastic in the field samples (up to 30% of all fibres detected). The contamination risk noted from the samples cannot be ignored; this could be particularly important for analysis of microplastic in remote freshwater ecosystems.
Keywords
Introduction
The problem of environmental pollution by plastic has been known for decades (Collignon et al., 2012). Plastic is a mechanically and chemically resistant synthetic material that can be recycled many times (Fleituch, 2016). It is also an extremely cheap material, which makes it available to everyone, and thus industry is willing to use it. It was discovered at the end of the 19th century but its potential was noticed only at the end of the 1940s. Since then, synthetic polymers have been produced in large quantities and used in everyday life because of their properties: lightness, strength and water resistance (Andrady, 2011; Scherer et al., 2017). Through inefficient storage, lack of recycling and human carelessness, plastic is released into the environment in huge quantities. It is estimated that currently more than 280 million tonnes of synthetic polymers are produced annually worldwide (Sighicelli et al., 2018). Most of it is discarded as waste. Plastics themselves are very slow to biodegrade, which can take hundreds of years (Stachurek, 2012). The demand for plastic has become so high that it has outpaced its manageability, resulting in constant accumulation of microfibres and particles, originating from the decomposition of plastics, in the natural world, mainly in water bodies. In satellite images we can see huge dumping grounds mostly created from synthetic waste (Parker, 2018). Plastic has become a significant problem on a global scale, threatening both nature and people.
Since accumulation occurs in marine ecosystems, much attention is paid to the impact of larger fragments on aquatic organisms and birds that confuse it with food (Browne et al., 2011; Eerkes-Medrano et al., 2015; Gall and Thompson, 2015). Still, little is known about microplastic, how widespread it is, and what effects it has on our ecosystems (Andrady, 2011; Derraik, 2002). Usually, microplastics are defined as plastic particles (acrylic, polyethylene, polypropylene, polyamide, polystyrene or polyester) smaller than 5 mm in size (Andrady, 2011; Arthur et al., 2009; Barnes et al., 2009; Thompson, 2015). Additionally, the division of primary and secondary microplastics is applicable. The dimensions of primary microplastic are determined during its production. Secondary microplastic is created as a result of the reduction of its size by physical, physicochemical and light processes.
The first scientific reports on plastic particles appeared in the 1970s (Carpenter and Smith, 1972; Carpenter et al., 1972). Then, Ryan and Moloney (1990) used the term microplastic in the context of their research on the southern beaches of Africa. In 2004, the term microplastic was used by Thompson et al. (2004), who described the presence of plastic fragments in seawater.
Currently, the large number of publications on microplastic debris (MPs) concerns its occurrence in the seas and oceans. The sources of marine microplastic pollution are most often mentioned with regard to sea transport, fishing activities, the energy industry, the tourism sector, agriculture and local sewage treatment plants (Clark et al., 2016; Cózar et al., 2014; Eriksen et al., 2014; van Sebille et al., 2012). Microplastics also reach seas and oceans through rivers which are exposed as a result of the activities of other branches of industry such as the automotive, aviation, road transport, cosmetics, sanitary, chemistry and textile industries. Moreover, microplastics can be emitted by ‘secret sources’ such as small production companies and illegal landfills. The same is true for land-based pollution. An additional source of microplastic pollution may be precipitation from the air or the transfer of airborne particles by the wind. At the moment, it is estimated that about 80% of the world’s water is polluted by microplastic (Eerkes-Medrano et al., 2015). It can be directly absorbed by animals that cannot distinguish it from their food, such as crabs, suspension feeders, cladocerans and mussels. Microplastics can also stick to the external organs of gills and they can stick to algae consumed by animals. The presence of microplastics in the body may cause an increased immune response, reduced consumption of food, weight loss, diminished growth and development, and reduced fertility. All of these have a negative impact on subsequent generations (Cole et al., 2015; Lusher et al., 2016; Wright et al., 2013).
As most studies on microplastic pollution have focused on oceanic and marine waters, there is still little information available on its effects on freshwater. However, it is certain that microplastics are present in inland waters. Examples include the St Lawrence River, flowing through the US and Canada (Castaneda et al., 2014); the Beijiang River in southern China (Wang et al., 2017a); the Danube River (Lechner et al., 2014); Hovsgol Mountain Lake, which is a national park in Mongolia (Free et al., 2014); the Great Lakes of North America (Zbyszewski et al., 2014); and Geneva Lake (Faure et al., 2012). In each of these places microplastic was present.
In this study, we investigated inland waters for the presence of microplastic fibres. We chose four sites that differed in anthropogenic pressure in central and northeastern Poland. The points of anthropogenic scale distinguishing the sites were: (a) the close presence of an urban agglomeration; (b) the close presence of buildings in rural areas; (c) a connection to the river; (d) tourism; and (e) a landscape park, reserve or other form of protection.
Materials and methods
The study sites
Water samples from four sites in central and northeastern Poland were analysed for the presence of microplastic fibres; these included the Vistula River and three lakes: Dziekanowskie, Kalwa and Majcz Wielki (Figure 1). The sites differed in anthropogenic impact: (a) The Vistula River, located in a section of Warsaw, has a large urban agglomeration and a high level of tourism; (b) Dziekanowskie Lake is close to buildings outside a large urban agglomeration and has a periodic connection (through the channel when the level of water is high) to the Vistula River as well as a medium level of tourism; (c) Kalwa Lake is close to buildings in rural areas and has a high level of tourism; and (d) Majcz Wielki Lake is within the landscape park and has a medium level of tourism.
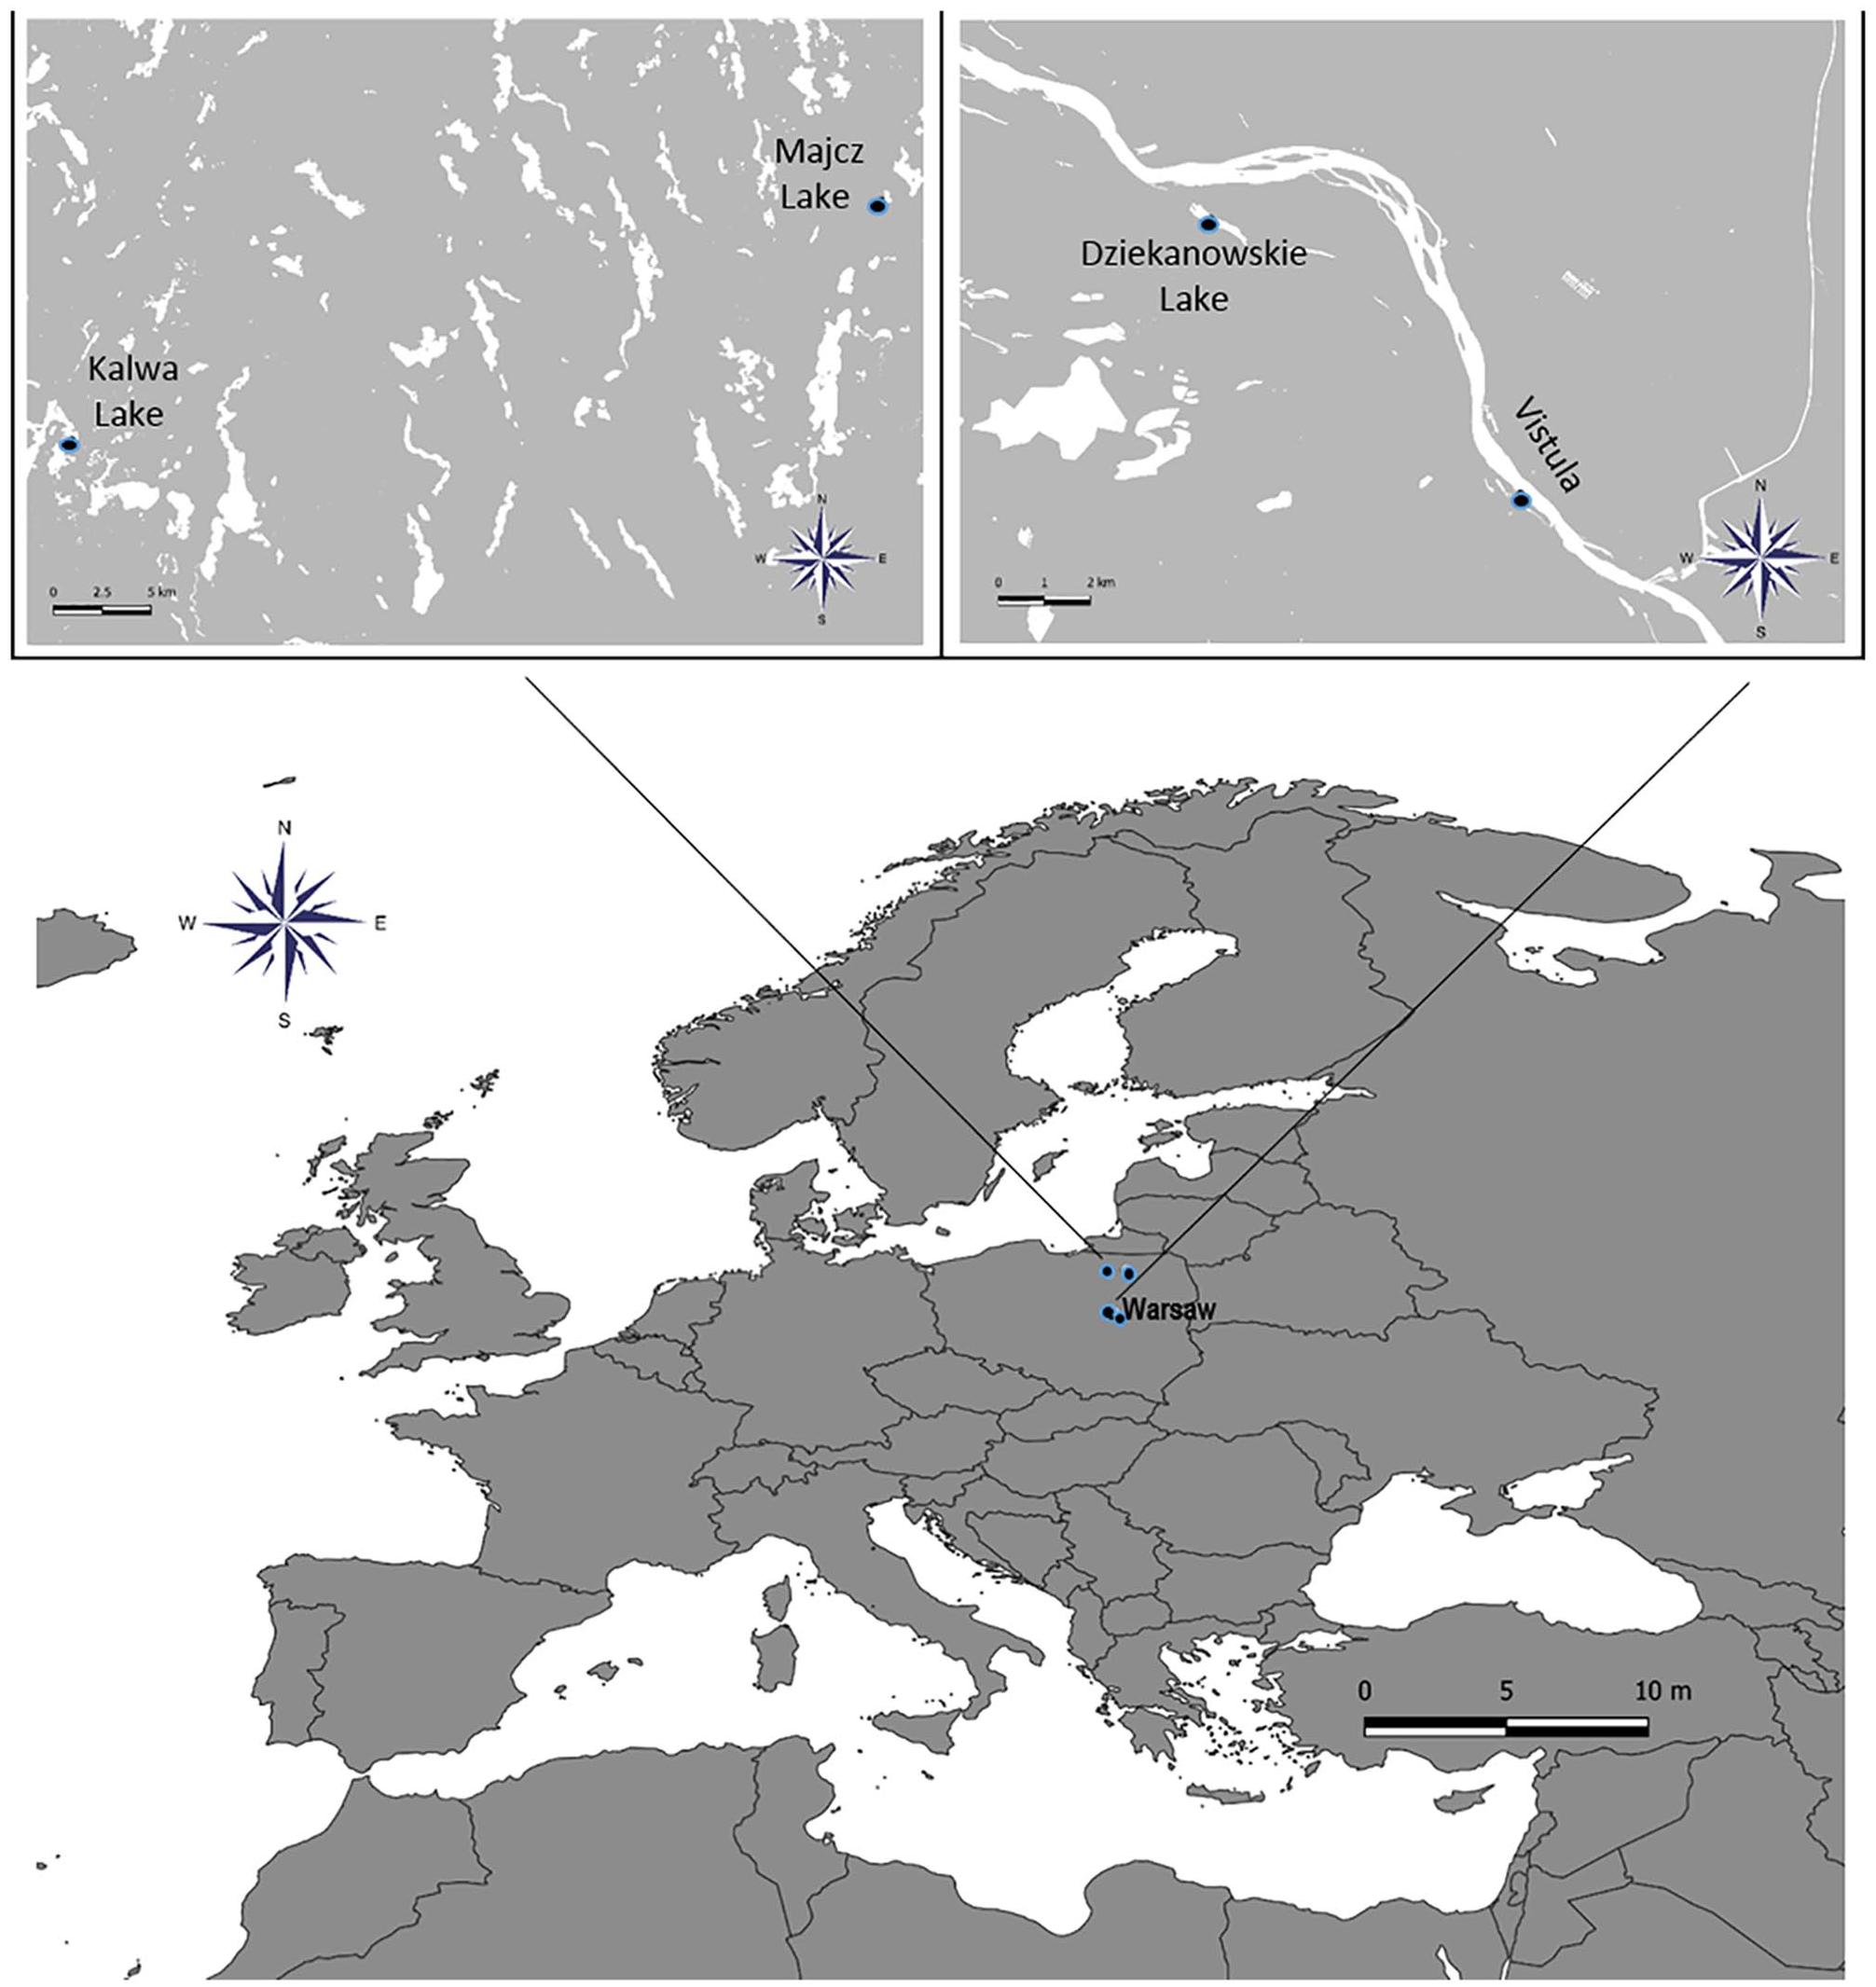
Map of the sampling region in central and northeastern Poland.
The Vistula is the longest river in Poland (1047 km long); it runs through large cities such as Krakow, Sandomierz, Warsaw, Płock, Toruń and Gdańsk. The Warsaw section of the Vistula River (52°31′N 20°94′E) is characterized by water quality class III (moderately polluted). The left bank of the Vistula is strongly urbanized. The right bank of the Warsaw section of the Vistula River is not built up; it has maintained its natural characteristics, partly under the protection zone number PLB140004 of the Central Vistula Valley. A large proportion of Warsaw citizens receive water from the Vistula.
Lake Dziekanowskie (52°37′N 20°84′E) is located near Warsaw in the Vistula river basin. It is part of the Struga Dziekanowska (Romanowski et al., 2013), characterized by water quality class III, and visited by local residents for recreational purposes. From the north it borders the Vistula embankment and from the south, on the slope, it is built up with detached houses. The vegetation belt separating the lake from the buildings is only about 3 m wide. The lake has an area of 27.6 ha and a maximum depth of 10 m.
Lake Kalwa (53°67′N 20°80′E) is located in the area of the Great Masurian Lakes near the town of Pasym. The area of the lake is 562 ha and its maximum depth is 31.7 m. This lake is characterized by an unusual shape, with a long and developed coastline and numerous peninsulas and islands. It is attractive to tourists, used for recreational purposes, and has been designated with water quality class III status.
Lake Majcz Wielki (53°77′N 21°43′E) has an area of approximately 162 ha and a maximum depth of 16.4 m. It is located in the Great Masurian Lakes area near Mikołajki. Considered to be one of the cleanest in Poland, the mesotrophic lake with water quality class II lies within the Masurian Landscape Park and is visited by tourists (Choiński, 2006). The lake has a diversified coastline and is overgrown with vegetation.
Methods of visualization of microplastic present in the sample
Three samples were taken from the Vistula River and three were taken from each of the lakes, for a total of nine samples from the group of lakes. We used a plankton dense net, flushed three times before sampling, with a diameter of 23 cm grid inlet. So far, literature data indicate that nets with 300–333 µm mesh size have been commonly used (Sighicelli et al., 2018). We used a mesh size of 20 µm to detect also very small microplastic fibres. The net was trawled just below the water surface on a transect of 2 m and at a distance of about 5 m from the shore. For each sample, there was 14.4 dm3 of water passed through the plankton net to a volume of about 50 mL. The samples were placed in 100 mL containers with a screw cap. After transport to the laboratory, the samples were transferred to glass flasks. To each flask, 69% nitric acid was added at a ratio of 3:1 and 5 mL of 30% hydrogen peroxide. The flasks were covered with glass plates and left for 72 h for organic matter degradation. Then the samples were filtered using the vacuum pump kit Labor s. c. PL2/1 SN 1309 with glass microfibre filters whose sizes were 47 mm in diameter and whose pore sizes were 1.2 µm (Whatman, GF/C™). The filters were placed individually in glass Petri dishes with a lid and left to dry for 24 hours. Each filter was visually analysed under the stereoscopic microscope Huvitz HSZ-ZB700 and microplastic fibres were photographed using a Keyence VHX-7000 digital microscope at 500–1000× magnification. The fibres were counted manually and measured individually from the images by using software of Keyence VHX-7000 digital microscope.
The control sample was prepared by pouring 14.4 dm3 of deionized water through the plankton net and treated with the same procedure used for the samples from the study sites. We also checked to see if there were any microfibres in the laboratory air by using clean glass microfibre filters placed in the opened Petri dishes for 2 hours. Settling microfibres were photographed.
Estimation of plastic mass derived from fibres
We estimated the mass of plastics per m3 of water. We precisely measured the length and diameter of photographed rod-shaped fibres and the length, width, and thickness of ribbon-shaped fibres. Based on the measurements, the volume of microfibres (n = 35) and the total length of all microfibres were calculated for each sample. Then, the density of selected polymer types found in the samples (polyethylene terephthalate (PET) = 1.38–1.41, polyurethane (PU) = 1.1–1.28, polyethylene (PE) = 0.89–0.98, polyamide (PA) = 1.14, polypropylene (PP) = 0.85–0.9, polystyrene (PS) = 1.04–1.08) in g·cm−3 was selected from the existing data. In this way, the average density of plastic (1.1 g·cm−3) was estimated. Fibres were divided into groups according to whether they were rectangular or cylindrical, then their volumes were calculated and multiplied by the average polymer density. Based on our calculations, the average mass of 1 µm of plastic fibre is 4.14·10−5 µg (0.4 dtex).
Analysis of microplastic fibres
We analysed subsamples of representative microplastic fibres (10 per site) with Raman spectroscopy. This method has been successfully used to identify microplastics in different samples from the environment (Cole et al., 2013; Koelmans et al., 2019; Pan et al., 2019; Van Cauwenberghe et al., 2013). Raman spectra were acquired at room temperature with the use of the Alpha300M+ confocal microscope (Witec Gmbh). We used a 532 nm laser line delivered to the microscope through a single-mode optical fibre. Laser power at the sample did not exceed 2 mW. The Raman signal was collected through a 20× long working distance objective and passed through a multi-mode optical fibre (50 µm core diameter) to a lens-based spectrometer (Witec UHTS 300, f/4 aperture, focal length 300 mm; Wu et al., 2009). This was coupled with a back-illuminated Andor iDUS 401 detector thermoelectrically cooled to −60° C. The spectra were collected with the use of a 600 mm grating, resulting in a spectral resolution of about 4 cm–1. Typical single spectrum acquisition times ranged from 0.5 s to 1 s with 30 to 120 accumulations. The spectra were post-processed (via background subtraction and cosmic-ray removal) with the Project FIVE software (Witec Gmbh).
Statistical analyses
The differences in the microplastic fibre numbers between study sites were analysed by employing the nonparametric Kruskal-Wallis test followed by a Mann-Whitney U test. A significance level of α = 0.05 was used for statistical analysis. All statistical analyses were performed using Statistica (StatSoft Inc., Tulsa, OK).
Results and discussion
Fractions of microplastic fibres from the water of the Vistula River and the lakes
We found microplastic fibres in all water samples. The average ratio of fibre length to width was 76. The fibres were divided into three classes of length (L): (a) small, L < 1.0 mm; (b) medium, L in the range of 1.01 mm to 5.0 mm; and (c) large, L > 5.01 mm. There were significant differences in the number of small fibres among sites (Kruskal-Wallis, H3,30 = 8.24, p = 0.041); the highest number of fibres was in the Vistula River compared with Kalwa and Majcz lakes (Mann-Whitney U, p = 0.016; Figure 2). There were no significant differences in the content of small fibres between the Vistula River and Dziekanowskie Lake, which is situated nearby and has a periodic connection to the river.
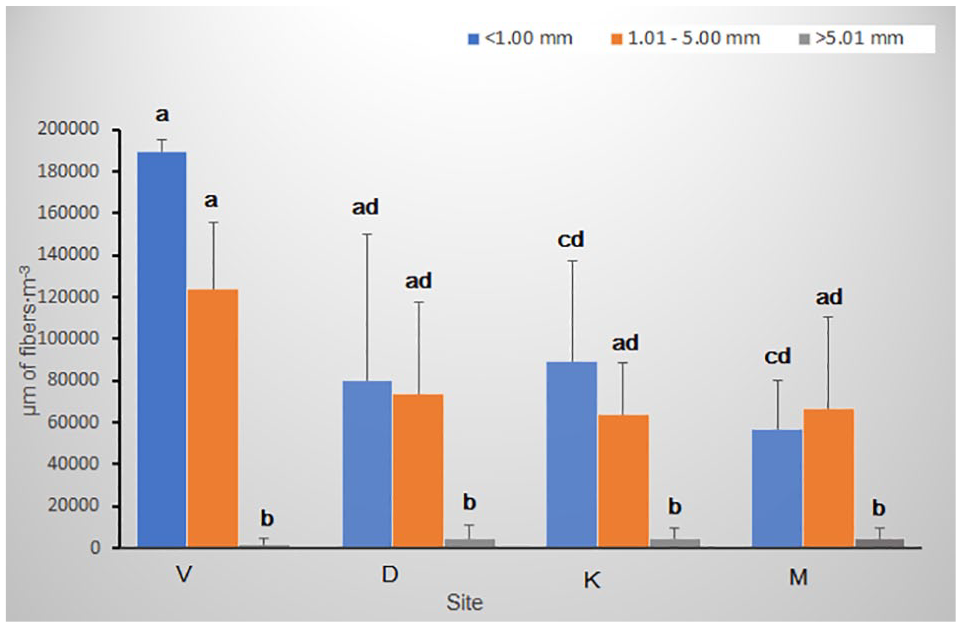
The total length of fibres of different size classes: (a) < 1.00 mm; (b) 1.01 mm to 5.00 mm; and (c) > 5.01 mm in the sampling sites.
There were no significant differences in the number of medium and large fibres among sites and in the number of all fibres between the three lakes (p > 0.05). There was a similar level of contamination in all studied lakes and no effect of the level of anthropogenic impact was observed. This is in line with some studies (e.g. Sighicelli et al., 2018) and unlike others, where this effect has been shown (e.g. in the Great Lakes, Baldwin et al., 2016; lakes around Wuhan in China, Wang et al., 2017b). We found more microplastic debris (~65 million fibres·km−2; ⩽ 4930 fibres·m-3; ⩽ 320 000 µm of fibres) by using a mesh size of 20 µm compared with other studies of inland waters (<1000–6.8 million particles·1 km−2; 0.21–1265 particles·m−3), in which nets with 55–333 µm mesh size were used (Anderson et al., 2017; Dris et al., 2018; Eriksen et al., 2013; Faure et al., 2015; Free et al., 2014; Rodrigues et al., 2018; Sighicelli et al. 2018; Su et al. 2016). In our studies the abundance of microplastic fibres was two orders of magnitude higher than in studies with 55 µm mesh size (Rodrigues et al., 2018), three orders of magnitude higher than in studies with 80 µm mesh size (Dris et al., 2018) and four or five orders of magnitude higher than in studies with 300–333 µm mesh size (McCormick et al., 2016; Sighicelli et al. 2018). Even if we take into account possible differences in the level of contamination of the studied rivers and lakes, the effect of mesh size is noticeable.
There were differences in the numbers of fibres within the sites and in total fibre length (Figure 2). In all study sites, small fibres dominated. The large fibres were significantly less abundant than small and medium fibres in the Vistula River (Kruskal-Wallis, H2,9 = 7.32, p = 0.02), Dziekanowskie Lake (Kruskal-Wallis, H2,27 = 17.48, p = 0.0002), Kalwa Lake (Kruskal-Wallis, H2,27 = 17.94, p = 0.0001), and Majcz Lake (Kruskal-Wallis, H2,27 = 15.9, p = 0.0004). This pattern with the highest concentration of plastic in the small size class (<1.0 mm) is consistent with surveys of other lakes, for example the Great Lakes (Cable et al., 2017).
In our study microplastic fibres were present in inland waters irrespective of the proximity of urban agglomeration. It is very likely that microfibres are carried by the wind and enter freshwater isolated from the sewage outlets, mainly by air movement and with rainfall. This is indicated by the considerable presence of microplastic fibres in Majcz Lake situated within the Landscape Park, where the number of microfibres did not significantly differ from other lakes. The importance of wind in the contamination of freshwater ecosystems with microplastic has been mentioned in other studies (Dris et al., 2015; Fischer et al., 2016; Horton et al., 2017). Microplastic has already been noted as existing in a remote mountain lake established as a national park (Free et al., 2014).
The microscopic analysis of fibres under high magnification (up to 1500×) indicated that most of them were ribbon-shaped (Figure 3). Tubular and rod-shaped fibres constituted only 9% of all fibres detected. The ribbon shape is characteristic of polyester, polyamide and cellulose-based fibres (Dyachenko et al., 2017; Lares et al., 2018). The last category was not found in our samples due to the method of removing organic matter.
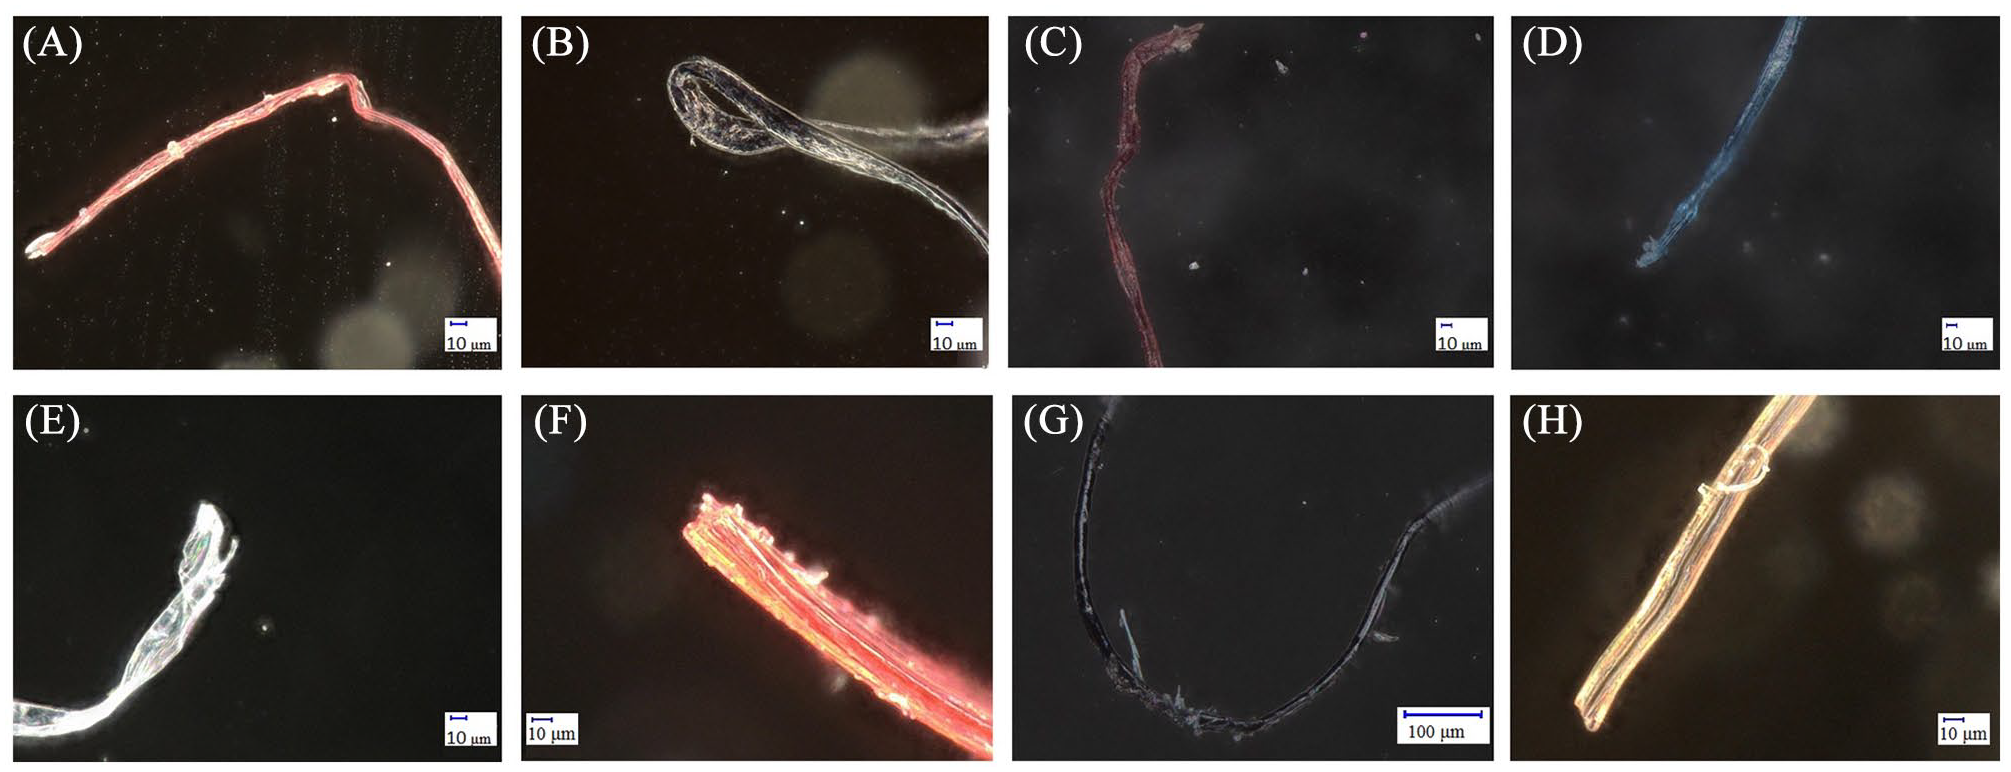
The shapes of the microfibres found in the sampling water: (A–E) ribbon-shaped, (F) Y-shaped, (G) rod-shaped and (H) U-shaped.
A control test using deionized water showed that there is a risk of contamination of the samples by plastic microfibres from the laboratory (eight fibres per control sample; 555 fibres·m−3 of deionized water). The small fibres dominated and constituted 62.5% of all detected in the control test. The large fibres were not present. This microplastic contamination resulting from the sampling method may constitute 12% to 30% of the fibres detected in field samples. There was low probability of contamination of the field samples with fibres from the planktonic net. Its fibres were oval in shape and 34.5 µm wide, compared with 19–33 µm wide and mostly ribbon-shaped microfibres from the field samples. The air test of microfibres in the laboratory indicated three fibres after exposure in the isolated laboratory and 12 fibres in the laboratory with people working (~1800 fibres·m−2 of laboratory). As in the control sample, fibres smaller than 1.0 mm dominated (83%) and large fibres were not present. Our results are in accordance with those of other studies on air contamination with microfibres. Gasperi et al. (2015) detected exclusively microfibres were studied indoor and outdoor air. Of all the fibres, 80% were between 0.1 mm and 0.5 mm; the others were between 1.0 mm and 5.0 mm. Data from the literature and our results of the control sampling and the air test indicate that the contamination of samples with small fibres, which mostly come from air, should be taken into account. In the available studies, little attention has been paid to the risk of sample contamination despite the increasing number of microplastic research studies (Hermsen et al., 2018; Koelmans et al., 2019; Mani et al., 2015). Due to the fact that microplastics are present in the air, it is virtually impossible to avoid contamination of the samples completely. We suggest that research on the contamination of aquatic ecosystems with microplastic fibres should be linked to control tests.
Microplastic content in the studied sites
The lengths of fibres in each class were added together. The sum indicated that even though small fibres numerically dominated in the sample, they did not constitute a majority of the microplastic collected. The medium fibres had the largest share in the total microplastic content, independent of the studied site (Figure 4). The share of medium fibres was significantly higher than that of small fibres (Mann-Whitney U, p = 0.005, p = 0.006, p = 0.01 for Dziekanowskie, Kalwa and Majcz lakes, respectively). The large fibres were the second in the percentage of microplastic content although they were the least abundant (Figure 4). There were significant differences between the total length of medium and large fibres in Dziekanowskie Lake (Mann-Whitney U, p = 0.045) and between the total length of small and large fibres in Majcz Lake (Mann-Whitney U, p = 0.017).
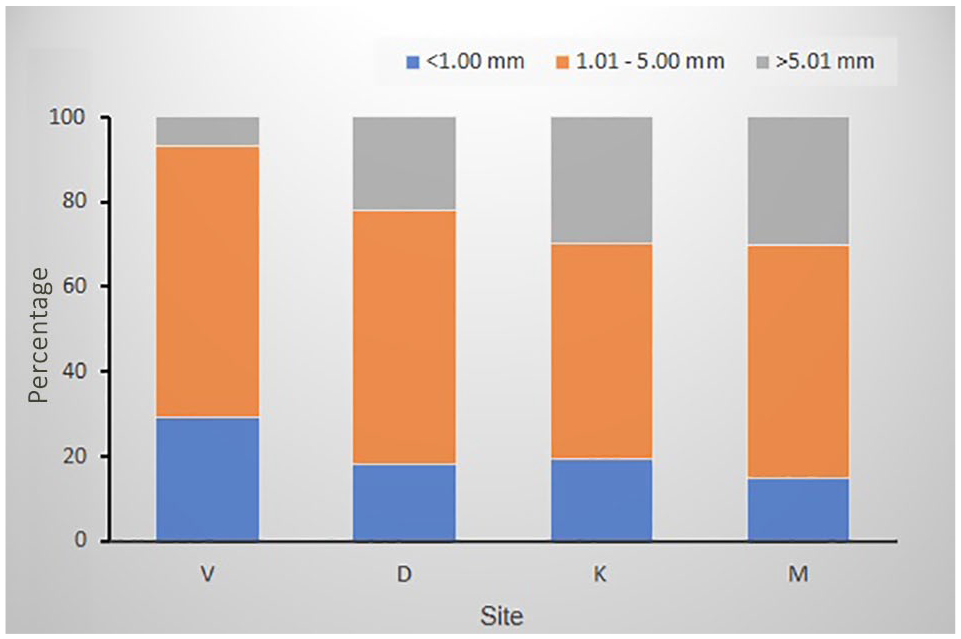
The proportion of plastic deposited in fibres of different size classes: (a) < 1.00 mm; (b) 1.01 mm to 5.00 mm; and (c) > 5.01 mm.
The mass of plastic contamination per 1 m2 of the surface of the lake, assumed on the basis of both precise measurements of fibres and their weight, was the highest in Dziekanowskie Lake (4.7 µg), followed by Kalwa Lake (4.4 µg) and Majcz Lake (4.1 µg). This indicated that about 25 g of microplastics, which refers to fibres (the equivalent of five credit cards), were in the water under the surface to the depth of 0.2 m in the largest studied lake – Kalwa. Lake Kalwa is situated in close proximity to the town of Pasym, which could be a main source of microplastic pollutants. The source of microplastics seems to be mainly urban areas (Yu et al., 2018). This could be particularly true for urban rivers such as the Vistula that we sampled and in which we found significantly more small microfibres than in the Masurian lakes. The Vistula is the source of drinking water for a large portion of Warsaw citizens and those of other cities (e.g. Płock). The authors of preliminary studies report that plastic microfibres are found in tap water and may constitute 98.3% of all anthropogenic particles (Kosuth et al., 2018; Koelmans et al., 2019). Apart from potential methodological errors, information on the contamination of inland water with microplastic fibres may be important for drinking water cleaning technology.
Types of microplastic fibres isolated from the water
We analysed the characteristic peaks of representative fibres by Raman spectroscopy and matched them with the spectra of known plastics. Results indicated the dominance of conventional plastic polymers: PET, polyester that is mainly composed of PET, and PU among the collected fibres (Figure 5). Our results agree with the literature data that most fibres found in aquatic ecosystems are composed of rayon or PET (Yu et al., 2018). Browne et al. (2011) suggested that a large proportion of microplastic fibres found in the aquatic environment may be derived from sewage as a consequence of washing clothes. Microplastic fibres from wastewater were reported mainly as polyester fibres (96.3%); most of the rest of the fibres (3.1%) were made of polyamide (Lares et al., 2018). In the case of debris, the literature data indicated that the most abundant types of plastic were PE (40%), PS (25%) and PP (Tamar River; Sadri and Thompson, 2014). PS and PET were most common in the surface water and sediment of lakes (Dongting Lakes, Jiang et al., 2018). In urban rivers, microplastic pellets, fibres and fragments were identified as PP, PE and PS (rivers in Illinois, McCormick et al., 2016).
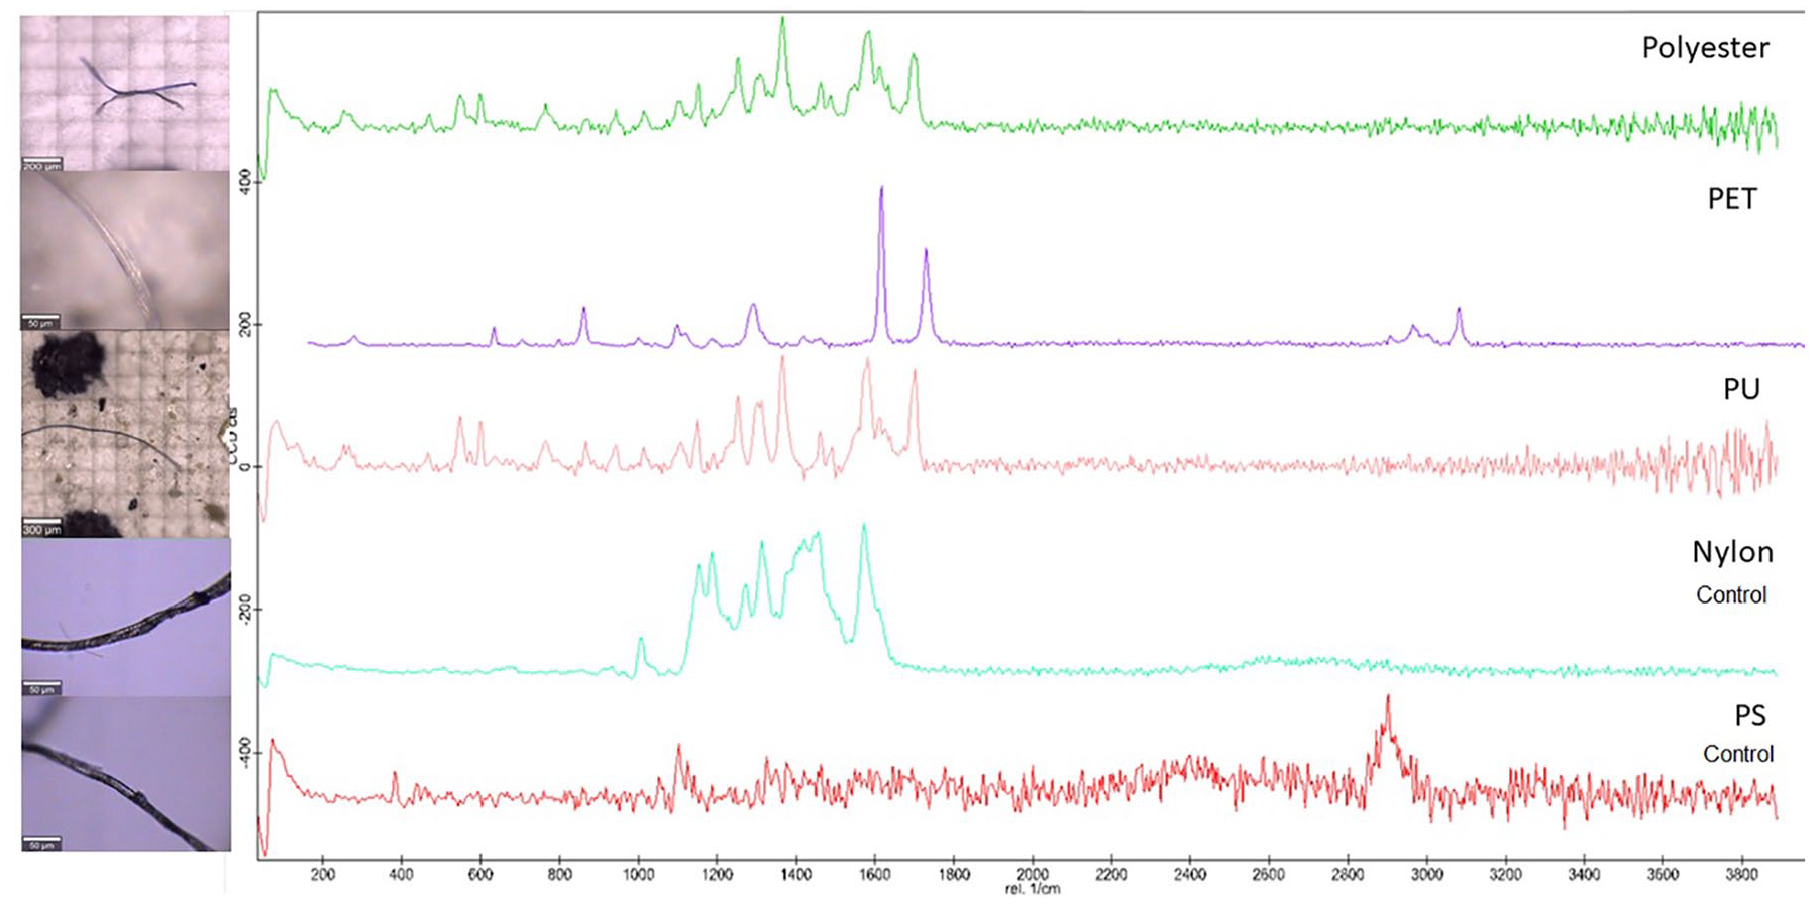
Examples of the Raman spectra of microfibres collected from the studied sites and the control. Polymers were identified on the basis of reference spectra and literature data.
Conclusion
The level of anthropogenic impact was assessed as the close presence of an urban agglomeration; buildings, connection to the river and tourism did not appear to determine the level of the contamination with microplastic fibres in the lakes. Microplastic fibres were present in all studied sites in Poland as well as Majcz Lake, which is situated within the Masurian Landscape Park. We found 10 times more microplastic fibres compared with other studies of inland waters. We suggest that the use of an ultrafine mesh size (20 µm compared with the widely used 330–300 µm) allows us to correctly estimate the actual level of microplastic contamination. There can be about 25 g of microplastics (the equivalent of five credit cards) in the water under the surface to the depth of 0.2 m. The subsamples of microfibres analysed from different study sites indicated the presence of typical plastic polymers: PET, polyester and PU. It is very likely that microfibres are carried by the wind and enter freshwater isolated from the sewage outlets mainly by air movement and with rainfall. We indicated that by using the control sample, based on deionized water and treated with the same procedure used for field samples, there is a high probability of contamination with microplastic in the field samples as a result of the methodology (12–30%). Contamination with microplastic fibres during the process of microplastic isolation and analysis cannot be ignored. The level of contamination of samples is critical to the analysis of microplastics present in remote regions with inland waters isolated from anthropogenic pressure. Our results and evidence from the existing literature suggest that any form of known protection is probably not going to be effective in the prevention of microplastic contamination of inland waters if plastic continues to be so popular.
Footnotes
Acknowledgements
We thank Agnieszka Poniatowska for her help in designing the sampling procedure. We also thank two anonymous reviewers for their constructive suggestions.
Declaration of conflicting interests
The authors declared no potential conflicts of interest with respect to the research, authorship, and/or publication of this article.
Funding
The authors disclosed receipt of the following financial support for the research, authorship, and/or publication of this article: this research was funded by the Ministry of Science and Higher Education, PBBNS-19/18.