
Abstract
Excessive gas pressure (GP) in landfills is a potential triggering mechanism for slope failure, which is rarely considered in analytical models. This paper presents a modified analytical model for landfill stability dependent on GP. A two-layered GP model is established to describe the GP above and below the leachate level. The distribution of GP is then used to calculate the factor of safety (FS) using a modified wedge stability analysis method. It is found that the lack of consideration of the GP in landfill stability analysis leads to serious overestimation of the FS. In addition, the GP gas pressure within the landfill accelerates the critical interface of a multilayer liner system shifting from one to another. A new estimation criterion for FS is proposed. The proposed criterion can directly estimate the stability of the landfill by the field-tested pore pressure. Finally, the proposed method is applied to estimate the slope failure of Xiaping landfill in Shenzhen, and the results verify the proposed method.
Introduction
High gas pressure (GP) within landfills has been reported in many project cases. For example, a United Kingdom landfill ejected 13 m high leachate due to excess GP gas pressure at a newly completed horizontal well (Beaven et al., 2007). A Chinese landfill ejected a 5 m high mixture of leachate and gas when a vertical well was drilled (Zhan et al., 2015). High GP has an adverse effect on landfill stability, which in some instances causes slope failure. One of the main reasons for the failure of Bayada landfill, Xiaping landfill, and Xerolakka landfill is the excess GP (Merry et al., 2005; Zhan et al., 2015). Therefore, it is very important to investigate the influence of GP on slope stability for the design and operation of landfills.
Numerous researchers have predicated the GP distribution within landfills using both analytical and numerical methods (Liu et al., 2011; Nastev et al., 2001; Reddy et al., 2013; Townsend et al., 2005). Townsend et al. (2005) investigated the GP distribution within landfill via an analytical solution. Liu et al. (2011) proposed liquid–gas fluid migration theory. The equations for the distribution of both GP and water pressure were solved by using a simplified analytical solution. Reddy et al. (2013) introduced a two-phase model to predict the water pressure and GP and provided the corresponding numerical solutions. However, these studies did not consider the impact of GP distribution on slope stability in landfills. Moreover, the gas generation rate and gas permeability coefficient of landfill waste show great nonhomogeneity above and below the leachate level (LL) due to compression, degradation and moisture (Jain et al., 2005; Li et al., 2012). Few studies have focused on the layered model describing the GP distribution above and below the LL, which is very important for developing a landfill stability model under leachate buildup condition.
Some researchers have considered the impact of GP on landfill stability using numerical models (Feng et al., 2018; Reddy and Giri, 2015; Reddy et al., 2014; Xu et al., 2012). Reddy and Giri (2015) evaluated the slope stability under leachate recirculation condition by using a liquid–phase flow model and a coupled gas–liquid–phase flow model. The results showed that the influence of GP on stability analysis could not be ignored. Feng et al. (2018) studied slope stability under leachate recirculation through vertical wells, whereas the variation in pore pressure distribution with saturation is discussed in the calculation of the factor of safety (FS).
The landfill stability analysis in Feng et al. (2018) is a numerical model by software FLAC3D. FS is calculated by the strength reduction method in a homogenous landfill (i.e., the landfill without considering leachate buildup condition). However, the impact of GP on landfill stability based on an analytical model is rarely studied. Moreover, there are few models that analyze the effect of GP below the LL on landfill stability. For example, a two-part wedge analysis method under different leachate buildup conditions was developed by Qian (2008). The results showed that FS obviously decreased with the effect of water pressure. However, pore pressure within landfill includes water pressure and GP. The lack of consideration of GP in the stability model has a potential risk for engineering practice.
This paper presents an analytical model for landfill stability dependent on GP using a modified wedge stability analysis method. A two-layered model, which describes GP above and below the LL, and the process of introducing the GP distribution into the wedge stability analysis method are first presented. Then, the effects of GP on landfill stability, a new estimation criterion for FS, and the verification of the proposed model are analyzed and presented.
Waste properties and mathematical model
A landfill is divided into two layers with the LL as the dividing line, as shown in Figure 1(a). The thickness of each layer is hi, and the total thickness of the landfill is h. Subscript i represents the layer: i = 1 corresponds to the layer above the LL, and i = 2 corresponds to the layer below the LL. The calculated depth in each layer is zi (0 ⩽ z1 ⩽ h1, 0 ⩽ z2 ⩽ h2). Each layer has its own gas generation rate ϕai and gas permeability coefficient kai. Gas generation rate describes the amount of gas generated per unit mass of the waste per unit time. The gas permeability coefficient refers to the gas flow rate under unit pressure gradient. It describes the difficulty level of gas to pass through the pore skeleton of the waste. Both gas generation rate and gas permeability coefficient are influenced by many factors, such as temperature and pressure (Benson et al., 2007; Gourc et al., 2010; Jain et al., 2005; Stoltz et al., 2010). However, this paper focuses on the method of landfill stability considering the GP. The factors affecting the gas generation rate and gas permeability coefficient are not analyzed in this paper, which should be noted. Based on the one-dimensional study of Liu et al. (2011), the coupled partial differential equation of the gas phase can be obtained as:
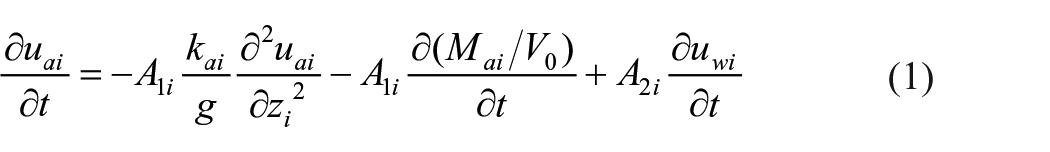
where uai and uwi are the GP and water pressure, respectively; Mai is the produced gas mass by degradation; V0 is the total initial volume; g is the gravity acceleration; and A1i and A2i are parameters related to the waste properties.
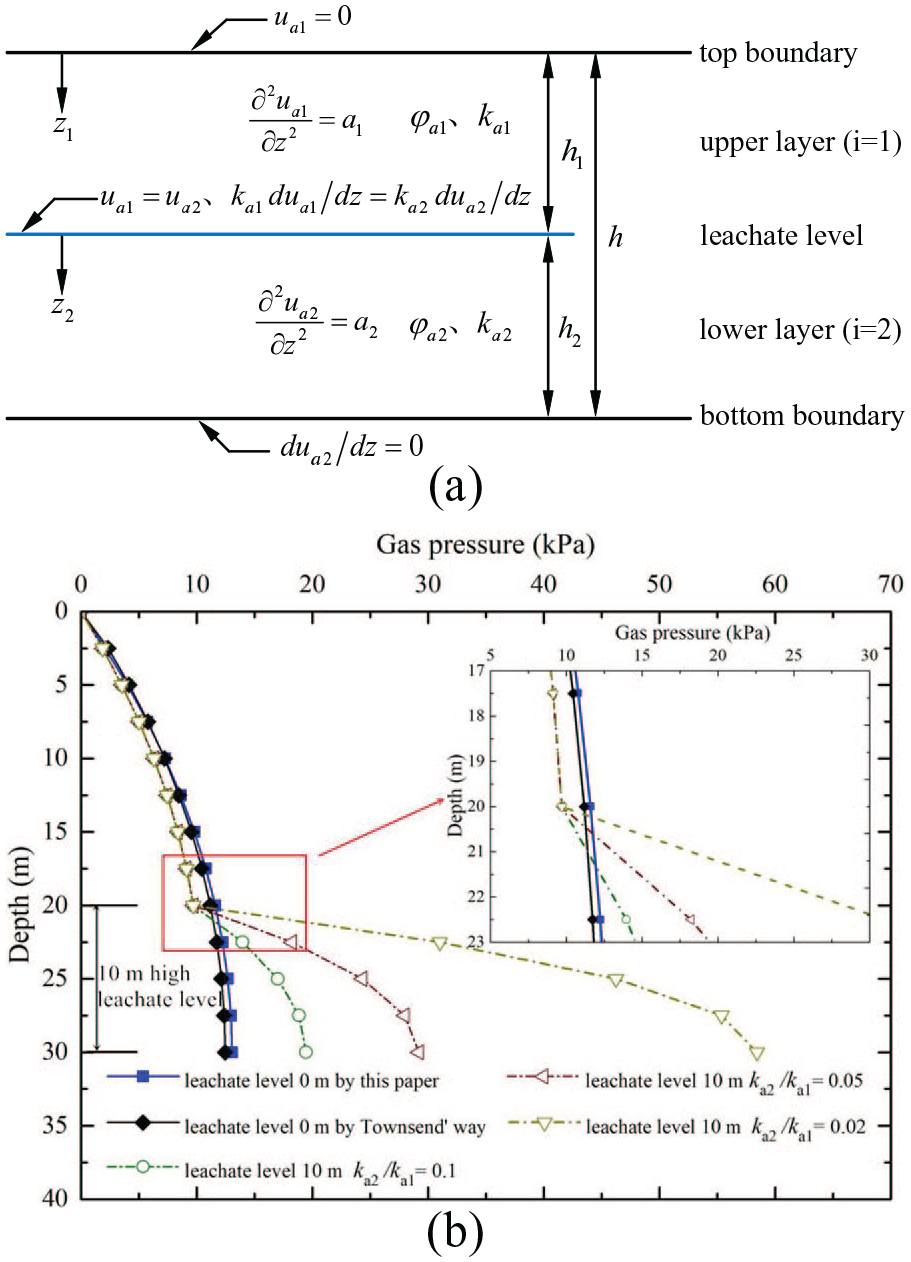
(a) schematic diagram; and (b) distribution of gas pressure within the waste.
Since the dissipating time for GP is much shorter than that for water pressure, the water pressure can be neglected when solving for the GP (Young, 1989). Thus,
where
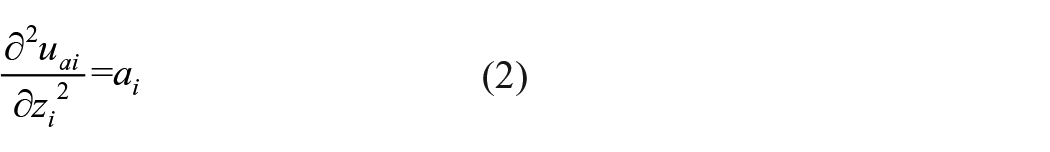
Integrating Equation (2) twice:

where bi and ci are integration parameters to be determined from the boundary conditions.
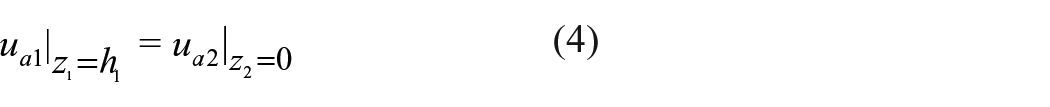
The GP continuity and gas flux continuity are satisfied at the LL (Li and Cleall, 2010; Li et al., 2012):
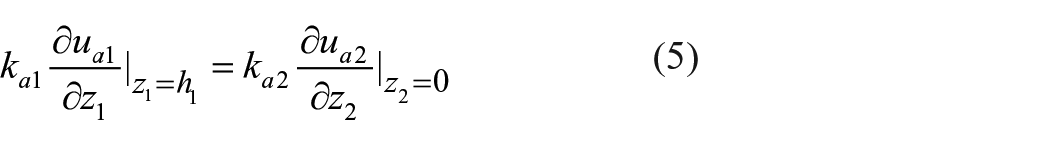
The GP at the top boundary condition is assumed to be a free ventilation boundary (i.e., air flow freely):


where
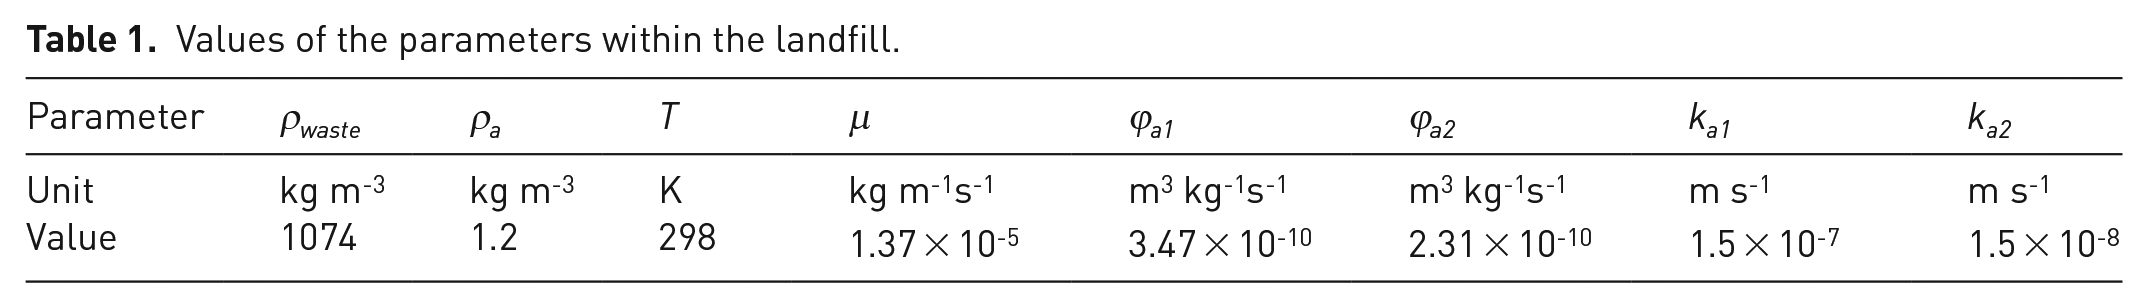
A 30 m high landfill (Li et al., 2012; Townsend et al., 2005) with two different LLs (0 m and 10 m) is analyzed to signify the importance of considering layered GP distribution in the development of a landfill stability model. The density of waste is 1074 kg m−3 according to the value reported by Merry et al. (2006). The temperature is 298K (Li et al., 2012; Townsend et al., 2005) and the density of LFG is 1.2 kg m−3 (Lamborn, 2012; Merry et al., 2006), as shown in Table 1. Based on the experimental results of Erses et al. (2008), Gourc et al. (2010), Di Maria et al. (2013) and Benson et al. (2007), the gas generation rate at a stable stage is approximately 1–5 × 10⁻⁵ m3 kg−1d−1. The value of 3 × 10⁻⁵ m3kg−1d−1 is chosen as ϕa1, and the value of 2 × 10⁻⁵ m3 kg−1d−1 is chosen as ϕa2 due to the older waste below the LL. Thus, ϕa1 = 3.47 × 10⁻¹⁰ m3 kg−1s−1, ϕa2 = 2.31 × 10⁻¹⁰ m3 kg−1s−1. The chosen values are between the adopted gas generation rates of Townsend et al. (2005) and Merry et al. (2006). The gas permeability coefficient of 1.5 × 10⁻⁷ m s−1 is adopted as ka1 based on the field monitoring results of Jain et al. (2005). The gas permeability coefficient is smaller by approximately one order of magnitude in deep layers of the landfill due to the very wet condition (Wu et al., 2012). Thus, the value of 1.5 × 10⁻⁸ m s−1 is adopted as ka2.
Values of the parameters within the landfill.
The GP distribution obtained using Equations (6) and (7) is presented in Figure 1(b). For landfill without LL, the GP increases with depth. The maximum GP of 13.0 kPa occurs at the base of the landfill. The single-layer model established by Townsend et al. (2005) is calculated by the above parameters for comparison. It is noted that units between Townsend’s model and the model proposed in this paper are not identical. The gas generation rate per bulk volume ϕTi (kg m−3s−1) and the vertical intrinsic permeability kTi (m2) are used in Townsend’s model. However, the units between Townsend’s model and the model proposed in this paper can be converted to each other based on the following equations (Didier et al., 2000; Zhan et al., 2015):

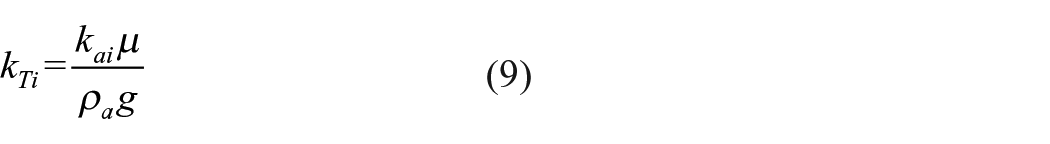
where, μ is the dynamic viscosity of LFG.
The values of ϕai and kai used in this paper are respectively substituted into Equation (8) and Equation (9) to obtain the values of ϕTi and kTi used in Townsend’s model. Then, the obtained ϕTi and kTi are substituted into Townsend’s model for calculating GP distribution. The results are shown in Figure 1(b). The GP gradient obtained by the proposed model in this paper is in close proximity to that of Townsend et al. (2005), which indicates the feasibility of the proposed model.
For the landfill with a 10 m high LL, a discontinuity of GP gradient is observed at the LL. The GP gradient below the LL significantly increases, while the GP gradient above the LL slightly decreases. The reason is that LFG cannot flow through the liner system at the base of the landfill. LFG generated by the degradation of landfill waste below the LL easily accumulates in it due to the low-permeability properties, which causes an increase in GP gradient. The layer below the LL is in unsaturation state (Merry et al., 2006). Meanwhile, the accumulation of LFG below the LL reduces the amount of LFG moving from below to above the LL, which results in a decrease in GP above the LL. If ϕa1, ϕa2, and ka1 are assumed to be constant and ka2 varies, the maximum pressures at the base of the landfill when ka2/ka1 = 0.1, 0.05, and 0.02 are 19.4, 29.1, and 58.4 kPa, respectively, which is approximately 1.5, 2.2, and 4.5 times greater than that of landfill without a LL. These results occur because the resistance of the movement of LFG increases with a decrease in the gas permeability coefficient. LFG more easily accumulates in landfill waste below the LL. Therefore, if a single-layer model is used to predicate GP distribution in the entire landfill, GP below the LL is significantly underestimated, which will lead to underestimation of FS in the landfill stability evaluation. The two-layered GP model developed in this paper can describe GP distribution above and below the LL, which provides a basis for developing a landfill stability model.
Stability analysis of landfills with the effects of LL and GP
According to the translational failure of landfills, a two-part wedge method was developed by Qian et al. (2003) using the limit equilibrium method. The landfill is divided into active wedge and passive wedge. Through the limit equilibrium analysis of the two wedges, the equilibrium equation is established and the FS is calculated. Unlike the previous methods, the two-part wedge method considers the effect of the internal friction angle of the waste on the translational failure of the landfill. This method can calculate the amount and direction of the interwedge force (Feng et al., 2010; Qian, 2008; Wu, 2008). Then, based on the two-part wedge method, the three-part wedge, four-part wedge, and five-part wedge methods were developed with different influencing factors (Feng et al., 2010; Wu, 2008). However, the wedge stability analysis method considering the effects of LL and GP proposed in this paper is appropriate for N-part wedge. A two-part wedge stability analysis method considering the LL and GP is first developed in detail. Then, the method for obtaining the expression of FS for N-part wedge with computer is analyzed and developed.
Calculation of pore pressures
Four representative leachate buildup conditions in landfills are listed in Qian (2008). A horizontal seepage condition is selected to illustrate the calculation methods of water pressure and GP, as shown in Figure 2. Uwa (Uwb), Uwc, and Uwd are the resultants of pore water pressures acting on the lateral side of the active wedge and passive wedge, the bottom of the active wedge and the bottom of the passive wedge, respectively. Similarly, Uaa (Uab), Uac, and Uad are the resultants of pore GPs acting on the lateral side of the active wedge and passive wedge, the bottom of the active wedge and the bottom of the passive wedge, respectively.
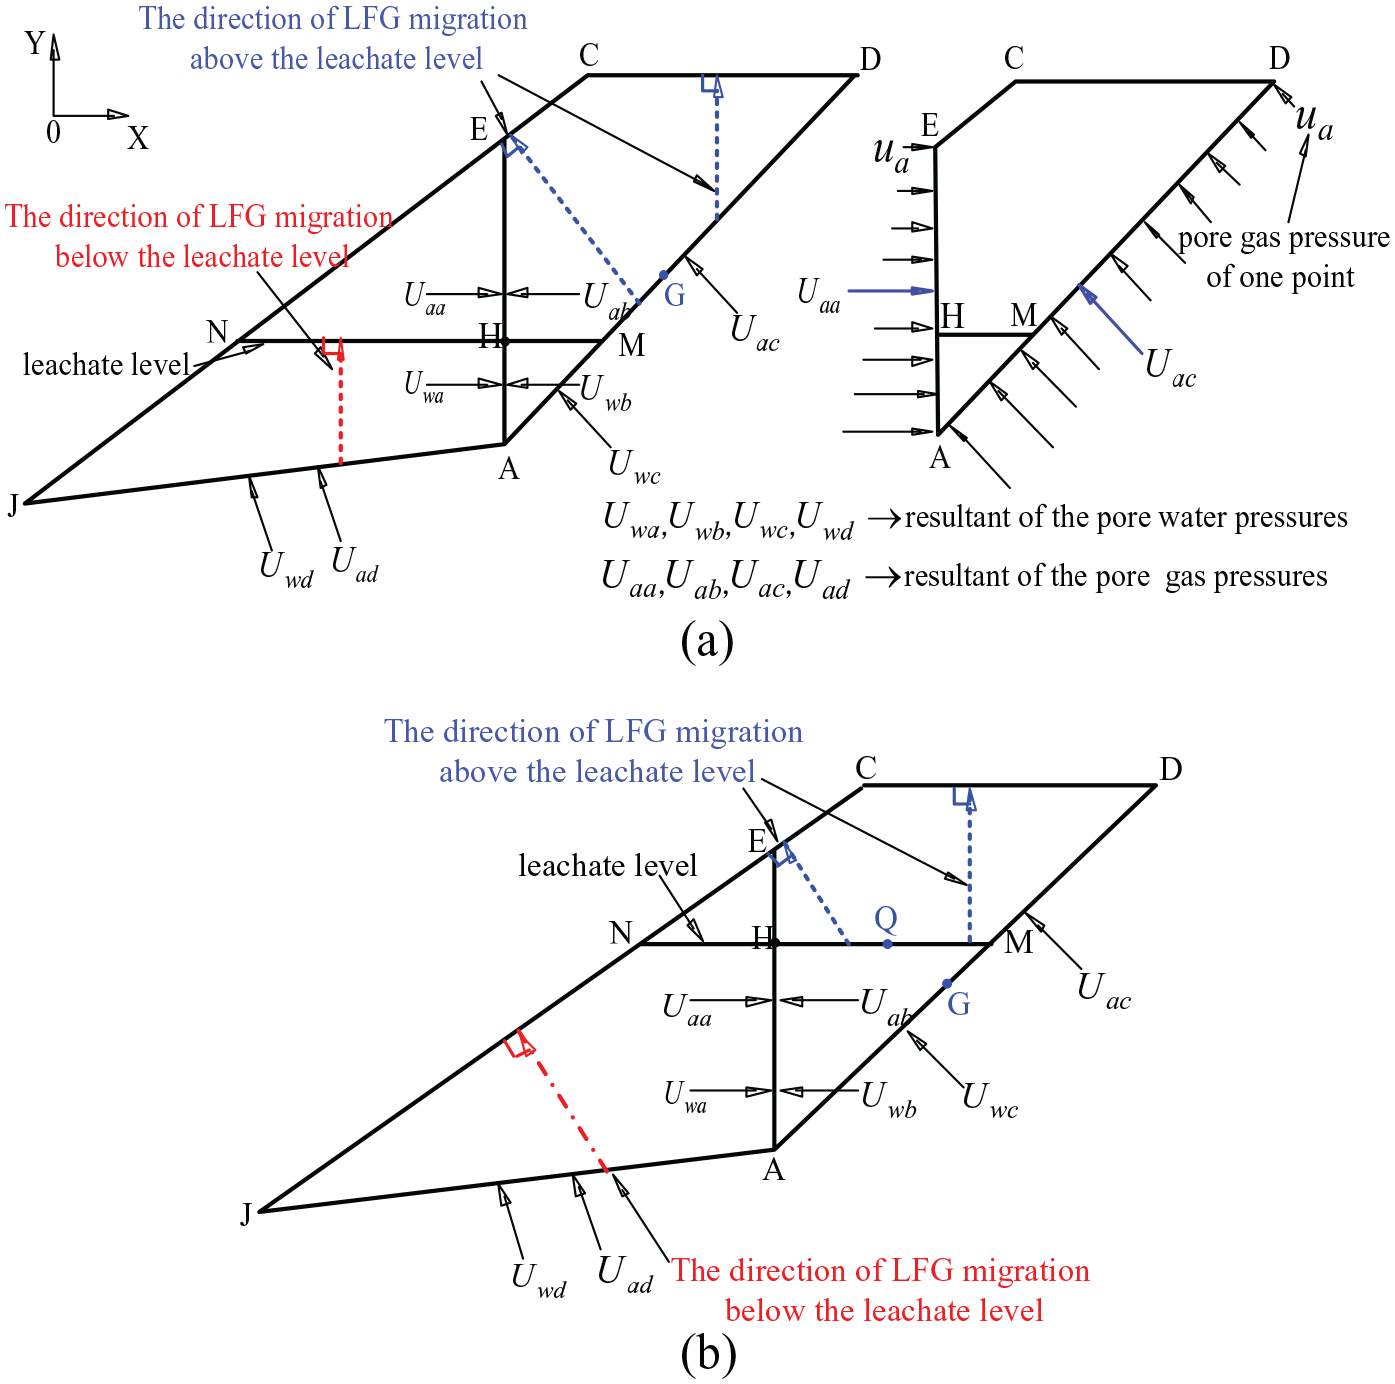
Water pressure and gas pressure acting on wedges: (a) leachate level (LC) is lower than point G; and (b) leachate level is higher than point G.
The water pressure is calculated based on the hydrostatic pressure, which is illustrated in Qian (2008). The GP acting on the wedges is shown in Figure 2(a). The pore GP of one point (ua) vertically acts on the boundary of the wedges (Thiel, 1998). The values of ua are calculated by different equations due to the different directions of gas flow. The gas within the landfill flows along the direction of the least resistance (El-Fadel et al., 1995; Goossens, 1996). Accordingly, the gas above the LL vertically migrates to the atmosphere. The gas below the LL vertically migrates to the LL, as shown in Figure 2(a). Thus, ua above the LL is calculated by Equation (6), while ua below the LL is calculated by Equation (7).
The Uaa, Uab, Uac, and Uad are the resultants of the pore GPs vertically acting on the boundary of the wedges. The values of Uaa, Uab, Uac, and Uad are calculated by the integration of ua. Based on Equation (6) and Equation (7), the distribution of ua above and below the LL are obtained. Then, by the integration of ua above and below the LL, the resultants of the pore GPs acting on the wedges above and below the LL are calculated, respectively. Finally, the resultants of the pore GPs above and below the LL are added together to obtain the final resultant of the pore GPs (Uaa, Uab, Uac, and Uad).
The atmosphere surface CD and atmosphere surface JC are shown in Figure 2(a). The gas tends to flow within a relatively short distance to the atmosphere surface (El-Fadel et al., 1995). Thus, there is one point G on the back slope AD where the distances to atmosphere surface CD and atmosphere surface surface JC are equal. The gas on the DG part migrates to atmosphere surface CD, while the gas on the MG part migrates to atmosphere surface JC. Similarly, when the LL is higher than point G in Figure 2(b), there is one point Q on the LL NM where the distances to atmosphere surface CD and atmosphere surface JC are equal. The gas on the QM part migrates to atmosphere surface CD, while the gas on NQ part migrates to atmosphere surface JC.
Stability analysis of two-part wedge
A typical landfill configuration to be analyzed is shown in Figure 3. A two-part wedge analysis method considering the effects of LL and GP is developed to evaluate landfill stability. Based on the assumptions of Qian (2008), the force equilibrium is shown as follows:
Considering the force equilibrium of the passive wedge shown in Figure 3(a), equilibrium of forces in Y direction (∑FY = 0) gives:

If


Substituting Equations (11) and (12) into Equation (10) gives:
Equilibrium of forces in X direction (∑FX = 0) gives:

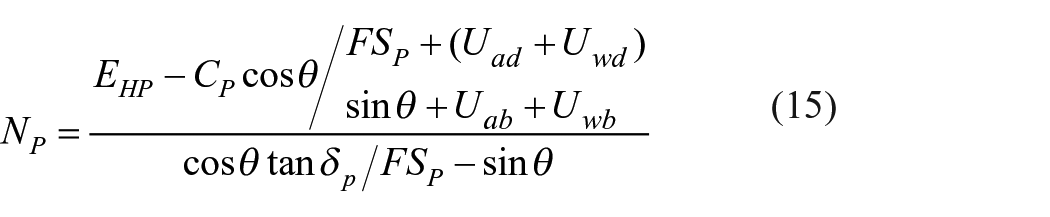
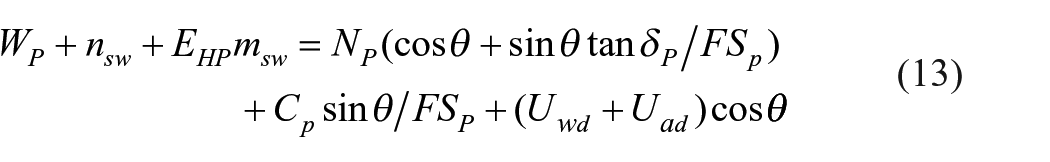
Substituting Equation(15) into Equation(13) and rearranging for EHP gives:
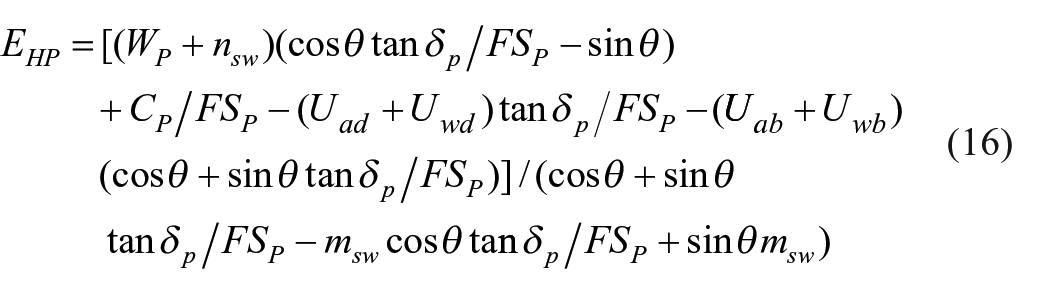
where, WP is the weight of passive wedge; EVP is the frictional force acting on side of passive wedge; EHP is the normal force from active wedge acting on passive wedge; NP is the normal force acting on bottom of passive wedge; φsw is the internal friction angle of solid waste; Csw is the total cohesive force of solid waste; CP is the total cohesive force between liner components beneath passive wedge; FSV is the factor of safety at interface between two wedges; FP is the frictional force acting on bottom of passive wedge; FSP is the factor of safety for passive wedge; θ is the angle of landfill cell subgrade measured from horizontal; and δP is the interface friction angle of liner components beneath passive wedge.Similarly, considering the force equilibrium of the active wedge shown in Figure 3(a), equilibrium of forces in X direction (∑FX = 0) and Y direction (∑FY = 0) gives:
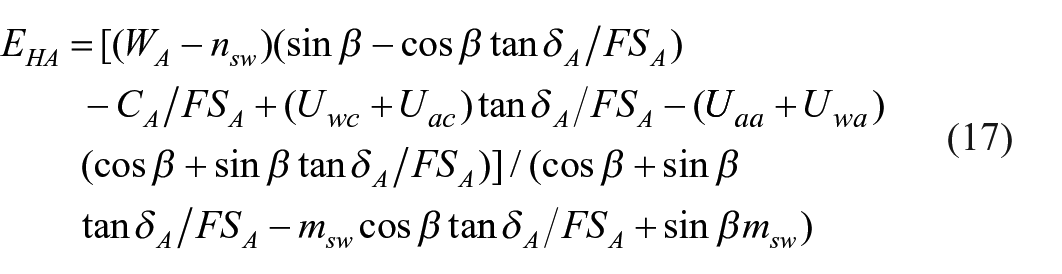
where, EHA = normal force from passive wedge acting on active wedge; WA is the weight of active wedge; β is the angle of back slope measured from horizontal; δA is the interface friction angle of liner components beneath active wedge; CA is the total cohesive force between liner components beneath active wedge; and FSA is the factor of safety for active wedge.
Because normal force from passive wedge acting on active wedge (EHA) = normal force from active wedge acting on passive wedge (EHP), Uaa = Uab = Ua,Uwa = Uwb = Uw, factor of safety for passive wedge (FSp) = factor of safety for active wedge (FSa) = FS, Equation (16) must equal Equation (17), and using αx2+bx+c = 0, the resulting FS can be expressed as follows:
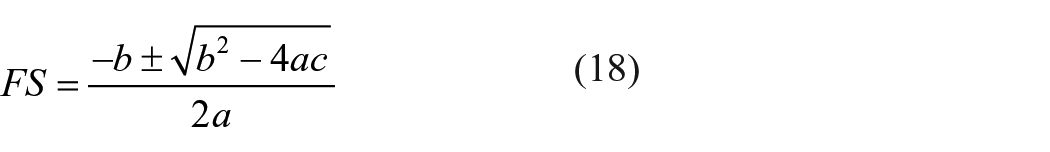
where
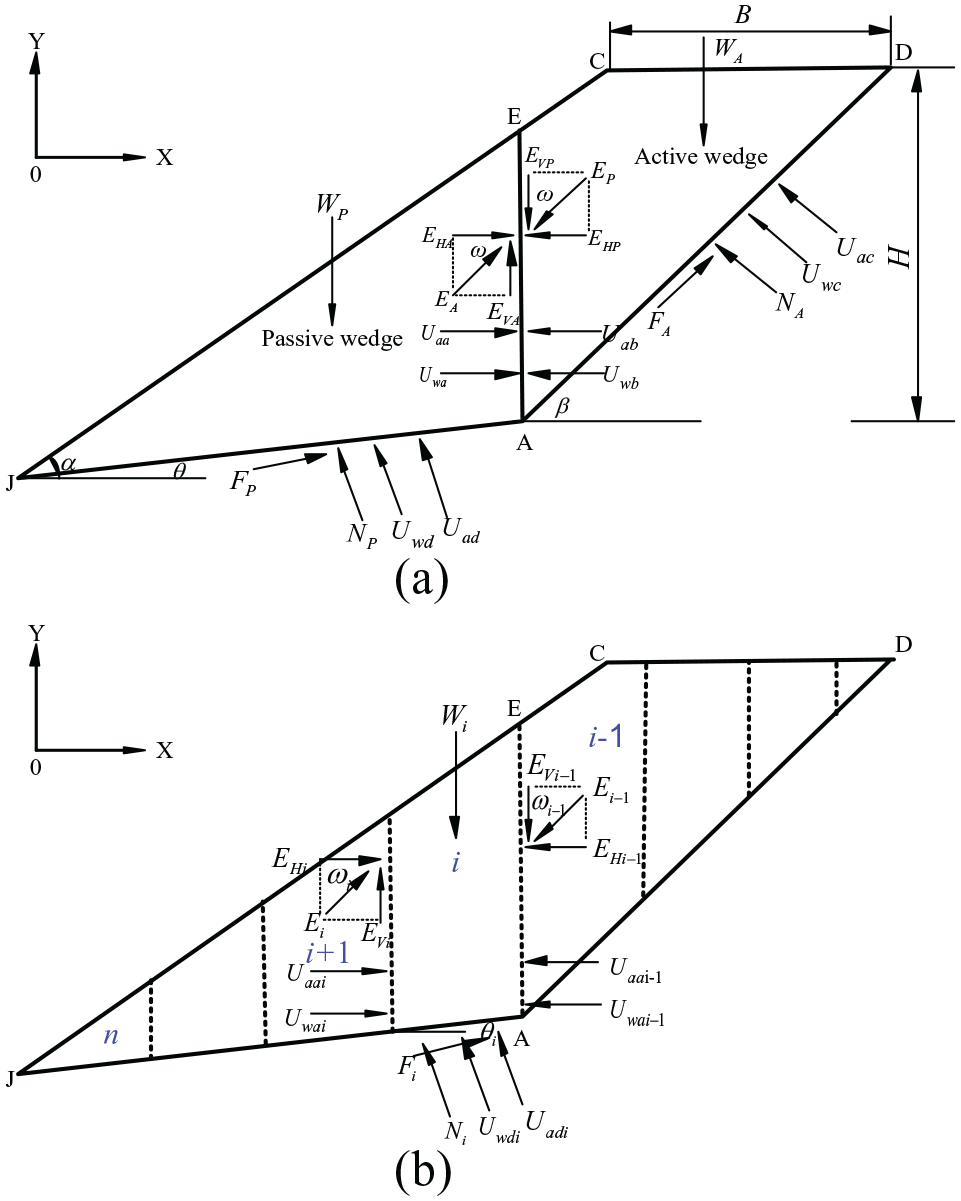
Forces acting on wedges of a waste mass in a landfill cell: (a) two-part wedge; and (b) N-part wedge.
where, WT = total weight of two wedges, WT=WA+WP.
Equation (18) contains two unknowns: factor of safety at interface between two wedges (FSV); and FS. The minimum factor of safety (FSmin) can be obtained when the influence of the cohesion and internal friction angle of waste is not considered, that is, FSV = ∞. The maximum factor of safety (FSmax) can be obtained by assuming FSV = FS for FS ⩾ 1 or FSV = 1 for FS < 1. The true factor of safety (FSture) is the exact solution of Equation (18). Because the exact value of FSV cannot be predicted based on the assumptions, the true factor of safety FSture cannot be solved from Equation (18). However, FSture should be located between the upper and lower bound solutions of Equation (18) (FSmax and FSmin). The average value of FSmin and FSmax is used as a solution of Equation (18) to replace FSture (Feng et al., 2010; Qian et al., 2003).
Stability analysis of N-part wedge
The landfill is divided into N discrete parts, as shown in Figure 3(b). The ultimate equilibrium analysis of the each wedge is firstly conducted. Then, the equilibrium equation of the whole waste mass is established. Based on the above two steps, the expression of FS for the landfill can be obtained (Feng et al., 2010; Wu, 2008). However, the obtained expression of FS is complicated. In order to apply the wedge analysis method proposed in this paper to practical projects, the above two steps can be analyzed with a computer to get the expression of FS. The specific process is as follows.
According to the studies of Qian (2008) and Qian et al. (2003), the value of factor of safety is assumed to be the same at all points of the failure surface. The FSV is assumed to be the same. The cohesion and internal friction angle of the solid waste within the landfill are also assumed to be the same. Considering the ultimate equilibrium analysis of the wedge i in Figure 3(b), the equilibrium of forces in X and Y direction gives:
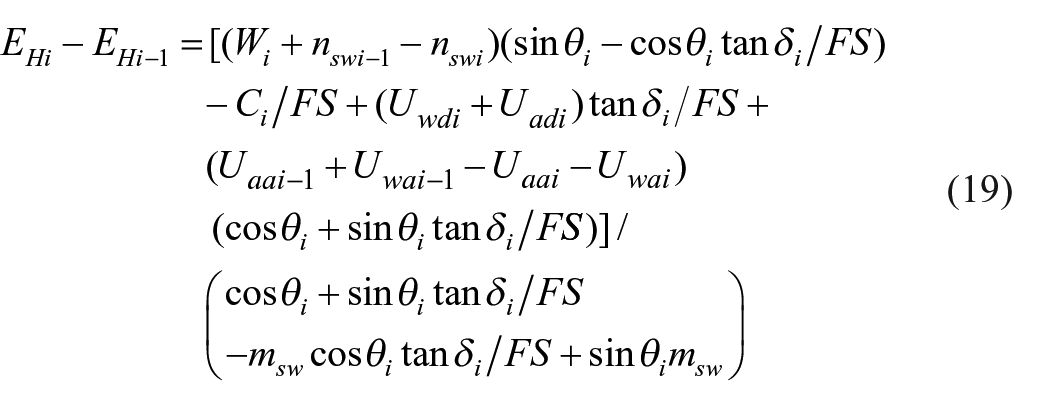
where, EHi is the normal force from the wedge i+1 acting on the wedge i; Wi is the weight of the wedge i; θi is the angle of the failure plane of the wedge i measured from horizontal; δi is the minimum interface friction angle of liner components beneath the wedge i; Ci is the total cohesive force between liner components beneath the wedge i; msw = tanϕsw /FSV, ϕsw is the internal friction angle of the solid waste; nswi= Cswi /FSV, Cswi is the total cohesive force at the interface between the wedge i and the wedge i+1; Uadi and Uwdi are the resultant of the pore GPs and the resultant of the pore water pressures acting on the failure plane of the wedge i, respectively; and Uaai and Uwai are the resultant of the pore GPs and the resultant of the pore water pressures at the interface between the wedge i and the wedge i+1, respectively.
Afterwards, the equilibrium equation of the whole waste mass is established as follows:
Based on Equation (19), the expressions of the normal force acting on the wedge numbering from 1 to N can be obtained. Then, the obtained expressions are substituted into Equation (20). By the accumulation of Equation (20), the expression of FS for the landfill is obtained.
Analysis of calculated results and new estimation criterion for FS
In this section, the effects of GPs on FS and the shift of the critical interface using two-part wedge analysis method are discussed. In addition, a new and convenient estimation criterion for FS is proposed.
The control parameters are as follows: unit weight of solid waste (γsw) = 10.2 kN m−3, saturated weight of solid waste (γsat) = 14.3 kN m−3, ϕsw = 30°, cohesion of solid waste (csw) = 3 kN m-2, δA = 15°, δp = 30°, cohesion between liner components beneath active wedge (ca) = 2kN m−2, cohesion between liner components beneath passive wedge (cp) = 5 kN m−2, θ = 1.1°, height of side slope (H) = 50 m, top width of waste mass (B) = 100 m, angle of front slope measured from horizontal (α) = 15.9°, and β = 18.4°(Feng et al., 2010; Qian, 2008). The selected gas generation rate and gas permeability coefficient values are ϕa1 = 3 × 10⁻⁵ m3 kg−1d−1, ϕa2 = 2 × 10⁻⁵ m3 kg−1d−1, ka1 = 1.5 × 10⁻⁷ m s−1, and ka2 = 1.5 × 10⁻⁸ m s−1, which are identical to those used in the previous analysis.
Effect of GP on FS
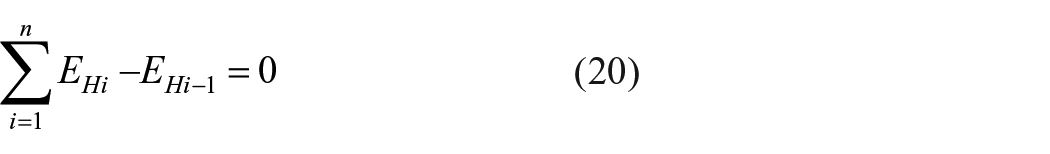
Figure 4 shows the FS values of various cases. FS is 2.10 when the LL and GP are not considered, which has a high safety reserve. FS values are approximately 2.10, 1.99, 1.73, and 1.38 at the LLs of 0, 3, 10, and 20 m, respectively. FS significantly decreases with increasing LL. FS further decreases to approximately 2.02, 1.91, 1.61, and 1.16 when GP is jointly considered at the LLs of 0, 3, 10, and 20 m, respectively. Moreover, the percentage of decrease in Figure 4 is calculated by comparing the FS value of different cases with the value of 2.10 (FS without considering LL and GP). FS is 1.38 when the height of LL reaches 20 m. Comparing with the value of 2.10, the LL reduces FS by approximately 34.3%. FS is 1.16 when GP is jointly considered at 20 m high LL. Comparing with the value of 2.10, the LL and GP reduce FS by approximately 44.5%. Thus, GP reduces FS by approximately 10.2% when the height of LL reaches 20 m.
Factor of safety values of various cases.
Furthermore, FS values are approximately 2.10, 1.98, 1.66, and 1.20 when the GP below the LL is jointly considered at the LLs of 0, 3, 10, and 20 m, respectively. These values differ approximately 0.08, 0.07, 0.05, and 0.04 from FS values when the total GP is jointly considered at the same LL, respectively. The total GP is composed of GP above and below the LL. FS values are 1.16 and 1.20 when the total GP and the GP below the LL are considered in the landfill with a 20 m high LL, respectively. Comparing with the value of 2.10, FS decreases approximately 44.5% by the 20 m high LL and the total GP. FS decreases approximately 42.8% by the LL and GP below the LL. Thus, the reduction value of FS caused by the GP above the LL is approximately 1.7% at 20 m high LL. The effect of GP above the LL on slope stability decreases with increasing LL. This phenomenon is consistent with Figure 1(b). There is a significant increase in GP gradient below the LL when using a two-layered GP model. As a result, the resultants of GPs below the LL acting on the wedges increase with an increase in LL, which exert a greater influence on FS. Therefore, the effect of GP above the LL on slope stability can be neglected under a high LL condition.
Effect of GP on the shift of the critical interface
Double composite liners used in landfills consist of as many as 6–10 individual components. Those interfaces whose resistance against shear stresses may be low could act as critical interfaces (Feng et al., 2010; Qian et al., 2003). There may be two or more critical interfaces in the multilayer liner system. The critical interface may shift from one interface to another with the change of the internal environment in the landfill (Fox and Ross, 2011). Qian (2008) reported that the shift of the critical interface occurred with varying LL. Three typical liner interfaces are selected according to the Chinese criterion for landfills and the interfacial shear strengths are shown in Figure 5 (CJJ 176-2012 (2012)). Interfacial shear strength refers to the resistance capability of the interface between different materials against shear stresses (Qian et al., 2003). The interface adhesion and interface friction angle are the common parameters to describe interfacial shear strength (Fox and Ross, 2011). The values of the interface adhesion and interface friction angle of different interfaces used in this paper are shown in Figure 5. They are respectively substituted into the proposed model in this paper and the model that only considers the LL by Qian (2008) for calculating FS. The results are shown in Figure 5. For the model of Qian (2008), FS values of interfaces Ⅰ, Ⅱ, and Ⅲ under 0 m LL condition are approximately 2.10, 1.87, and 1.91, respectively. The critical interface with the lowest FS is interface Ⅱ. FS values of interfaces Ⅰ, Ⅱ, and Ⅲ under 15 m LL condition is approximately 1.55, 1.40, and 1.39, respectively. The critical interface is interface Ⅲ. The critical interface shifts from interface Ⅱ to interface Ⅲ when the LL is approximately 12.54 m high.
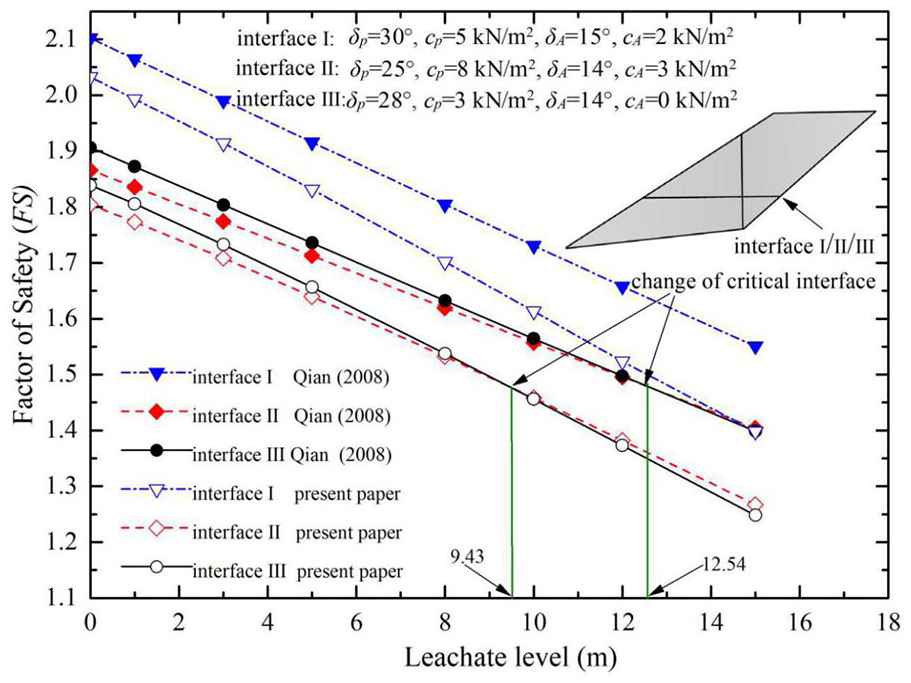
Factor of safety values of different interfaces.
For the model proposed in this paper, the critical interfaces under 0 m and 15 m LL conditions are interface Ⅱ and interface Ⅲ, respectively. These results are identical to those obtained by the model proposed by Qian (2008). However, the critical interface shifts from interface Ⅱ to interface Ⅲ with approximately 9.43 m high LL, which is much less than that obtained by Qian’s model. Therefore, comparing with Qian’s study in Figure 5, it is summarized that the GP within the landfill significantly decreases the value of the FS. The lack of consideration of the GP in landfill stability analysis leads to serious overestimation of the FS, which has a risk for engineering practice. Moreover, the GP within the landfill reduces the LL height of the critical interface shift. It cannot simply determine when the critical interface shifts based on the height of LL. One should be careful in landfill stability analysis to ensure that each interface is able to achieve an acceptable FS under any GP and LL condition that might occur. These are some of the novelty of the study.
A new estimation criterion for FS
Figure 6(a) shows the distribution of pore pressure in the landfill under 10 m LL condition. The maximum pore pressure (i.e., GP) above the leachate level is 15.7 kPa, and the maximum pore pressure (i.e., water pressure + GP) below the LL is 128.4 kPa. FS is 1.73 as obtained by Equation (16). However, it is inconvenient for engineers to calculate FS due to the complexity of testing gas generation rate and gas permeability coefficient in the field. In engineering practice, the pore pressures above and below the LL can be measured by a series of methods. For example, the pore pressures above and below the LL in Wuxi landfill were measured by the piezometer and injection wells (Zhang et al., 2019). Therefore, it is necessary to propose a convenient criterion to estimate FS based on the monitored pore pressures in the field.
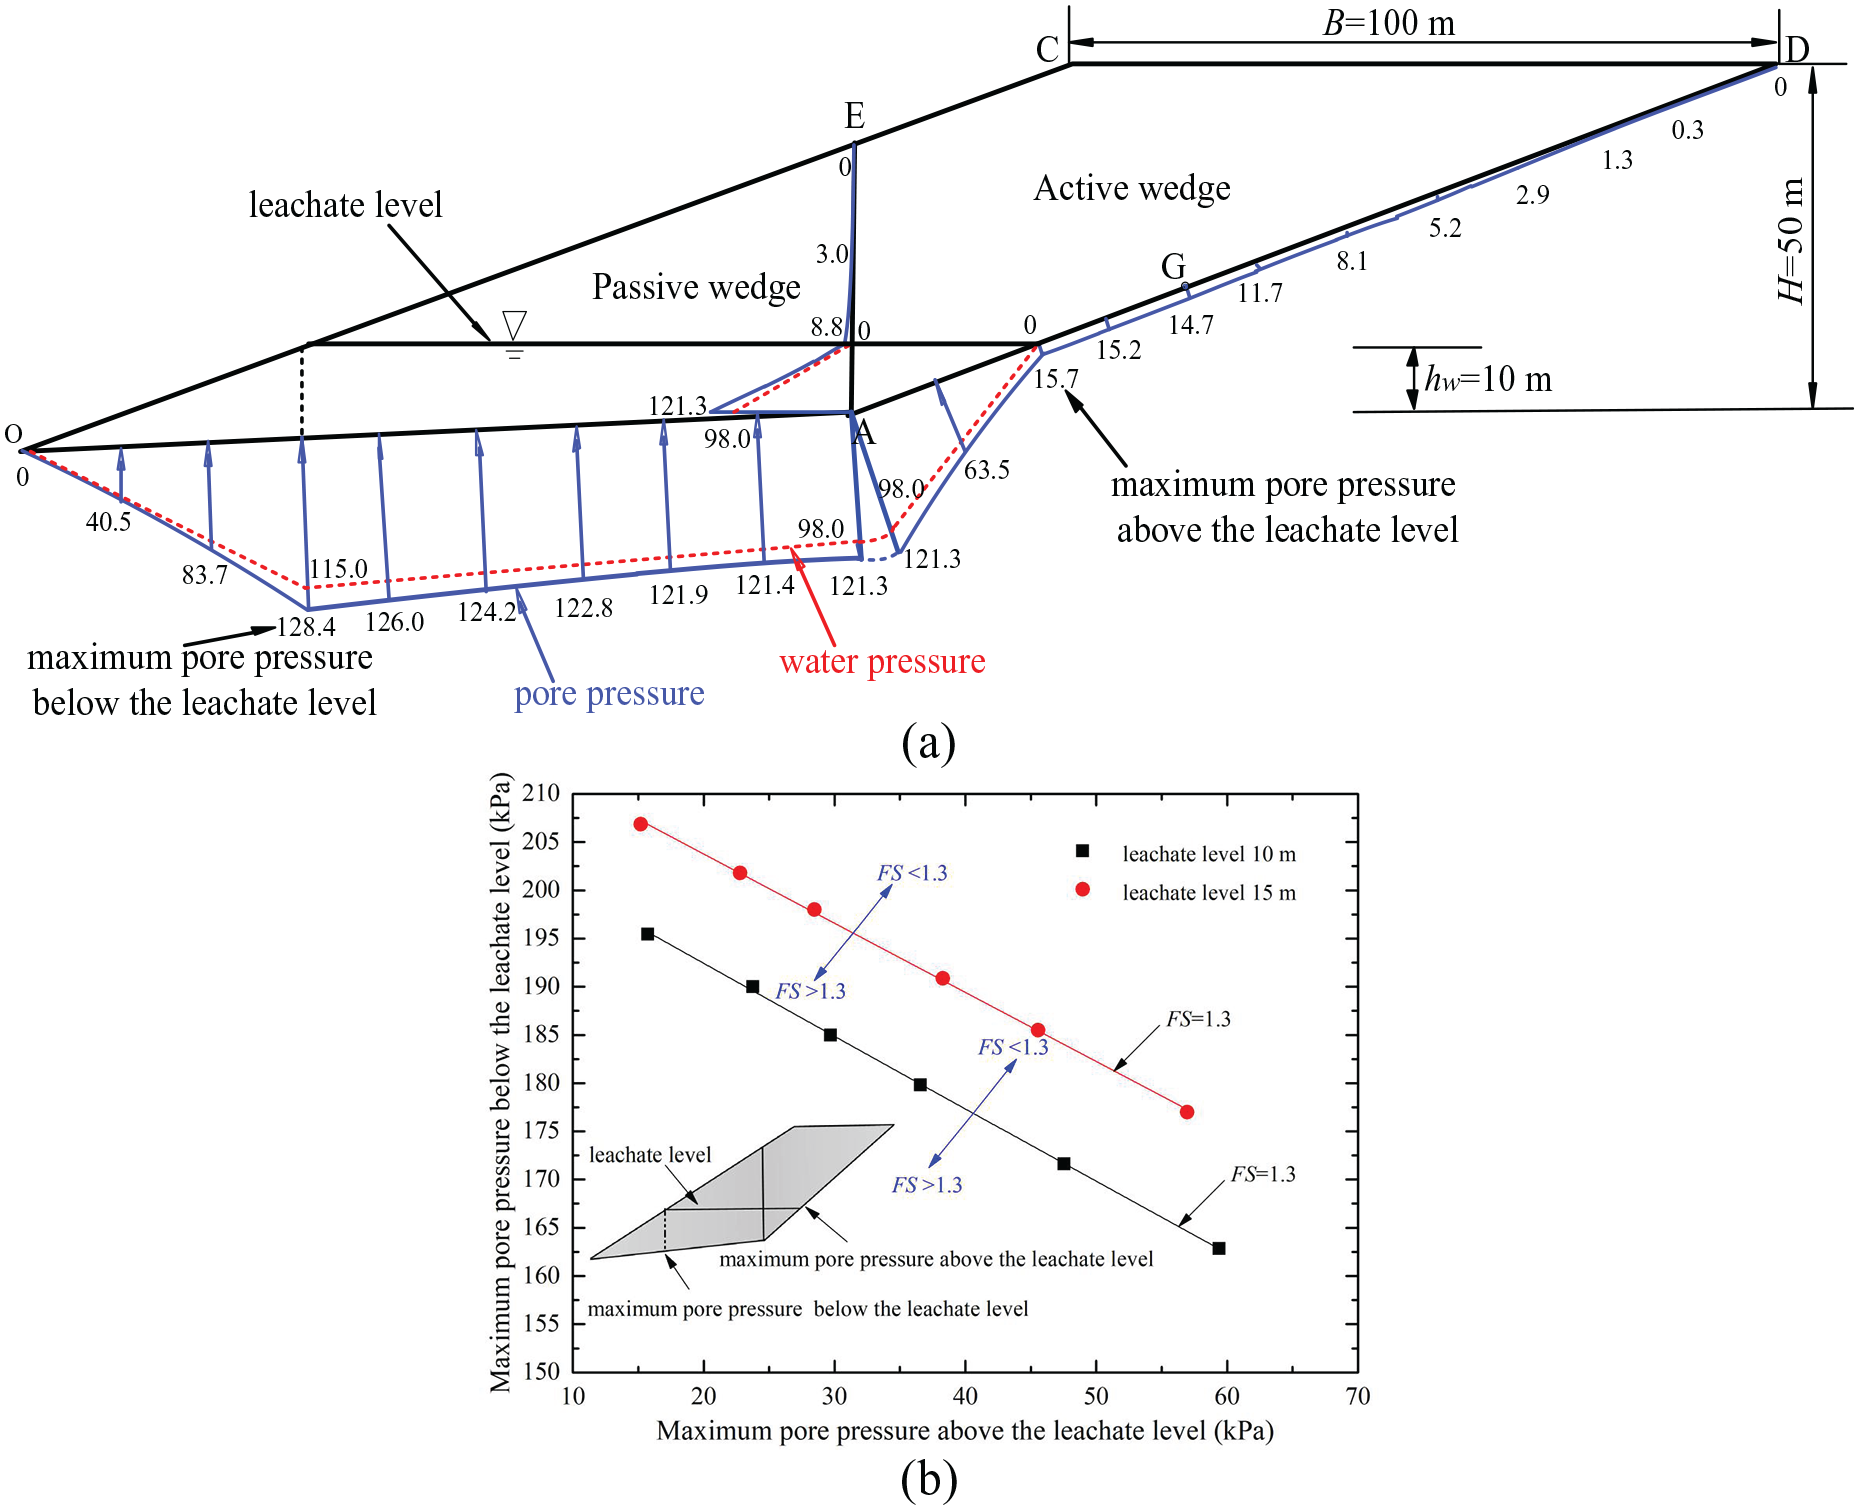
(a) distribution of pore pressure in the landfill; and (b) estimation curves for factor of safety under different leachate levels.
The estimation curves with different combinations of maximum pore pressure above and below the LL that achieve the FS of 1.3 under 10 m and 15 m LL conditions are presented in Figure 6(b). If FS against translational failure of 1.3 is assumed to be acceptable for the safety of the landfill, each pair of maximum pore pressure above and below the LL can be plotted as a point in Figure 6(b). If a plotted point is located below the estimation curve corresponding to the same LL, it means that FS represented by this pair of values will be greater than 1.3. If the plotted point is located above the estimation curve, FS will be lower than 1.3. Similarly, the estimation curve corresponding to any other LL can be developed. This setup is convenient for engineers who test the pore pressures in engineering practice to ensure that the plotted point, which represents the maximum pore pressure above and below the LL, is located on or below the required FS estimation curve in the safety control of landfills.
Engineering application and validation
Xiaping landfill is located in Luohu District of Shenzhen City, southern China. It is a valley-type landfill consisting of a number of filled platforms set back at an embankment. A 20 m high earth dam retains the lowest platform. It is also one of the earliest modern controlled landfills equipped with a composite liner system in China, as shown in Figure 7(a) (Zhan et al., 2015). In early March 2008, a crack formed on the top of the waste body, which indicated the instability of Xiaping landfill. Immediately after this phenomenon, the local government decided to monitor the LL and horizontal displacement so that emergency actions could be performed as necessary. On 6–7 June 2008, heavy rainfall triggered the middle part and lower part of the waste body to slide by 1–4 m. In addition, there was heave in slip area which extended from one-third to two-thirds from the top of the waste body (Zhan et al., 2010).
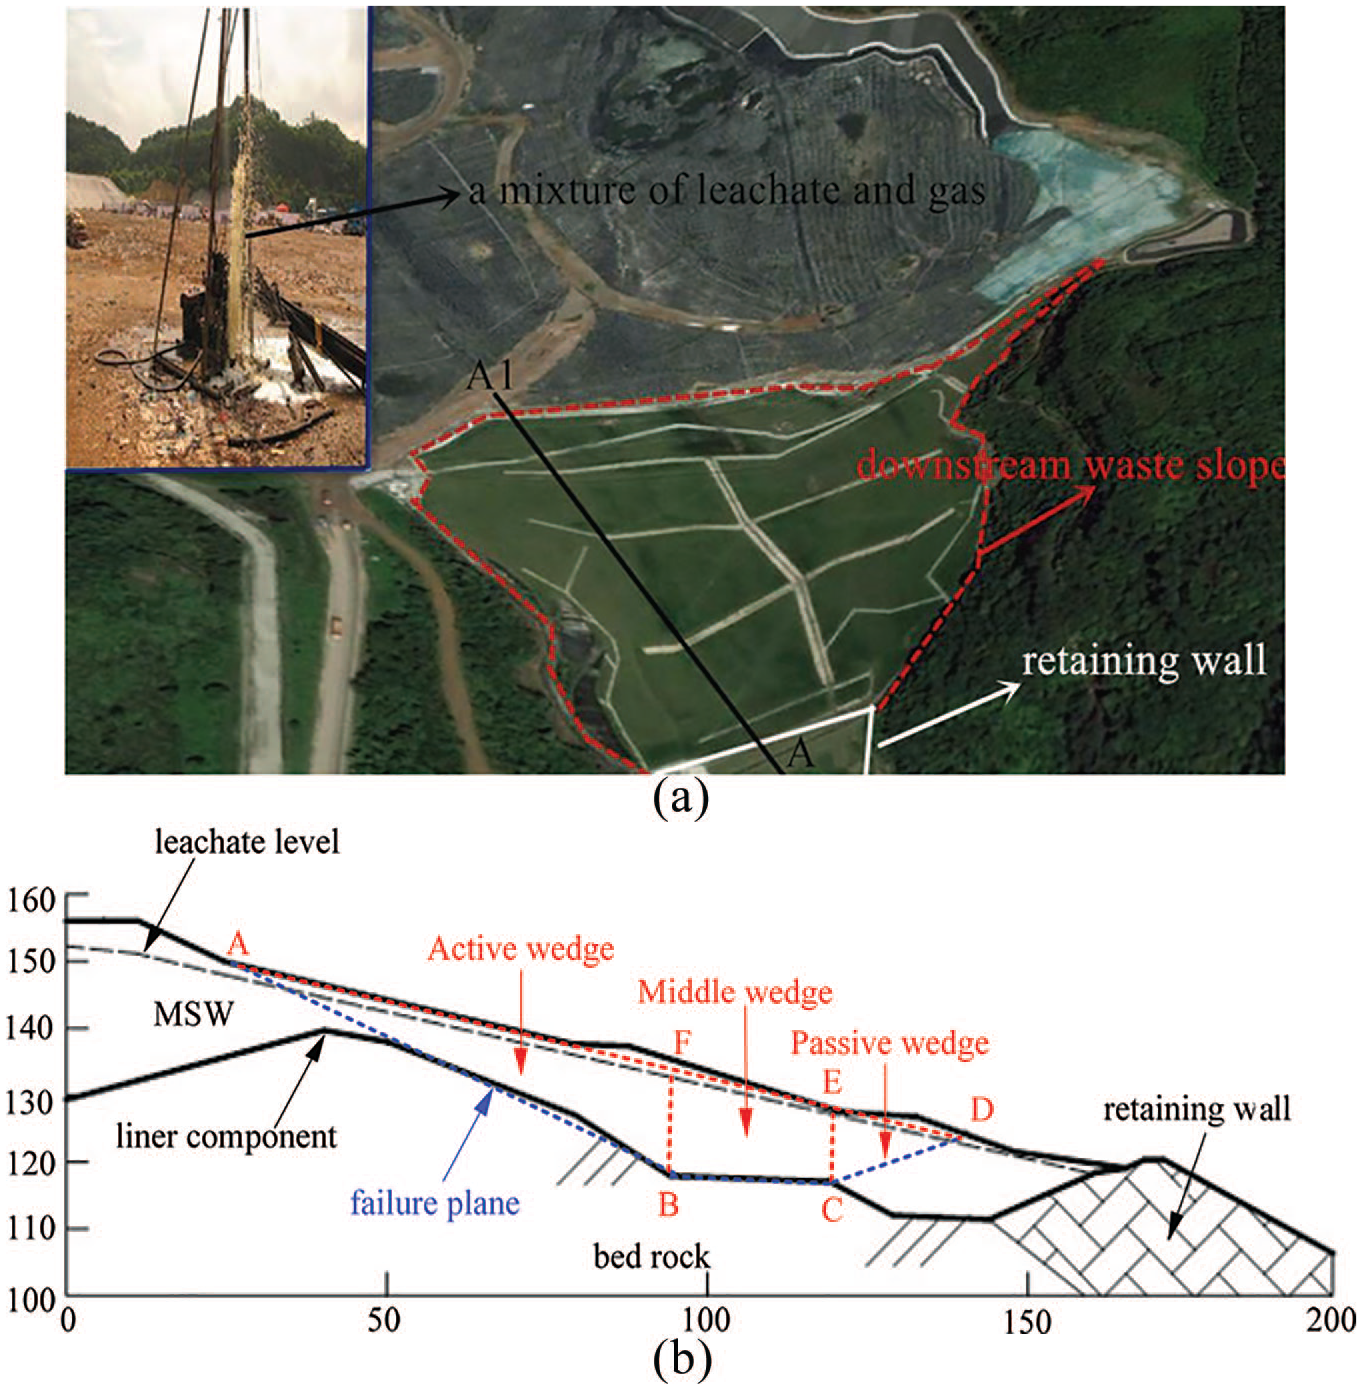
(a) plan view of Xiaping landfill; and (b) profile of section A1-A.
According to the field monitoring results by water level gauges, LL was less than 2 m below the waste slope surface. A comparison of the displacement results of inclinometer gauges suggested that the deformation occurred at the deep composite liner system. It was a typical translational failure mode (Zhan et al., 2010). Thus, section A1-A in Figure 7(a) is chosen as a profile for stability analysis, as shown in Figure 7(b). The profile is divided into three wedges along the vertical direction of two inflection points of line ABC: active wedge; middle wedge; and passive wedge. The LL lines between the monitoring points are connected by straight lines. Three different cases are calculated: case I, without considering LL and GP; case II, considering LL; and case III, considering LL leachate level and GP. The solutions of case I and case II are shown in Wu (2008). The solution of case III is shown in the “Stability analysis of two-part wedge” subsection. It should be noted that only GP below the LL is considered due to the high LL.
The controlling parameters are given as follows: the parameters of waste are raw = 15 kN m−3, rsat = 16 kN m−3, ϕsw = 28°, and csw = 5 kN m−2. The original samples are obtained from the site by the borehole sampling. Then, the density test and triaxial test of the original samples are conducted in the laboratory according to the Chinese criterion (GB/T 50123-1999 (1999)). The composite liner system beneath this landfill consists of multiple layer material interfaces. Among those interfaces, the interface between high-density polyethylene geomembrane and geotextile is the weakest interface, which shows significant softening characteristics in the direct shear tests. The strength parameters are approximately δp = 27°, cp= 0 kN m−2, δA= 13.5°, and cA = 3.5 kN m−2 (Zhan et al., 2010, 2015). The semiempirical equation of gas generation rate f = 18.315e−0.099t m3 t−1a−1 is established for Xiaping landfill by Huang (2004) based on the field LFG extraction test, in which 2000 is as the first year. Thus, the gas production rate in 2008 is approximately 2.06 × 10⁻⁵ m3 kg−1d−1. Regrettably, the gas permeability coefficient is not tested in this landfill. The value of 1.5 × 10⁻⁸ m s−1 in previous analysis is adopted.
The FS is 2.08 without considering LL and GP, which has a high safety reserve. FS drops to 1.09 when considering LL, which is less than FSmin = 1.30 required by the Chinese criterion and poses a threat to slope stability. However, even when LL nears the waste slope surface, FS remains above 1.00. This result shows that a high LL in the landfill poses a threat to slope stability, but it does not necessarily cause the failure of the landfill. After considering GP, pore pressure acting on the wedges further increases, so the landfill stability further decreases. FS is 0.97 considering LL and GP, which has dropped another 11% compared to the FS value obtained if only the LL condition is considered. FS is lower than 1.00. It is consistent with the occurrence of slope failure in Xiaping landfill. Therefore, the proposed wedge stability analysis method in this paper is closer to actual engineering observations.
Furthermore, unlike traditional geotechnical problems (Luan et al. 2020; Shi et al., 2019, 2020), a mixture of leachate and gas is ejected to a height of up to 5 m in Xiaping landfill when a vertical well is drilled, as shown in Figure 7(a). This observation confirms that there is high GP below the LL. The depth of the maximum LL in the slide area is approximately 40–50 m (Zhan et al., 2010). Thus, the ratio of the actual pore pressure to hydrostatic pressure is 1.1–1.125. According to the methods of calculating pore pressures acting on the wedges as proposed in the “Calculation of pore pressures” sub, the ratio of total pore pressure to hydrostatic pore pressure acting on the failure plane is 1.12. This calculation result is within the above range, which verifies the proposed model.
Conclusions
This paper presents a modified wedge stability analysis method dependent on GP. Unlike previous conventional methods, the new method is capable of incorporating the effects of both the GP and LL on the translational failure of the landfill. The conclusions drawn from this study are as follows:
(1) The GP within the landfill significantly affects the value of the FS. Simply ignoring the GP leads to serious overestimation of the FS.
(2) The GP within the landfill reduces the LL height of the critical interface shift. It cannot simply determine when the critical interface shifts based on the height of LL. GP accelerates the critical interface of a multilayer liner system shifting from one to another.
(3) A new estimation criterion for FS is proposed. Through the different combinations of maximum pore pressure above and below the LL, the estimation curve for FS can be obtained. By comparing the field-tested pore pressure and the corresponding estimation curve, the stability of the landfill can be estimated.
Footnotes
Declaration of conflicting interests
The authors declared no potential conflicts of interest with respect to the research, authorship, and/or publication of this article.
Funding
The authors disclosed receipt of the following financial support for the research, authorship, and/or publication of this article: This study is supported by the National Natural Science Foundation of China (Grant Numbers: 41530637 and 41877222).