
Abstract
Waste solar photovoltaic (PV) panels are considered as one of the fastest-growing future waste streams under the category of large electronic waste (e-waste). The lifespan of solar panels varies from 20 to 30 years, and an appropriate reverse logistics network design is essential to manage the waste stream efficiently once their lifetime expires. Mixed-integer programming-based RL model is proposed in this paper for New South Wales, Australia that minimizes the overall cost by identifying optimal locations and sizing of the collection points while determining optimal capacities for recycling facilities. Using the historical data (2001–2017) on the installed capacity of solar panels in the state, the potential waste generation (at council-level) is estimated and optimized solutions are proposed for the year 2047. The results of the study show that the highest waste solar PV will be generated at Murrumbidgee, Berrigan, Balranald, and Bogan councils. Out of 129 councils in the state, the model identifies 78 optimized-locations of the collection points that would be required in the councils. In the councils of Newcastle, Narrandera and Wagga Wagga, three major recycling facilities would need to be established. This is the first systematic attempt in designing an optimized RL network in Australia focusing on waste solar PV. Policy-makers will find this research highly valuable in decision-making on local recycling infrastructure development.
Keywords
Introduction
The solar photovoltaic (PV) panels are considered as one of the widely implemented solar energy harnessing technologies, all over the world (Ahmed et al., 2014; Islam et al., 2014). Globally, the installed capacity of the panels was 310 gigawatts (GW) in 2016 (Moreno-Garcia et al., 2016) which is estimated to be around 700 GW in the year 2020, reaching 4500 GW in 2050 (Mahmoudi et al., 2019b). On the other hand, after the useful service life of 20–30 years of the panels, a huge amount of electronic waste (e-waste) will be generated from the stream. According to the International Renewable Energy Agency (IRENA), the amount of waste from the panels will reach approximately 1.7–8 million tons by the end of 2030, which is predicted to reach 50–60 million tons by 2050 (International Renewable Energy Agency, 2016). The United Nations University reported that by 2050, total e-waste generation will be around 111 million tons (United Nations University, 2019), and from that perspective, waste solar PV panels will share over 50% of the total e-waste generation in the year. Under the various categories of e-waste, solar PV panel is one of the most critical waste streams, as it contains valuable rare-earth elements, such as selenium, tellurium, gallium, molybdenum, and indium (Xu et al., 2018). The European Union (EU) revised the waste electrical and electronic equipment (WEEE) Directive 2012/19/EU providing a legal framework for managing waste solar PV panels under the extended producer responsibility (EPR) scheme (Directive, 2012). From 14 February 2014, member states of the EU are obliged to take responsibility for collection, transport and treatment (recycling) of waste solar PV panels in their respective country (Solarwaste, 2013).
Due to vast solar energy resources, Australia is aggressively exploiting the technology and installed capacity has been increased sharply over the years (Yu and Halog, 2015). As of 2018, the total number of installed solar panels reached 1.95 million units across Australia. Among the states, New South Wales (NSW) and Australian Capital Territory, as well as Queensland will have the largest share of PV panel installations (Salim et al., 2019). On the other hand, this large-scale deployment will eventually result in an enormous amount of waste solar PV panels in the country. According to the recent study by Mahmoudi et al. (2019b) on forecasting of waste solar PV generation, it is found that, in Australia, the total cumulated amount of the PV waste generation by 2047 will be around 817,941 tons considering the the historical PV panel installation between 2001 and 2018. Currently, there is no regulation for managing waste solar PV panels in Australia, and Islam and Huda (2019c) found the solar PV panels waste as one of the priority e-waste items that should be brought under a scheme such as EPR or a coregulatory arrangement such as the National Computer and Television Recycling Scheme (NTCRS), currently available in Australia.
Previously, e-waste related articles were published in the Australian context mainly on: generation estimation of e-waste by Islam and Huda (2019a, 2020b); general management practices (Islam and Huda, 2020a); evaluation of NTCRS by Dias et al. (2018, 2019), Morris and Metternicht (2016) and Lodhia et al. (2017); social campaigns on waste mobile phone collection (Litchfield et al., 2018); e-waste soil contamination by McGrath et al. (2018) and Kiddee et al. (2014); metal value quantification from e-waste by Golev and Corder (2017) and Golev et al. (2016); product flow analysis on waste mobile phones (Golev et al., 2016); in-use stock estimation of electrical and electronic equipment (Zhu et al., 2017); and the role of local government in e-waste management by Davis and Herat (2010). Studies that focused on waste solar PV in the country’s context were by Mahmoudi et al. (2019b) who forecasted the amount of waste solar PV generation, and the study of Salim et al. (2019) investigating the drivers, barriers, and enablers to end-of-life (EoL) management of solar PV, and the comprehensive evaluation of environmental impacts and economic feasibility assessment of the treatment of the discarded PV panel by Mahmoudi et al. (2020).
In order to manage the waste stream efficiently (starting from the collection of the waste and transfer it to the recycling facilities), a relatively complex task needs to accomplished from the perspective of reverse logistics (RL). According to Stock (1992) RL is defined as “. . . the term often used for the role of logistics in recycling, waste disposal and management of hazardous materials; a broader perspective includes all issues relating to logistics activities carried out in source reduction, recycling, substitution, reuse of materials and disposal”. The WEEE waste generation can be distinctly divided into three major categories including households, government and institutions, and businesses (Li et al., 2006). The collection method of E-waste generated by each category from the point which it is discarded will be substantially varied in terms of collection points which were well discussed in the recent review paper by Islam and Huda (2018b). The complex process of RL begins with the disposal of the discarded product and for WEEE, in particular, it is involved in various factors along with considerable uncertainty including but not limited to the E-waste’s quality, quantity and time (Chen and He, 2010).
Hence, the network design is one of the critical issues in RL studies (Govindan et al., 2015), and several studies on WEEE have been performed considering location and capacity planning of collection and recycling centres (RCs) (Coelho and Mateus, 2017; Dat et al., 2012; Demirel et al., 2016; Franke et al., 2006; John et al., 2018; Kilic et al., 2015; Lu and Bostel, 2007; Queiruga et al., 2008; Wang and Mishima, 2019). In terms of the location–allocation problem Shokouhyar and Aalirezaei (2017) applied multiobjective genetic algorithms for the WEEE RL network in Iran to determine the suitable locations of collection centres (CCs) and recycling plants supporting the decision-makers on the trade-off among social, environmental and economic impacts. In relation to mixed-integer programing (MIP), Achillas et al. (2010) implemented MIP for Greece as a case study to optimize the collection points and recycling facilities in the WEEE RL network. Also, Shahbazbegian et al. (2020) applied MIP for the bi-objective model to design and optimize a thin-film PV power plant supply chain network integrating RL leading to a significant reduction on the costs of supply chain network design. There is considerable MIP literature on the renewable energy supply chain network design such as Babazadeh et al. (2017), Dehghani et al. (2018), He-Lambert et al. (2018), Jabbarzadeh et al. (2018), and Sinha et al. (2019). Hence, MIP works perfectly for RL logistics network design of EoL PV panels as a multi-conditions and criteria problem.
Islam and Huda (2018b) mentioned that in the e-waste management sector, research performed on RL network design focusing on waste solar panel is very limited, and thus a potential area of research. Under the broad e-waste product-focused studies, waste solar PV was found to have relatively less attention from the researchers (Islam and Huda, 2018a, 2019b). This was further confirmed by a recent review article published by Mahmoudi et al. (2019a) on waste solar PV panels, who found that globally, only four papers were published on the waste solar panel-related network design. Choi and Fthenakis (2010) proposed mathematic modelling of the economic feasibility and the environmental viability of solar PV waste in Germany. Another study by Choi and Fthenakis (2014) assessed the profitability of recycling technologies by allocating the optimal location of PV take-back centres in Germany. Kim and Jeong (2016) proposed a mixed integer-linear programming model for the minimization of the total cost of PV manufacturers considering a generic system. Hsueh and Lin (2015) identified alternatives for the sorting process associated with collecting, sorting, and reprocessing of an RL network.
In this connection, it is to be mentioned that the only two articles that were published on RL issues from the Australian context were by Rahman and Subramanian (2012) and Hanafi et al. (2008). The first article was dedicated to identifying critical factors for EoL waste computers recycling operations, and the second one was on finding an effective collection strategy for e-waste in general. Overall, none of the existing articles has collectively addressed the RL network design focusing on waste solar PV panels in Australia, and in the broader context of the RL literature, the current study fills the gap in RL network design concentrating on waste solar PV panels. Based on the RL studies and availability of the data, a two-stage, location–allocation model optimizing the locations and capacity of the collection and recycling facilities is formulated for Australia.
The objectives of the study are to:
(1) estimate the amount of waste solar PV generation at the councils at NSW, Australia;
(2) find the optimized locations and capacity of the collection points and recycling facilities in the councils based on an MIP model; and
(3) estimate the total cost of an RL network including transportation cost, collection point establishment and handling cost, and recycling cost.
This is the first systematic study that provides information on optimized locations and capacity estimation of the collection points and recycling facilities. The study will help policy-makers at local government councils in NSW for long-term infrastructural planning focusing on waste solar PV panels, one of the emerging e-waste streams in the country.
Material and method
This study first estimates the spatial distribution of waste solar PV in the state of NSW through a council-level estimation, and then conducts an RL network design (location–allocation) study to optimize the locations of the CCs and RC locations based on the spatial information of waste solar PV in the state of NSW.
Estimation of waste solar PV generation in local government council areas in NSW
In order to estimate the future amount of waste solar PV generation, data on the current installed capacity of solar panels were considered using the data source of the Australian Photovotaic Institute (APVI) (Australian Photovotaic Institute, 2020). In general, to estimate the generation of a future amount of waste solar PV panels, a fixed loss-based forecasting model is widely applied by several researchers (Domínguez and Geyer, 2017; Paiano, 2015) and the Australian Renewable Energy Agency (2017). The model assumes that a solar panel installed at a specific time will reach its EoL after a certain duration time named as lifespan and will be available for recycling. The scheme considers the average lifespan of a solar panel being 30 years, and afterwards, it will be obsolete (Domínguez and Geyer, 2017). Equation (1) is used in order to estimate the annual total mass of waste PV panels:

where,


Using Equation (1), Mahmoudi et al. (2019b) previously estimated the amount of waste solar PV panels for Australia and found that using the data on the installed capacity of solar panels from 2001 to 2017, in the year 2047, the cumulative amount of waste solar PV panel generation in the state of NSW will be 211,740 tons (24.94% of the total generation in Australia). However, the study did not provide what will be the amount of generation at local council level, which is one of the prerequisites for modelling an RL network.
In order to assess the amount of waste solar PV panels at individual councils, the current installed capacity of the panels at the councils was considered. Here, council-level data were utilized which were available on the APVI website (Australian Photovotaic Institute, 2020). The total capacity of all types of solar panel including capacity under 10 kW, capacity 10–100 kW and capacity over 100 kW were then summed up in order to get the total installed capacity at various councils in the state. This provides the data on installed capacity in megawatts (MWs). The data on the installed capacity of the solar panels (in MW) are presented in Online Supplementary Table S1. Afterwards, using the average weight value of different types of solar panels (as per technology type) mentioned by Paiano (2015), the amount of waste solar PV panels is estimated at the stock level. It is found that 1 MW of installed capacity of solar panels refers to 174 tons of solar PV waste (Paiano, 2015). Using this value, the amount of waste solar PV panels is assessed at stock-level assuming that the entire amount of installed capacity will be obsolete. But in order to estimate the amount of waste solar panels that would be generated in the year 2047 (after the average lifespan of 30 years) at each council, total generation amount for the state mentioned by Mahmoudi et al. (2019b) is considered. In this stage, the share (percentage of the total generation at stock-level) of each council is calculated and then the factor is multiplied by the total amount of waste solar PV generation for the whole state (211,740 tons in the year 2047). In this manner, the amount of waste solar PV for the year 2047 is estimated for each council in the state of NSW.
Location planning for CCs and RCs
At present, there are no dedicated collection points and RCs for waste solar PV management in Australia. Based on the amount of future waste generation, it is important to identify the potential locations of the CCs in the councils, the capacity of the CCs, and capacity of the RCs in a location–allocation model for the waste stream. In order to identify the issues at various councils in the state of NSW, an optimization model is developed based on the MIP that minimizes overall waste collection and recycling cost for the region. The total cost of the whole RL network can be categorized into three classes: collection cost; transportation cost; and recycling cost.
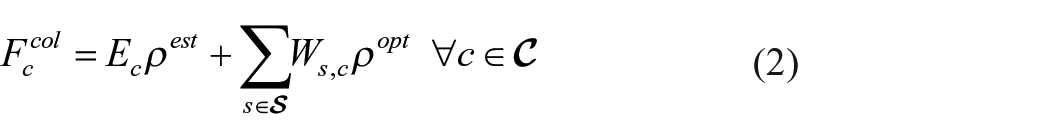
The collection cost includes the establishment cost and handling cost of the waste at the CCs. Therefore, it can be expressed as given by Equation (2):
where,
The recycling cost represents the total cost to recycle wastes at the recycling facilities. Considering a recycling capacity of

where
On the other hand, the transportation cost is associated with the cost of transporting waste solar PV generated at a council location,
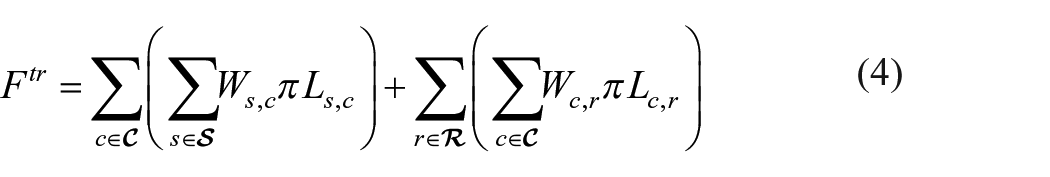
where,
Given the finite capacity of a collection point, several collection points are required to cover all the future waste that will be generated within the state of NSW. Strategically, collection points can be randomly distributed to any council and gather waste solar PV panels all over the state of NSW. Based on the spatial distribution of future waste solar PV, the locations of collection points are optimized by considering two-stage allocation (council to dedicated collection points and then to the recycling facilities). Furthermore, in the model, both the existing location of the collection points and recycling facilities are utilized. However, the optimization model that is proposed identifies both the future capacity of the existing recycling facilities and the collection points along with the locations of the future collection points. Considering the above issues, the optimized RL model can be formulated as an MIP-based optimization problem as given by Equations (5) to (8):

Subject to:
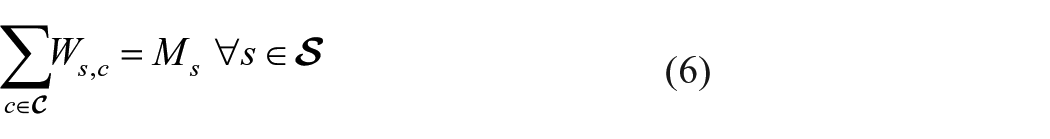


where,
For the location–allocation model, distance parameter L is measured using the formula of the great circle distance between two points (under the geographical coordinate system). Initially, the latitude and longitude of the councils (potential locations of the collection points for the generated waste at the respective council) and the existing recycling facilities were identified using Google Maps. For the councils, a pair of 129 locations were identified, and a distance matrix was developed and given as an input to the model. For transportation cost, the Australian dollar (AU$) 7.32 per km per ton is considered. For the collection points, the handling cost is considered as AU$10/ton, while collection point establishment cost is considered as $81/ton of waste solar PV. On the other hand, $483/ton is considered as the recycling cost (Victoria Department of Environment, 2017). Currently, there are 12 recycling facilities available across the state for recycling other types of e-waste, such as computer, television, and information technology peripherals. The locations of these facilities are considered as future locations of the recycling facilities for waste solar PV. On the other hand, 44 permanent collection points are currently available, which are also considered in the model in order to justify the necessity of establishing new collection points in the councils. The location of the collection points and recycling facilities in the councils are presented in Online Supplementary Table S2. The optimization problem is formulated in General Algebraic Modeling System language and solved within 1 second in a computer with Intel Core i7, 3.4 GHz processor and 16 GB of RAM using BARON solver with both the absolute and relative optimality gaps set at 0. The geographical locations (study area maps) of the waste generation, collection points and recycling facilities are developed using ArcMap 10.5.
Results and discussion
Spatial distribution of waste solar PV generation across the councils in NSW state
Results of the waste solar PV generation in various local councils at the state of NSW show that the highest amount of waste solar PV will be generated in the council of Murrumbidgee (over 12,000 tons), followed by Berrigan (approximately 11,600 tons), Balranald (close to 10,000 tons) and Bogan (over 6000 tons). There is total of 47 councils, in which the generation will be less than 500 tons. The council of Botany Bay and Rockdale showed zero amount of waste generation as there is no significant number of solar PV installed. Among the 28 local government councils in the greater Sydney metropolitan areas, the highest amount of generation will be in the Blacktown council (around 6000 tons), while in the Hunter Hill council the amount of waste solar PV will be just over 100 tons in the year 2047. Figure 1 shows the detailed distribution of the waste solar PV generation at various local government councils in the state of NSW, Australia. The numbers that are assigned in Figure 1 represent the council identification numbers (IDs). The associated names can be found in Online Supplementary Table S1 and Table S2. These number will be used to identify the optimized locations of the collection points and recycling facilities in the specific council.
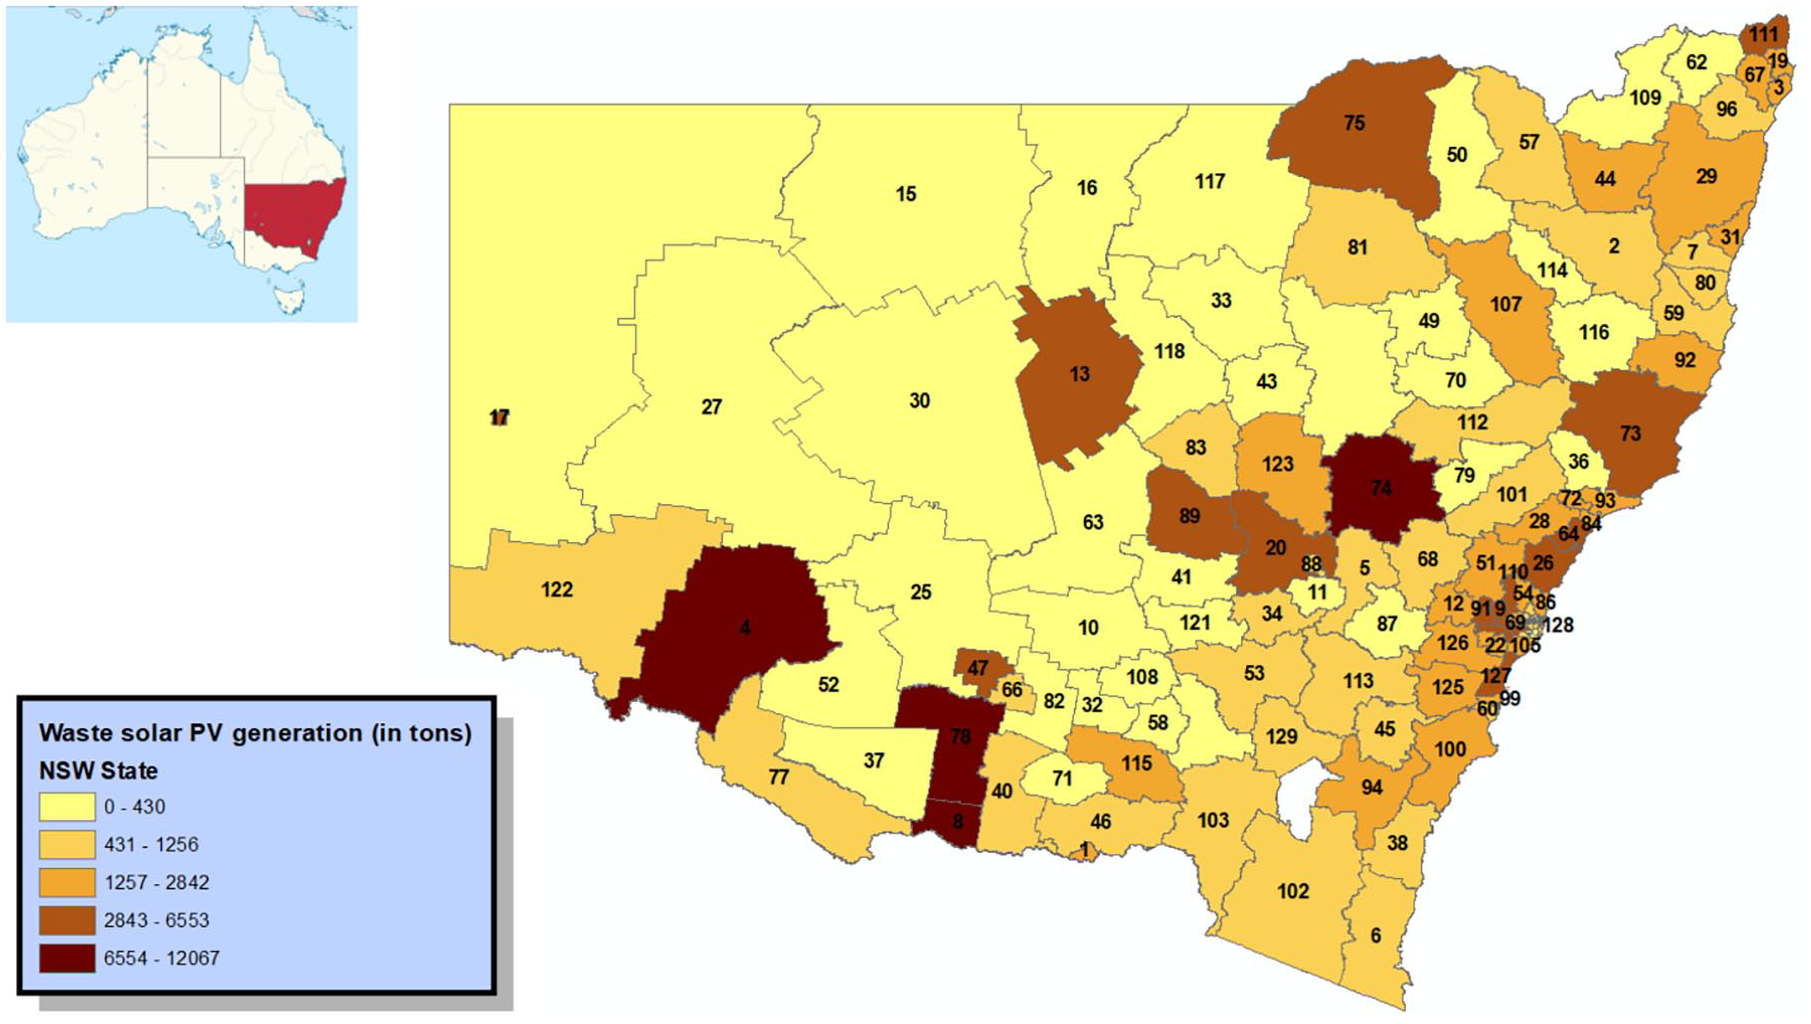
Waste solar photovoltaic (PV) panel generation (in tons) across the local government councils in the state of New South Wales (NSW), Australia in 2047.
Location–allocation RL planning
Results of the optimization model show that out of 129 councils considered as potential locations of the collection points, a total of 78 collection points are required to cover all the waste that will be generated in the state in the year 2047. Out of the 78 optimized collection points, 64 councils would need to establish their own collection points as per their generation. The list of the councils is presented in Online Supplementary Table S3. In addition, in 14 different councils (e.g. Blue mountains, Burwood, Camden, Cumberland, Fairfield, George river, Gilgandra, Narrandera, Newcastle, Ryde, Uralla, Wagga Wagga, Western Plains Regional, and Wollongong councils) the capacity will need increment in order to accommodate adjacent waste generation under optimized conditions. Figure 2 shows the optimized location of the collection points (green boxes) in the councils (Online Supplementary Table S3). The yellow lines show the direction of waste flow from some of the councils to the allocated collection points according to the capacity improvement of the collection points identified by the solution. This means that these councils will not require any collection points to be established. The capacity of the collection points is presented in Online Table S4. The amount that would be required to transport from the councils to the optimized collection points is presented in Online Supplementary Table S5.
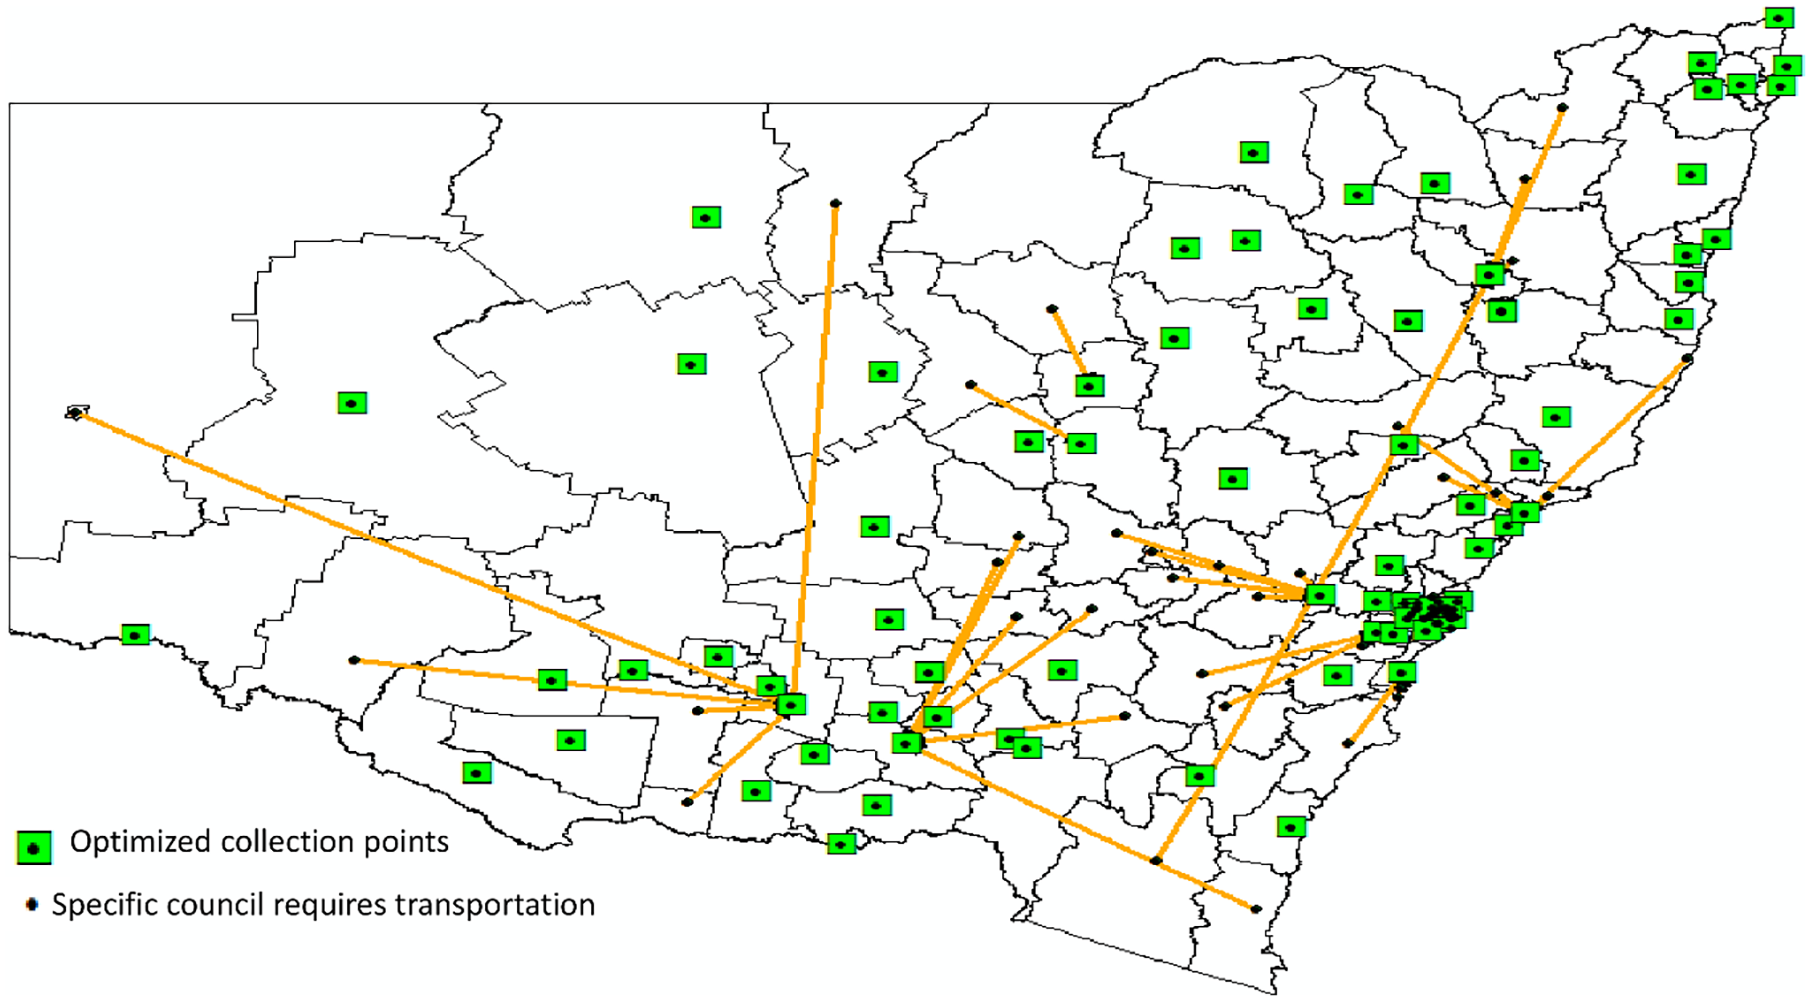
Optimized collection point locations in the state of New South Wales for solar photovoltaic waste.
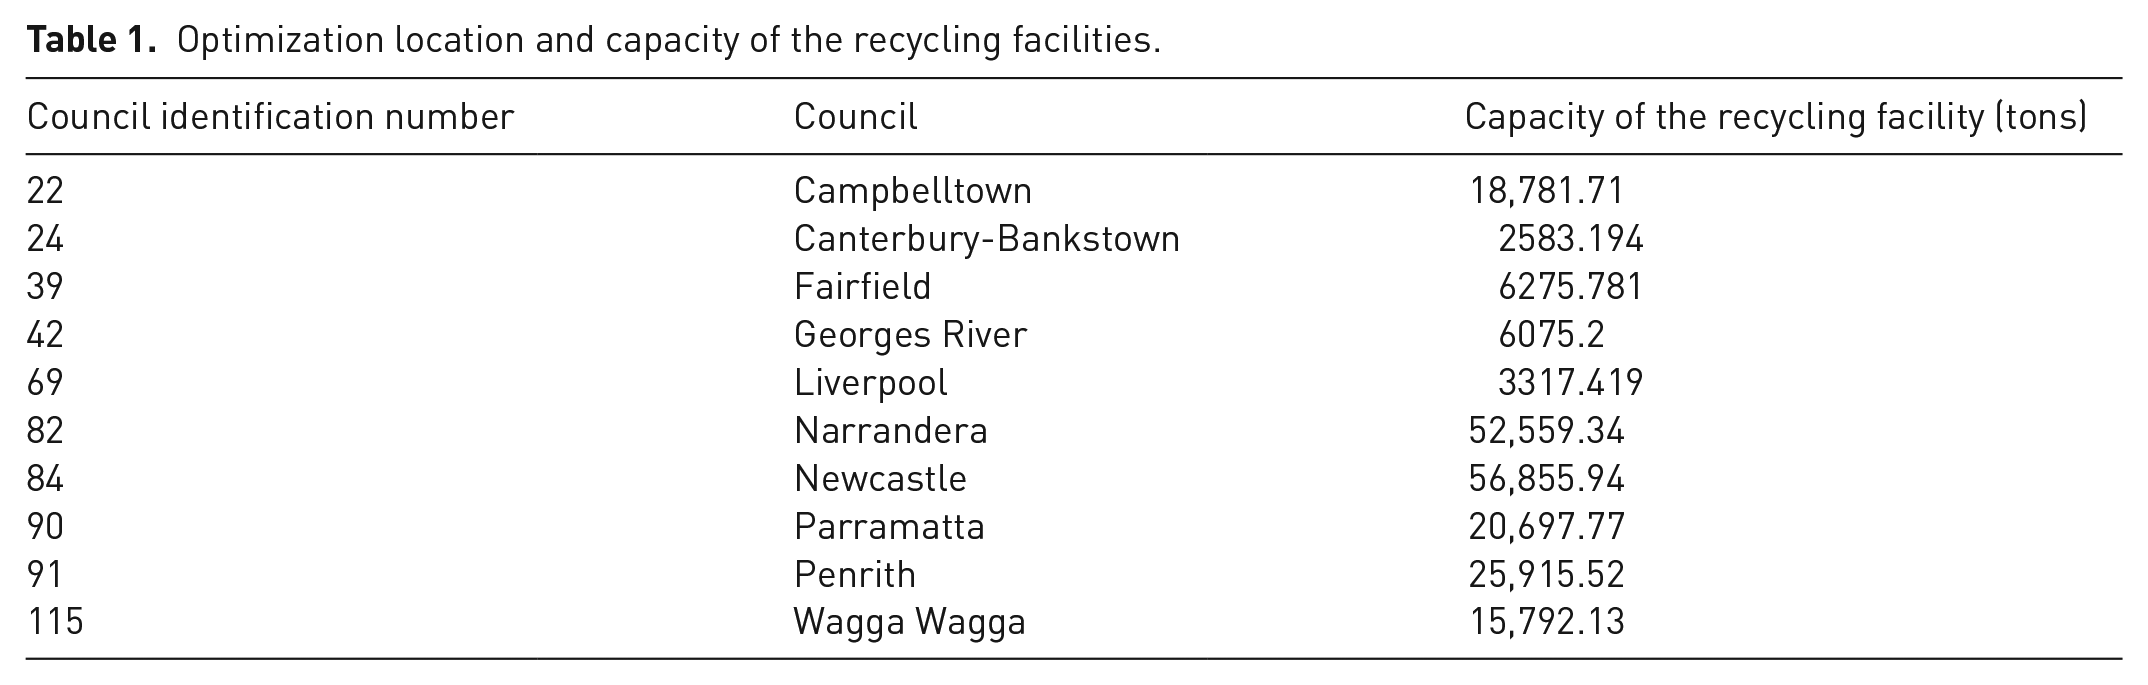
The MIP-based optimization model also shows that out of 12 existing recycling facilities, 10 facilities will be required in order to recycle all the estimated amount of waste solar PV generation. In addition to the identified locations of the councils at which the existing recycling facilities are located, the future capacity of the recycling facilities that will be required, also identified by the model, which is shown in Table 1. Based on the optimization model, it can be said that capacity of the recycling facilities would vary substantially, and plant located at Newcastle will need to have its capacity the highest, while the facility located at the George River Council would require the lowest among the others.
Optimization location and capacity of the recycling facilities.
In addition to the capacity of the recycling facilities, the flow directions from the optimized collection points to the recycling points are identified, which is shown in Figure 3. It is also found that there will be in total 78 flow directions, out of which the recycling facility that would be located at the Newcastle council will be the most important recycling facility connecting 29 different collection points, followed by Narrandera (connecting 29 collection points) and Wagga Wagga (10 collection points). The amount that flows from the collection points to the recycling facilities is presented in Online Supplementary Table S6.
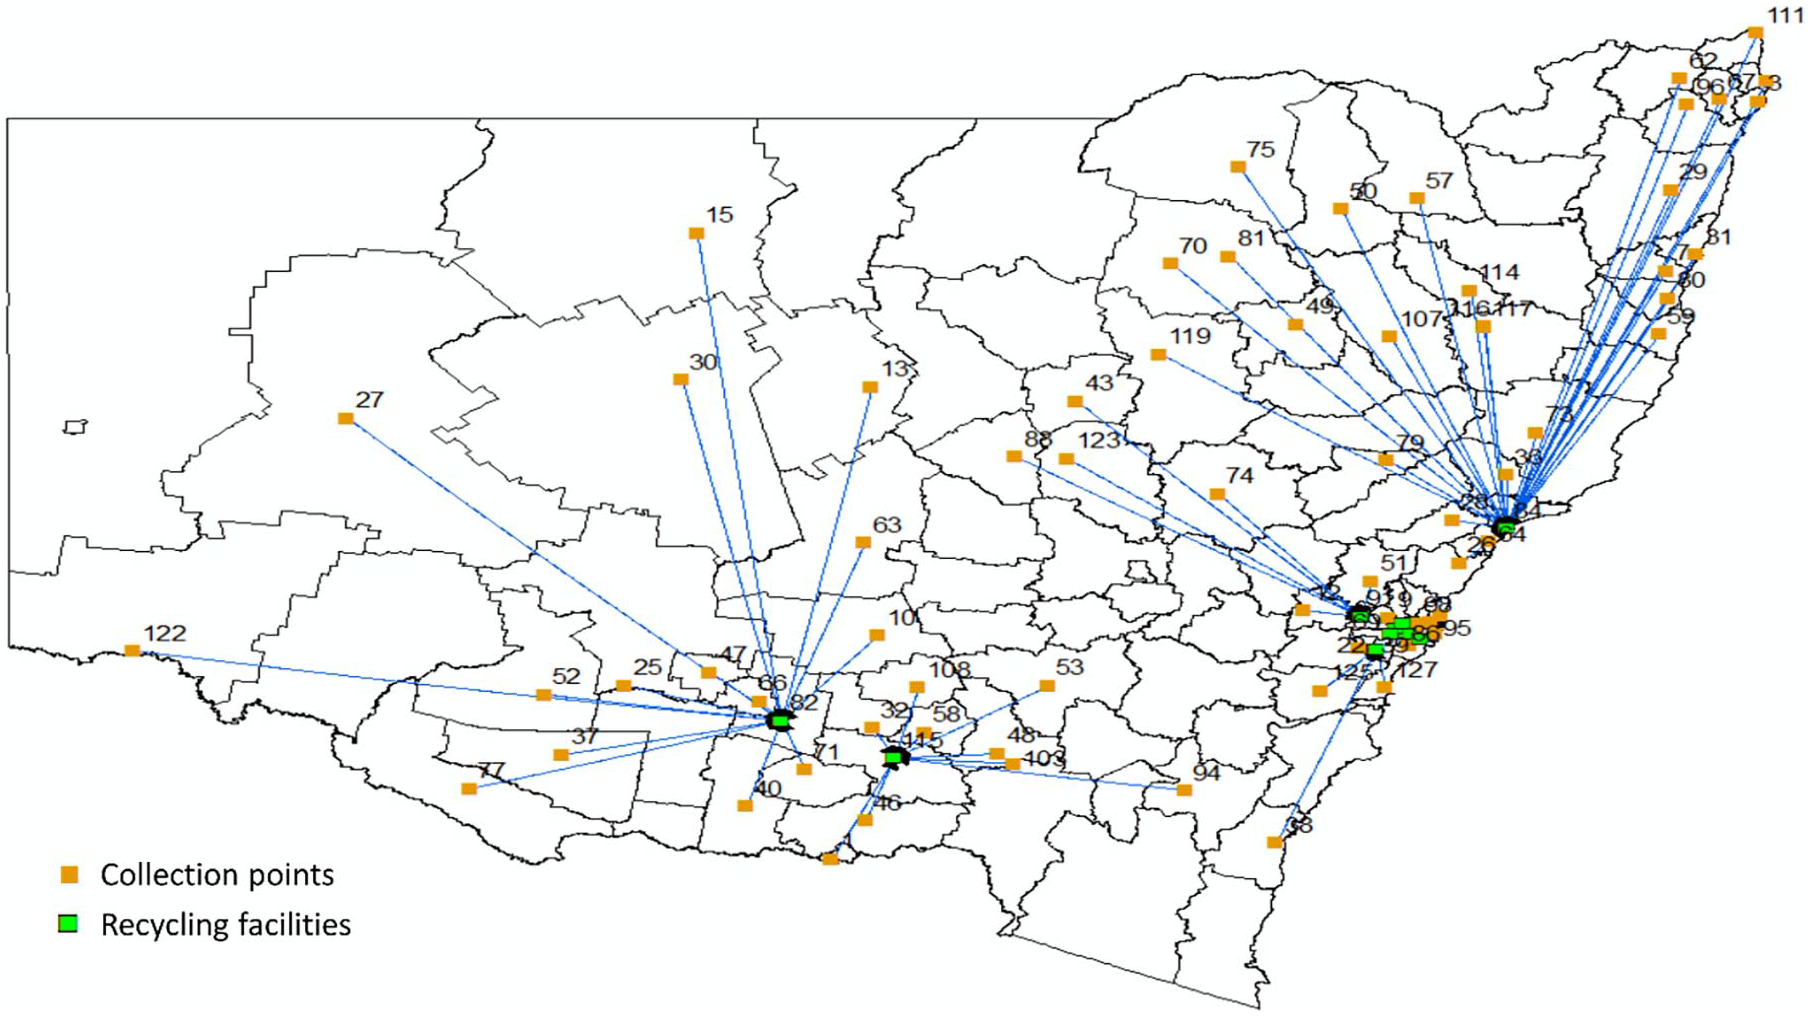
Optimized collection point and recycling facility locations for solar photovoltaic waste in the state of New South Wales.
The overall total cost of the optimized RL network is found as approximately 347 million AU$ including AU$85 million for transporting waste generated at the councils to the optimized collection points and AU$149 million for transporting waste from collection points to recycling facilities. The estimated costs are just covering the cumulative PV waste generated by 2047 based on the PV panels installation between 2001 and 2017. In addition, the cost of collection points (handling and capital cost) and recycling facilities will be around AU$11 million and AU$100, respectively. The transportation cost is the largest associated cost, particularly for the waste transportation related to collection points to recycling facilities. Figure 4 shows all the cost components identified by the solution of the model.
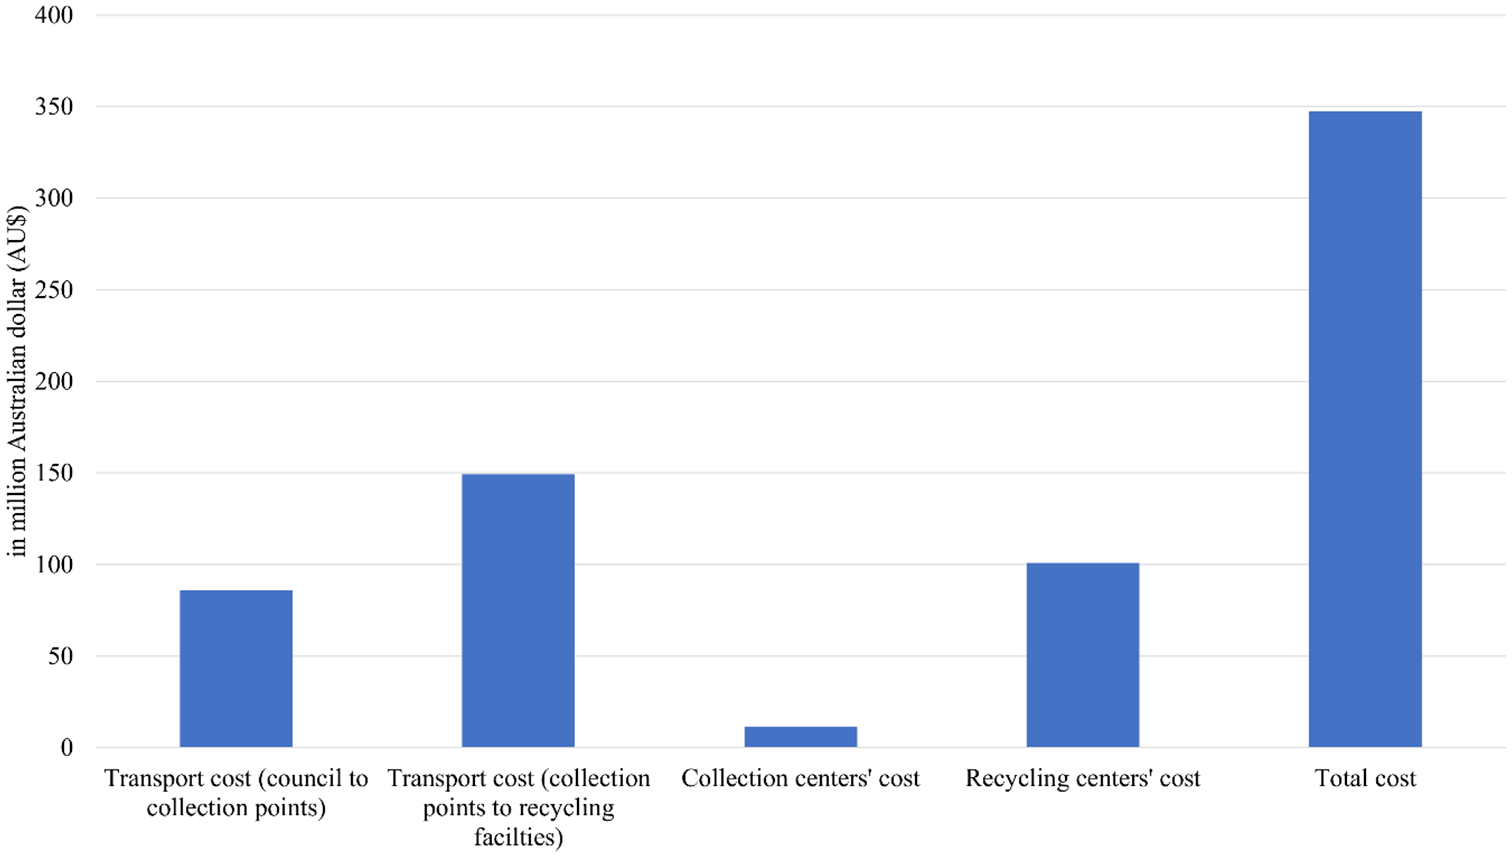
Cost components of the optimized waste solar photovoltaic reverse logistics network.
Discussion and future work
The growth in the quantity of waste solar PV panels in Australia is projected to be sustained for a long time, due to the large-scale deployment of solar PV panels across the country. The generation of the waste is uneven across the states in Australia as well as at various local government councils within a state. In the state of NSW, southwestern part, the Central Coast and greater Sydney metropolitan areas will be the main areas for the generation. The local government councils and the NSW state government should take pragmatic measures promoting waste solar panel recycling infrastructure development and designing a collection system. The councils in other states should also plan to initiate waste solar PV panel recycling targets to handle the massive generation of the waste. This is the first systematic baseline study that highlights the issue of waste solar PV generation and its RL network design at council-level, which will be particularly useful for the policy-makers in decision-making on collection and recycling network planning.
To collect the waste efficiently from the councils and transporting it to the dedicated collection points and recycling facilities, cooperation among the councils is highly important. The councils that are identified as the main contributors in the waste solar PV generation, should make long-term investment planning. Furthermore, as per the results of the MIP model, 14 councils will need to increase the capacity of the collection points in order to handle waste from some other councils. This would require additional financial planning. Some councils will need to plan for transportation as the waste will be transferred to other collection points (shown in Online Supplementary Table S5). The results of the model also showed that transportation will be the largest cost-sharing component in the total cost. This was previously found by Sinha et al. (2010). Third-party RL service provider selection and an operational framework including types of vehicle, fuel used for the vehicle and vehicle routing should be considered in the planning. In the present study, it is also found that Newcastle, Narrandera and Wagga Wagga will be the main recycling facilities under the existing condition in terms of inbound waste flow. The councils should prepare for additional administrative and operational tasks recycling the waste coming from the various council locations in NSW.
There are a few limitations of the present work. The quantity of the estimation could be better if more lifespan related data on solar panels, which are becoming obsolete and their year and types of installation are known. The Weibull distribution-based model could be particularly useful for forecasting future generation estimation (Islam and Huda, 2019b). The quantity of the estimation would create interest among the local recyclers and RL service providers. Considering the lack of recycling treatment infrastructure for the waste stream in Australia (Dias et al., 2018), now is the appropriate time to take such initiatives to handle the overwhelming flow of waste solar PV in the coming years.
In addition, the existing recycling facilities (located in the designated councils) are considered rather than locating new recycling facilities elsewhere in the state. In this case, the focus is to identify the most suitable facilities among the existing ones, and what should be the capacity of the existing recycling facilities. Future research should carry out investigating new locations of the recycling facilities in councils. In that case, identified councils, where the waste generation concentration is high could be taken as the reference points.
The cost of recycling considered in the study includes the dismantling process and metal extraction which is around AU$483/ton. This cost is currently required for other types of e-waste (Dias et al., 2019). Alternative costs could also be considered by modelling total cost, and in this case the probable variation could be AU$660/ton (manual processing), AU$550/ton (mechanical processing) or AU$71/ton (metal recycling) (Victoria Department of Environment, 2017). As this waste stream is relatively new in Australia, the associated cost for large-scale processing infrastructure requires further consultation with the stakeholders in the sector. Due to the bulky nature of the waste, in future RL network design, transfer stations and storage facilities could be included to see the variability of the total cost.
Conclusion
This study revealed the spatial distribution of waste solar PV generation based on the historical PV deployment between 2001 and 2017 and optimized locations and capacity of the collection points and recycling facilities in the state of NSW, Australia. Based on the current installed capacity of the solar PV panels, it is indicated that among the 129 councils, the council of Murrumbidgee (over 12,000 tons), Berrigan (nearly 11,600 tons), Balranald (about 10,000 tons) and Bogan (over 6000 tons) will be the top four waste solar PV generating councils in the state by the year 2047. The location of the collection points and their capacity and recycling facilities were explored across the councils in the state through the location–allocation planning.. Accordingly, the highest capacities of the recycling facility and corresponding council IDs are related to Newcastle (Council ID 84) with about 57,000 tons followed by Narrandera (council ID 82) with nearly 52,500 tons. In contrast, the lowest capacity is for Canterbury-Bankstown ( Council ID 24) with only 2500 tons. Furthermore, it is estimated that the total cost of RL network (transportation, establishment cost of collection points and recycling cost) will be approximately AU$347 million, which necessitates substantial attention of the policy-makers in developing a holistic pathway to actively involve all parties leading to sustainable management and circular economy of the PV waste stream. Finally, these findings add to a growing body of e-waste management literature, in particular on the RL of the EoL PV panels in Australia.
Supplemental Material
Supplementary_file – Supplemental material for Reverse logistics network design for waste solar photovoltaic panels: A case study of New South Wales councils in Australia
Supplemental material, Supplementary_file for Reverse logistics network design for waste solar photovoltaic panels: A case study of New South Wales councils in Australia by Md Tasbirul Islam, Mohammad Sohrab Hasan Nizami, Sajjad Mahmoudi and Nazmul Huda in Waste Management & Research
Footnotes
Appendix
Nomenclature of the MIP model is presented below:
Declaration of conflicting interests
The authors declared no potential conflicts of interest with respect to the research, authorship, and/or publication of this article.
Funding
The authors disclosed receipt of the following financial support for the research, authorship and/or publication of this article: The first author acknowledges financial support from Macquarie University under the scholarship scheme “International Macquarie University Research Training Program (iMQRTP)” for conducting this research.
Supplemental material
Supplemental material for this article is available online.
References
Supplementary Material
Please find the following supplemental material available below.
For Open Access articles published under a Creative Commons License, all supplemental material carries the same license as the article it is associated with.
For non-Open Access articles published, all supplemental material carries a non-exclusive license, and permission requests for re-use of supplemental material or any part of supplemental material shall be sent directly to the copyright owner as specified in the copyright notice associated with the article.