
Abstract
The key to upgrade the efficiency of aerobic remediation of landfills is to determine the distribution characteristics of oxygen concentration during aerobic ventilation. This study discusses the distribution law of oxygen concentration with time and radial distance based on a single-well aeration test at an old landfill site. The transient analytical solution of the radial oxygen concentration distribution was deduced using the gas continuity equation and approximation of calculus and logarithmic functions. Oxygen concentration data from the field monitoring were compared with the results predicted by the analytical solution. The results indicated that the oxygen concentration initially increased and then decreased with prolonged aeration time. With an increase in radial distance, the oxygen concentration rapidly declined, followed by a gradual decrease. The influence radius of the aeration well increased slightly when the aeration pressure increased from 2 to 20 kPa. The field test data agreed with the analytical solution prediction results, preliminarily verifying the reliability of the oxygen concentration prediction model. Results from this study provide a basis of guidelines for the design, operation and maintenance management of a landfill aerobic restoration project.
Introduction
In situ aeration in municipal solid waste landfills has become increasingly prominent, with many projects being successfully carried out worldwide in the past decade. Aerobic ventilation technology significantly accelerates landfill degradation to achieve stabilization (Ritzkowski and Stegmann, 2012). Optimal oxygen concentration levels are vital for the continuous aerobic reaction of landfills (Borglin et al., 2004; Brandstatter et al., 2020; Cossu and Cestaro, 2005; Hrad and Huber-Humer, 2017; Hrad et al., 2013; Ma et al., 2021; Morello et al., 2017; Slezak et al., 2015). Therefore, it is crucial to determine the radial distribution characteristics of oxygen concentration in landfills during aerobic ventilation for the smooth operation and management of aerobic ventilation projects.
Researchers, including Lee et al. (2002), Cossu and Cestaro (2005), Öncü et al. (2012), Ritzkowski and Stegmann (2013), Raga et al. (2015) and Liu et al. (2018b), have conducted field monitoring experiments on oxygen concentration during aerobic ventilation in landfills to explore the change in landfill gas concentration during aerobic ventilation. Cossu and Cestaro (2005) reported the field gas concentration during aerobic ventilation at three old landfill sites in Italy under different aeration flow conditions. The variation in gas (CH4, O2 and CO2) concentration with aeration time and influence radius of the gas pressure were evaluated, but the influence radius of oxygen was not determined. Ritzkowski and Stegmann (2013) discussed the relationship between the variation laws of oxygen concentration and oxygen utilization rate with prolonged aeration time based on a monitoring test at an old German landfill. However, their research did not extensively cover the spatial distribution of oxygen concentration. Hrad et al. (2013) monitored the concentration of landfill gas at different depths between 1 and 10 m. The variations in the oxygen concentration and oxygen utilization rate were given over time, but the horizontal radial distance was not monitored during the field test. In contrast to previous work, Raga et al. (2015) monitored the concentration of each landfill gas component based on an aerobic ventilation project of a landfill in Italy. The gas concentration distribution was investigated over time, and the influence of different aeration fan operation modes on the concentration of each gas component was assessed. Liu et al. (2018b) proposed a multi-well optimized steam aeration method that was utilized during a field monitoring test in which the variation law of oxygen concentration in the landfill gradually increased, and the residual organic matter continuously decreased. The work mentioned above reflects the distribution characteristics of oxygen concentration in different landfills over time and under varying working conditions (e.g. recharge and ventilation intensity). Most studies have monitored the oxygen concentration in landfills as a whole. Furthermore, the distribution law of the oxygen concentration inside the landfill with radial distance under aerobic ventilation conditions has not been explored, and there is less discussion on the oxygen influence radius of the aeration well.
To develop the oxygen concentration distribution model of the landfill in the process of aeration, several researchers simulated the gas (oxygen) concentration distribution law of single well and multiple wells based on the field aerobic ventilation project. Combined with the field aeration process, Cossu and Cestaro (2005) deduced a mathematical model that could determine the influence radius of aeration and extraction wells under 100% aeration, as well as extraction flow rates. The reliability of the mathematical model was verified using field test results from three landfill sites. Fytanidis and Voudrias (2014) used the Computational Fluid Dynamics (CFD) software to establish a single-well aeration simulation of a landfill based on CFD. The landfill gas pressure and concentration distribution were simulated, and the radius of influence of the aeration well was predicted. Similar multicomponent gas migration process simulations were conducted by Shi et al. (2016), Liu et al. (2018a), Feng et al. (2019) and Ma et al. (2020). The gas concentration prediction in the above studies was either completed by numerical simulations or analytical solutions of the gas pressure distribution derived under steady-state conditions. However, there is a lack of research on the radial distribution law and prediction model of oxygen concentration under single-well aeration conditions.
This study aimed to determine the radial distribution characteristics of oxygen concentration at a landfill site during single-well aeration. The following research work was carried out as follows: (1) through the single-well aeration field test, the monitoring of the oxygen concentration around the gas well was completed, and the variation of the oxygen concentration with time and radial distance was analysed. The oxygen influence radius of the aeration well was also given; (2) the oxygen concentration prediction (OCP) model was derived under the condition of single-well aeration in the horizontal direction and (3) the reliability of the prediction model was compared, and verified against the field monitoring data. Ultimately, the findings of this study provide a fundamental basis for the design, operation and maintenance management of current and future aerobic ventilation restoration projects.
Test scheme
Site overview
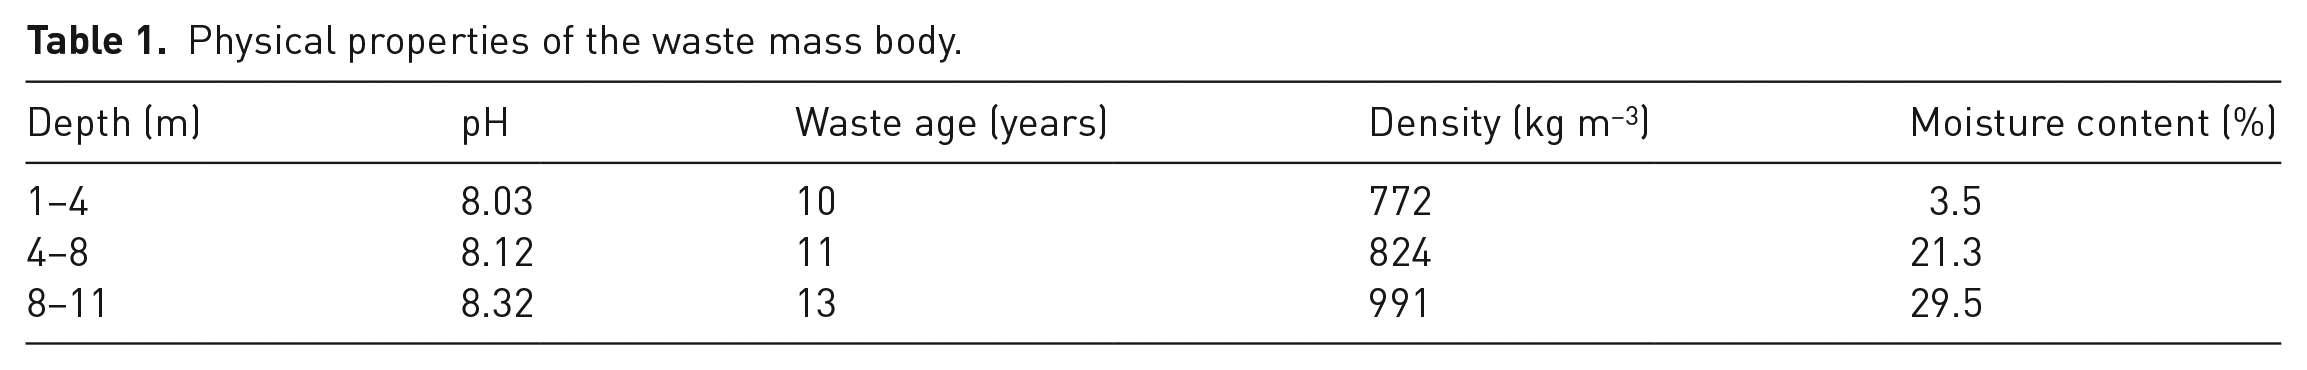
The field test was carried out at an old landfill in Hubei province. The domestic waste stored in the reservoir area measured approximately 140 and 400 m3, and the landfill age was approximately 10–13 years. About 0.8–2.3 m of clay was used to cover the waste, and the thickness of the waste was 10–11 m. The basic waste parameters are listed in Table 1. The pH value of the waste was between 7.90 and 9.05, which is weakly alkaline. The organic matter content was between 4.1 and 17.2%, indicating that waste degradation did not reach stability. Figure 1 displays the main components of the waste: soil and rock (70.8%), followed by plastics and fabrics (14.8 and 10.6%, respectively) and other remaining components.
Physical properties of the waste mass body.
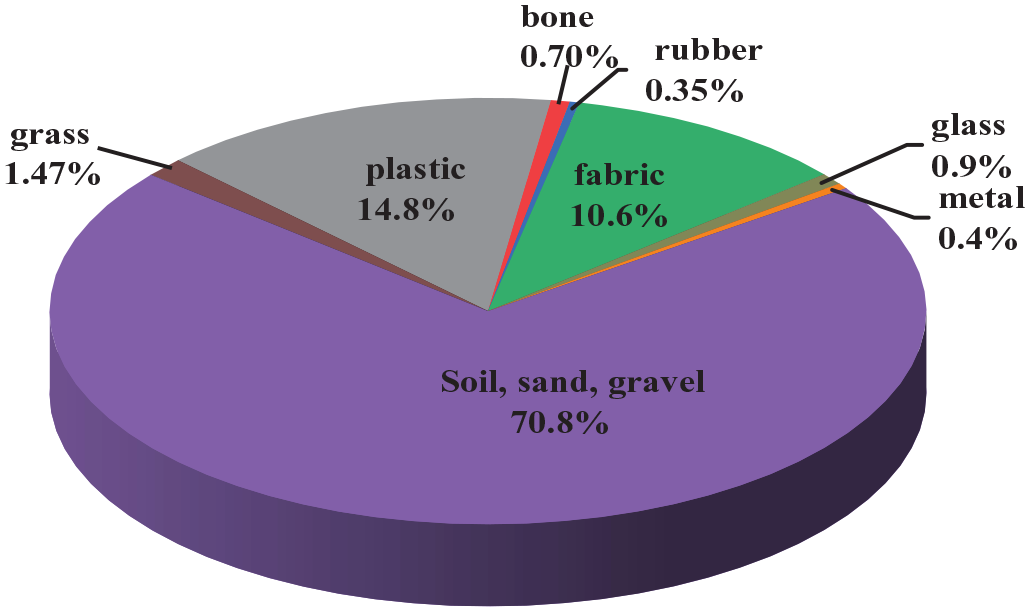
Main components of waste soil.
Test method
Air was injected into the aeration well by aeration fans at constant pressure, and the air flowed into the waste mass through the perforated section of the aeration well. Low-pressure aeration fans (aeration pressure of 0–10 kPa) are generally selected for aerobic restoration projects in landfills because of their good applicability in engineering practice. Aeration fans under aeration pressures of 2, 10 and 20 kPa were selected for the field tests to verify whether the high-pressure or low-pressure fans significantly affected the oxygen concentration in the waste mass.
The gas pressure and gas concentration in the wells were monitored during the aeration process. The gas pressure in the well was directly measured using a pressure meter. To ensure the accuracy of the gas concentration measurement, a hose was placed in the opening section of the PE pipe, and the gas was extracted using an air pump. The extracted gas was collected, and the gas concentration was determined using a multiparameter-integrated online analyser. A gas flow meter recorded the instantaneous flow, pressure, temperature and cumulative flow during the single-well aeration process. Data on the gas pressure and gas concentration were recorded every 15 minutes when there were noticeable changes in the concentration; however, as the rate of change in concentration decreased, the recorded interval time was prolonged to 30 minutes and 1 hour. The time required for the gas pressure and concentration of the different monitoring wells to stabilize was recorded. The test was completed when the gas concentration stabilized.
To determine the gas permeability of the waste, aeration fans with different pressures were used in the field tests. The instantaneous flow value of aeration was recorded using a gas flow meter, and the pressure value of each monitoring well was recorded when aeration was stable. Gas permeability around the well was calculated using the aeration permeability equation (Jain et al., 2012). There were no conditions to carry out in situ test experiments on-site, and parameters such as initial water content and initial void ratio of the waste could not be obtained. Therefore, the effects of water content, void ratio and pore size on gas permeability are not studied.
Figure 2 displays the profile and position plan of the test. Before the field test, well construction work, which includes six monitoring wells (M1–M6, diameter 90 mm), one aeration well (I1, diameter 90 mm) and two gas extraction wells (P1 and P2, diameter 90 mm, used as monitoring wells under non-extraction conditions) was completed. The structure of the extraction well was identical to that of the aeration well. The interval between the gas wells was 1.5 m, and the depth of the gas well was 5.5 m. A perforated PE pipe was placed in the drilled hole. The length of the perforated section was 1 m, located at depths between 4.5 and 5.5 m. The drainage gravel and fabric material were wrapped around the open section to prevent waste from blocking the perforated PE pipe. At the perforated section of the PE pipe, gravel was filled to prevent waste from blocking holes and accelerate gas diffusion. Bentonite was then backfilled at a distance of 1 m from the ground surface. During the backfilling process, backfill clay was rammed to ensure that the gas well was properly sealed. To check the sealing of the aeration pipeline and the integrity of the gas well structure after the completion of the well construction work, the aeration well and fans were connected according to the test requirements, and a pre-aeration test was performed. The results revealed that the aeration pipeline and gas met the test requirements.
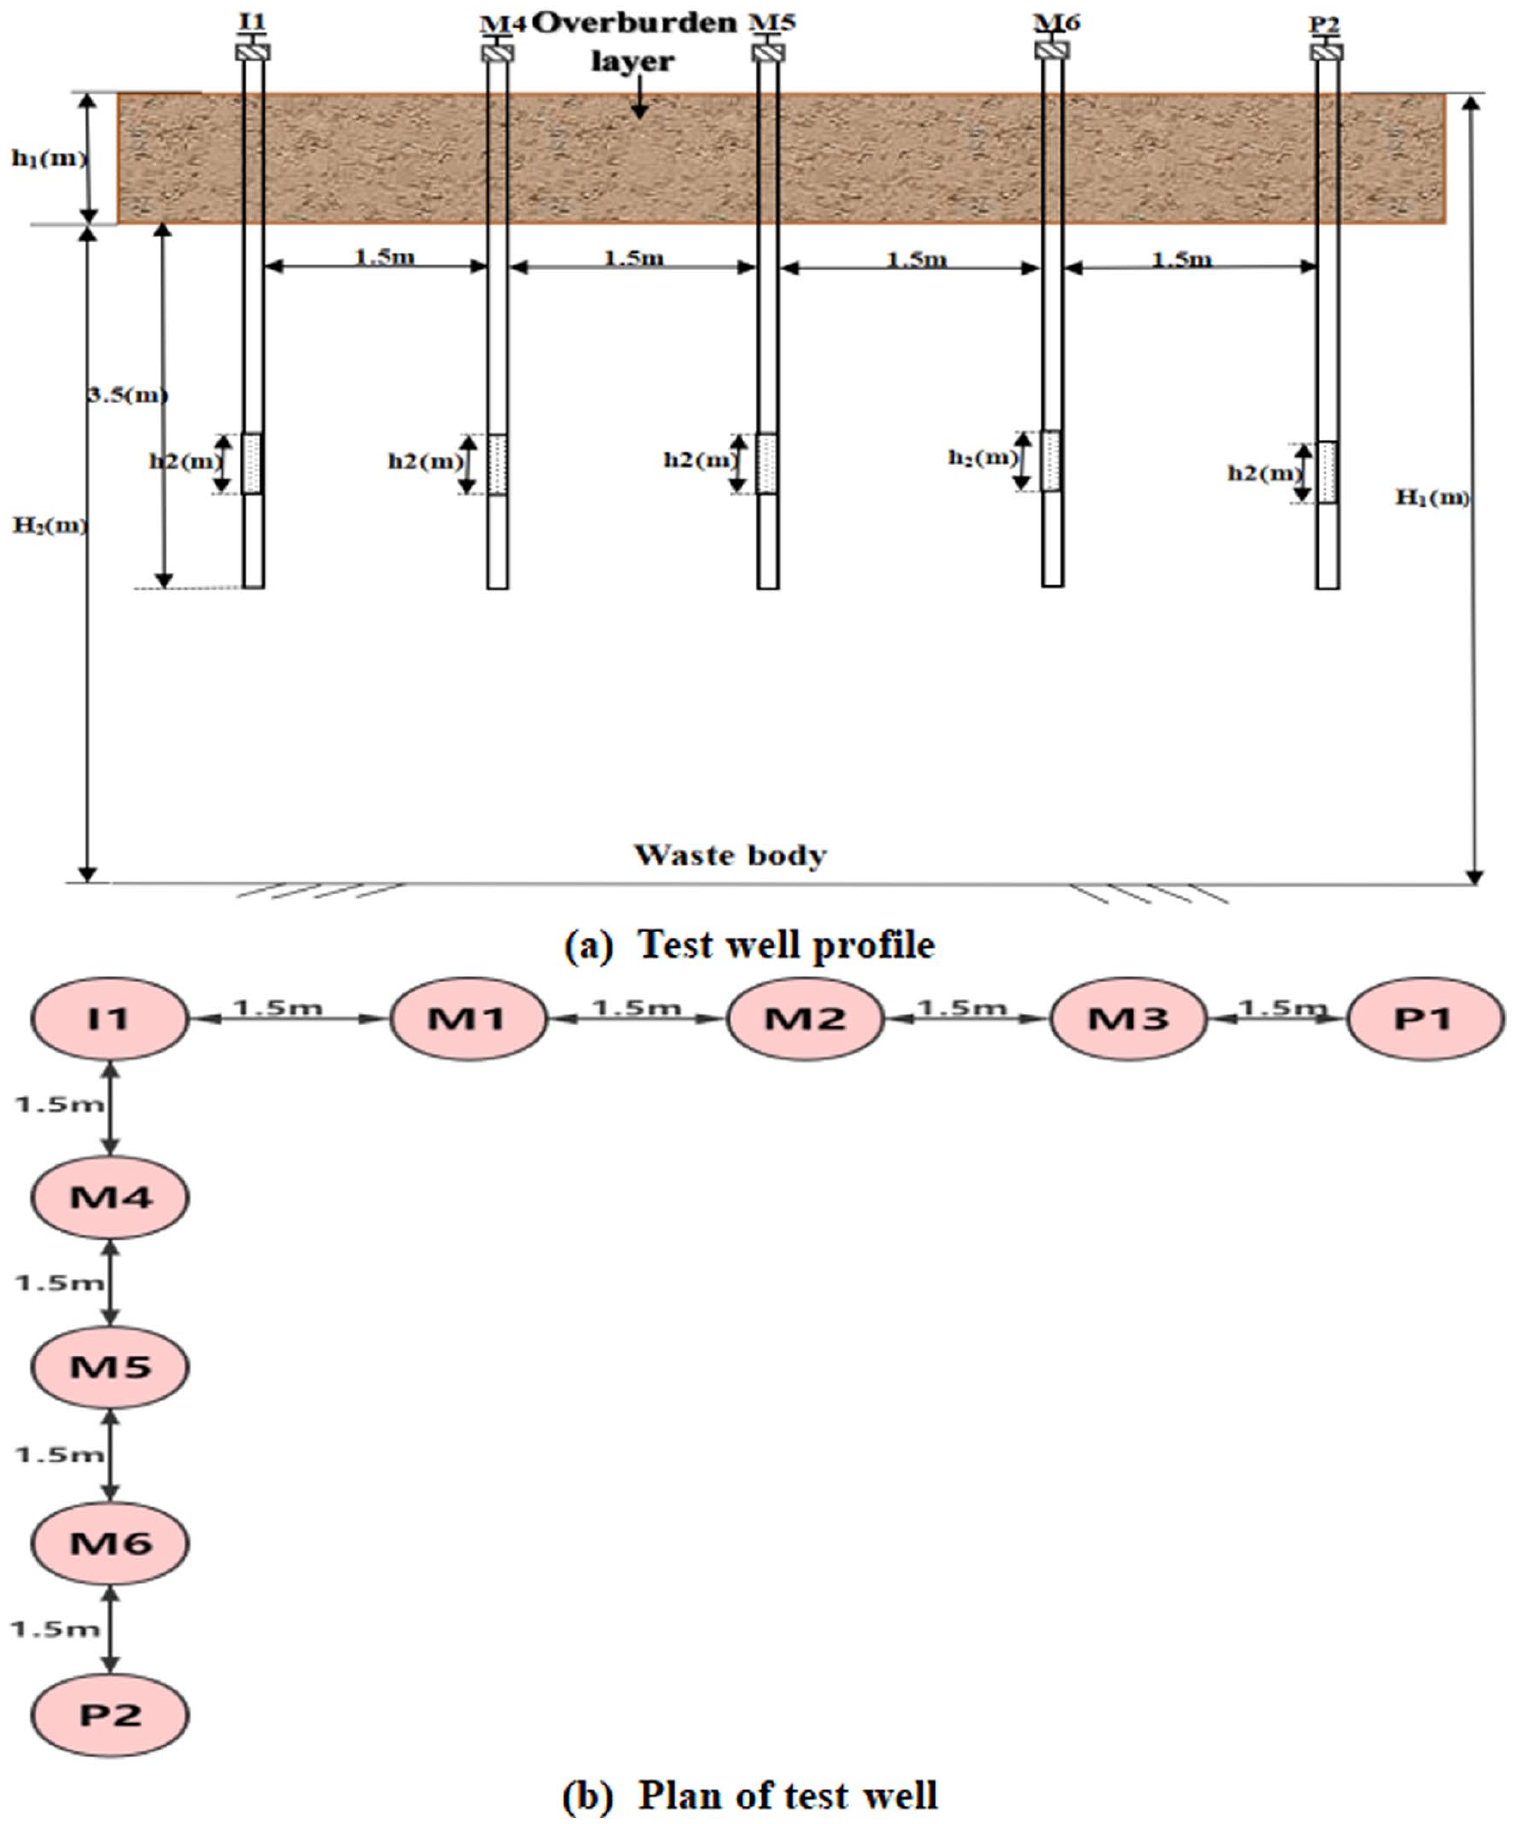
The profile and position plan of the test well.
Test equipment
The test equipment (Figure 3) included an aeration fan (injecting air, HG-500FB, Zhejiang Jieshi Li Mechatronics Co., Ltd, Zhejiang, China), electricity generator (providing electricity, HS10500DSE, FUBIDA Generator Co., Ltd, Chongqing, China), gas flow meter (monitoring aeration flow and pressure, TY-1030, Wuhan Tianyu Environmental Protection Technology Co., Ltd, Wuhan, China), multi-parameter integrated online analyser (analysis of gas concentration, self-developed), air extraction pump (extracting landfill gas, STG-DC5, Nanjing Shantian Electronics Technology Co., Ltd, Nanjing, China), air extraction bag (collecting landfill gas, Changde Bickerman Biological Technology Co., Ltd, Changde, China) and pressure meter (monitoring gas pressure, MIK-Y290, Hangzhou Meiyi Automation Co., Ltd, Hangzhou, China).
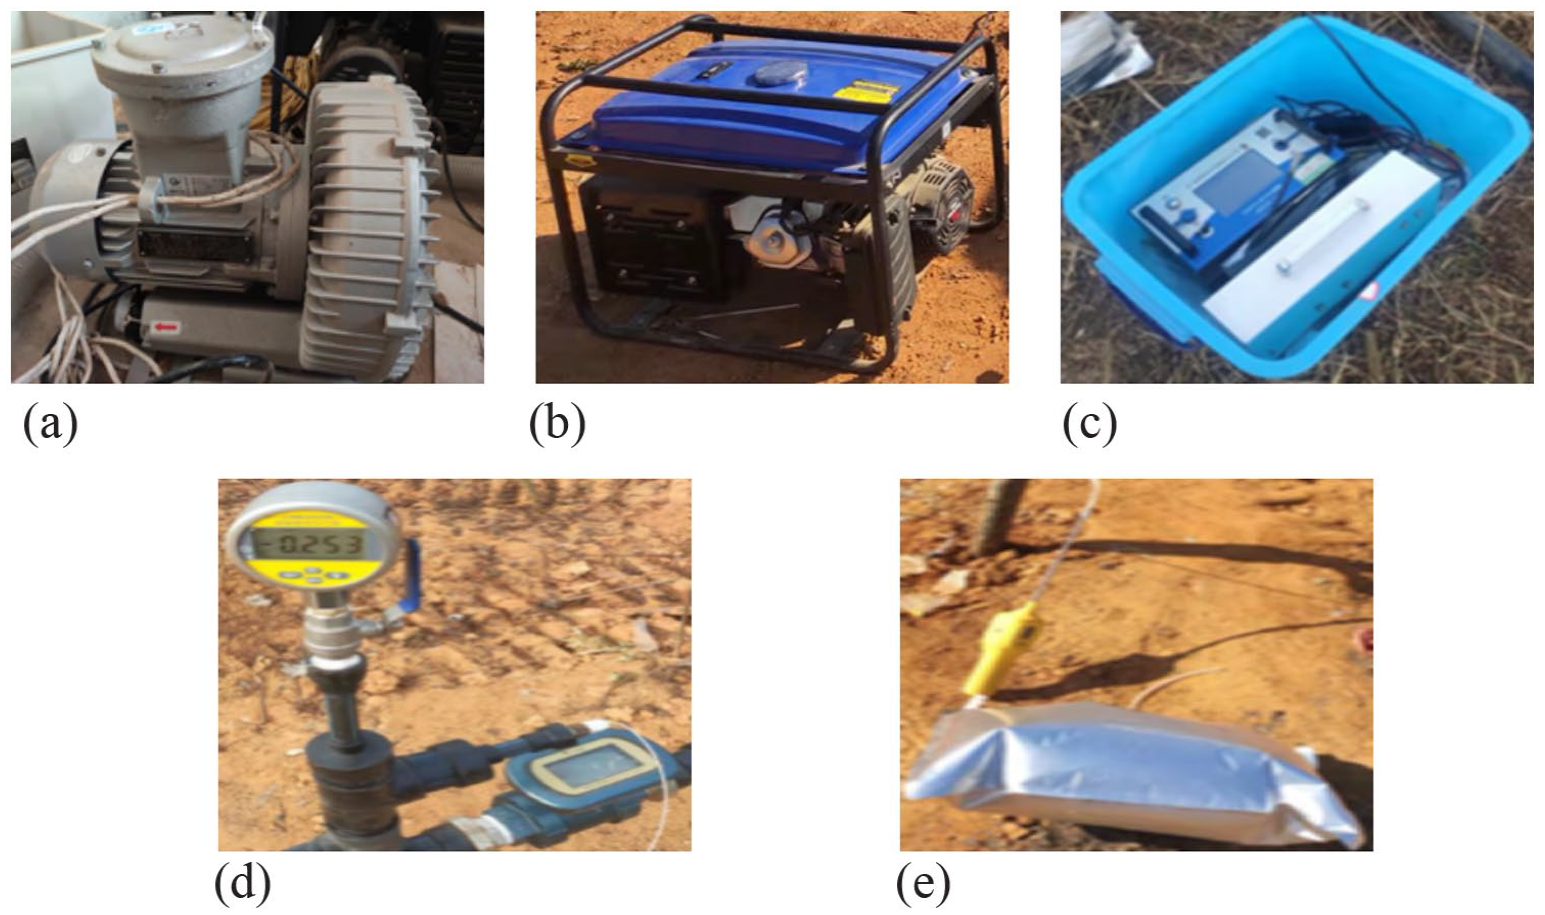
Testing equipment (a) is air blower; (b) is electricity generator; (c) is gas on-line analyzer; (d) are pressure meter and gas flow meter; (e) are air extracting bag and pump.
Test results and analysis
Gas permeability test results
Gas permeabilities at depths .5, 3, 4.5 and 6 m from the aeration wells were calculated using the gas permeability formula (Jain et al., 2012). The gas permeabilities around monitoring wells M4, M5, M6 and P2 were 3.45 × 10⁻¹² m2, 3.5 × 10⁻¹² m2, 3.9 × 10⁻¹² m2 and 1.5 × 10⁻¹² m2, respectively. The average gas permeability of the four monitoring wells was 3.09
Oxygen concentration distribution during aeration
Figure 4(a) and (e) display the variation curve of oxygen concentration over time in gas wells under different aeration pressures at depths of 0, 1.5, 3, 4.5 and 6 m of the aeration well, respectively. The gas concentration inside the gas well initially increases and then gradually stabilizes over time. The oxygen concentration reached an average steady state within 1 h. The slope of the curve also increases first and then flattens with the extension of aeration time. Under 10 kPa aeration pressure, the oxygen concentration in several monitoring wells reached a steady state at approximately 1 h. The oxygen concentration was close to that under 20 kPa aeration pressure, which may be caused by the short interval time of the aeration test, the complex field test environment and the characteristics of the landfill site. The variation rate of oxygen concentration at different radial distances changes from fast to slow and finally remained stabilized, indicating that the oxygen concentration eventually reached a steady state with time. Cossu and Cestaro (2005), Ritzkowski and Stegmann (2013), Raga and Cossu (2014) and Liu et al. (2018b) discovered similar observations.
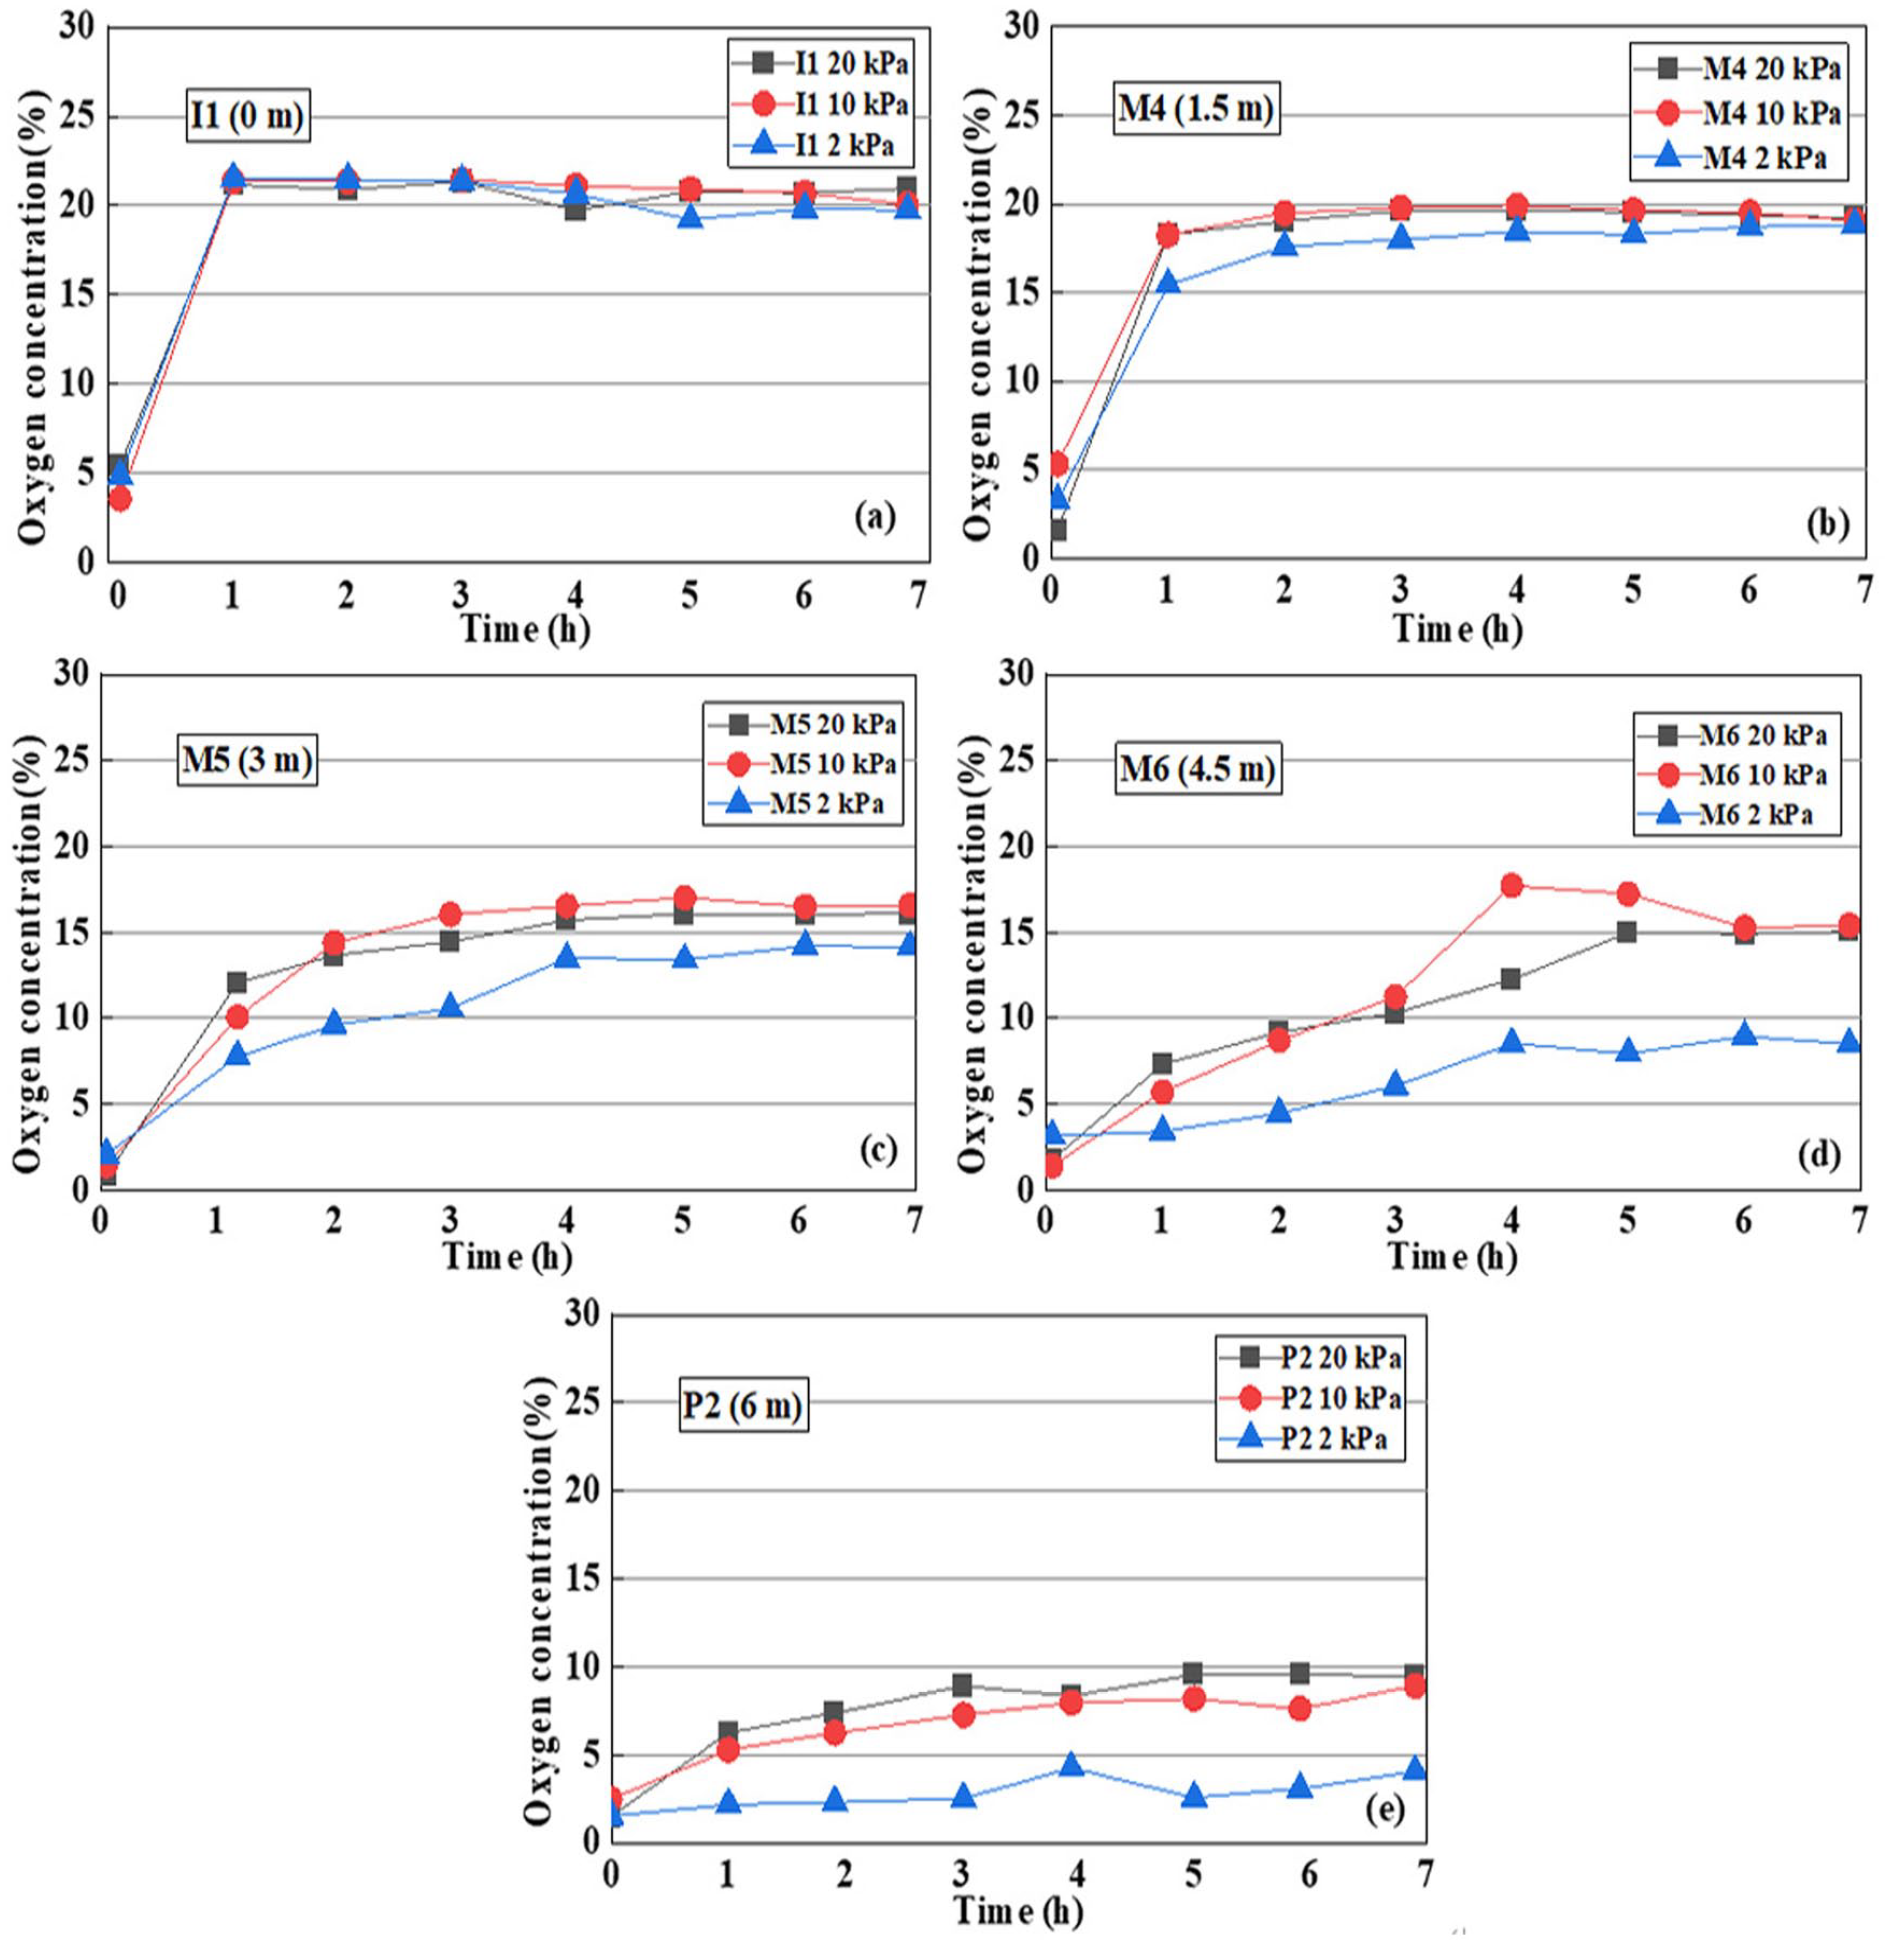
Variation of oxygen concentration with time ((a), (b), (c), (d) and (e) represents the distances of 0 m (I1), 1.5 m (M4), 3 m (M5), 4.5 m (M6) and 6 m (P2) from the aeration well, respectively).
The oxygen concentration demonstrates an increasing trend with increasing aeration pressure. In the same monitoring well, the oxygen concentration and rate of change increases with increasing aeration pressure. Similarly, the time required to stabilize the oxygen concentration in the monitoring well increases with increasing aeration intensity. Owing to the high aeration pressure, the gas diffusion and migration rates are high, resulting in a large gas pressure and gas concentration difference.
Under the same aeration pressure, the time required to reach a stable oxygen concentration in the gas well increases with increasing radial distance. The slope of the oxygen concentration curve become steeper as the horizontal radial distance increased. The aeration well (I1) displays the shortest duration to reach a stable concentration, whereas the P2 monitoring well took the longest time. The closer the distance to the aeration well, the higher the oxygen concentration and the faster the stabilization time. The oxygen concentrations at aeration pressures of 2, 10 and 20 kPa are in the ranges of 5–20%, 8–20% and 11–21%, respectively, whereas the concentration difference is 15, 12 and 10%, respectively. The difference in oxygen concentration between 0 and 6 m decreases with an increase in aeration pressure.
Figure 4 displays the variation in the oxygen concentration in the wells with time and at varying aeration pressures. The oxygen concentration is 1–3% before aeration. After the aeration reached a steady state, the oxygen concentration in the aeration well ranged between 19 and 21%, whereas the oxygen concentration in the monitoring wells is 17–20% (M4), 13–16% (M5), 8–13% (M6) and 2–10% (P2). The fluctuation in oxygen concentration over time, as monitored by the gas well, is considered a normal phenomenon due to the slight attenuation of the pressure of the aeration fan with the extension of the aeration time. Gas in the landfill gradually migrates and diffuses over longer distances. Simultaneously, the complex composition, heterogeneity and preferential flow of disposed waste also have an effect. The test results are similar to those of Cossu and Cestaro (2005), Öncü et al. (2012) and Raga et al. (2015).
Effective oxygen influence radius during aeration
Several researchers, that is, Hrad et al. (2013), determined the oxygen influence radius at 5% oxygen concentration during aerobic ventilation, whereas others, that is, Lee et al. (2002) set the radial distance at which the pressure changed to 0.25 cmH2O as the influence radius. An optimal oxygen concentration of 16–21% is necessary for starting a landfill aerobic degradation reaction. Aerobic reactions are greatly inhibited when the oxygen concentration is less than 10% (Li et al., 2021). Thus, this study sets the radial distance of 10% oxygen concentration as the effective oxygen influence radius, which allows for an optimum layout of the gas wells and creates a conducive environment for aerobic bacteria to accelerate waste degradation and promote rapid stabilization of landfill sites.
Figure 5 displays the distribution curve of oxygen concentration along the horizontal direction after reaching stability. Under different aeration pressures, the oxygen concentration decreases as the radial distance increases, and the oxygen concentration varies with unit distance. The rate of change in oxygen concentration is largest under 20 kPa of aeration pressure, followed by 10 and 2 kPa. The difference in oxygen concentration in I1, M4, M5, M6 and P2 is 2, 3, 3, 5 and 8%, respectively, under 2–20 kPa aeration pressure. As the radial distance increases, the oxygen concentration difference gradually increases. This is attributed to the gradual increase in the pressure difference between the aeration well and the effective oxygen influence radius as the aeration pressure increased, resulting in a faster gas flow rate. As the aeration pressure decreased, the influence radius of oxygen also decreases slightly. The oxygen influence radius under aeration conditions of 2, 10 and 20 kPa are 4.2, 5.8 and 6 m, respectively. The difference in the influence radius between 20 and 2 kPa is approximately 1.8 m, with a slight difference in the effective oxygen influence radius.
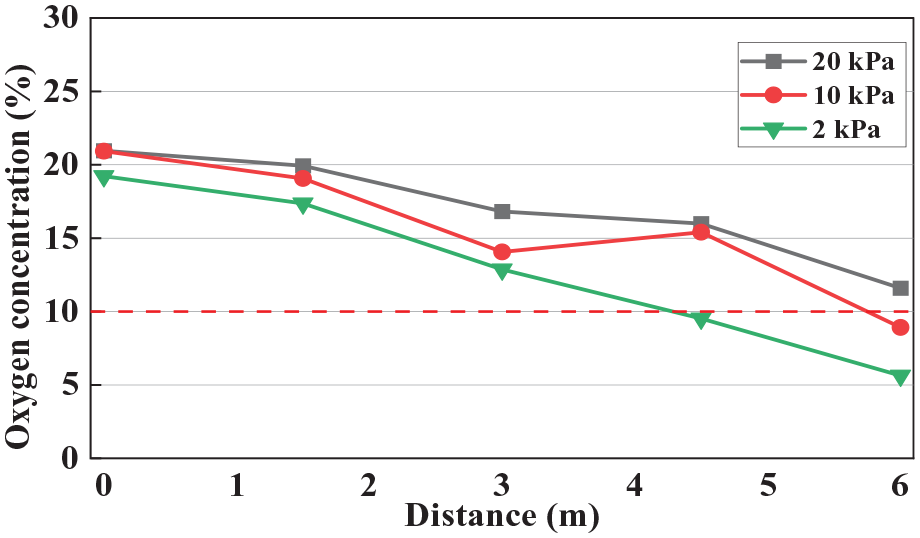
The distribution curve of oxygen concentration with radial distance after stabilization.
Prediction model of oxygen concentration distribution in the single-well aeration process
The design of an aerobic restoration system plays an important role in the aerobic restoration project of landfills. Technical parameters, such as the influence radius of the aeration well, optimal aeration rate and gas pressure gradient, are necessary for the design, operation and maintenance of the aeration system and can be determined by field tests and mathematical models. Based on the fluid flow control equation and aerobic ventilation technology in landfills (Ritzkowski and Stegmann, 2018), a mathematical model was established for predicting the influence radius and oxygen concentration in a single-well aeration process. The OCP model reliability is verified using field-monitoring data.
Oxygen OCP model
The following assumptions were made for the continuity equation of oxygen migration:
In the single-well aeration process, the gas flowed and diffused in a horizontal direction without vertical diffusion.
The model was derived from a radial coordinate system that is infinite in the horizontal direction. The parameters of the test site did not change with changes in the horizontal position of the waste.
At t = 0, air was injected into the gas well at a constant flow rate, and the oxygen concentration remained constant in the horizontal direction and at infinite radial distances.
When the landfill waste is over 12 years old, it indicates that the waste mass was later in the degradation stage. The resulting gas pressure monitoring results for the waste mass were <100 Pa. Therefore, it is assumed that the production and consumption rates of landfill gas in a single-well aeration process are very low, thus ignoring the influence of the source and sink terms in the aeration process.
In the radial coordinate system, the gas pressure flow equation (1) for a single-well aeration process can be described by the following equation (Zimmerman, 2018):
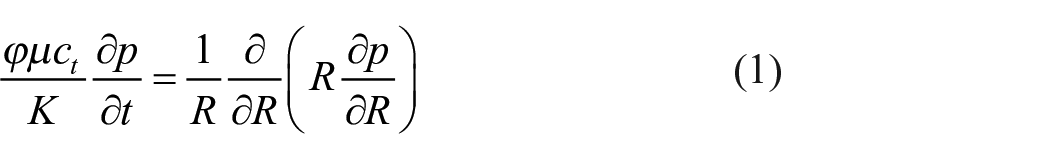
In this study, the explicit solution of oxygen concentration with radial distance and time was obtained using the calculus and logarithmic approximation method (Zimmerman, 2018). The derivation process is detailed in the Appendix. The OCP model for the single-well aeration process is as follows:
where c is the oxygen concentration (mol·m−3); ci is the initial oxygen concentration (mol·m−3); µ is the gas viscosity coefficient (Pa·s); K is the gas permeability (m2), 3.09 × 10⁻¹² (m2); t is the aeration duration (s);
Model prediction results and discussion
Figure 6(a) and (f) depicts the curves representing the change in oxygen concentration under different aeration pressures. Two sets of data are demonstrated in each figure. The curved data were obtained using the OCP model, whereas the point data represent the on-site monitoring results.
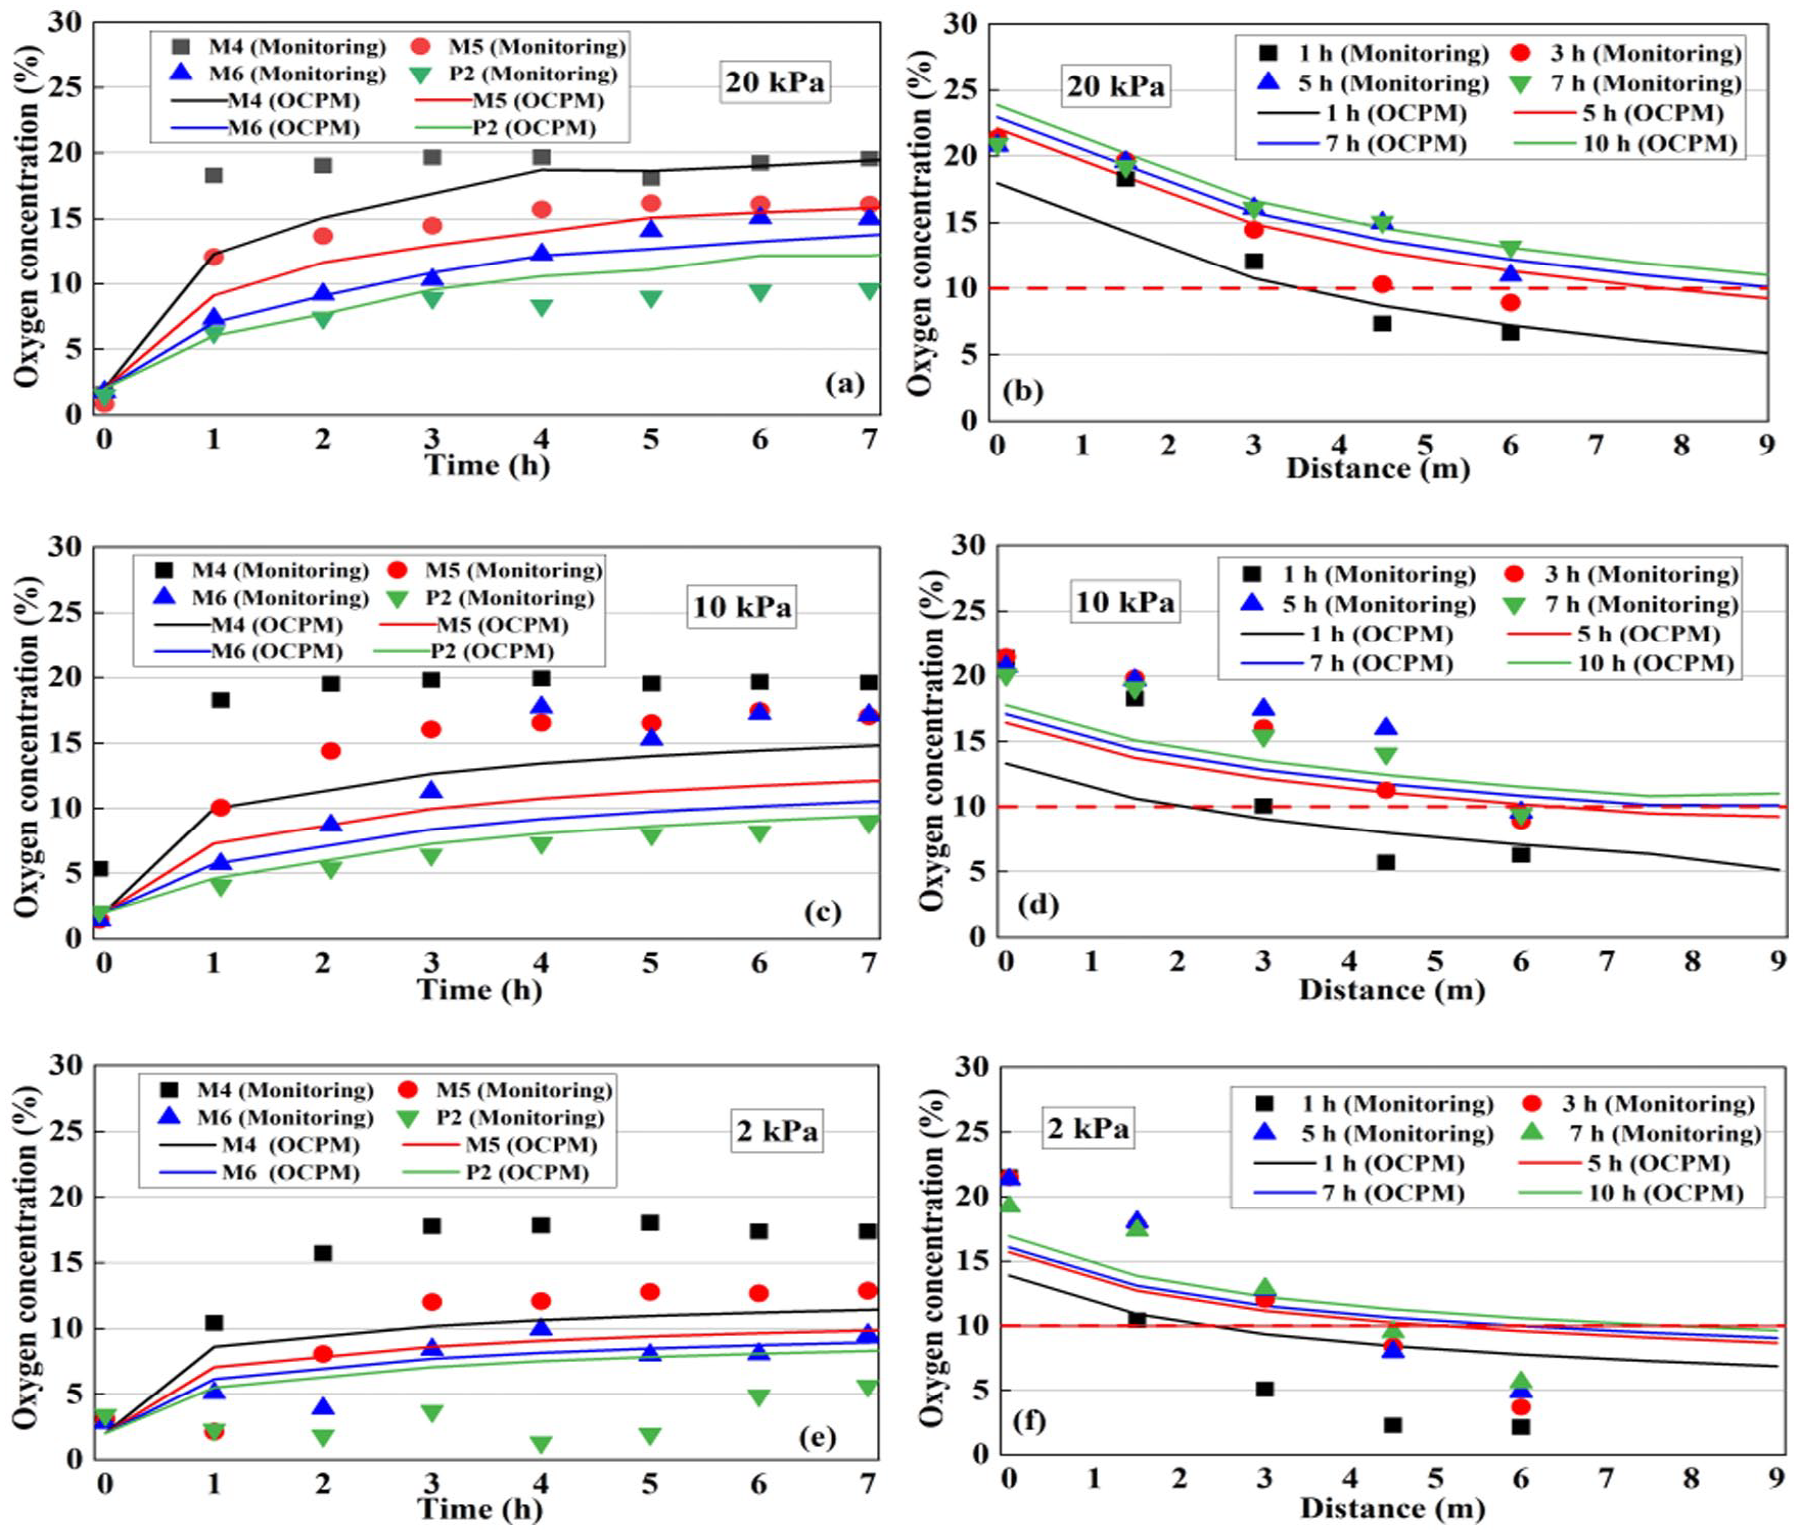
The plot of the change of oxygen concentration in the gas well over time (a), (c), and (e) represent the variation of oxygen concentration in different monitoring wells with time under different aeration pressures of 20 kPa, 10 kPa, and 2 kPa, respectively; (b), (d), and (f) represent the variation of oxygen concentration with radial distance under 20 kPa, 10 kPa, and 2 kPa aeration pressures, respectively.
The figures highlight that under different aeration pressures, the slope of the curve gradually decreases with the extension of aeration time, whereas the oxygen concentration in the gas well initially increases and subsequently reaches a plateau with the extension of aeration time. A change in trend is also observed in the on-site monitoring data. The field monitoring results of Lee et al. (2002), Cossu and Cestaro (2005) and Öncü et al. (2012) also exhibit similar observations. Furthermore, the oxygen concentration and curve slope in the same monitoring well increases with increasing aeration pressure. The oxygen concentration is lowest under 2 kPa of aeration pressure, followed by 10 and 20 kPa. These modelling results differ slightly from the field test results. In addition, the time required to stabilize the oxygen concentration in the gas well is greater in the model than in the field test results. This may be due to the complex test environment and the characteristics of the waste mass. After aeration reaches a steady state, the oxygen concentration in the aeration well ranges between 19 and 21%, whereas the oxygen concentration in the monitoring wells is 12–18% (M4), 10–16% (M5), 8–13% (M6) and 7–10% (P2). The simulation results are compared with field test data and demonstrated a similar increasing trend in the oxygen concentration in the gas well. This implies that the OCP model is feasible for predicting the variation in oxygen concentration with time.
As previously mentioned, the variation in oxygen concentration over time in the OCP model is similar to that in the field monitoring data. The analytical solution at 20 kPa aeration pressure is closest to the field data; however, the analytical solutions at 10 and 2 kPa have a larger oxygen concentration difference. The time required for stabilization in different monitoring wells is longer than that in the field test, which may be affected by the single-well aeration test conditions and the complex characteristics of the waste mass. The oxygen concentration at 2, 10 and 20 kPa aeration pressure is in the ranges of 6–18%, 9–20% and 12–21%, respectively, whereas the concentration difference is 12, 11 and 9, respectively. The difference in oxygen concentration in monitoring wells I1, M4, M5, M6 and P2 is 2, 6, 6, 5 and 3%, respectively, under 2–20 kPa aeration pressure. Thus, the oxygen concentration difference between 0 and 6 m in the OCP model is close to the results obtained from the field test data.
Figure 6(b), (d) and (f) highlights the initial rapid decrease in the oxygen concentration inside the waste mass, followed by a gradual decrease with the increase in radial distance, similar to the observations of the field test data. In addition, similar values of the oxygen influence radius are observed in the OCP model and field-monitoring results. The oxygen influence radii of the OCP model under aeration conditions of 20, 10 and 2 kPa are approximately 4.5, 6 and 8 m, respectively, which is close to the oxygen influence radius of the field test results. Thus, the reliability of the OCP model was verified against the field results.
With the extension of aeration time, the effective radius of oxygen gradually increased when the oxygen concentration reached a stable radial distance. The large variation gradient (Δc/ΔR where Δc is the difference in oxygen concentration between two adjacent gas wells, and ΔR is the radial distance between two adjacent gas wells) of oxygen concentration at different radial distances under different aeration pressures gradually reduced until stabilized, indicating that the oxygen concentration eventually reached a steady state with the radial distance. The varying range of the effective oxygen influence radius under the conditions of strong aeration pressures of 10 and 2 kPa is considerably smaller than that under the condition of a strong aeration pressure of 20 kPa, which may be caused by the different gas diffusion rates inside the waste mass and the characteristics of the waste mass under different aeration pressures.
Upon reaching a steady state, the oxygen concentration predicted by the OCP model increased at a slow and steady rate, which is consistent with the current results from the field. The oxygen concentration near the aeration well exceeded 21% because the model used the logarithmic approximation linear source solution method. The above problems were predicted using a series of analytical solutions and reasonable boundary conditions. The gas permeabilities of different landfills differ. Hence, the gas permeability ratio coefficient M (the ratio of gas permeability of other landfills to gas permeability in this study, see Appendix) is introduced. The field monitoring data verified the rationality of the coefficients.
Further research should be conducted to improve our understanding of landfill aeration. For field testing: (1) tt is necessary to determine how to evaluate the effectiveness of aeration; (2) numerous influencing factors need to be studied further, such as landfill gas emissions, residual emission potential, residual organic matter content and water content; and (3) there is still a lack of understanding of the chemical processes and expected cost of ventilation.
In terms of models, the influence of different spatial dimensions, model parameters (temperature, water content and organic matter content) and preferential water and gas flow of the model needs to be further investigated. Although there is still much to explore concerning landfill aerobic restoration engineering in theory and practice, the aeration method has great potential to improve the sustainability of old landfills.
This study provides key theoretical support for predicting the gas distribution law in aerobic ventilation of landfill sites, which plays an important role in reducing greenhouse gas emissions from landfills. In landfill aerobic remediation projects:
Monitoring landfill gas production and settlement during the operation of aerobic ventilation projects are essential for the stability and safety of landfills.
It is necessary to regularly investigate and test the waste mass properties of landfills.
According to the results obtained, aeration technology and operation will be continuously optimized to find the most effective aeration measures to achieve the goal of maximum oxygen concentration in the entire landfill.
The landfill temperature may rise (waste dehydration); thus, to control the temperature, it is necessary to add water or leachate recirculation to prevent drying effects and enhance the likelihood of leachate biodegradation.
A reasonable adjustment of site water distribution is conducive to the continuous operation of air injection in landfills.
Conclusions
Based on the conditions at an old landfill site, a single-well aeration test under typical aeration pressure was carried out, along with the prediction model of the oxygen concentration distribution and effective oxygen influence radius was constructed. The following conclusions were obtained:
With prolonged aeration time, the oxygen concentration around the gas well first increased and then approached a steady state. With an increase in radial distance, the oxygen concentration first dropped sharply and then gradually decreased. When the aeration pressure increased from 2 to 20 kPa, the influence radius of the gas well increased slightly by approximately 1.5 m.
An analytical solution of oxygen concentration distribution under single-well aeration (OCP model) was derived. The prediction model obtained the same trend for oxygen concentration in the field test. Combined with the field monitoring data, the reliability of the model was preliminarily verified. The model is suitable for low-pressure and high-pressure ventilation.
The prediction model was mainly used to simulate the variation in the gas concentration in the horizontal direction and time. The advantage of the model is that the gas concentration distribution can be obtained using gas permeability, which can be applied to different landfill oxygen concentration distribution predictions.
Footnotes
Appendix
Based on the gas continuity equation and ideal gas state equation, the prediction model was derived using calculus and logarithmic approximation under reasonable assumptions (see section ‘‘OCP model’4.1).
Equation (A1) is the governing equation of the transient radial flow gas pressure in porous media in radial coordinates.
Equation (A1) combined with the ideal gas state equation (A2) can be used to obtain the control equation (A3) of the gas concentration in porous media:
Combined with the field and environmental conditions, additional conditions (equation A4) for solving the control differential equation are given, including the initial conditions and boundary conditions:
Using equation (A5) to simplify the diffusion equation (A6):
Equation (A6), combined with the boundary conditions (equation (A4)), can be used to obtain the functional relationship between the oxygen concentration c and variable η:
Pair (equation (A7)) to obtain integrals and obtain the upper and lower bounds (equation (A8)):
It is difficult to calculate the power integral function in equation (A8). The key power functions of the power integral function are expanded by the Taylor formula and converted into logarithmic functions, where γ is Eulerian, and the value is 1.781, as illustrated in equations (A9) to (A12):
In this study, t is lengthy; therefore, the analytical solution of the oxygen concentration in a single-well aeration process is as follows:
Different landfills have different gas permeability. Therefore, the gas permeability ratio coefficient, M (the ratio of gas permeability of other landfills to gas permeability in this study), is introduced into the model; thus, the resulting equation (A14) is:
Declaration of conflicting interests
The authors declared no potential conflicts of interest with respect to the research, authorship, and/or publication of this article.
Funding
The authors disclosed receipt of the following financial support for the research, authorship, and/or publication of this article: This research was supported by the National Science Foundation (41977254, U20A20320), Foundation for Distinguished Young Scholars of Hubei Province (2021CFA096) and Foundation for Innovative Research Groups of Hubei Province (2019CFA012).