





Abstract
The method based on machine learning and laser-induced breakdown spectroscopy (LIBS) is effective for rapid characterization of waste organic polymers (WOP). However, the lack of mechanistic interpretability leads to raises concerns regarding its reliability in practical applications. This study systematically investigated the fundamental chemical correlations between WOP fuel properties and LIBS spectral features through feature selection and machine learning interpretability analysis. Thirteen radical-associated key peaks were selected and strategically categorized into two groups for model construction. Under optimal conditions, the prediction accuracy for carbon, hydrogen, oxygen content and lower heating value (LHV) reach 97.74%, 91.22%, 91.28% and 97.02%, respectively. Notably, models utilizing 10 selected key peaks demonstrated superior performance compared to those employing raw LIBS spectra or principal components, especially with the absolute difference reaching 14.57% for O content prediction. Interpretability analysis showed that C2 swan bands had highest effects impacts on carbon, oxygen content and LHV prediction, whereas H I line was essential for hydrogen content prediction. This mechanistic investigation provided theoretical validation for LIBS-based rapid characterization systems, facilitating their practical implementation in downstream energy recovery processes. The established methodology offers a scientific foundation for advancing sustainable waste management and promoting circular economy development through efficient resource utilization.
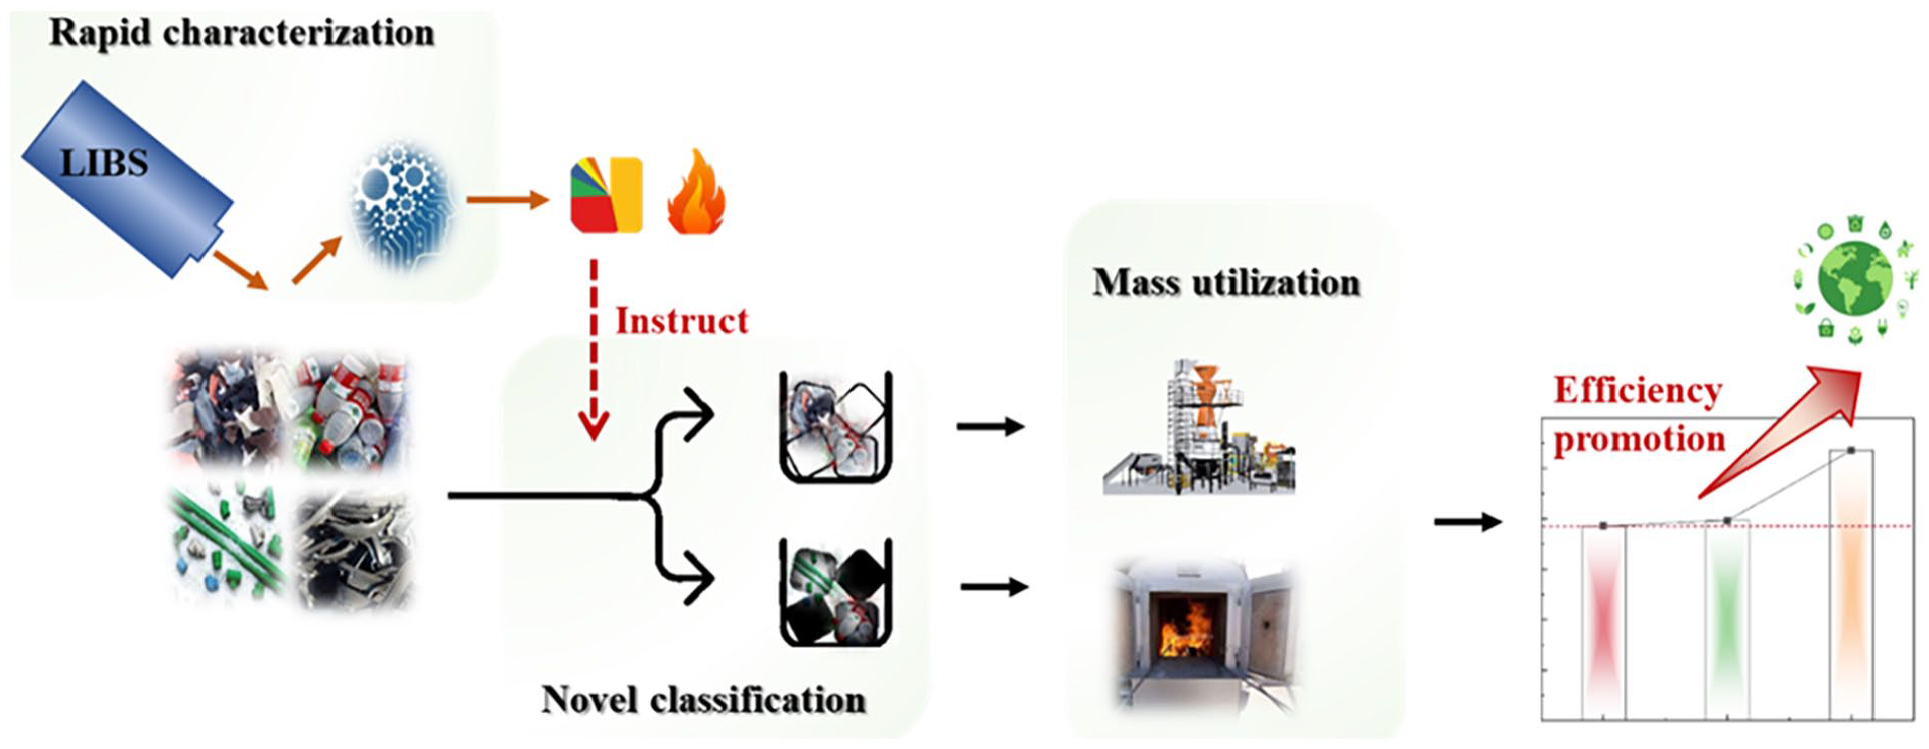
This is a visual representation of the abstract.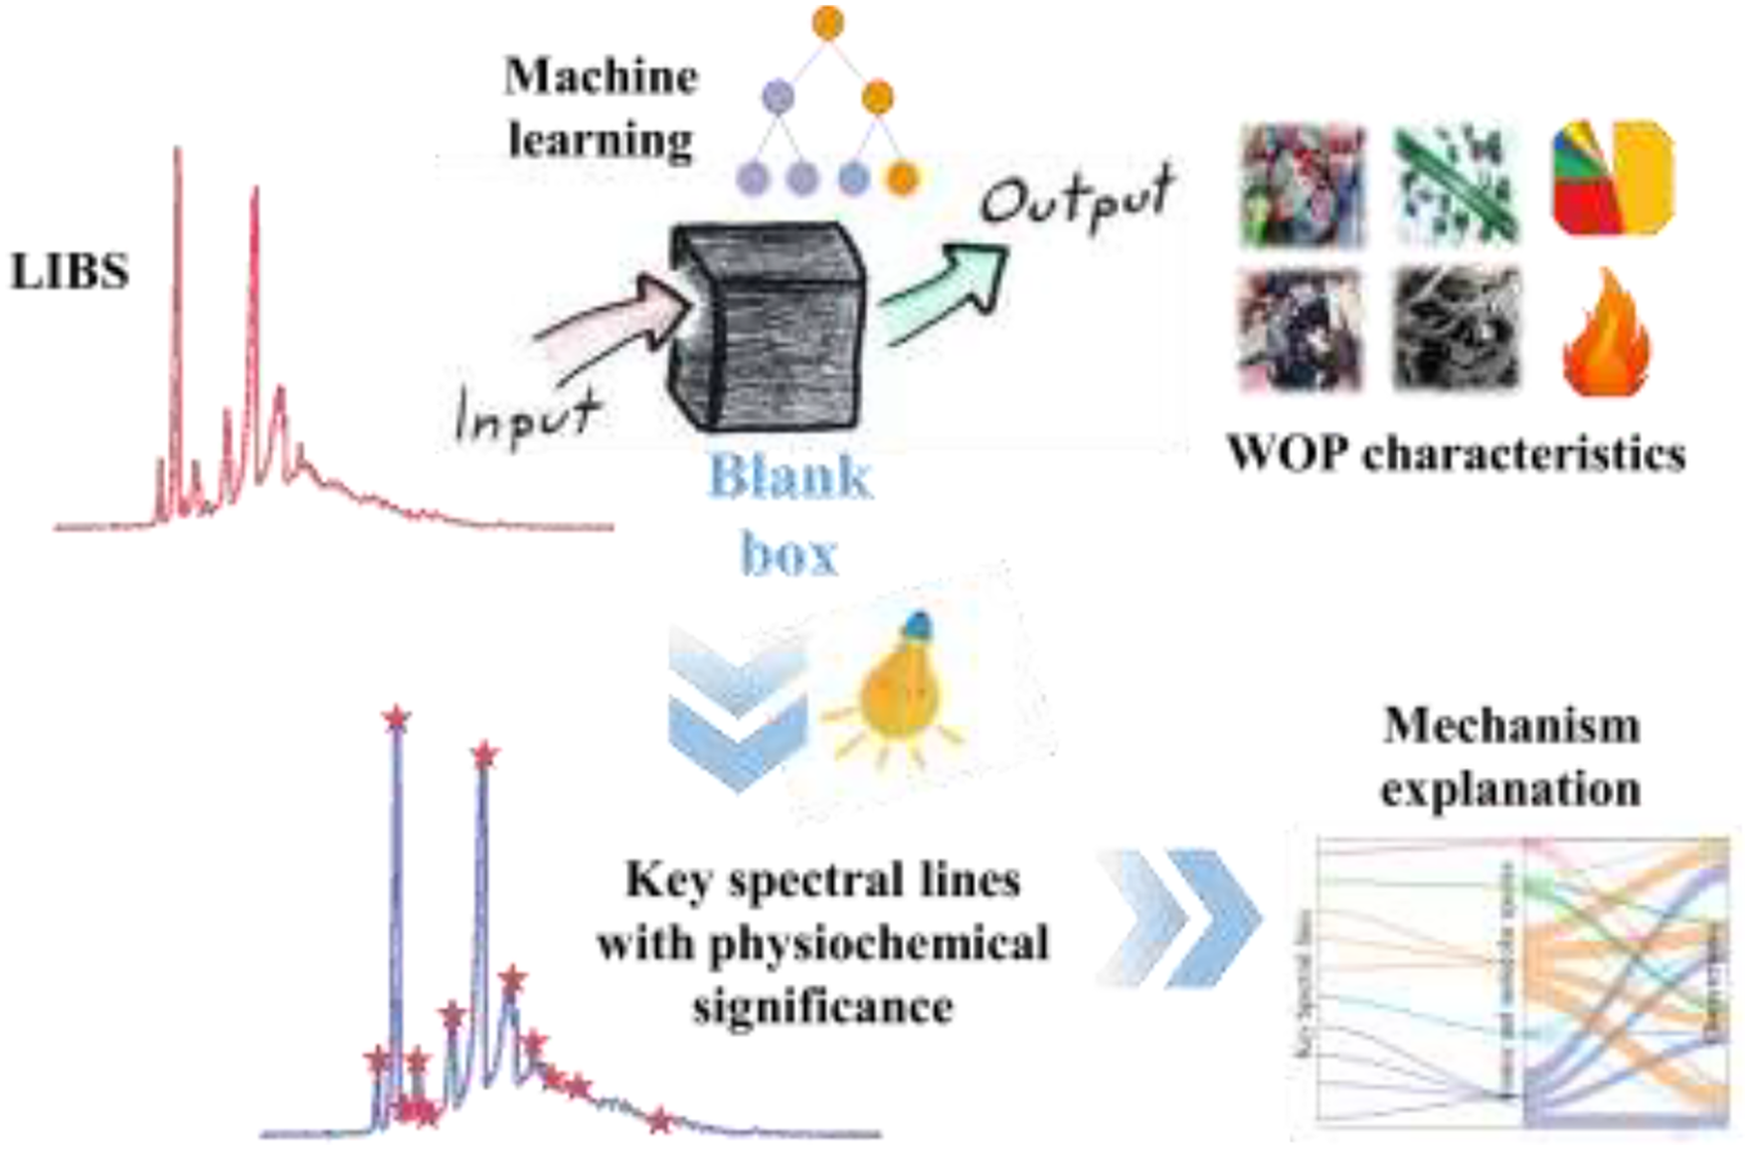
Keywords
Introduction
The growing accumulation of waste organic polymers (WOP) poses substantial environmental challenges, necessitating effective recycling solutions. Advanced chemical recycling technologies including pyrolysis and gasification have emerged as promising approaches to transform WOP into value-added products, thereby supporting circular economy development (Dogu et al., 2021). However, the heterogeneous nature of WOP – comprising diverse materials such as plastics, rubbers, wood, etc. – presents significant challenges for downstream processing efficiency (Hou et al., 2014; Li et al., 2019; Sepehri and Sarrafzadeh, 2018). Materials with different elemental composition requires variance reaction conditions for optimal energy conversion. For instance, cellulose pyrolysis occurs at 187°C–388°C, whereas low-density polyethylene requires higher temperatures of 418°C–520°C (Chang et al., 2025). Such disparities highlight the critical importance of accurate material characterization in chemical recycling processes. Effective material characterization directly influences reaction conditions optimization, ultimately determining energy recovery efficiency and circular economy benefits. This critical process serves as the foundation for sustainable waste recycling.
Recent research has focused on developing rapid characterization systems using spectroscopic techniques to meet industrial automation demands (Liang et al., 2021). Among emerging technologies, laser-induced breakdown spectroscopy (LIBS) has gained prominence due to its rapid analysis cycle and elemental detection sensitivity (Lasheras et al., 2011; Tian et al., 2023). While LIBS has demonstrated success in WOP classification (Anzano et al., 2011; Barbier et al., 2013), its application for material characterization remains underexplored. The integration of machine learning with LIBS analysis has recently opened new possibilities for both classification and characterization in WOP management, achieving accuracies exceeding 95% within few seconds (Farhadian et al., 2017; Stefas et al., 2019). Compared to conventional statistical approaches employing linear correlations or elemental ratios (Lasheras et al., 2010), machine learning algorithms demonstrate superiority in handling high-dimensional spectral data and enabling real-time decision-making. Despite these advantages, the limited interpretability of machine learning models poses challenges for industrial adoption, as black-box predictions hinder mechanistic understanding and process optimization.
The reliability of machine learning applications in spectroscopic analysis has raised two fundamental concerns. Firstly, the observed high predictive accuracy may originate from algorithmic overfitting to localized datasets, even when standard cross-validation are implemented (Hosseini et al., 2020). This underscores the critical need for interpretability analysis that could elucidate the underlying chemical mechanisms connecting spectral inputs to material properties. Secondly, the inherent opacity of machine learning decision-making processes creates barriers to model generalization across diverse waste streams and performance optimization through chemical insights. For instance, when confronting variations in feedstock composition or scaling up processing capacity, the lack of mechanistic understanding forces researchers to rely on extensive trial-and-error experimentation rather than principle-driven modifications. These dual challenges motivate our investigation into the interpretable correlation between LIBS and properties of WOP.
To bridge these critical knowledge gaps, this article establishes a mechanistic framework correlating LIBS spectral peaks with fuel properties of WOP. The methodology emphasizes two critical preprocessing stages: intelligent feature selection and chemical-informed spectral optimization. Raw LIBS spectra inherently contain both diagnostic emission lines and confounding spectral parts. Its high dimensionality is a primary source of model overfitting (Chen et al., 2022). Principal component analysis (PCA) enables dimension reduction through orthogonal transformation, retaining >90% variance with 8–12 PCs (Liang et al., 2022; Xue et al., 2023). But the input PCs, linear combinations of information at each wavelength (Tao et al., 2020), obscure specific wavelength contributions crucial for mechanistic interpretation. In this article, we selected several peaks closely linked to specific molecular groups and atomic lines (e.g. CN, C2, CH, O I and H I) to explore the interpretability. Notably, while previous studies have adopted diagnostic LIBS peaks for polymer classification (Junjuri et al., 2019), their application in establishing quantitative structure–property relationships and interpretability exploration remains unexplored.
Specifically, we (i) selected the key LIBS features and constructed rapid characterization models; (ii) compared the predictive performance of different data processing methods to validate the usability of LIBS peaks for WOP characterization; (iii) investigated the effects of relative and absolute spectral intensities on fuel property predictions and (iv) analyzed the chemical correlation between fuel properties and key LIBS features. This article explored the underlying chemical mechanism of the rapid WOP characterization models, facilitating their industrial-scale implementation. This research provides a solid foundation for efficient WOP chemical recycling and contributes to the sustainable development of the circular economy.
Data and methods
Data preparation
This article used 21 materials of WOP and 3 inorganic wastes. Specifically, four categories of waste were selected, including 16 kinds of plastics/rubbers, 4 kinds of clothing raw materials, 1 plant and 3 kinds of inorganics (glass, copper and aluminium). Four fuel properties closely influenced chemical recycling effects, including carbon, hydrogen, oxygen content and lower heating value (LHV)), were collected. The data used for model establishment ensued that this established methodology is positive to sustainable waste management circular economy. Eleven samples (different parts of the material) of each kind of material were measured in LIBS tests in our previous study (Yan et al., 2021). Thus, we can obtain 264 set of data in total, provided in Supplemental Table S1. The detailed LIBS instrumental setup can be seen in our previous study (Yan et al., 2021).
In total, 264 sets of data were divided into training sets (240 data) and testing sets (24 data). Same as our previous study, the training and testing sets were manually arranged since the limitation of sample size. It is aimed to ensure the establishment of the predicting model can cover more kinds of materials and have better reproducibility.
Establishment of fast characterization models
As shown in Figure 1, there were three steps to explore the mechanism of the WOP fast characterization method: data pretreatment, characterization model establishment and mechanism explanation, containing model evaluation and comparison and importance analysis.
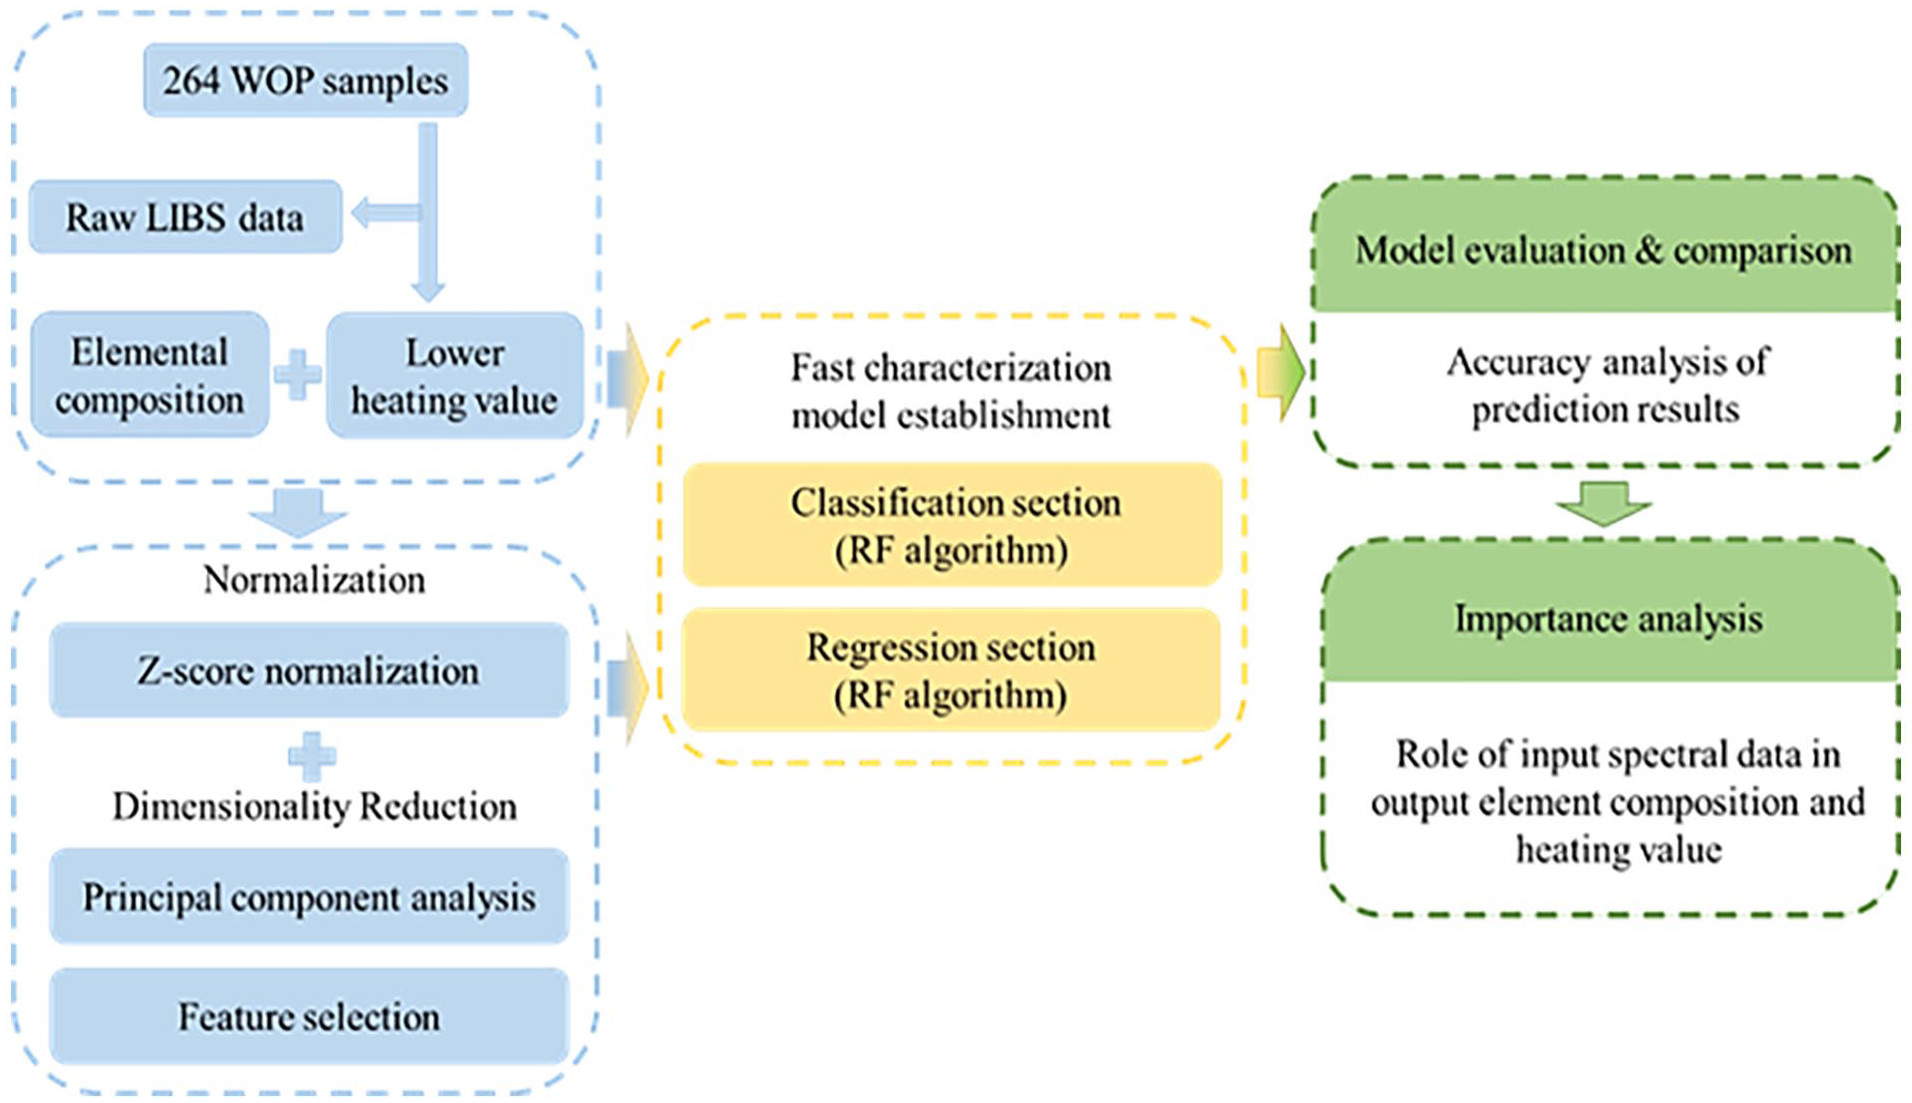
Research route of article.
The Z-score normalization method was used to eliminate the dimensional relationship between spectral variables, which can change the inputs from absolute height between spectra to relative height. In the Z-score normalization, the LIBS were converted into data with an average of 0 and standard deviation of 1 (Gebrekidan et al., 2016). The data normalization process follows equation (1), where
Furthermore, the fast characterization model contains two sections: the classification module, which was designed to classify the WOP and inorganic wastes, and the regression module, which was designed to predict the carbon, hydrogen, oxygen content and LHV of WOP. Random forest (RF) was adopted in this article. RF integrates multiple trees by Bagging thought of ensemble learning, which contains the RF classifier for classification and the RF regressor for prediction. Hyperparameters of RF were adjusted by Search CV (Supplemental Text S2), and the optima were provided in Supplemental Text S2.
The final result was to multiply the results of the classification and regression modules. The performance of characterization models with three kinds of inputs was compared and analysed the effect of these different inputs on the predictive model. The great predicting models with high accuracy and robustness were selected. Then, in order to investigate the influence of the inputs on the characteristics and explore the mechanism of the machine learning model (Lee et al., 2022), the feature importance was implemented. Feature importance of tree model is the average of each feature contributes to each tree in the RF.
Model assessment
Accuracy, precision, recall and F1 score were used to assess the performance of classification module. Mean relative error (MRE) was used to assess the performance of regression module. The detailed calculating formulas of these five evaluating methods can be found in our previous study.
Results and discussion
The performance of models with selected feature
The key spectral features were selected to explore the mechanism of the WOP fast characterization method. And the WOP fast characterization models with selected features were analysed firstly.
The WOP fast characterization model comprises two sections, the classification module and the regression module. Since the negative effect of WOP on their energy utilization (Chang et al., 1999; Ollila et al., 2006), the classification module was designed to sort the inorganic substance and WOP. The inorganic substances were called as 0, and the organic compounds in WOP were called as 1. The regression module aimed to predict the carbon, hydrogen, oxygen content and LHV of WOP. The organic polymer samples trained this module.
Feature selection strategies
The key-selected LIBS peaks with physicochemical significance were used as input features to establish the predictive model. An automatic detection programme was designed for key peak selection, which was uploaded to GitHub.
Figure 2 provides 13 key peaks selected in this article, which were 358.3, 385.3, 396.4, 415.4, 422.3, 431.2, 469.4, 516.2, 558.2, 589.2, 616.2, 656.4 and 777.7 nm. These 13 key peaks we found in this article were similar to the wavenumbers of high loading PCs in our previous study. The atomic/molecular species corresponding to these key peaks were given in Supplemental Table S2. There are three spectral lines belonging to heteroatomic emission lines, which are Ca II (396.4 nm), Na I (589.2 nm),and Ca I (616.2 nm), respectively. It resulted in some samples used in the article, especially plastics. There are some additives that carry some heteroatoms in the process of plastic processing, such as fillers, plasticizers, stabilizers, colourants, flame retardants, etc. (Zeng et al., 2021). The content of additives is usually minimal. These heteroatoms usually show strong peaks in LIBS detection (Junjuri and Gundawar, 2019), making them difficult to be ignored by the automatic detection method of key peaks.
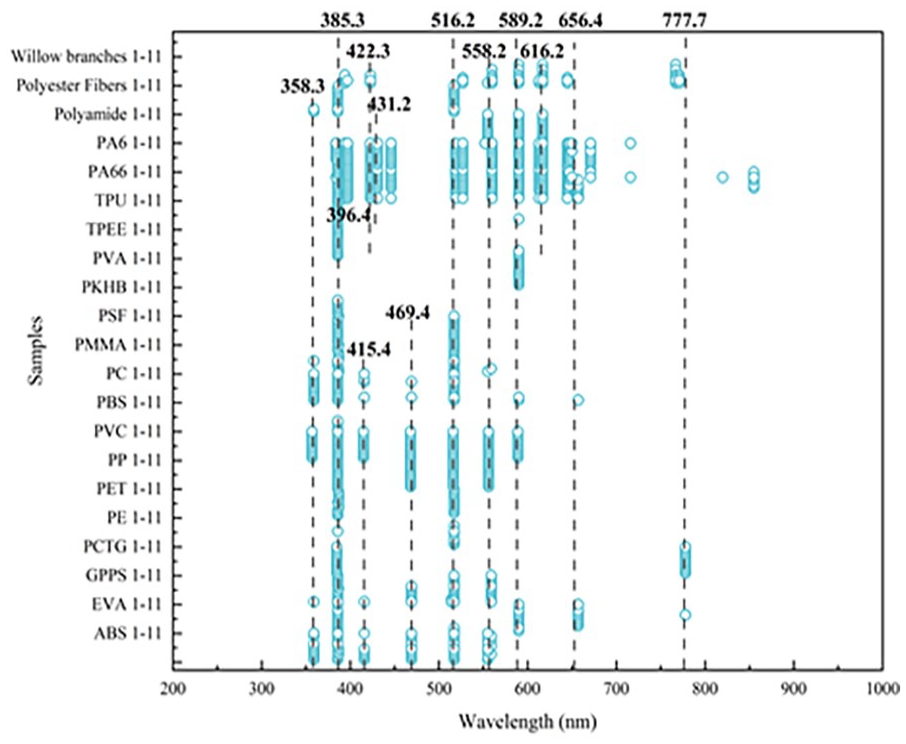
Thirteen key peaks selected with physicochemical meanings.
Since the heteroatoms were atoms existed in additional substances of pure materials, the input features were divided into 2 groups, 13 key peaks and 10 key peaks, except heteroatoms. Two groups were used as input to establish the classification and regression module, respectively, to explore the role of different radical species in the WOP fast characterization method and to explain the internal mechanism.
Hybrid model with input of selected features
The performance of characterization models with the input of selected features, 13/10 key peaks, was discussed to explore the effect of key LIBS peaks on the predictive process. As shown in Supplemental Table S3, the four assessment parameters (accuracy, precision, recall and F1 score) were all 100%, meaning all WOP samples were correctly classified. As for regression models, as shown in Figure 3(a), regression models with 10 key peaks have better performance. It was attributed to the heteroatoms in the 13 key peaks. In the optimal conditions, the MRE of carbon, hydrogen, oxygen content and LHV prediction was 2.26%, 8.78%, 8.72% and 2.98%, respectively. In addition, the optimal hybrid models showed great robustness. The relative errors of actual and predictive value for samples in the test set were around 3.00%, 14.54%, 7.33% and 3.24%, respectively, as shown in Figure 3(b).
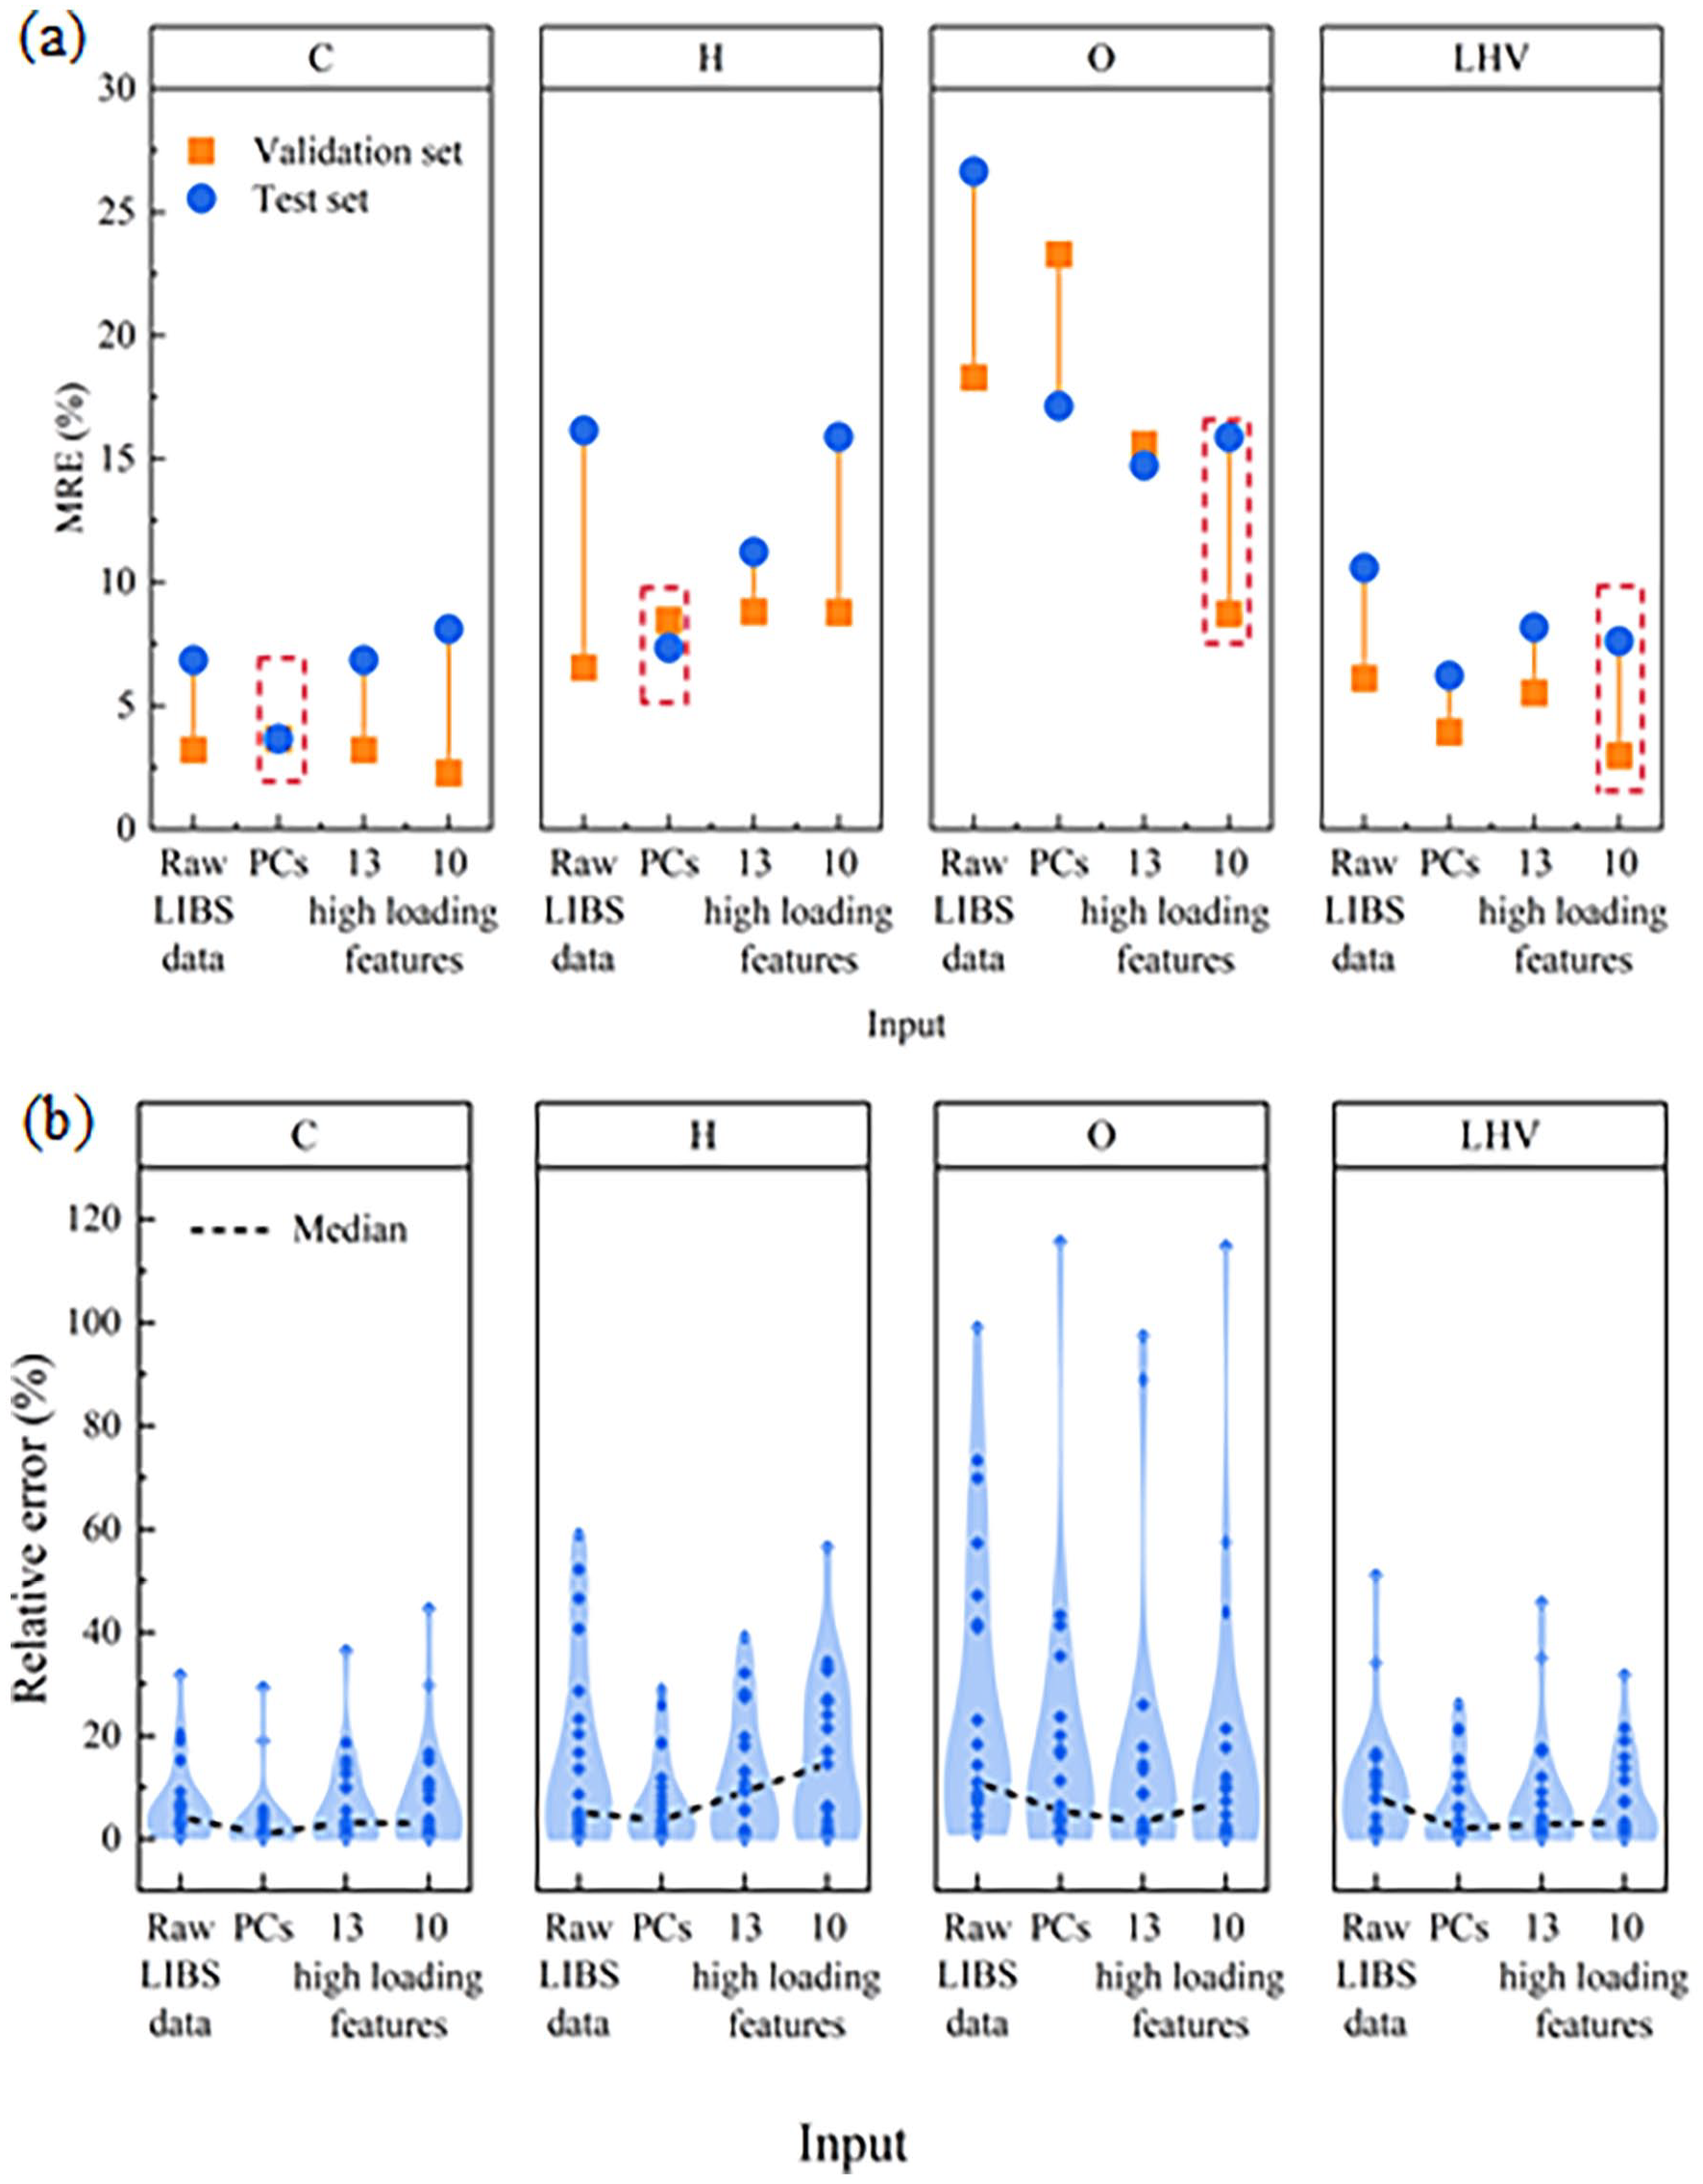
(a) Comparison of regression results with three kinds of inputs; (b) relative errors of final prediction results in test set with three kinds of inputs.
The proof of the availability of selected features
The fast characterization models with inputs of selected data have great performance. However, the availability of selected features cannot be proved simply by its single predicting performance. Therefore, WOP fast characterization models with other different inputs, raw LIBS data and PCs were constructed and used to analyse the availability of selected features by comparison.
Hybrid model with input of raw LIBS data
The optimal classification model with input of raw LIBS data has the same performance as models of selected features. The four assessment parameters of the classification module were all 100%. In the optimal conditions of the regression section with raw LIBS inputs (Figure 3(a)), the MRE of carbon, hydrogen, oxygen content and LHV prediction was 3.99%, 6.54%, 18.30% and 6.10%, respectively. The relative error of the final prediction value and actual value was also calculated to evaluate the robustness of the WOP characterization method, as shown in Figure 3(b). For carbon, hydrogen, oxygen content and LHV prediction, the relative errors of samples in the test set were around 4.26%, 5.21%, 11.02% and 8.16%, respectively. The detailed comparison of models with three different inputs was provided in the section ‘Comparison of models with three different inputs’.
Hybrid model with input of PCs
The performance of characterization models with the PCs input was discussed here. The PCs analysis of LIBS data could be seen in our previous study. Different from the previous study, k-fold cross-validation (Supplemental Text S1) was used in this article to avoid over-fitting. The k was set as 10. The number of PCs was set as 12, 9, 7 and 5, respectively, which was the optimal number of inputs for carbon, hydrogen, oxygen content and LHV prediction, respectively (Yan et al., 2021). The optimal classification model showed same great performance with three different inputs. The four assessment parameters of the classification module were all 100%. As shown in Figure 3(a), in the optimal conditions of the characterization method with the input of PCs, the MRE of carbon, hydrogen, oxygen content and LHV prediction was 3.66%, 8.46%, 23.29% and 3.93%, respectively. For carbon, hydrogen, oxygen content and LHV prediction, the relative errors of actual value and predictive value for many samples in the test set were around 1.01%, 3.65%, 5.41% and 2.03%, respectively, as shown in Figure 3(b). Performance of characterization models with PCs inputs in this article were compared with the fast characterization models without k-fold cross-validation method (Yan et al., 2021). Their classification performance was same. But predictive results of test set in models without k-fold cross-validation method were better, with 0.35, −0.46, 4.25 and 0.51 differences for carbon, hydrogen, oxygen content and LHV, respectively. It was attributed to the k-fold cross-validation method, which is helpful to avoid over-fitting. The detailed comparison of models with three different inputs was provided in section ‘Comparison of models with three different inputs’.
Comparison of models with three different inputs
Performance of WOP fast characterization models with different inputs was compared. Accuracy and robustness were two criteria to determine the optimal model. According to predicted results (shown in Figure 3), the novel dimension reduction method is a kind of great dimension reduction method. On the one hand, characterization models with inputs of selected 10/13 features work better than models with inputs of raw LIBS data. It indicated that the selected features are eligible to improve the accuracy of the machine learning model. On the other hand, characterization models with inputs of 10 features have similar great performance with the models with PCs inputs. For predictive accuracy alone, models with inputs of 10 features work better. If considering both accuracy and robustness, models with PCs input were optimal for carbon and hydrogen content prediction, and models with 10 key peaks were optimal for oxygen content and LHV prediction, as shown in Figure 3(a). It indicated that the selected features have proximate superiority with PCs.
In addition, the predicted results in test set of three kinds of WOP fast characterization models were compared with the actual results, as shown in Figures 3(b) and (4). The points of carbon, hydrogen, oxygen content and LHV in models with the input of PCs and selected feature were evenly distributed around line y = x. It showed that characterization models with inputs of preprocessed data by dimension reduction have better performance, which was attributed to the overfitting issue with the inputs of high dimensionality, as aforementioned. As for carbon and hydrogen content prediction, almost all the points with the input of PCs were within the 15% deviation line. As for oxygen content prediction, models had 1–3 outliers with four different inputs. The oxygen content predictive model with 10 key peaks had worse performance when oxygen content was high (> 42wt.%) in samples but better performance with low oxygen content. The oxygen content predictive model with PCs has exactly the reverse performance, better in high oxygen content and worse in low oxygen content. Oxygen content predictive models have worse performance than carbon, hydrogen content and LHV predictive models, and the relative errors were higher (Figure 3(b)). It was due to insufficient training data, and other materials with different level of oxygen content should be joined in the future. As for LHV prediction, models with PCs and 10 key peaks have similar performance, in which most points were within the 15% deviation line.
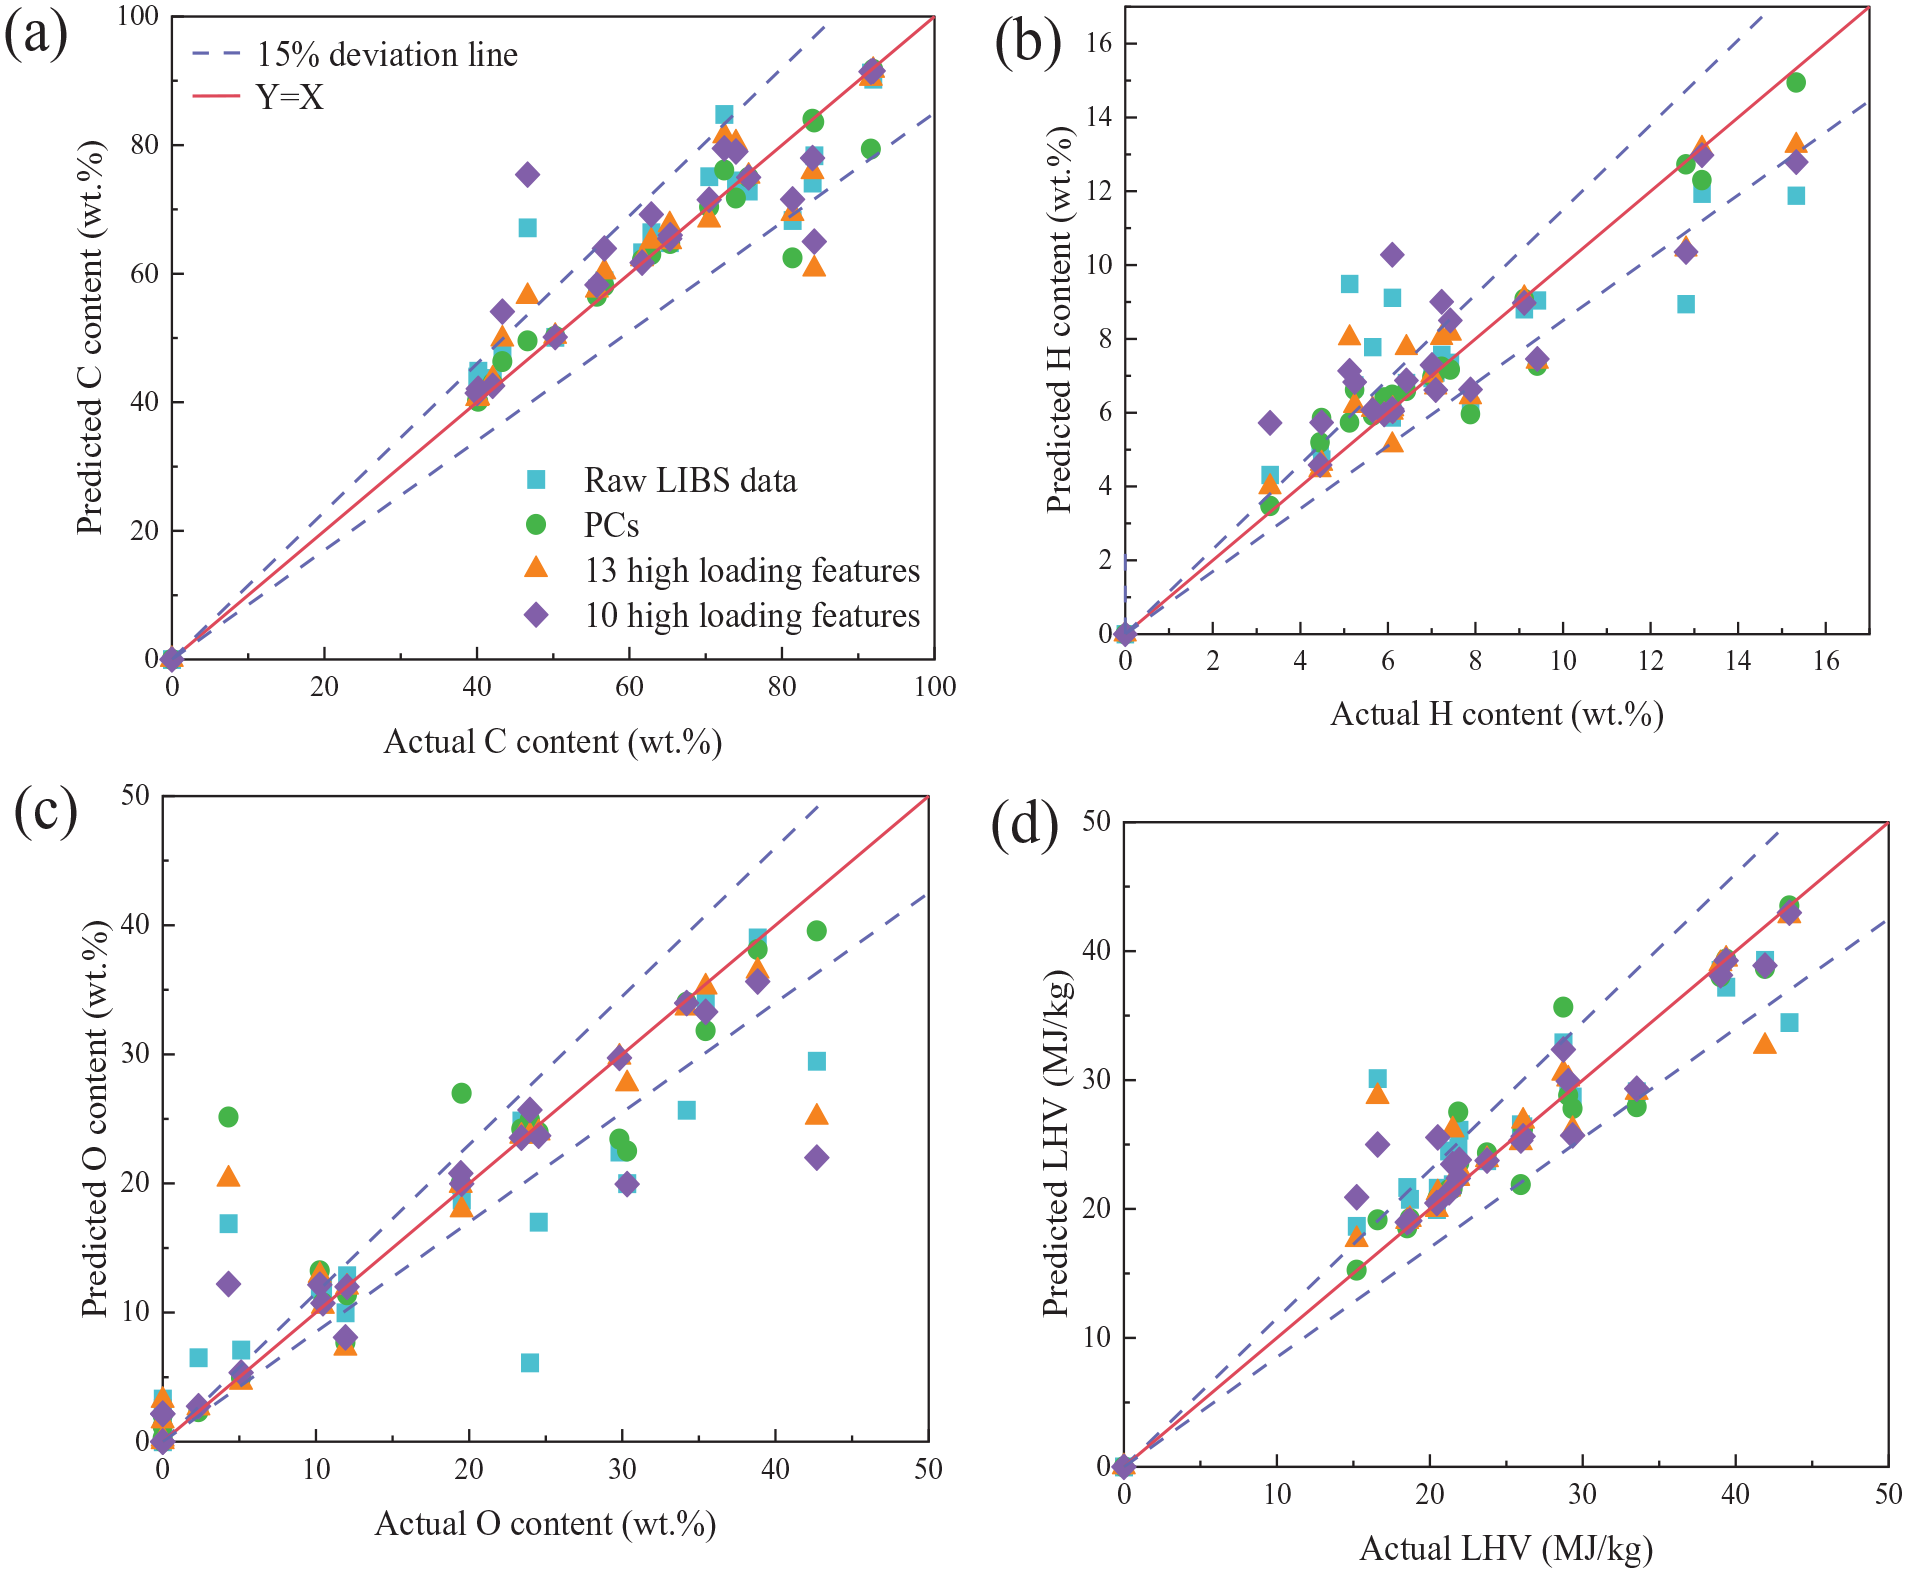
Parity plots of (a) carbon content, (b) hydrogen content, (c) oxygen content and (d) LHV.
++The different performance of these four kinds of characterization models was resulted of the differences in input information and the effect of data dimensions on model fitting. Raw LIBS data were the most comprehensive of these four kinds of inputs, but it will also cause some negative effects (Church, 2022). On the one hand, since machine learning does not understand the causation of independent variables and dependent variables, even if there is no causation, the model will try to map any feature in the dataset to the target variable, which can lead to model errors. On the other hand, input with high dimensionality can increase the sparsity of sample spatial distribution, the complexity of the model and the computation amount of the algorithm, which brings great difficulties to the calculation and storage of machine learning. Data preprocessing is helpful for this problem, which can retain the important information in the spectra while reducing the data dimensionality. Models with the input of preprocessed data have better performance than that of raw LIBS data. PCs extracted to establish the model contained over 99% (Supplemental Text S3) of information from the samples. The 13 key peaks were key peak lines of LIBS. According to literature, the commonly used atomic or molecular emission lines for waste (e.g. wood, plastic, fibre) identification (Liu et al., 2019; Sommer et al., 2021) were C I (247.8 nm), H I (486.14 and 656.29 nm), O I (777.3 nm), C2 swan band (around 470, 512 and 553 nm), CN violet band (around 360, 388.3 and 422 nm), CH band (around 431.27, 431.7 and 488.4 nm) and OH band (306.4–347.2 nm). But in these 231 WOP samples, some atomic or molecular emission lines were weak, such as C I (247.8 nm) and OH band (306.4–347.2 nm). As for feature selection, the weak emission lines are ignored in manual analysis. It caused the information in these weak but auxiliary emission lines not to be selected as inputs and train the characterization models. PCs contain information on other wavelengths besides these key emission lines. According to the predictive results, PCs and 10 key peaks were suitable for WOP fast characterization model establishment. In the optimal conditions, the prediction accuracy for carbon, hydrogen, oxygen content and LHV of unknown material could reach 96.35%, 92.67%, 84.11% and 92.38% (Supplemental Table S4). In addition, heteroatoms, Ca II (396.4 nm), Na I (589.2 nm) and Ca I (616.2 nm) have negative effects on regression models according to the results of models with 13/10 key peaks.
Effects of normalization strategy on the fast characterization method
Since the magnitude of spectral intensity in the original LIBS is different, data normalization is commonly used to eliminate this difference in the previous modelling process (Jin et al., 2023). Data normalization can change the input intensity from absolute height to relative height. Considering the quantitative analysis of LIBS, the intensity of the LIBS spectral line is proportional to the element content in the sample for the feature spectral line of a specific element. Accordingly, it is necessary to explore the influence of absolute height and relative height on fast characterization models, so as to understand the relationship between fuel properties and LIBS more clearly. Raw LIBS data and 10/13 key peaks were normalized, and then used as inputs to establish the WOP fast characterization models. The detailed results were shown in Supplemental Table S5 and Table 1.
The predicting results of regression models with normalized data.
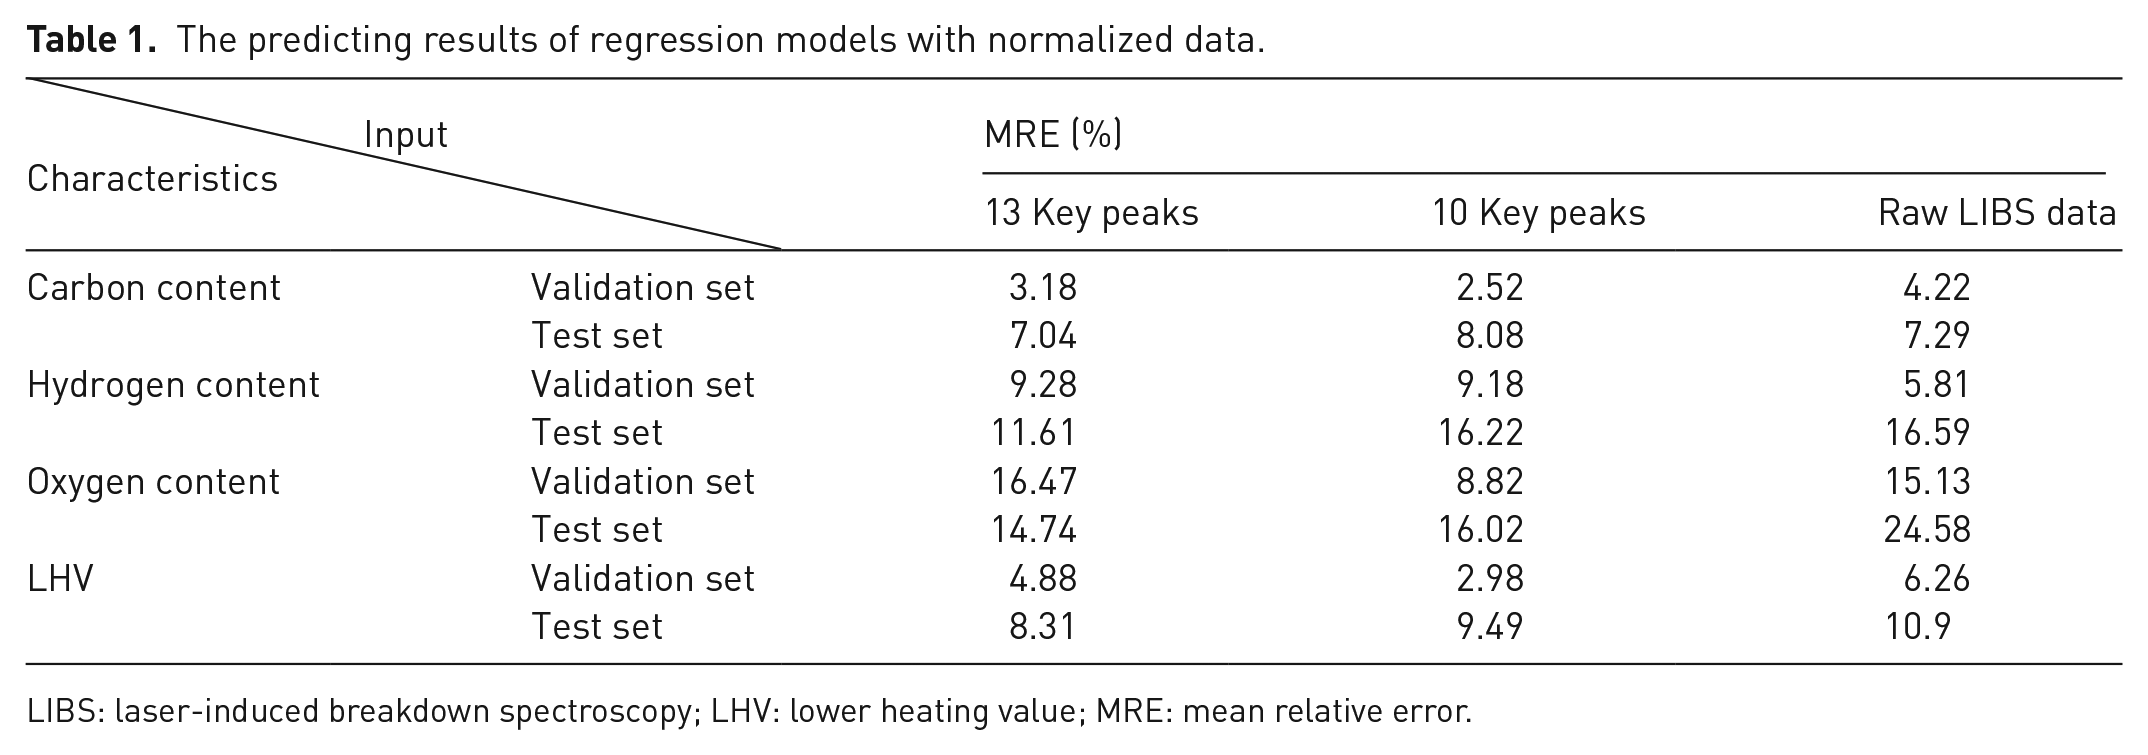
LIBS: laser-induced breakdown spectroscopy; LHV: lower heating value; MRE: mean relative error.
As shown in Supplemental Table S5, classification models with normalized data inputs were same with unnormalized data inputs. All WOP were classified correctly. As for regression models presented in Table 1, models with inputs of normalized 10 key peaks have the best performance. The accuracy for carbon, hydrogen, oxygen content and LHV prediction was 97.48%, 90.82%, 91.18% and 97.02%, respectively. Compared with models with inputs of unnormalized 10 key peaks, the regression performance was a little bit worse, with differences of 0.25, 0.40, 0.10 and 0 for carbon, hydrogen, oxygen content and LHV, respectively. It indicated that the absolute value of each LIBS peak will affect the performance of predicting models more. The difference between the characterization models with or without normalization is slight, and the normalization is not always favourable to the machine learning models, which is similar to the previous literature (Palásti et al., 2019).
Mechanism explanation of the characterization method
The availability of selected features was proved before. Then, selected features and their corresponding radicals were used to explain the causal relationship between the input variables (LIBS data) and the output variables (fuel properties), and then explore the chemical correlation between fuel properties of WOP and LIBS pattern towards energy utilization. The interpretation of the model with high accuracy has more practical significance. Characterization models with the inputs of unnormalized 10 key peaks have the best performance. LIBS emission lines on every wavelength represent particular information about the composition and atom/molecule contents.
The feature importance of 10 key peaks in the optimal hybrid prediction model was calculated to analyse the role of the key LIBS bands in the WOP fast characterization method, as shown in Figure 5. The radical at wavelength 469.4 nm was the most important input feature for carbon content prediction. The radical at wavelength 656.4 nm was the most important input feature for hydrogen prediction. The radical at wavelength 516.2 nm was the most important input feature for oxygen content prediction. The radical at wavelength 469.4 nm was the most important input feature for LHV prediction.
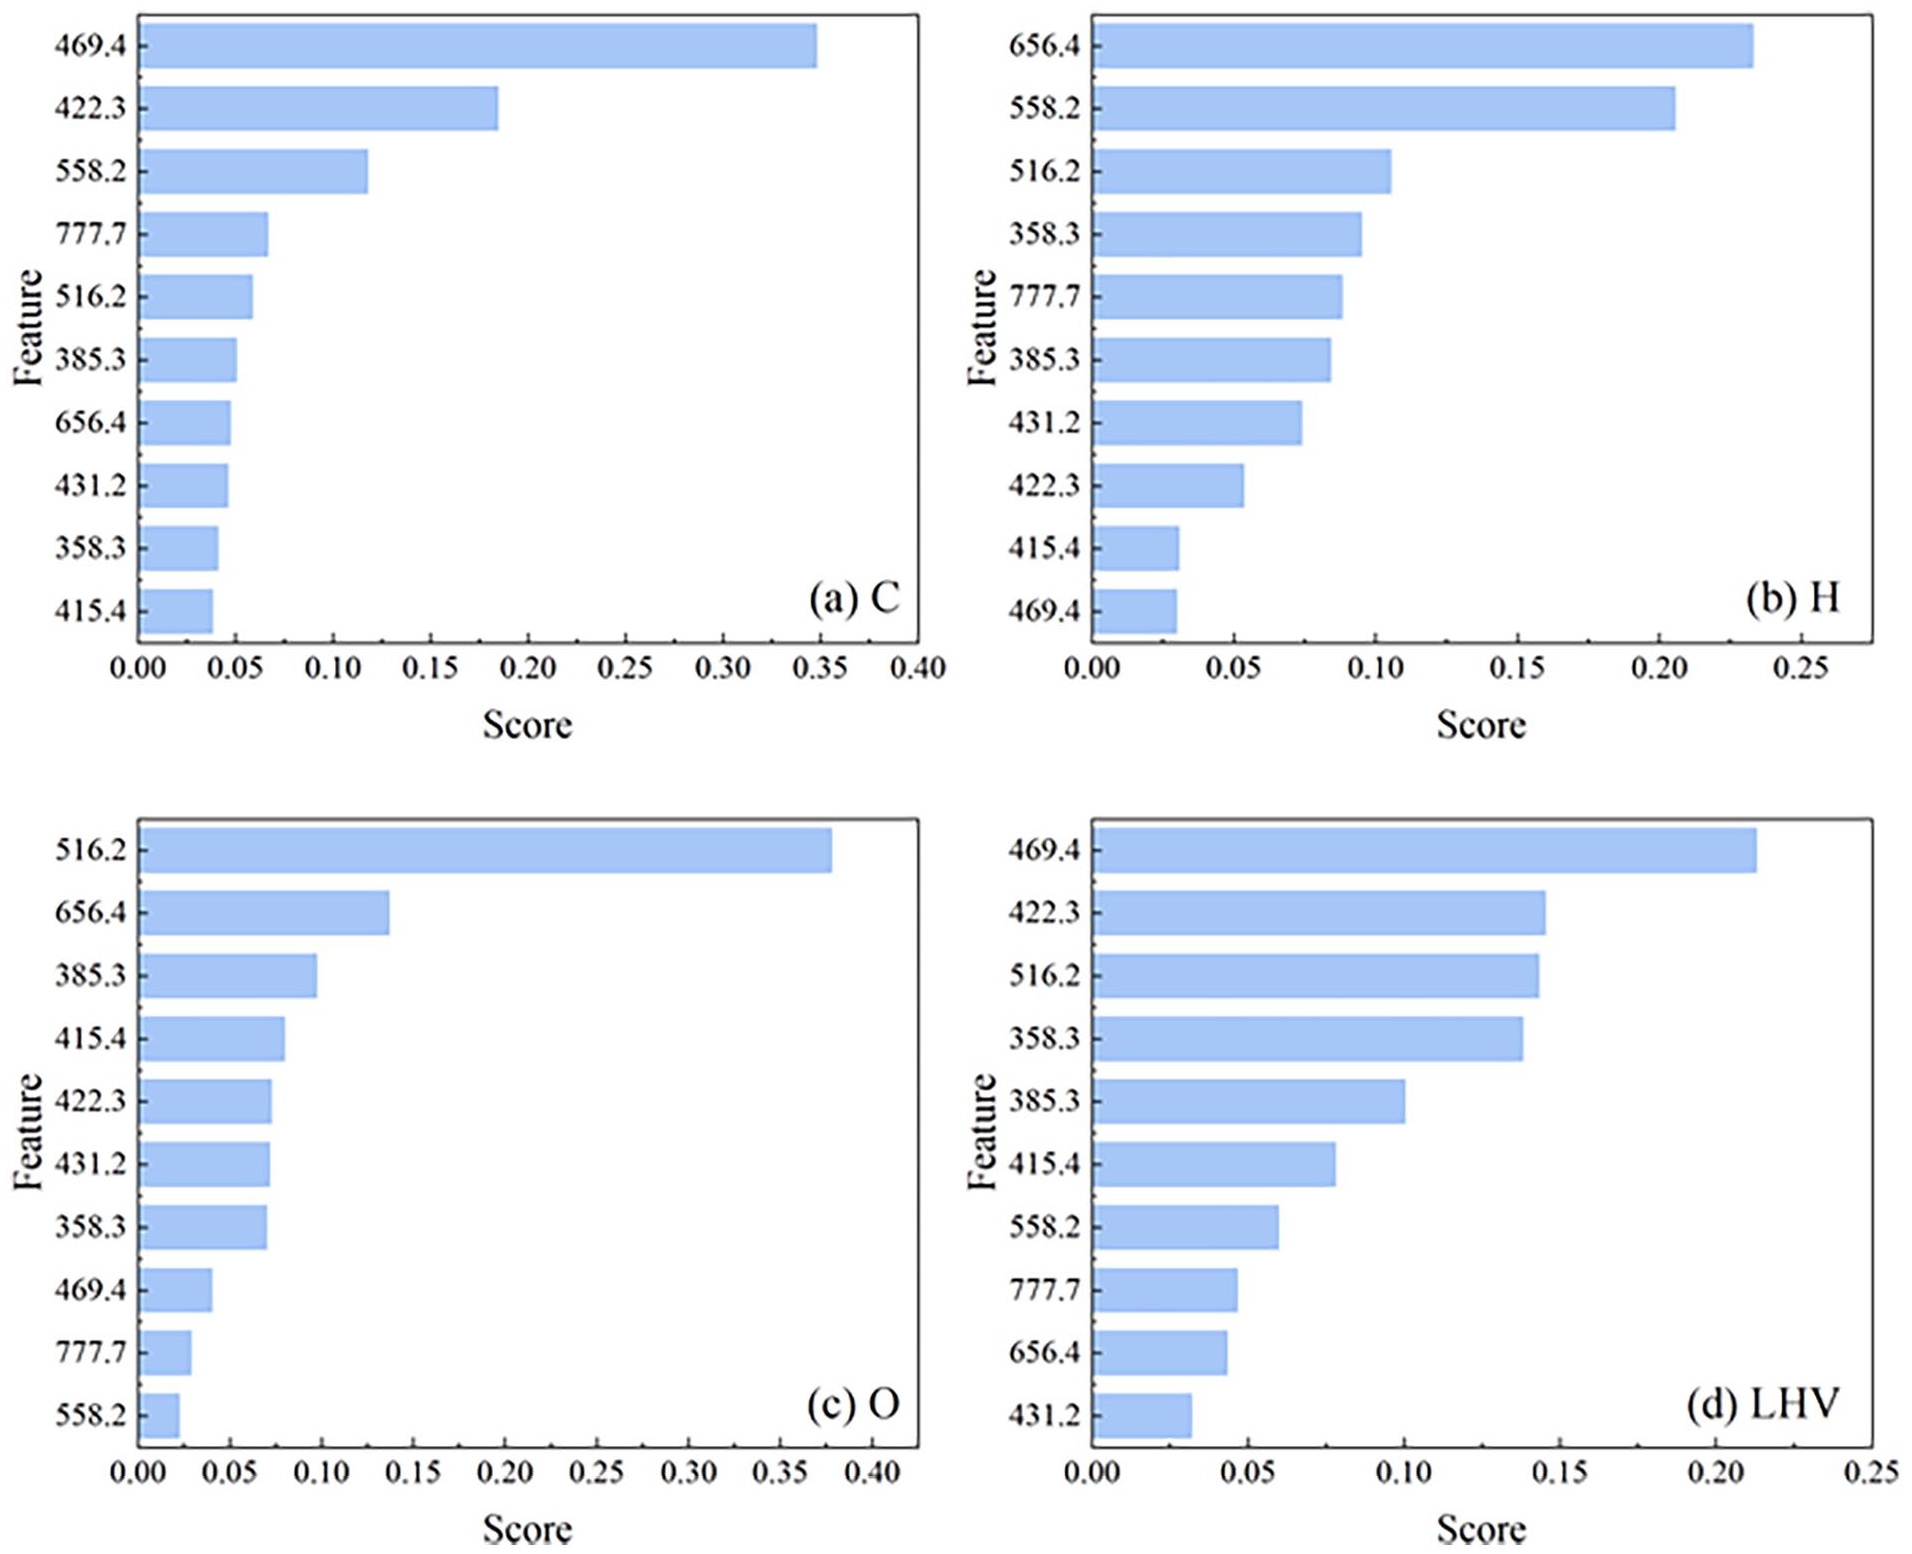
Feature importance of 10 key peaks for (a) carbon content, (b) hydrogen content, (c) oxygen content and (d) LHV prediction.
Figure 6 intuitively presents the correlation between key peaks, their corresponding radicals and four characteristic outputs. C2 swan and CN violet bands showed the highest impacts on carbon content prediction. The emission lines of C2 swan band were 469.4 (0.35), 558.2 (0.12) and 516.2 (0.06) nm, respectively, with a total importance score of 0.53. The emission lines of CN violet band were 422.3 (0.18), 385.3 (0.02), 358.3 (0.04) and 415.4 (0.04) nm, respectively, with the total importance score of 0.28. In terms of their formation mechanism, the specific function could be understood. C2 swan band emission can be from the electron collisional process through direct excitation or dissociation/recombination of C2 in the excited state (Kalam et al., 2017). CN violet band can be from the native CN bonds or other possible secondary sources to generate CN species, such as the reaction of C2 and C with N or N2, where the N or N2 comes from native samples or the ambiance (air) (Kalam et al., 2017). These two kinds of radicals reflect the native carbon content in samples and show essential roles in carbon content prediction.
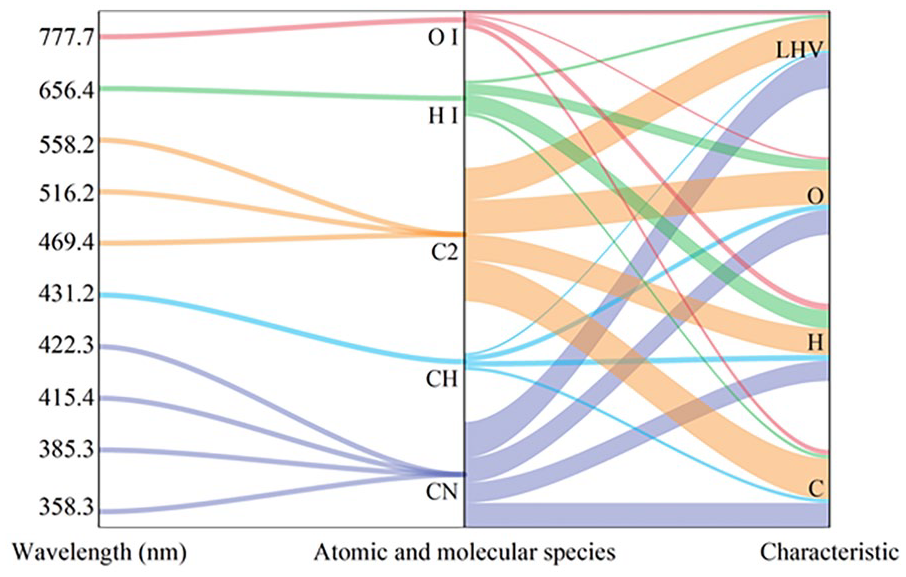
Explanation of the effects of key loading features on carbon, hydrogen, oxygen content and LHV prediction.
C2 swan, CN violet band and H I line showed relatively higher impacts on hydrogen content prediction. The emission lines of C2 swan band were 558.2 (0.21), 516.2 (0.11) and 469.4 (0.03) nm, respectively, with the total importance score of 0.34. The emission lines of CN violet band were 358.3 (0.10), 385.3 (0.08), 422.3 (0.05) and 415.4 (0.03) nm, respectively, with a total importance score of 0.26. The next one was H I radical (656.4 nm), with the importance score of 0.23. H I was more important because the sum of several C2 swan and CN violet bands showed important roles, but the score was just a little more significant than H I. CH band showed little effect on H prediction. It is from the release of CHn fragments by ladder switching reaction and has relatively weak intensity (Delgado et al., 2022). In addition, the mass fraction of H element in CHn is small, which is one reason for its low effect on H prediction.
C2 swan band showed relatively higher impacts on oxygen content prediction. The emission lines of C2 swan band were 516.2 (0.38), 469.4 (0.04) and 558.2 (0.02) nm, respectively, with a total importance score of 0.43. O I (777.7 nm) showed little effect on oxygen content prediction. It was because the O I radical was mainly from the ionized air around the sample. And the spectral intensities of oxygen observed in the LIBS correspond to the contribution of the sample and surrounding air (Junjuri et al., 2019).
C2 swan band and CN violet band showed relatively apparent effects on LHV prediction. The emission lines of C2 swan band were 469.4 (0.21), 516.2 (0.14) and 558.2 (0.06), respectively, with a total importance score of 0.41. The emission lines of CN violet band were 422.3 (0.15), 358.3 (0.14), 385.3 (0.10) and 415.4 (0.08) nm, respectively, with a total importance score of 0.38. It indicated the important significance of carbon element in LHV prediction. Carbon element is the main combustible component of organic matter, and the C content plays an important role in the LHV calculation.
Future perspectives
The interpretability analysis revealed chemical correlations between radical-related LIBS peaks and WOP fuel properties, providing theoretical validation for LIBS-based rapid characterization systems. In future perspectives, there are several directions that can be further explored. Firstly, the physical loss function can be employed to elucidate this chemical relationship more explicitly. Secondly, although infrared spectra, Raman spectra and LIBS are commonly used technologies for constructing rapid characterization models, their prediction accuracies vary. In future studies, the coupling of different spectra may be attempted to construct more efficient characterization and classification models.
This mechanistic understanding thereby enhances reliability of such systems in practical applications. A novel WOP classification system and mass utilization mode were proposed (Figure 7). Based on the interpretable rapid characterization method, we can in-situ obtain elemental composition and heating value of WOP in few seconds. They were set as novel classification criterion to instruct waste sorting, differ from the conventional criteria, appearance or density. Then new WOP categories were separately utilized according to their own chemical properties. The operating conditions enables real-time adjustment according to variations of the WOP fuel properties. It is assumed that in chemical recycling utilization plants with this novel mass utilization mode, energy conversion efficiency can achieve a 10% enhancement (Liang et al., 2024).
Mass utilization of WOP according to characteristics.
Conclusion
This article established a mechanistic framework correlating LIBS spectral peaks with fuel properties of WOP and explored the interpretability of machine learning models. Thirteen key peaks closely related to specific molecular groups and atomic lines were selected and divided into two groups to construct rapid characterization models. In addition, the absolute value of LIBS intensity has a more significant impact on the accuracy of WOP characterization models. Under the optimal condition, predicting accuracies of carbon, hydrogen, oxygen content and LHV reached 97.74%, 91.22%, 91.28% and 97.02%, respectively. Compared with models with raw LIBS data or PCs inputs, rapid characterization models with selected 10 key peaks exhibited superior performance, with the absolute difference reaching 14.57% for O content prediction. Therefore, key LIBS features were feasible for machine learning interpretability. The radicals related to fuel properties offer information for the prediction of carbon, hydrogen, oxygen content and LHV prediction. The C2 swan bands had the most substantial effects on carbon content, oxygen content and LHV prediction, whereas H I line was essential for hydrogen content prediction.
This article offers interpretability for the rapid characterization model, enhancing its credibility and expanding its application scopes. It is not only applicable in the prediction of fuel characteristics for efficient WOP chemical recycling but also in various resource recycling scenarios such as mineral resource classification, electronic waste identification, old metal recycling, industrial solid waste recycling and others. Different materials (minerals, metals, coal gangue, red mud, etc.) possess distinct properties. Identifying the properties of each component, utilizing them separately (through upcycling or chemical recycling) and integrating them into a ‘resource products – renewable resources – renewable products’ material repetitive circulation process. It is of substantial significance for the sustainable development of the global economy, resources and environment.
Supplemental Material
sj-docx-1-wmr-10.1177_0734242X251340332 – Supplemental material for A mechanism study on laser-induced breakdown spectroscopy and machine learning-based characterization method for waste organic polymers
Supplemental material, sj-docx-1-wmr-10.1177_0734242X251340332 for A mechanism study on laser-induced breakdown spectroscopy and machine learning-based characterization method for waste organic polymers by Rui Liang, Chao Chen, Junyu Tao, Wei Guo, Yaru Xu, Xiaoling Hao, Yude Gu, Beibei Yan and Guanyi Chen in Waste Management & Research
Footnotes
Declaration of conflicting interests
The authors declared no potential conflicts of interest with respect to the research, authorship, and/or publication of this article.
Funding
The authors disclosed receipt of the following financial support for the research, authorship, and/or publication of this article: This research was supported by the Ministry of Science and Technology of the People’s Republic of China (2022YFE0206900), the National Natural Science Foundation of China (No. 52100157) and Chinese Academy of Engineering Strategic Research and Consulting Project (No. 22ZLGCGX00020).

Data availability
Data will be made available on reasonable request.
Supplemental material
Supplemental material for this article is available online.
References
Supplementary Material
Please find the following supplemental material available below.
For Open Access articles published under a Creative Commons License, all supplemental material carries the same license as the article it is associated with.
For non-Open Access articles published, all supplemental material carries a non-exclusive license, and permission requests for re-use of supplemental material or any part of supplemental material shall be sent directly to the copyright owner as specified in the copyright notice associated with the article.
