
Abstract
India’s informal waste sector (IWS), embedded in the shadows of urban metabolism, remains vital yet systematically marginalised. Despite the sector’s unprecedented contribution to the circular economy and resource recovery, it is highly vulnerable to socio-economic challenges and occupational marginalisation. This research presents a comprehensive vulnerability assessment across four strategically selected Indian cities – Nagpur, Mumbai, Ghaziabad and Muzaffarnagar – chosen to reflect geographical and infrastructural diversity. Primary data were collected through surveys and stakeholder interviews. The analysis focused on key parameters including age, wage levels, gender distribution, working hours and the use of personal protective equipment. Based on these indicators, a weighted vulnerability index (WVI) was developed through normalisation and expert-informed weight allocation, enabling the quantification of socio-economic and occupational risks in the study areas. To strengthen the robustness of the findings, the WVI results were also cross-validated using the technique for order of preference by similarity to ideal solution (TOPSIS) technique of multi-criteria decision analysis (MCDA). Both approaches converged in identifying Muzaffarnagar as the most vulnerable (WVI score = 0.71; TOPSIS closeness coefficient (CC) = 0.535) and Mumbai as the least vulnerable (WVI = 0.25; TOPSIS CC = 0.666), with only minor differences in the relative ordering of Nagpur and Ghaziabad. The study thus offers a transferable methodological framework that combines expert-driven weighting with MCDA validation, providing important insights into the precarious working conditions of IWS. The findings underscore the urgent need to integrate informal waste management into formal governance structures through inclusive, rights-based and spatially contextualised policy interventions.
Keywords
Introduction
In the rapidly growing and urbanising world of the 21st century, waste generation has become a critical global problem. The impacts are particularly severe in low- and middle-income countries, where institutional capacity and infrastructure are limited, and the overall effectiveness of waste management is compromised. Due to inadequate infrastructure in many low- and middle-income countries, a significant percentage of waste is disposed of through open dumping or burned, exacerbating environmental and health problems (Drall et al., 2025; Ministry of Housing and Urban Affairs [MoHUA] Advisory, 2020). Rapid urbanisation and economic development in countries like India have significantly contributed to an increase in the amount of municipal solid waste (MSW) generation. The evolving consumer lifestyle and wealth generation sources lead to the quantum generation of MSW annually (Alam et al., 2020). India generated about 58.41 million tonnes of waste per year during 2020, up from 47.3 million tonnes in 2011 (Central Pollution Control Board [CPCB], 2020; Kumar and Agrawal, 2020). At the same time, the urban areas of India generate about 54.75 million tonnes of MSW annually (MoHUA, 2021). If the current trends persist, urban MSW will reach 165 million tonnes by 2030, 230 million tonnes by 2041 and 436 million tonnes by 2050 (CPCB, 2020; Sharma and Jain, 2018). With this generated waste, the management sector plays a vital role, involving both formal and informal waste workers.
The increasing pressure on the urban waste management system exposes the limitations of formal waste infrastructure and underscores the critical role of informal workers in sustaining the urban waste flows. This growing volume places immense pressure on waste sorting, segregation, transportation and disposal systems. Formal waste management infrastructure often cannot handle such high volumes alone. The informal waste sector (IWS) in developing countries like India has been embedded in the shadow of urban metabolism and yet remains vital and systematically marginalised (Sharma and Jain, 2018; Zhang et al., 2024). Workers in the informal sector in India are generally from urban poor and marginalised communities, relying on waste picking activity as their primary and sometimes sole source of livelihood (Singh et al., 2023). These workers often face vulnerabilities and insecurities due to their occupation in modern society, as they are from marginalised communities and face significant exacerbation by their exclusion from formal waste management policies. Waste in many developing nations is not merely a pollutant, but it is a resource that supports a significant proportion of the population with employment and income opportunities (Masood and Barlow, 2013). Despite their indispensable role, the absence of formal policy recognition intensifies the challenges faced by these workers. Disjointed and poorly coordinated waste management policies fail to acknowledge informal workers, resulting in their exclusion from essential legal protections, social security benefits and public health schemes (Singh, 2021). Consequently, they are routinely exposed to health hazards, such as sharp objects and toxic chemicals, without proper personal protective equipment (PPE; Annamalai, 2015; Sengupta et al., 2023). The lack of laws that formalise and regulate informal waste picking further restricts their access to improved working conditions, stable income and long-term employment. This exclusion perpetuates a cycle of poverty, unstable livelihoods and limited opportunities for social mobility (Kala and Bolia, 2024; Kala et al., 2022). Moreover, fragmented policy implementation hampers the development of a sustainable waste management system and obstructs the potential for cooperative models or government partnerships that could integrate informal waste workers into the formal system.
While interest in urban sustainability and circular economy frameworks is growing, most of the studies on informal waste workers in India tend to treat them as a homogenous group, primarily highlighting their contributions to recycling and waste recovery (Aparcana, 2017; Masood and Barlow, 2013). These narratives often overlook the complex intra-group vulnerabilities arising from socio-economic status, gender, age, occupational health risks and spatial disparities (Zolnikov et al., 2021). Although some frameworks assess community-level risks or employment trends within the waste sector, few offer quantifiable, comparative tools designed to capture localised vulnerability differences within the informal waste economy. A key methodological gap exists in the lack of an index-based, multidimensional assessment model that reflects the layered risks faced by informal waste workers across varied urban geographies. While existing vulnerability indices in environmental and social sciences (e.g. for climate change, livelihood vulnerability index) provide useful precedents, they have seldom been adapted to the urban waste sector (Awasthi et al., 2021; Hahn et al., 2009; Kumar and Mohanasundari, 2025).
Therefore, the goal of the study was to assess the strengths, weaknesses, opportunities and threats (SWOT) with a specially designed model, named the weighted vulnerability index (WVI), to identify the gaps between the current socio-economic and occupational marginalisation among informal waste workers in four Indian cities namely Nagpur, Mumbai, Ghaziabad and Muzaffarnagar. To enhance methodological robustness, the WVI results were also validated using the technique for order of preference by similarity to ideal solution (TOPSIS) technique of multi-criteria decision analysis (MCDA), which compares alternatives based on their relative distance from ideal best and worst conditions. This dual approach provides a novel bridge between quantitative vulnerability findings and strategic city-specific policy insights, enhancing both the academic rigour and practical relevance of the research. It not only deepens the diagnostic capacity but also ensures robustness of results, thereby yielding actionable outcomes that contribute to both academic discourse and policy-making in urban waste governance.
Materials and methods
Study area
The study was conducted across four cities in India, that is, Nagpur, Mumbai, Ghaziabad and Muzaffarnagar, which were selected on the basis of their population size, degree of urbanisation, waste generation capacity and the involvement of informal waste workers. The operational and geographical contexts differ notably across the selected locations, for example, Nagpur, located in central India at an elevation of 310 m, influences local waste handling conditions (Central Ground Water Board, 2013) and its extreme summer temperatures of over 47°C increase occupational risks for waste sector workers (Drall et al., 2025). Mumbai, with densely urban development and major dumping grounds, such as Deonar landfill, exhibits a complex, multitiered waste flow system heavily dependent on informal recycling. In Ghaziabad, the city generates approximately 1100–1200 tonnes of MSW day−1, which is centred on the Makraida and Pratap Vihar dumping sites (National Green Tribunal, 2022), whereas in Muzaffarnagar, the waste collection system led to the movement of 300–400 tonnes of daily waste to the Khalapar dumpsite under the municipal framework (MoHUA, 2022). For the study, field sampling visits were conducted during November 2024 and March 2025 across landfill surroundings, worker habitations, street-level collection routes and transfer stations where informal waste activities are concentrated via questionnaires and interviews (Al-Khatib et al., 2020b). The informal waste workers were selected through purposive sampling to capture the socio-spatial distribution of informal waste work across all four cities, as illustrated in Figure 1.
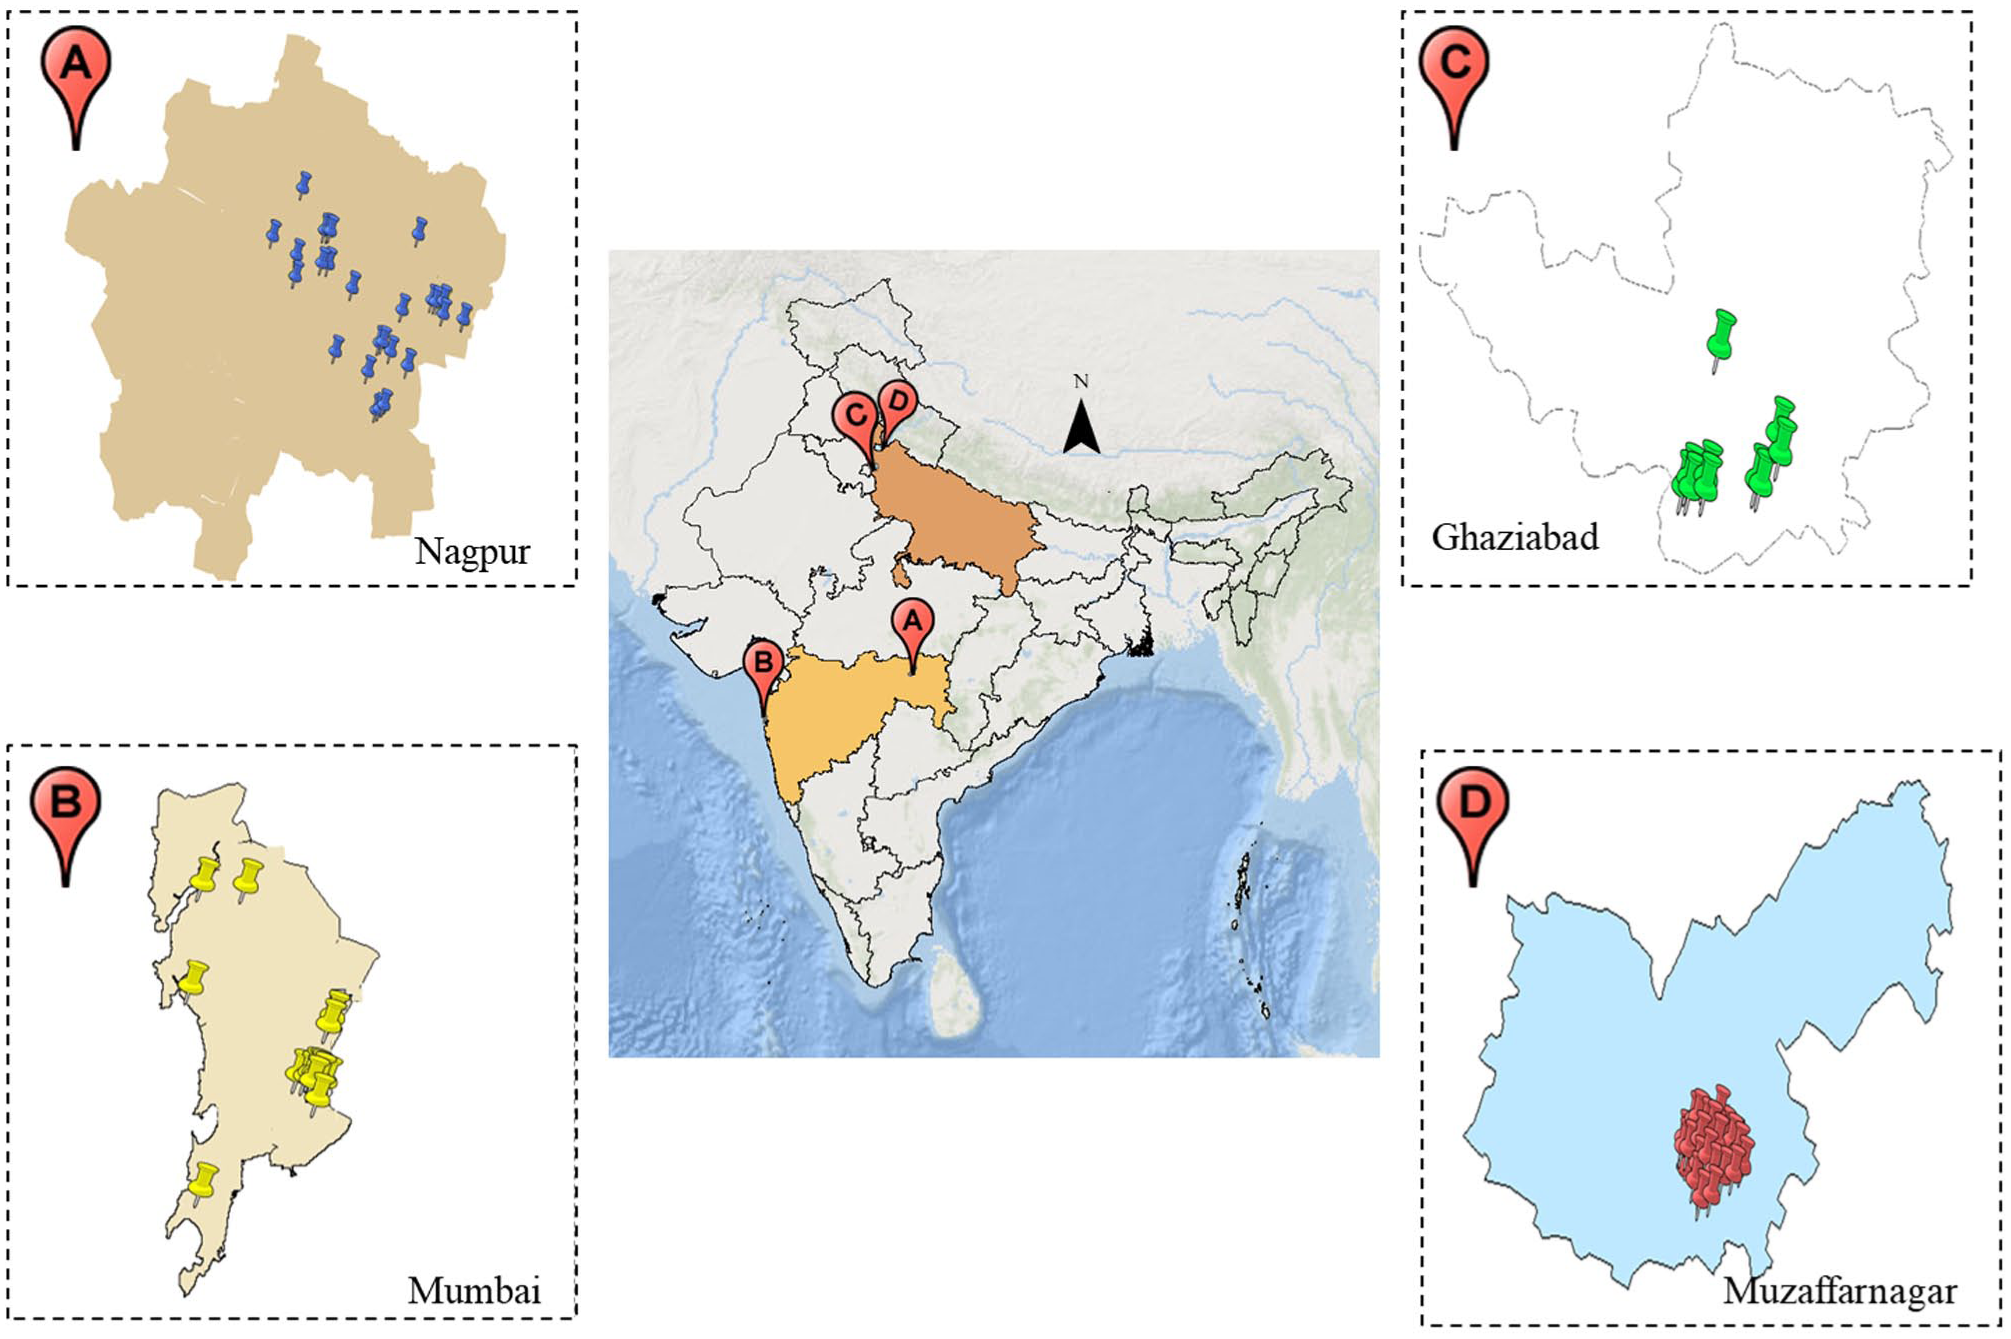
Map showing the studied cities in India: (a) Nagpur, (b) Mumbai, (c) Ghaziabad and (d) Muzaffarnagar.
Data collection
In all 4 study areas, over 400 survey forms were completed. These were primarily collected from the vicinity of landfills, neighbourhoods and from the transfer stations or aggregation points where informal waste activities are concentrated. Survey forms (questionnaires) and one-on-one interviews with key stakeholders were carried out across all the study areas. All the respondents submitted a structured questionnaire that collected quantitative data on age, gender, working hours, wages, PPE use and waste handling practices. In addition to the questionnaire, semi-structured interviews were conducted with the same workers, municipal officials, transfer station supervisors and informal-sector intermediaries. Interview notes were analysed thematically, enabling the identification of recurring patterns and triangulation with the quantitative survey results.
Parameters for primary data collection
The study focused on collecting primary data through structured surveys and field observations. However, only those most relevant to understanding the structure, challenges and dynamics of the IWS were selected for detailed analysis (Raza et al., 2018). The main criteria for selecting these parameters were to reflect the socio-economic conditions, occupational risks and material flow handled by the informal waste workers across the studied areas (Owusu-Sekyere and Aladago, 2023). The key parameters include the following:
Age of waste workers: It was selected to identify the trend on the basis of generation and to find out the dependency on informal workers across different age groups.
Gender of respondents: It was analysed to understand the gendered nature of waste work and inform inclusive policy measures.
Working hours and wage distribution: It was evaluated to assess the overall income conditions for the workers working in this sector and to assess the pattern and the economic vulnerabilities.
Use of PPE: To examine the occupational health conditions and extent and to find the correlation with the type of waste collected and associated health risks.
Whereas, parameters like education level, type and quantity of waste handling, caste representations and awareness about government schemes were recorded, used contextually rather than as primary variables for the analysis.
Integrated socio-spatial assessment framework
Primary data collected in all four study areas were systematically compiled and evaluated for quantitative and qualitative analyses. Given the diversity of the parameters analysed and their varying socio-economic and operational importance, a multi-level approach was adopted to study trends, interdependencies and potential vulnerabilities in the informal waste management sector (Lyamu, 2023). Graphical representations, such as bar and heat charts were developed to show the distribution of important parameters such as age, wage distribution, gender, use of PPE and working hours. These parameters were assigned weighted values based on their relevance to work-related stress and socio-economic risks. Depending on the data type, correlation coefficients were used to draw meaningful inferences about relationships and to ensure robustness by appropriately handling ordinal and interval data, presented in the form of heat maps. These values were standardised to create a comparable vulnerability index for each city (Balica et al., 2012). All statistical calculations and visualisations were performed using Microsoft Excel (Microsoft Corporation, Redmond, WA, USA), Python (Python Software Foundation, Wilmington, DE, USA) and rcGIS (ArcMap version 10.5 (Esri, Redlands, CA, USA) for spatial mapping.
Weighted vulnerability index
To assess the systematic socio-economic vulnerability across the four studied cities for informal waste workers, a new method was developed to assess these different parameters, named WVI. It is an index method used to assess the vulnerability at a multidimensional level by integrating socio-economic, health and labour-related risk factors (Gallardo, 2020). This allows a comparative assessment of risk across regions and helps to establish guided and targeted policy interventions (Kalli and Jena, 2021; Kumar and Srivastava, 2021). The WVI combines normalisation and weighted aggregation to transform heterogeneous indicators into standardised metrics.
Rationale and indicator selection
Five major critical parameters were identified, based on the primary survey data collection, with relative weightage assigned to each parameter. This weightage was derived through expert consultations, interviews with the key stakeholders and non-governmental organisations (NGOs) representatives, ensuring the assessment reflects practical, field-based insights on occupational risk and socioeconomic insecurity. The relative weight percentages and particular remarks related to the weightage are presented in Supplemental Table S1.
Data normalisation and scoring
To determine the WVI, it is important to address the heterogeneity in units and scales across all the selected vulnerability parameters. Each indicator was normalised to a common range of 0 (less vulnerable) to 1 (more vulnerable) by using min-max scaling (Human Development Report, 2021; Organisation for Economic Co-Operation and Development, 2008). This normalisation technique helps to ensure comparability and eliminates bias due to differing measurement scales. Equation (1) illustrates the normalisation formula used for adjusting minimum and maximum values across the studied parameters.

where,
Nij = normalised value of city i and parameter j
Xij = raw percentage value from primary survey data
Xjmin, Xjmax = minimum and maximum values of that parameter across all cities
Final vulnerability index calculation
To calculate the final vulnerability index for the IWS with major contributors for each study area, the WVI was calculated using the weighted sum formula as presented in equation (2). The resulting index score ranges from 0 (less vulnerable) to 1 (more vulnerable), reflecting the relative vulnerability level, with a higher value indicating a greater socio-economic and occupational risk. The equation was derived from the study conducted by Hahn et al. (2009) and Kumar and Srivastava (2021), in which it was used to assess groundwater vulnerability in Africa and livelihood vulnerability due to climate change.

where,
WVIi = weighted vulnerability index for city i
Wj = weight assigned to parameter j
Nij = normalised value of city i and parameter j
Multi-criteria decision analysis
To compare the results obtained from the developed WVI model, they were evaluated against a predefined method known as MCDA, thereby strengthening the robustness of the vulnerability analysis. In the MCDA method, the techniques adopted for this study are the TOPSIS, in parallel with the developed method (Kumar et al., 2022). Inclusion parameters, which were used for TOPSIS, are the same as those chosen for the WVI to maintain consistency (i.e. age >60 years, wage < ₹300 day−1 (3.3 USD day−1), absence of PPE, female participation and working more than 9 hours day−1) and their corresponding weights, illustrated in Supplemental Table S1, were used as inputs. Indicators were encoded as follows: female participation was treated as a benefit criterion (higher reduces vulnerability); age above 60, working for more than 9 hours day−1 (sum of 9–10 and 10–12 hours categories), wage less than 300 day−1 (3.3 USD day−1) and the absence of PPE kits were treated as the cost criteria (higher increases the vulnerability). Fixed waste workers (FWWs) and itinerant waste workers (IWWs) values were first compounded for each city; city-level TOPSIS scores were then obtained as the arithmetic mean of the two groups’ scores (to provide a single intercity ranking).
In TOPSIS, each city is compared to an ideal best (lowest vulnerability) and an ideal worst (highest vulnerability). The procedure involves four main steps (Han et al., 2024):
Normalisation: The raw decision matrix was converted to a normalised matrix using vector normalisation, ensuring comparability across different indicator scales (Bouhedja et al., 2024; Vafaei et al., 2022).

where,
rij = normalised value of city i for criterion j
xij = performance value of city i on criterion j
n = number of criteria (indicator)
Weighting: Each normalised indicator was multiplied by its assigned weight to form the weighted decision matrix (Bathaei and Streimikiene, 2025):

where,
wj = weight assigned to criterion j (with
vij = weighted normalised value of city i for criterion j
Ideal solutions and distances: For each indicator, the ideal best and ideal worst values were determined according to the following criteria (Bathaei and Streimikiene, 2025): • For benefit criteria (e.g. female participation): • For cost criteria (e.g. age >60, absence of PPE):
where,
• Each city’s separation from these reference points was then calculated using Euclidean distance:


where,
Closeness coefficient (CC): The final score was obtained as illustrated in equation (7) (Bathaei and Streimikiene, 2025):

where,
CCi = closeness coefficient for city i, ranging between 0 and 1.
A higher CC indicates that the city is closer to the ideal (less vulnerable).
Results and discussion
Overview of the IWS across the study areas
The study highlights the pivotal role played by the IWS in the overall solid waste management ecosystem. The four studied areas, namely Nagpur, Mumbai, Ghaziabad and Muzaffarnagar, help to uncover the overall important role of the IWS and its workers. On the basis of the primary data collection, through field survey and stakeholder interviews, it provides a comparative snapshot of the overall informal waste workers across the study areas. The total number of survey forms and interviews with stakeholders was more than 500, which includes respondents from both FWWs engaged in waste collection from fixed points such as transfer stations and landfills and IWWs (involved in waste picking by roaming around different locations, including streets, home-to-home waste picking, etc.).
Nagpur, as a city, demonstrated very well in terms of contributions to the waste workers. There were several NGOs that were actively working for the informal waste workers by engaging them with a proper collection system and by providing identity cards. It also shows that interventions of policy are reaching waste workers, but systemic gaps persist in service inclusion and welfare coverage. Whereas in Mumbai, being a metropolitan city and the financial capital of the country, it performed very little as compared to Nagpur, as during the field visits and output from waste workers, it was found that they are not connected with any NGO. As the majority of NGOs working in Mumbai are focused on other cleaning initiatives, such as gender based and Swachh Bharat schemes, which showed a relatively less organised IWS and result in a lack of formal recognition in municipal planning. Whereas for Ghaziabad, it was found that the informal waste structure in the city was organised as compared to Muzaffarnagar. The daily collected waste was also transferred via closed trucks from the transfer station to the landfill, where further segregation of waste was performed by using heavy machinery. Although IWWs used to collect waste from open transfer stations and some common community dumping points. In Muzaffarnagar, the waste was temporarily stored in an open area to collect the recyclable material, and from there it was transported to the dumping ground. Manual segregation of recyclables was done at the temporary storage area. The workers engaged in informal waste management in the city play a crucial role in resource recovery from the daily generated waste.
Field data also indicated that a substantial proportion of the waste-related activities in all four cities are executed by informal actors who are often self-employed, paid on a piece-rate basis, or dependent on the middleman. Though the contribution by the informal sector is unquantified in formal municipal data, it contributes significantly to the resource recovery and diverts waste from landfill to the formal waste system in all the cities. It was found that in cities like Mumbai and Nagpur, the composition of generated waste is majorly dry recyclable, plastic, paper, metals and cardboard are the major contributors in the total waste, Whereas, for cities like Ghaziabad and Muzaffarnagar, it was found that the major contributor of the waste was mixed solid waste, biodegradable and multilayered packaging which are majorly reported to the local waste streams composition and market linkage.
Socio-demographic profile of informal workers
Age distribution across the study areas
The primary data collected from the survey were converted into a representative form to enable a comparative interpretation of demographic age profiles within each occupational category and city. Figure 2(a) and (b) illustrate the age-wise distribution across the study areas for two groups, that is, FWWs and IWWs.
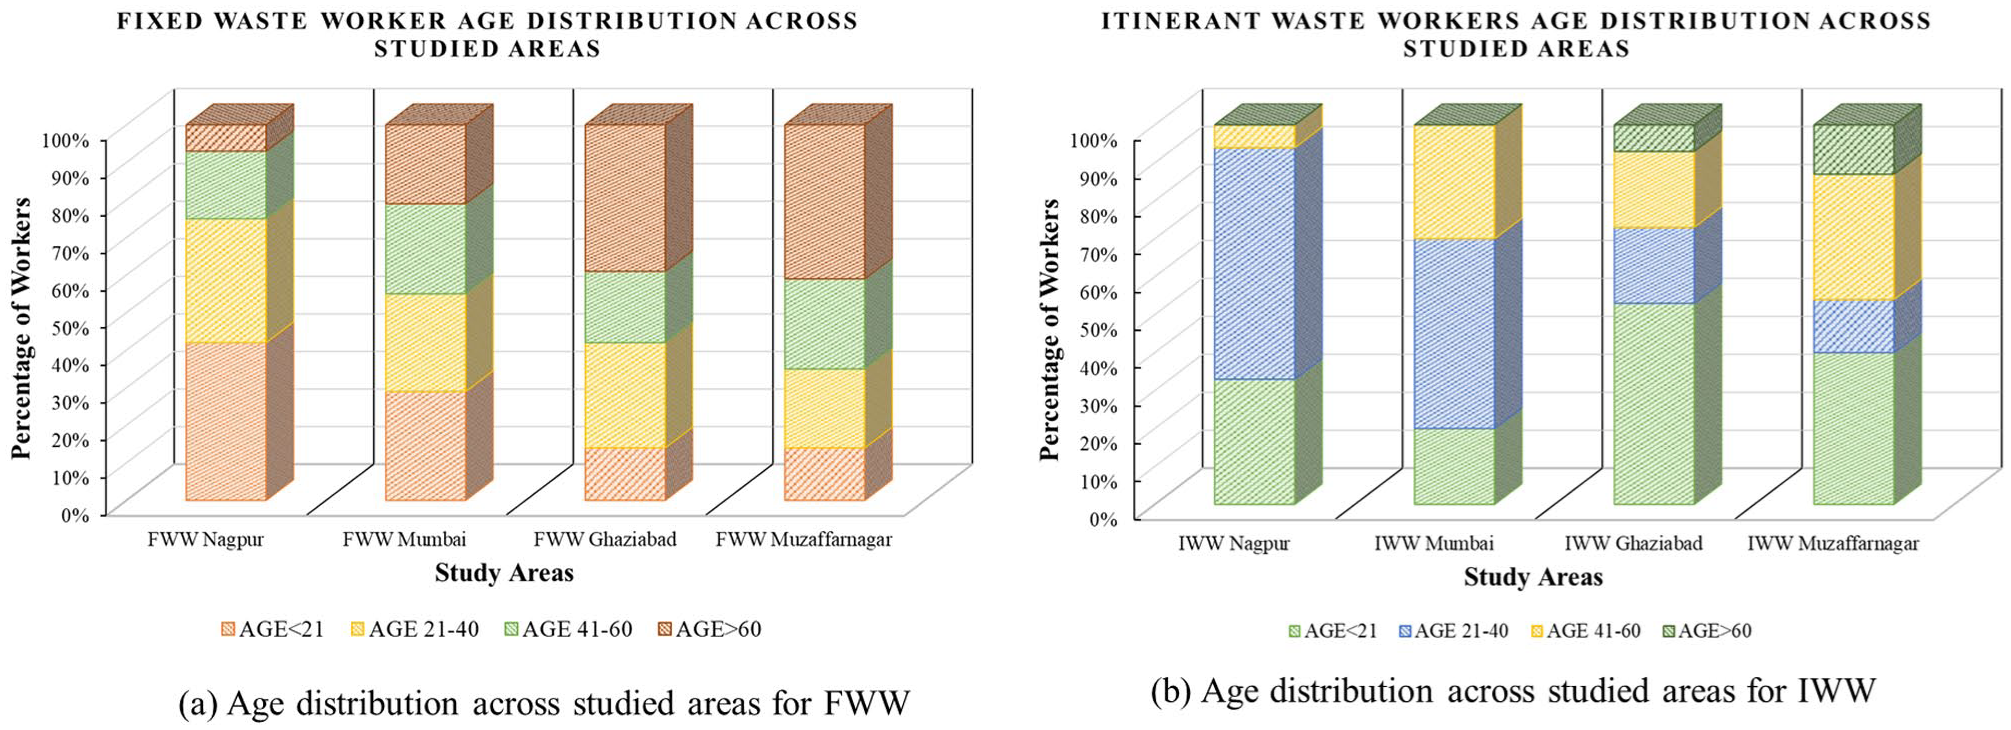
Age distribution across studied areas for fixed and itinerant waste worker. (a) Age distribution across the studied areas for FWW. (b) Age distribution across the studied areas for IWW.
Figure 2(a) shows a balanced age distribution across FWWs in all the cities. For Nagpur, a majority of the stack was covered by the age group less than 21 years with an overall contribution of about 42%, followed by 33% for the age group of 21–40 years, indicating that younger age people are mostly involved in this workforce. Whereas, in Ghaziabad, 39% and Muzaffarnagar, 41%, were the group of people whose age was found to be greater than 60 years, indicating a lack of retirement alternatives or the necessity for continued labour among the elderly population. On the other hand, Mumbai exhibits a fairly even distribution across all the age brackets, with notable representation in the senior cohort (21%), highlighting the possibility of a stabilised generational occupation of informal waste collection. The age distribution across this sector highlighted that cities such as Ghaziabad and Muzaffarnagar work and function as a long-term livelihood strategy, whereas cities like Nagpur have a transitional nature, as observed in the younger workers.
Figure 2(b) illustrates that there is a sharp age-specific trend in cities like Ghaziabad and Muzaffarnagar, with a contribution of 53% and 40%, highlighting an alarming proportion of individuals in the age group of 21 years, which is a reason for concern over child and adolescent labour. Nagpur, shows a high youth involvement (33%), while Mumbai presents robust data economically, with an overall share of 20% of itinerant workers under age 21. Overall, the age group of 21–40 was found to be the dominating group in Nagpur, with an overall contribution of 61%, highlighting that the sector of itinerant waste picking was a common livelihood among working-age individuals. The same age group comprises a significant proportion in Mumbai as well, with a share of 50%. Notably, no workers above the age of 60 were identified in Mumbai, possibly due to occupational factors such as physical exhaustion or a transition to less labour-intensive livelihoods.
Gender participation among waste workers
The dominance of males in both the FWW and IWW sectors was found to be very dominant in Muzaffarnagar, with no women’s participation, whereas Ghaziabad also showed a skewed gender ratio, with the overall share of 73% male and 27% female, which shows a limited inclusion of women in these sectors. Figure 3(a) shows the gender-wise distribution across the two sectors of waste workers, that is, FWWs and IWWs, by revealing the regional and occupational disparities. According to the research conducted by Singh et al. (2023) and Tripathi and Chandiramani (2024), women’s participation in the IWS was low in Uttar Pradesh due to the regional disparities, which was also indicated via the data collected from the primary survey in the study. A similar study conducted by Al-Khatib et al. (2020b) showed similar results where the waste picker community was primarily dominated by men in the Gaza Strip. The presence of male-only participation reflects cultural norms that limit women’s involvement in informal waste work. It indicates that the majority of the workers in this sector belong to marginalised societies and specific regional communities that do not allow women to work. However, a relatively balanced gender composition was observed in Mumbai, with a share of 51% male and 49% female, whereas in Nagpur, it was 59% male and 41% female working in the sector of fixed waste collection, highlighting the more inclusive hiring or engagement practices.
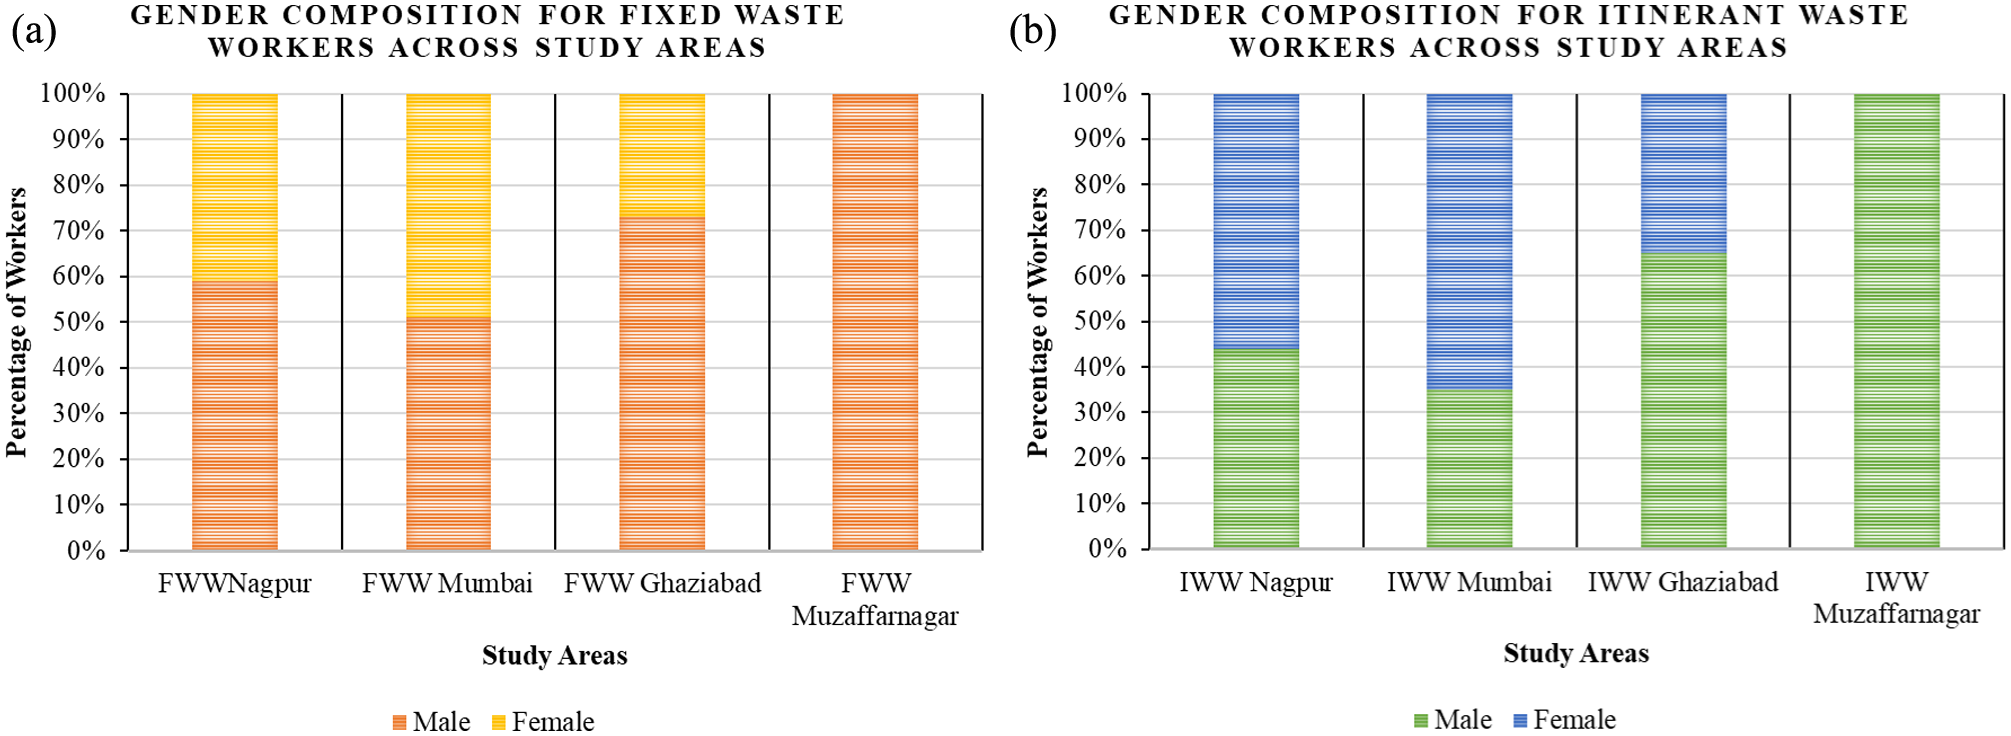
Gender composition across the studied areas for fixed and itinerant waste worker. (a) Gender Composition across the studied areas for FWW; (b) Gender Composition across the studied areas for IWW.
Itinerant waste picking showed a higher proportion of female participation in certain cities, as shown in Figure 3(b). Notably, Mumbai recorded 65% of the female workforce worked as IWWs across the city. In Nagpur, female participation was found as 56%, which holds the majority of stake in waste collection via door-to-door waste collection service and recyclable sorting. This pattern exactly matches the annual report 2020–2021 of the Ghaziabad Municipal Corporation (2020), which noted that informal, low-infrastructure waste collection systems often create livelihood opportunities for women, particularly in low-income contexts. Whereas, in Muzaffarnagar, no women’s participation was observed in the itinerant waste collection, reflecting the socio-cultural restrictions or occupational segregation. These trends underscore the gendered nature of waste labour, with spatial and occupational dimensions influencing women’s participation and highlighting the need for gender sensitive policy frameworks to ensure the inclusivity and equity in informal waste economies.
Wage distribution by working hours
The relationship between two parameters, that is, wage distribution and working hours among two different occupational categories (FWWs and IWWs) across the four studied areas, is shown in Figure 4. Figure 4(a) and (b) heat maps captured the percentage distribution of daily working hours, where Figure 4(c) and (d) show the frequency distribution of wage brackets. These visualisations allow for comparative insights into intra-group and inter-group trends.
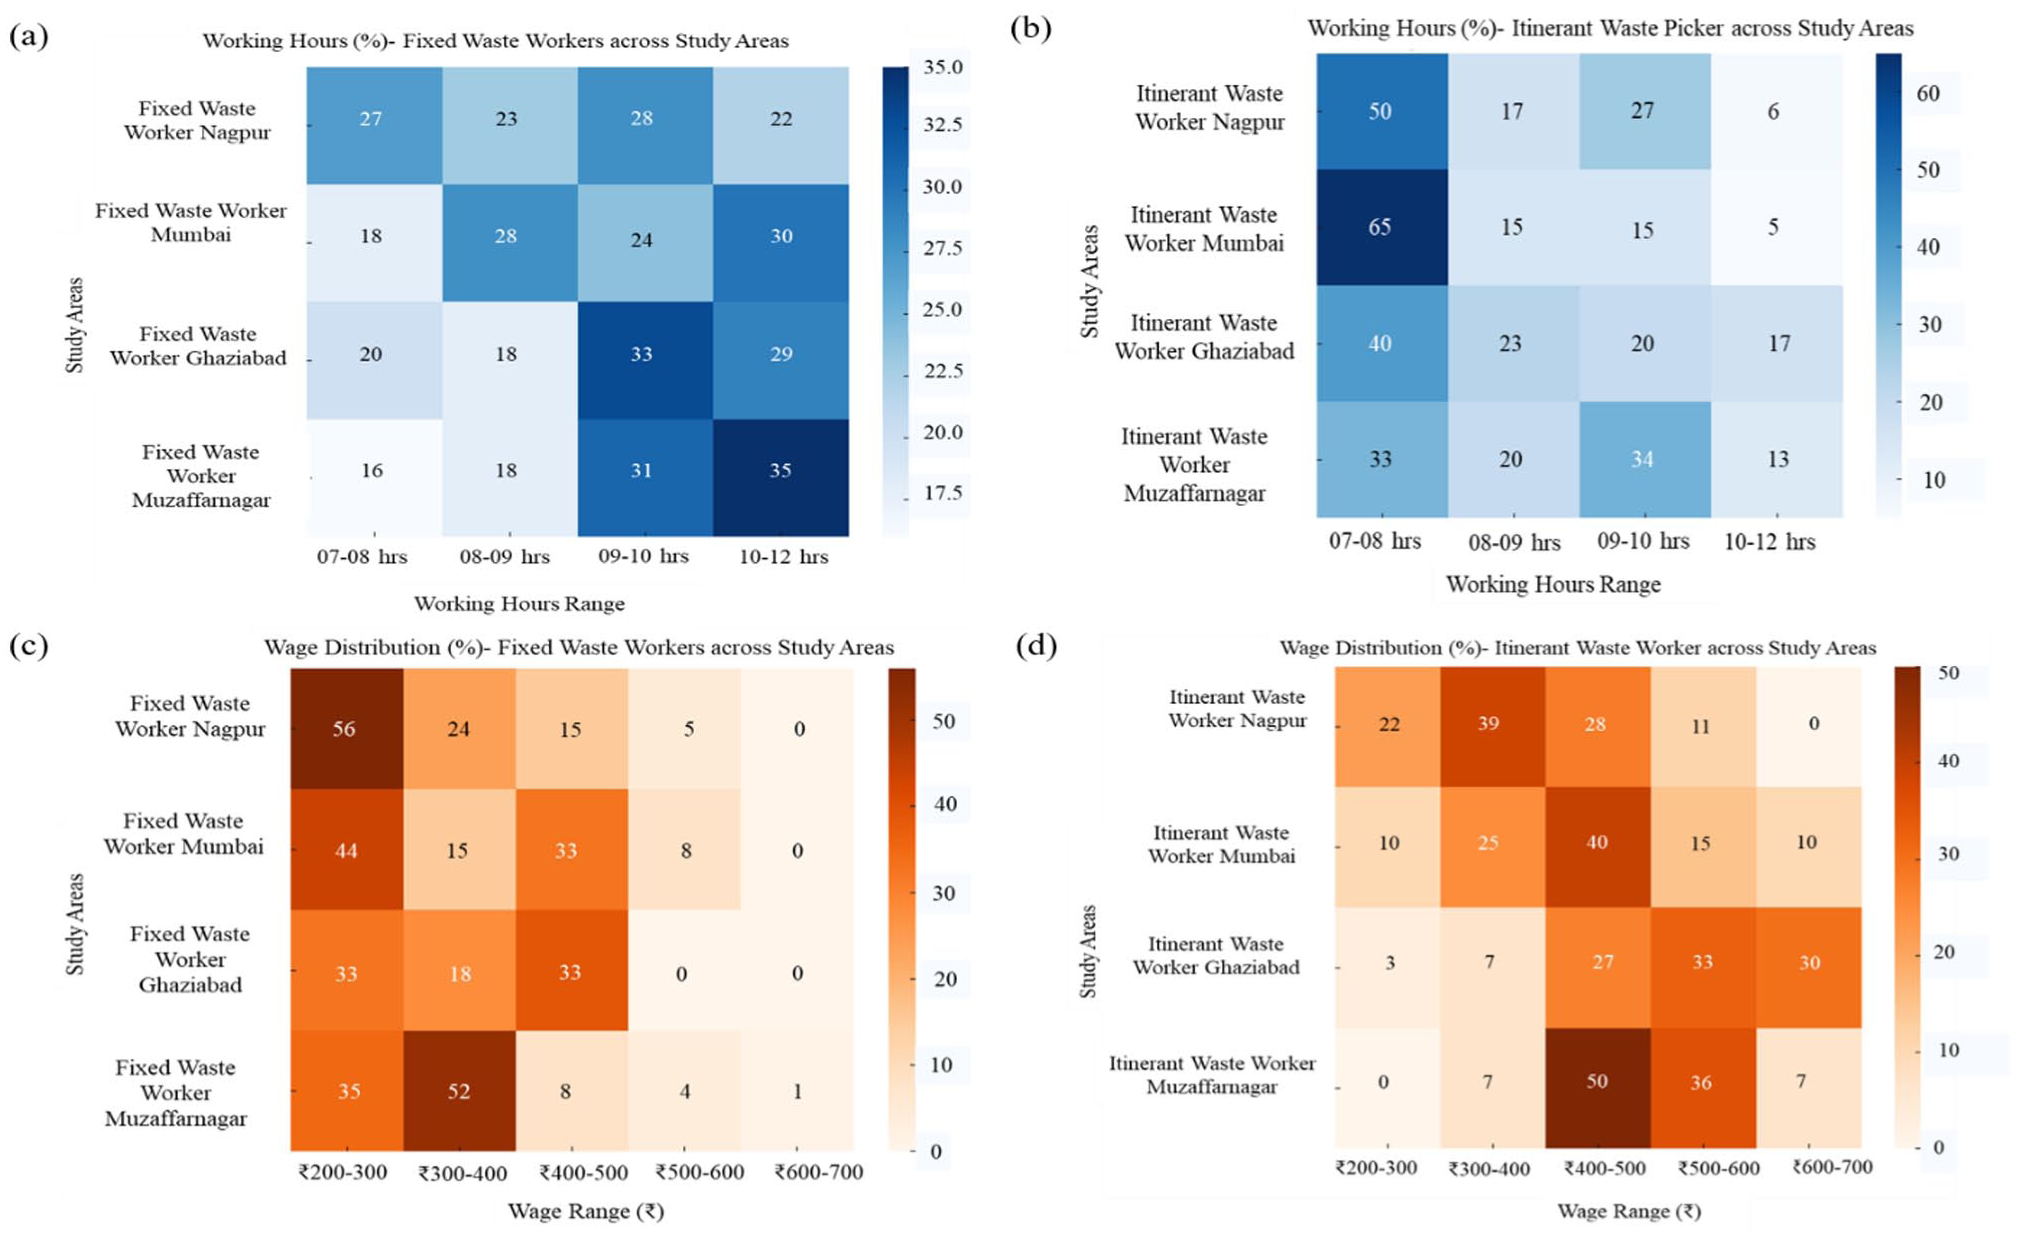
Heat maps showing the percentage distribution of working hours and wage ranges among informal waste workers across study areas: (a) Working hours of FWW; (b) Working hours of IWW; (c) Wage distribution of FWW; (d) Wage distribution of IWW.
Working hour distribution
Among FWWs, the distribution of working hours is skewed towards the upper brackets, particularly in the 9- to 12-hour range, as shown in Figure 4(a). The data revealed that FWWs in Mumbai (30%) and Muzaffarnagar (35%) have the highest concentration of individuals working for 10–12 hours per day, underscoring the prevalence of extended workdays in these urban contexts. A similar pattern was observed in Ghaziabad, where 29% of workers fall within this longest hour bracket, suggesting a generalised norm of prolonged working durations among fixed-position waste handlers across cities. According to Sverdlik et al. (2024), the tendency of informal waste workers to work long hours is attributed to factors, such as precarious daily wages, lack of contractual protection and the absence of regulated working time limits. Waste pickers, street vendors and other informal groups often extended their working hours to secure a minimum income, a trend that intensified during climate shocks and declining incomes. Supporting this pattern, a study conducted by (Zungu-Tamo et al., 2025), showed that workers from aged 20-29 years typically worked 3–5 days per week, whereas those in the 30-49 age group were engaged more frequently, working approximately 5-7 days per week; however, despite their higher work intensity, they earned comparatively lower incomes. Women in the picking sector also face additional stress as they are forced to combine informal work with unpaid domestic responsibilities, increasing health risks, such as fatigue, dehydration and greater exposure to extreme weather (Ogando et al., 2017; Sverdlik et al., 2024).
In Nagpur, however, a slightly different trend emerges. The largest share of workers (28%) reports working in 9- to 10-hour bracket, followed by 23% working 8–9 hours and 22% in 10- to 12-hour category. This suggests a relatively more balanced distribution of working time in Nagpur compared to the other cities, with a modest tilt towards moderate working durations. Whereas, according to Sapkota et al. (2020) and Zolnikov et al. (2021), workers working for prolonged periods are associated with diminished work-life balance and also increase the occupational vulnerability, intensifying the marginalisation of FWWs, who often lack formal protections such as overtime pay or health insurance.
Conversely, the proportion of workers engaged in shorter working hours (7–8 hours) is consistently low across cities. The lowest shares were observed in Muzaffarnagar (16%) and Mumbai (18%), indicating that very few FWWs operate within a standard or limited-hour workday. Ghaziabad (18%) and Nagpur (23%) showed slightly higher proportions in 8- to 9-hour category, yet these values still reflect a systemic expectation of long daily shifts within this occupational segment. According to Bláfoss et al. (2023) and Lee et al. (2018), workers working for short durations of time highlight that the standard workdays are largely absent in this occupational category. This kind of systemic expectation of prolonged shifts can contribute to chronic fatigue, musculoskeletal strain and long-term health risks. These results were also observed in other studies conducted around the globe, a similar study by (Schenck et al., 2019; Yu et al., 2020), in Bellville, South Africa, found that about 56% of the workers are exposed to injuries such as small cuts from glass and get sick easily.
In contrast to their fixed counterparts, IWWs display a more diverse and moderately distributed pattern of working hours, with a notable concentration in the lower hour brackets (7–9 hours), as illustrated in Figure 4(b). In Mumbai, a substantial 65% of itinerant workers report working 7–8 hours per day, representing the highest single-category share among all the cities and time brackets. Similarly, Nagpur follows this pattern, with 50% of workers concentrated in the same time range, reflecting the more flexible and often self-regulated nature of itinerant waste collection. Other cities exhibit more evenly spread patterns across working hour brackets. Like Ghaziabad demonstrates a relatively balanced distribution, with 40% of workers reporting 7–8 hours, 23% working 8–9 hours and a combined 37% working more than 9 hours daily. A similar trend was found in Muzaffarnagar, where 33% of workers fall into 7- to 8-hour range and 34% into 9- to 10-hour bracket. These distributions suggest that while itinerant workers generally engage in shorter workdays compared to fixed workers, many still exceed the 8-hour norm, especially in smaller urban centres. Notably, the share of itinerant workers operating in the longest working bracket (10–12 hours) remains minimal across all the cities, with Figure 4(b) ranging from 5% in Mumbai to 17% in Ghaziabad. This observation further supports the assertion that itinerant waste work, being informal and mobile by nature, often allows for greater autonomy in determining working time, although it may simultaneously be subject to variability based on access to waste streams, daily collection yields, or economic necessity. The disparity between the FWWs and IWWs illustrates that the occupational structure fundamentally shapes labour vulnerabilities. For FWWs, vulnerability is rooted in the time rigidity and physical strain, whereas for IWWs, the major challenge is the income precarity despite shorter hours. Omosimua et al. (2021) and Yu et al. (2020) have shown studies conducted in Latin America and Africa, where itinerant or door-to-door collection typically works shorter but economically unstable days, often leading to adjusting hours to waste availability or household obligations. This flexibility may mitigate health burdens, but it introduces uncertainty in daily earnings, especially where recyclables market prices are volatile. Both the waste collection systems reflect two different but overlapping pathways of socio-economic vulnerability, a phenomenon also emphasised by comparative studies of waste labour in India, Brazil and South Africa (Dias and Samson, 2016s).
Wage distribution
The wage distribution among FWWs across all the four cities reveals a clear skew towards the lower income brackets, particularly within the 2.2–3.3 USD (₹200–300 INR) and 3.3–4.4 USD (₹300–400 INR) ranges, as depicted in Figure 4(c). This trend was found to be pronounced especially in Nagpur, where 56% of FWWs earn between 2.2 and 3.3 USD (₹200–300 INR), followed by 24% in the 3.3–4.4 USD (₹300–400 INR) range. Together, these two categories account for 80% of the city’s fixed waste workforce, indicating a concentration of low-income earners despite their relatively long working hours. A similar wage structure was observed in Mumbai, where 44% of fixed workers fall within the 2.2–3.3 USD (₹200–300 INR) bracket and 15% in the 3.3–4.4 USD (₹300–400 INR) range. However, Mumbai also shows a more significant proportion of individuals in higher brackets, particularly 4.4–5.5 USD (₹400–500 INR; 33%), suggesting a slightly more diversified earning pattern, potentially linked to municipal contracts, union presence, or differentiated waste collection routes (National Urban Livelihoods Mission, 2019). In Ghaziabad, the highest concentration of workers (39%) falls within the 4.4–5.5 USD (₹400–500 INR; range, followed by 33% in the 2.2–3.3 USD (₹200–300 INR) category and 28% in the 3.3–4.4 USD (₹300–400 INR) range. While this suggests a broader spread across wage brackets, the concentration remains largely within the lower-middle-income range, indicating modest upward mobility among some fixed-position workers. Muzaffarnagar, on the other hand, presents a unique case where the majority of FWWs (52%) are concentrated in the 3.3–4.4 USD (₹300–400 INR) brackets. This was followed by 35% in the ₹200–300 category and a small fraction in the higher brackets 4.4–6.6 USD (₹400–600 INR). The extremely limited representation in the upper income groups across all cities further reinforces the systemic nature of wage stagnation among FWWs, irrespective of geographic location. The result highlighted a disconnect between working hours and income for FWWs. Despite their consistent engagement in long-duration shifts, most remain clustered in the lowest wage categories, pointing towards structural undervaluation of labour in this segment and the absence of formal wage protection mechanisms. Several studies have reported similar patterns, where workers are engaged for long, physically demanding shifts by receiving minimal pay due to weak institutional safeguards, lack of formal contracts and absence of minimum wage enforcement (Khan, 2021).
The wage distribution among IWWs demonstrates a broader spread across income brackets, with a relatively greater concentration in the mid-to-higher wage categories, particularly when compared to their fixed counterparts, as illustrated in Figure 4(d). This pattern suggests greater variability and, in some cases, upward mobility within the informal itinerant waste economy. In Muzaffarnagar, the highest proportion of itinerant workers (50%) earn within the 4.4–5.5 USD (₹400–500 INR) range, followed by a significant share (36%) in the 5.5–6.6 USD (₹500–600 INR) bracket. Only a small proportion (7%) was in the lowest wage category 3.3–4.4 USD (₹300–400 INR), and none was in the 2.2–3.3 USD (₹200–300 INR) range. This upward clustering suggests that itinerant workers in Muzaffarnagar may benefit from relatively more lucrative access to recyclable materials or better-established informal trade networks. Ghaziabad presents an even stronger upward trend: over 60% of itinerant workers earn above 5.5 USD (₹500 INR), with 33% falling into the 5.5–6.6 USD (₹500–600 INR) bracket and 30% in the highest wage category 6.6–7.7 USD (₹600–700 INR). Only a marginal share was found to earn less than 4.4 USD (₹400 INR), underscoring the possibility that workers in this city may possess greater bargaining power, operate at higher efficiency, or benefit from favourable local market conditions for recyclable commodities (WIEGO, 2019).
The distribution in Mumbai and Nagpur is somewhat more balanced but still reflects a stronger presence in middle-income brackets compared to fixed workers. In Mumbai, 40% of workers were found to earn 4.4–5.5 USD (₹400–500 INR), with additional representation in both lower (2.2–4.4 USD (₹200–400 INR): 35%) and higher (5.5–7.7 USD (₹500–700 INR): 25%) brackets. Similarly, in Nagpur, a plurality (39%) earns (3.3–4.4 USD (₹300–400 INR)), followed by 28% in (4.4–5.5 USD (₹400–500 INR)) and 11% in 5.5–6.6 USD (₹500–600 INR). These patterns suggest moderate income diversity, likely tied to day-to-day fluctuations in collection yields and differential access to high-value waste streams. In contrast to FWWs, itinerant workers appear to experience less wage compression, with earnings more broadly distributed and a notable share in higher wage categories. This distinction may be attributed to the informal and self-directed nature of itinerant waste collection, which allows workers to optimize their routes, timing and material selection. However, the variability also reflects income insecurity, where earnings depend heavily on daily access to waste and fluctuating demand from scrap buyers (Maalouf and Agamuthu, 2023).
Correlation and comparative analysis
The results for all wage and working hours parameters across the study areas, in comparison, highlight a weak and inverse correlation between the income pattern and the working time across all the study areas, especially for FWWs. Despite engaging in longer working hours, their earning was not found on a proportionate scale, which highlights the issues of undervaluation and possible exploitation within the fixed employment segment (Rai et al., 2019). Whereas IWWs spent fewer hours on average but showed a broader distribution across wage categories and a greater share in higher income brackets, possibly indicating variability in waste collection efficiency, bargaining power or access to profitable materials. Results also underscore the informal sector’s complexity, where conventional labour-economic assumptions (i.e. longer working hours are equal to higher wages) did not consistently apply. There were some structural differences in work organisation, material recovery value chain and city-specific economic opportunity, all likely playing a role in shaping these outcomes.
Status of protective gear adoption among FWWs and IWWs
The data illustrated in Figure 5 show the use of PPE among waste workers across all four surveyed cities, specifically among FWW and IWW waste groups. It also highlights a critical gap in occupational health and safety adherence, particularly in the IWS. Across both the fixed and itinerant waste picking industry, there is a significant lack of overall PPE, as the majority of the respondents reported the absence of basic PPE. The highest cumulative use of PPE in both the sectors (fixed + itinerant) was found in Nagpur with an overall percentage of 36% (22% for fixed waste and 14% for IWWs), followed by Mumbai with a total of 30% (21% in fixed and 9% in Itinerant waste picking). In Ghaziabad, the use of PPE was about 23% (8% for fixed waste and 15% for Itinerant), whereas in Muzaffarnagar, the condition of PPE was found to be more vulnerable, with a total use of PPE of only 13% (11% by the FWWs and only 3% by the IWW). The data indicated that the percentage of workers not using any PPE was very high. In Nagpur, about 78% of fixed and 86% of IWWs are working without any form of PPE. A similar trend was observed in Mumbai, where about 79% of fixed workers and 91% of IWWs are not using any kind of PPE. Among all the studied areas, Muzaffarnagar reported the highest lack of PPE usage among itinerant workers, 97%, followed by 89% for FWWs.
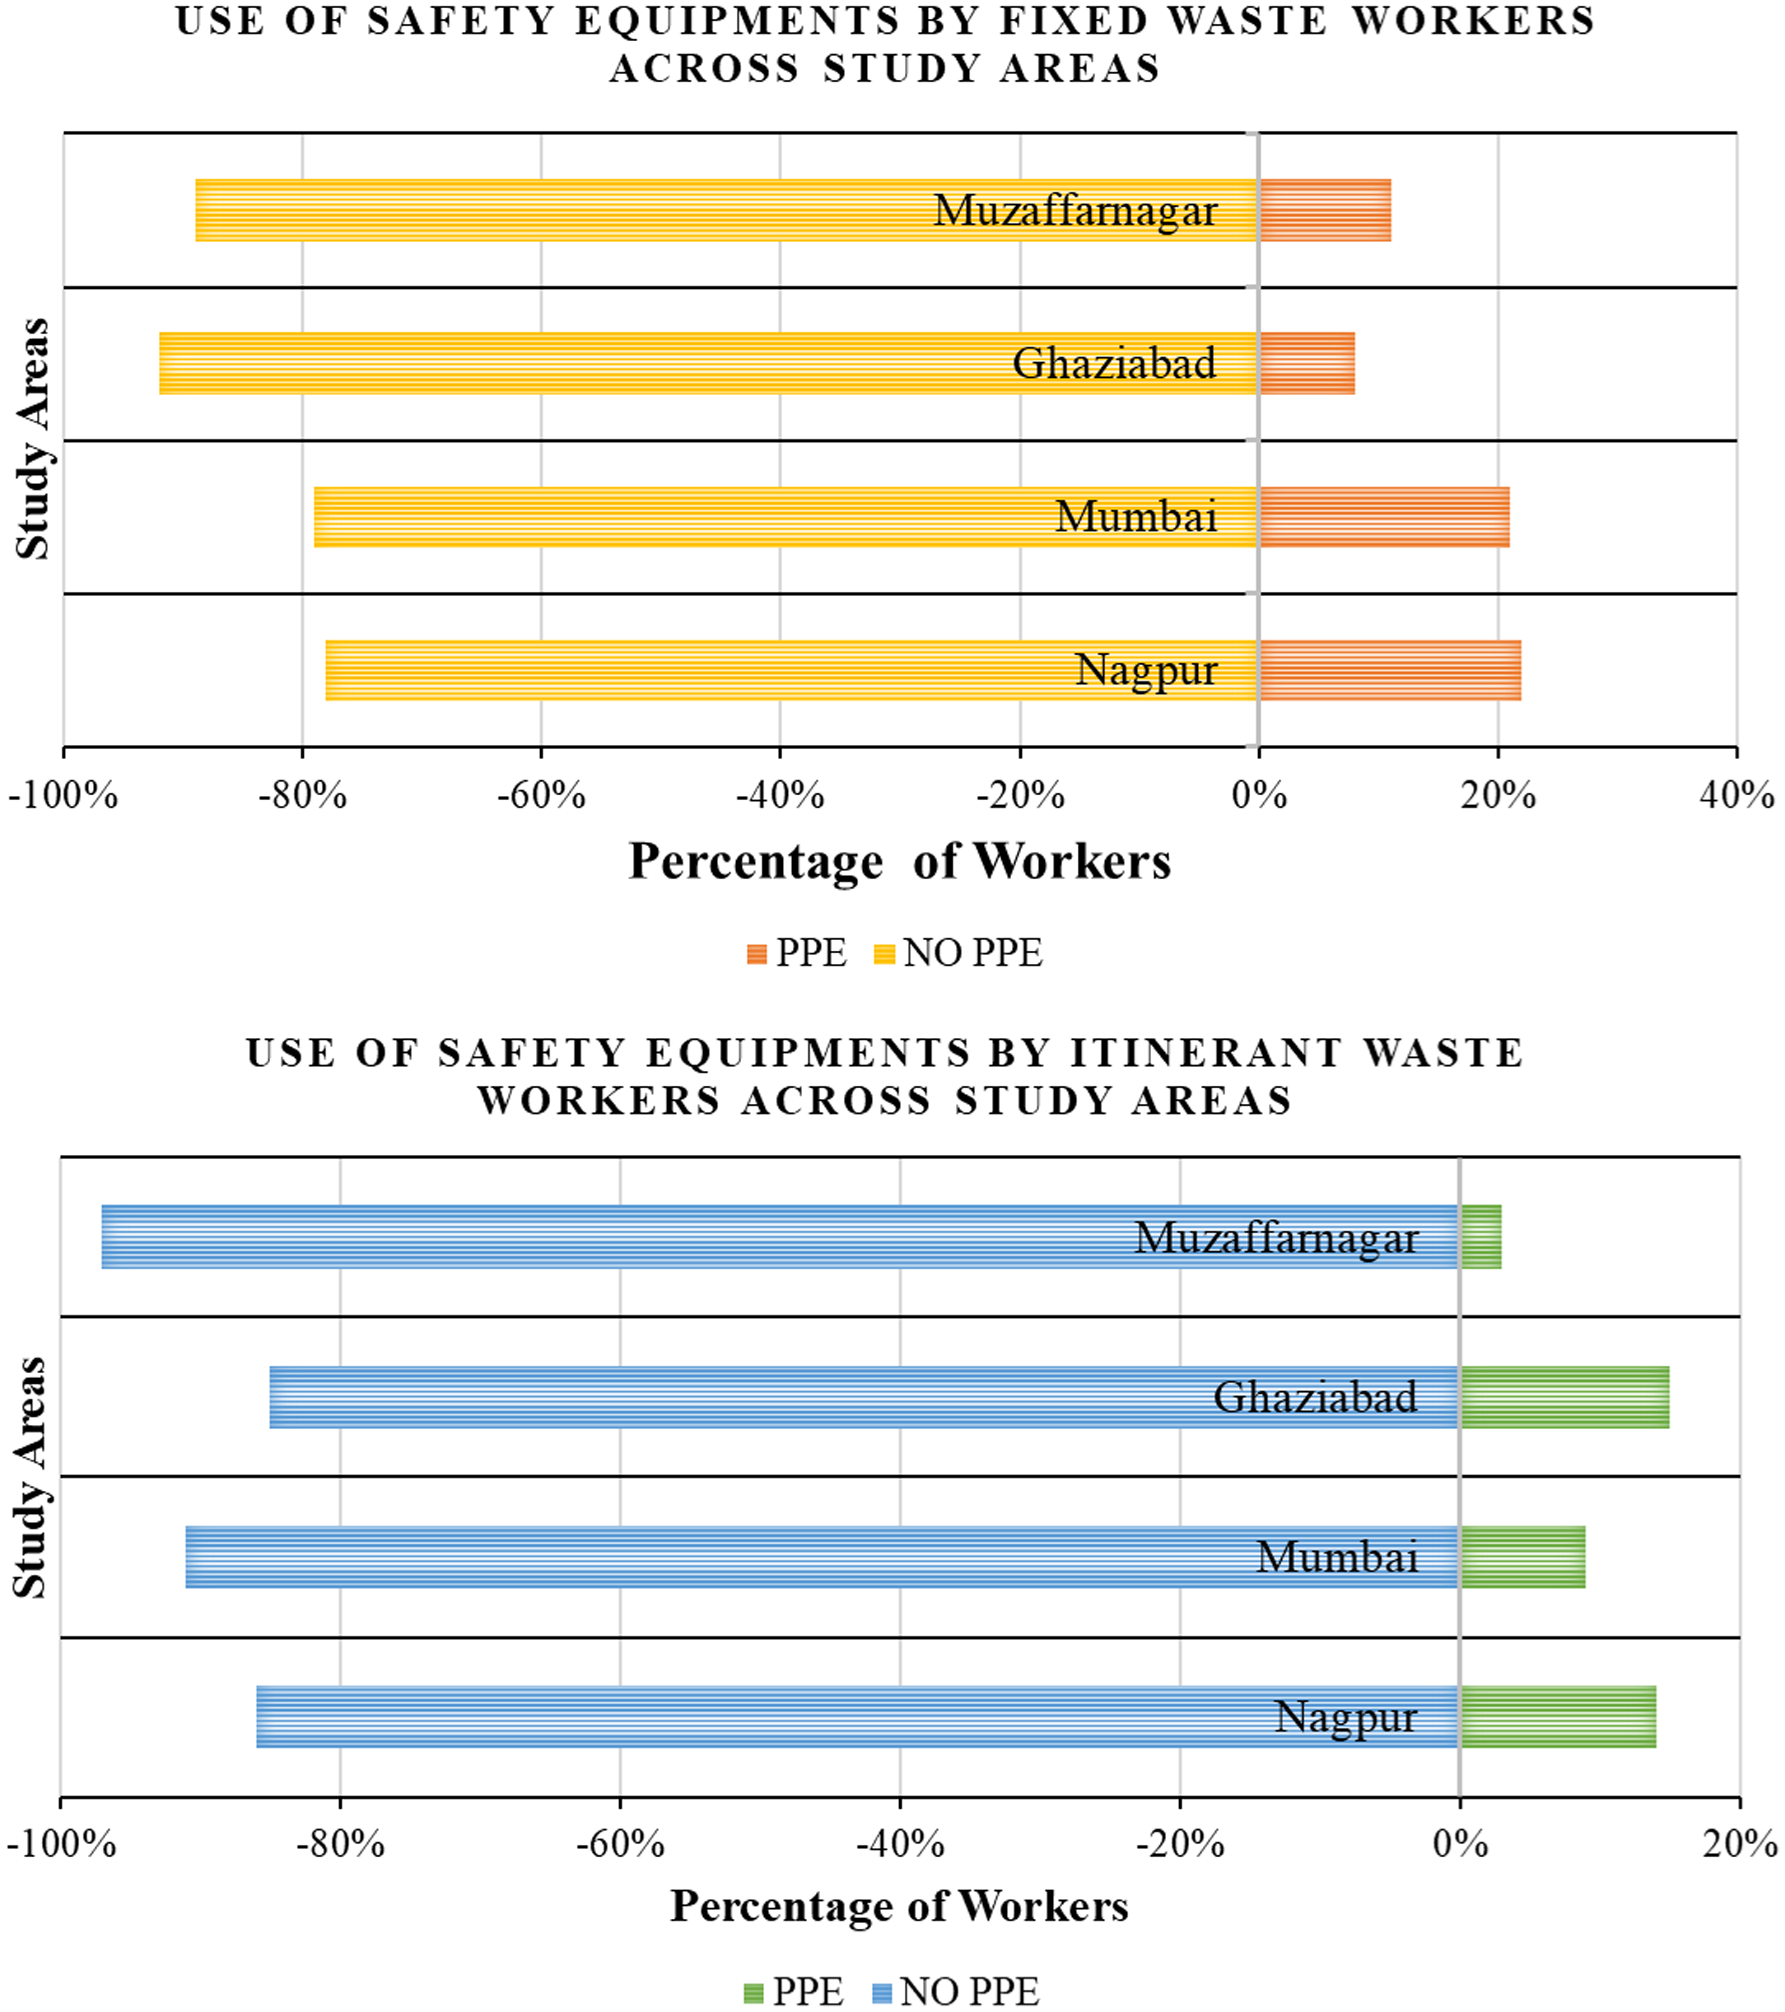
Use of personal protective equipment across studied areas.
As per the primary survey data, masks were the most commonly used item, although at low frequencies. FWWs in Mumbai (17%) and Nagpur (13%) showed the highest rate of mask usage. In contrast, items, such as gloves and boots, were nearly negligible, with a share of less than 5% across all the cities and worker categories. Primary data collection also highlighted that the IWWs consistently exhibited lower PPE usage rates compared to their fixed counterparts, despite often engaging in similarly high-risk activities. These findings also underscore the critical occupational health gaps within the IWS. Minimal use of protective gear, particularly in cities with relatively better waste management infrastructure, suggests that awareness, accessibility and affordability of PPE are still major concerns. The complete absence of protective gear like gloves and boots in certain regions, such as Muzaffarnagar, reflects the systemic neglect of the safety needs of these essential yet marginalised workers.
Previous studies conducted for the use of PPE among informal waste workers highlighted that about 67.6% of workers never or rarely used any PPE, with masks being the most commonly adopted item and gloves/boots showing negligible use (Chaudhuri et al., 2019). A similar study conducted at the Sisdol landfill showed that about 92% of workers are receiving training, use of PPE was minimal and limited to mask and gloves, which shows that awareness alone does not translate to comprehensive protection (Khanal et al., 2021; Khatri et al., 2025; Ramitha, 2023), highlighted that in New Delhi and Puducherry, footwears and aprons were used on relative high scale at formal level but use of gloves was less than 20% and 55% of face mask, suggesting limited adoption of full protective gears. These collective findings highlight the difference between FWWs and IWWs, largely explained by their organisational embeddedness. FWWs typically work under the supervision of the municipality or a subcontractor, while IWWs work independently with minimal institutional support. This gap is reflected in the use of PPE in all the cities, and the use of masks was slightly higher than that of gloves and boots, but significantly lower among mobile waste workers. These findings suggest that affordability, convenience and lack of supervision continue to be significant barriers to the systematic adoption of PPE by informal waste workers in South Asia.
Comparative analysis and risk-based assessment of informal waste workers
Comparative evaluation across cities
A comparative analysis was performed at the selected urban centres- Nagpur, Mumbai, Ghaziabad and Muzaffarnagar. A SWOT analysis was performed for the systematic and localised assessment of informal waste workers conditions in the respective cities. This method offers a structured evaluation of each city’s performance and challenges by magnifying the informal waste workforce and also facilitates the researcher to understand the vulnerabilities that are related to the occupation, institutional responses and special disparities.
The SWOT evaluation analysis was performed across various parameters derived from the primary collected data via survey forms and by interviewing the key stakeholders in the regions. Parameters for evaluation of SWOT analysis include worker demographics, wage structure, PPE usage and community engagement. In addition to this, it also assists the environmental factors, such as climatic conditions and the waste infrastructure of the particular city, which will help us to gain a holistic perspective of the informal base sector in the city. Supplemental Table S2 presents the key strengths and systematic gaps that are leading to the case of the socio-economic impact and causing a risk for occupational safety of the waste workers, while also providing city-specific leverage points for the sustainable improvement.
Supplemental Table S2 illustrates the complexities related to informal waste across different urban typologies. Mumbai and Nagpur demonstrate administrative strength and infrastructure maturity, but on the other hand, they are heavily reliant on significant informal labour with insufficient safety standards, whereas in Ghaziabad, advancing the decentralised awareness is still struggling with gender disparity and institutional support for marginalised waste workers. Across all the steady areas, Muzaffarnagar emerged as the region with the highest vulnerability due to systemic neglect, lack of formalisation with the formal waste sector and deep-rooted sociocultural exclusion. A similar pattern in unsafe working environments was also documented across developing countries, which led to an underlining of the broader global vulnerability of informal waste workers. In the Gaza Strip, severe occupational health risks were identified among informal waste workers, including frequent burns, injuries and exposure to hazardous materials (Al-Khatib et al., 2020a).
Despite with the challenges in each study area, there were some unique intervention points, such as in Nagpur, the ongoing awareness and initiatives could be used to scale up to provide the comprehensive safety training to the waste workers. Mumbai requires a robust infrastructure that could support the modern circular economic projects. Ghaziabad’s decentralised approach can be reinforced with targeted social protection schemes, while for Muzaffarnagar, the adoption of ruler-integrated waste strategies and establishment of a community engagement model could benefit the overall waste management structure in the city, specifically in the regions with low municipal coverages. The SWOT framework not only helped in revealing the uneven landscape of informal waste management across the study areas, but it also highlighted the urgency of the customised policy interventions that not only acknowledge a socially special heterogeneous day but also prioritise the occupational safety and integrity for the workers who are engaged in the informal waste management sector.
Development of a composite risk assessment framework
To assess the risk exposure and marginalisation of the informal waste workers across the study areas, a WVI was constructed by using five key vulnerability indicators, including:
Age of workers>60 years;
Earning below ₹300 day−1 (3.3 USD day−1);
Lack of PPE
Female participation (as a proxy for intersectional vulnerability).
Working more than 9 hours day−1.
Each indicator was normalised across cities using min-max scaling, as per equation (1), and weighted by its relative importance on labour vulnerability and expert consultation, which includes stakeholders from the IWS and NGO representatives. Table 1 illustrates the raw, normalised and weighted scores for the selected indicators.
Waste vulnerability index construction for selected cities.
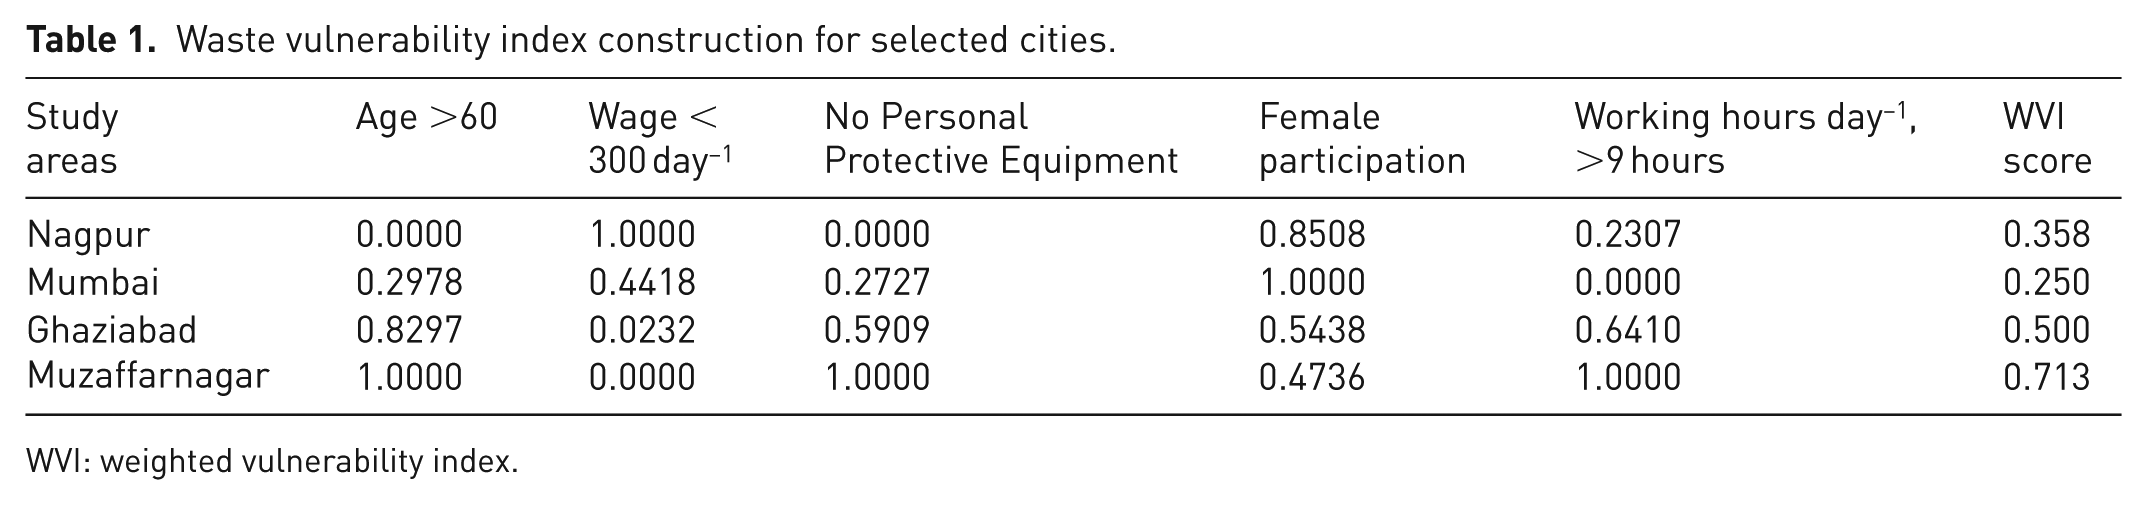
WVI: weighted vulnerability index.
The studied WVI was computed to assess the relative socio-economic and occupational vulnerability faced by informal waste workers across all the four studied areas: Nagpur, Mumbai, Ghaziabad and Muzaffarnagar. Equation (2) was utilised to derive a composite WVI score for each city, whereas the score of WVI ranges from 0 (least vulnerable) to 1 (most vulnerable), as shown in Figure 6(a).
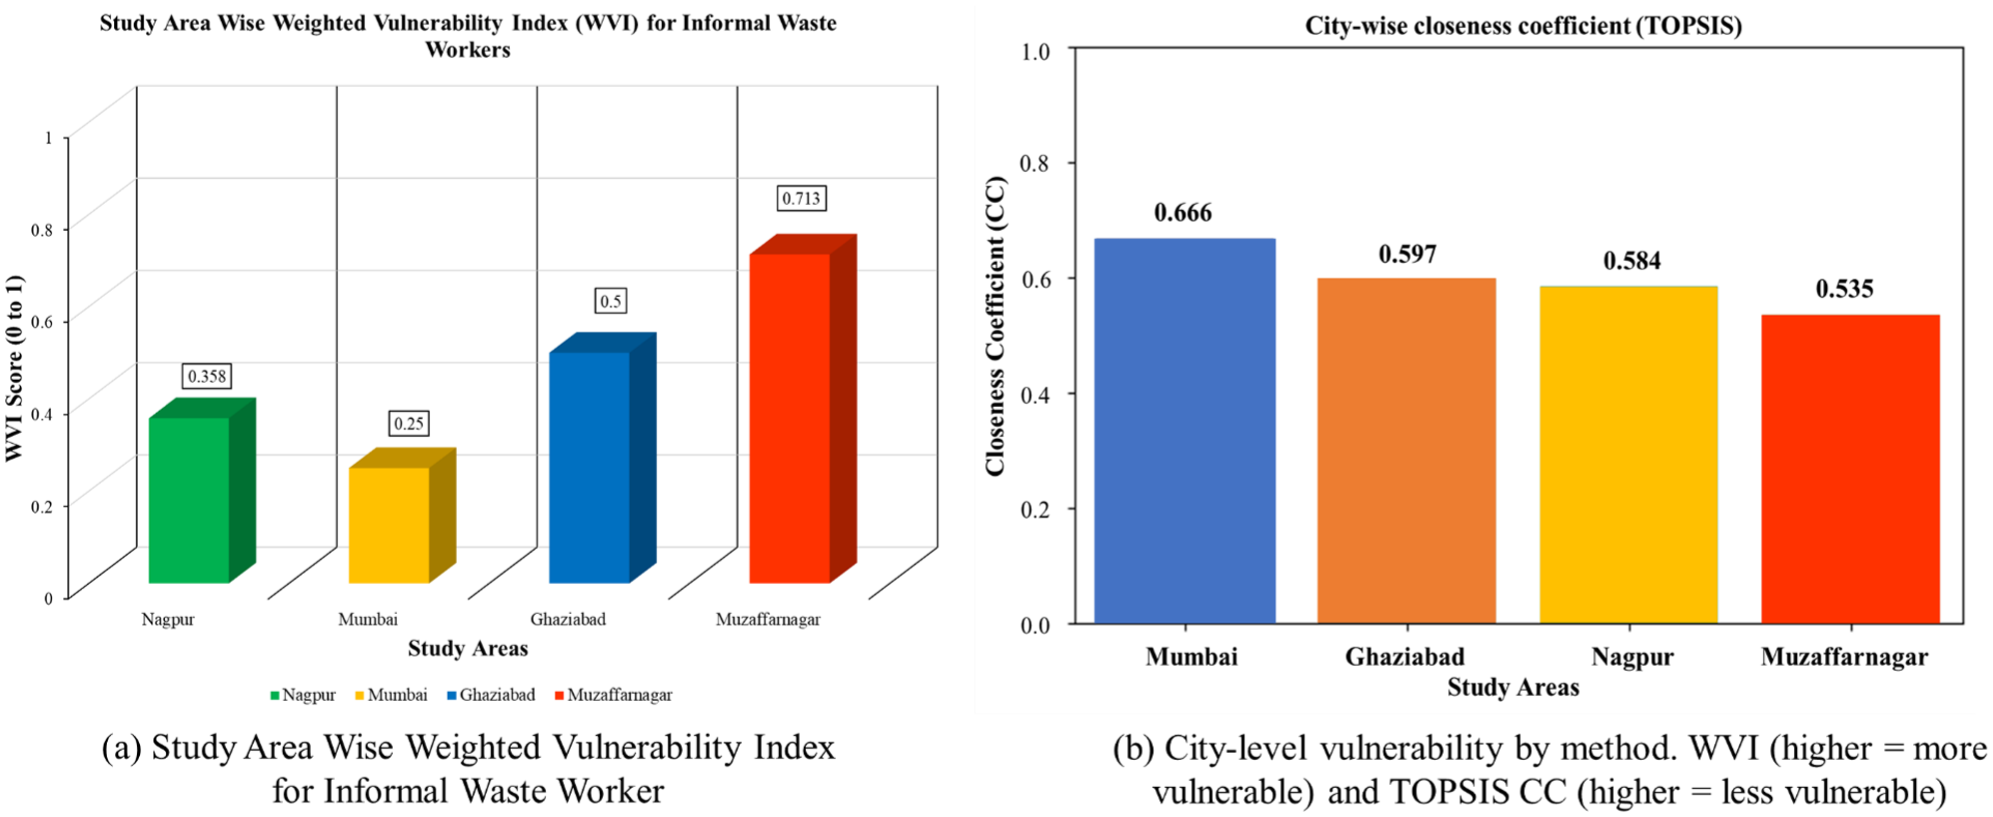
Comparison of WVI (higher = more vulnerable) and TOPSIS CC (higher = less vulnerable). (a) Study area wise WVI for informal waste worker. (b) City-level vulnerability by method. WVI (higher = more vulnerable) and TOPSIS CC (higher = less vulnerable).
WVI results revealed a distinct gradient and substantial variation at an inter-city level in the overall degree of vulnerability faced by informal waste workers. Muzaffarnagar emerged as the most vulnerable among all four study areas, recording a WVI score of 0.713, which indicates a significantly high level of exposure to socio-economic and occupational risks. The high score could also be attributed to the elevated normalised values across critical indicators, especially long working hours, the almost complete absence of PPE and a high proportion of older workers. Cities like Nagpur and Mumbai exhibited relatively lower levels of vulnerability, with WVI scores of 0.358 and 0.25, respectively. Despite the high female participation rate in Mumbai, better wages, with the lower proportion of older workers, and access to PPE all combined to reduce the vulnerability factor. The moderate vulnerability score in Nagpur is primarily due to the high female participation and better wage representation, although with relatively poor safety provisions and prevalence of long working hours. For Ghaziabad, the WVI score was found to be 0.500, which reflects moderately high vulnerability. The city balances distribution for both moderate risk factors and protective equipment, which are the factors for the balance, whereas the long working hours and limited wage security offset the gains made in other areas.
To validate the robustness of the outlined WVI results, the TOPSIS method was applied using the same vulnerability indicators and weights. Results from the city-level TOPSIS method were broadly consistent with the WVI, which also highlighted Muzaffarnagar as the most vulnerable (CC = 0.535 with the Rank-4) and Mumbai as the least vulnerable (CC = 0.666 with the Rank-1), as illustrated in Figure 6(b). The ordering of the intermediate cities showed a minor variation: while WVI ranked Nagpur (Rank-2) above Ghaziabad (Rank-3), results from the TOPSIS placed Ghaziabad slightly ahead (CC = 0.597 with the Rank-2) and Nagpur (CC = 0.584 with the Rank-3). This difference reflects the methodology contrast, where WVI directly aggregates weighted indicators, giving stronger influence to parameters such as long working hours and PPE absence, while TOPSIS emphasises the relative closeness to ideal best and worst scenarios, moderating the influence of individual extremes.
The comparative validation exercise highlights both convergence and nuance. The concordance between WVI and TOPSIS in identifying extremes (Muzaffarnagar as the most vulnerable, Mumbai as the least vulnerable) strengthens confidence in the results. The low divergence in the classification of Ghaziabad and Nagpur underscores the sensitivity of vulnerability assessments to methodological design. Notably, the WVI model remains more context-sensitive and policy-relevant by incorporating stakeholder-derived weights that reflect the socioeconomic realities of informal waste workers. While TOPSIS provides valuable mathematical validation, WVI offers clearer interpretation and practical utility for policymaking.
These results emphasised the heterogeneity of vulnerability across the urban IWS, underscored the critical influence of factors such as age, gender and economic insecurity, and highlighted institutional deficiencies. By also underscoring the need for a tailored policy approach. Overall, the WVI framework not only facilitates the inter-city comparison but also aids in prioritising policy interventions. Cities like Muzaffarnagar need immediate policy, targeted support, which ranges from basic service delivery to formal recognition and social protection mechanisms for waste workers. Whereas cities like Mumbai can serve as models for best practice in certain domains.
In totality, the study demonstrated various important insights related to the informal waste workers across the four cities. Multidimensionality and spatially differentiated vulnerabilities are shaped by socio-economic constraints, labour conditions and insufficient institutional support. Integrated assessment of demographic trends, occupational risk analysis, SWOT evaluation and WVI, validated with MCDA, reveals both structural challenges and city-specific disparities. These patterns underscore the critical need to strengthen urban waste governance and advance circular economy goals for reducing the heterogeneous risks faced by the workers in the field. The results from this study provide a robust foundation for designing targeted, equitable and context-specific policy interventions for these workers.
Conclusion and recommendations
Each parameter analysed in the study presents a unique and critical facet. Factors, such as socio-economic vulnerabilities, working conditions and systemic marginalisation of informal waste workers across all cities of India, that is, Mumbai, Nagpur, Ghaziabad and Muzaffarnagar, are examined through empirical surveys, spatial analysis and quantitative tools. Despite their pivotal role in urban waste management and resource recovery, informal workers remain excluded from formal integration into governance frameworks. This results in a lack of legal recognition, financial stability, occupational safety and access to basic social security. The key findings from the study include significant disparities in income, caste-linked stigmatisation, gendered labour divisions and exploitative intermediaries, which further exacerbate the hazardous environment and negligence in policies. The study also highlights the vulnerabilities faced by informal waste workers and their precarious working conditions. It also underscores the urgent need to reframe informal waste workers not as beneficiaries but as indispensable stakeholders in sustainable urban development. Inadequate policies at the institutional, infrastructural and regulatory levels have worsened the situation. It is vital to address these vulnerabilities in their livelihoods and to embed them meaningfully within the circular economy.
Evaluating two methods strengthens confidence in our results: both the WVI and TOPSIS converge at the extremes, identifying Muzaffarnagar as the most vulnerable and Mumbai as the least vulnerable, with only a minor and insignificant reordering between Ghaziabad and Nagpur. Because WVI incorporates stakeholder-derived weights and context-specific vulnerability constructs, it remains the preferred basis for policy prioritisation, while TOPSIS serves as a rigorous robustness test.
To effectively integrate informal waste workers into the circular economy system, it is crucial to develop inclusive and sustainable waste management systems. By aligning ground realities with data-driven policies, architecture can facilitate an inclusive and resilient waste management system. A set of high-impact policy interventions is required to effectively integrate the IWS into the formal waste economy. To formally integrate these invisible waste management heroes into the formal chain, the following policies could be implemented:
It is important to establish legal frameworks for recognising informal waste workers through identity cards and municipal licences to enable access to public services and social protections and to incorporate them into a formal waste governance structure.
Institutionalise their participation in policy making by creating inclusive multi-stakeholder platforms at national and municipal levels, ensuring that informal workers have the power to make decisions regarding circular economy strategies.
Mandate the integration of waste workers into government schemes, such as extended producer responsibility, with formal compensation mechanisms, training and capacity-building support (WIEGO, 2023).
Facilitate financial inclusion for informal workers through targeted microfinance, low-interest credits and digital payment systems to support entrepreneurship and cooperative-based recycling enterprises.
Improve and upgrade working conditions by investing in decentralised, worker-led material recovery facilities with easy access to basic amenities, protective gear and occupational health services.
Launch national-level awareness campaigns to shift public perception and reduce social stigma, improving community-level collaboration and support.
Develop focused policies on gender sensitivity to safeguard women and vulnerable populations within the informal sector, including childcare, access to secure employment and fair wages.
Integrate digital, data-driven and spatial waste management infrastructure, including a real-time tracking and monitoring system to assess the socio-economic and health conditions among informal workers post-integration, GIS-based optimisations and mobile platforms to enhance traceability and overall operational efficiency. This will help in building a framework to support evidence-based policy aimed at enhancing accountability in inclusive waste governance.
Supplemental Material
sj-docx-1-wmr-10.1177_0734242X261425150 – Supplemental material for Vulnerability assessment of informal waste workers in India and its implications towards sustainable waste management policy
Supplemental material, sj-docx-1-wmr-10.1177_0734242X261425150 for Vulnerability assessment of informal waste workers in India and its implications towards sustainable waste management policy by Jatin Kumar Drall, Mayengbam Ramesh Chandra, Vidisha Upadhyay, Bholu Ram Yadav and Sunil Kumar in Waste Management & Research
Footnotes
Author contributions
Declaration of conflicting interests
The authors declared no potential conflicts of interest with respect to the research, authorship and/or publication of this article.
Funding
The authors disclosed receipt of the following financial support for the research, authorship and/or publication of this article: The authors would like to thank the Netherlands’ Enterprise Agency and the Government of the Netherlands for funding to the CSIR-National Environmental Engineering Research Institute, under the project number GAP-2950.
Data availability
The data analysed in this study were formally collected through ground-based surveys. All the relevant data are presented in the manuscript. Additional data supporting the findings of this study will be available upon request.
Supplemental material
Supplemental material for this article is available online.