
Abstract
Managing marine pollution from expanded polystyrene (EPS) is a critical environmental challenge, yet reliable empirical data on the actual recovery burden are often lacking. This investigation addresses this gap by using primary field data from three comprehensive sampling cycles. Through a combined life cycle assessment and cost analysis, the environmental and economic impacts of remediation versus industrial prevention were compared. The results quantify the cost of inaction, showing that collection from hard-to-reach shores accounts for 99.5% of the total cost and 83% of CO2 emissions, with geographic dispersion and labour intensity as the main limiting factors. In contrast, mechanical processing is technologically mature and has low operating costs. The investigation also redefines sustainability metrics based on the waste’s end use, valorizing recycled EPS as a substitute for natural mineral aggregates (sand). This approach turns the disadvantage of low density into an advantage, achieving a greater than 99% reduction in carbon footprint per cubic metre compared to mineral aggregates. The present article clearly highlights that collecting waste before entering the marine environment is essential. At the same time, converting marine EPS into a resource is viable, as the environmental benefits of preserving natural deposits offset the high recovery costs, supporting a practical circular economy strategy.
Introduction
The widespread use of expanded polystyrene (EPS) in sectors ranging from food packaging to construction materials is due to its optimal combination of low density, thermal insulation capacity, and chemical inertness (Lim et al., 2021). However, these same properties make its end-of-life management a complex technical challenge (Schleier et al., 2022). Current industrial recycling processes require strict input specifications, including homogeneous and clean material flows, to operate efficiently (Rumetshofer and Fischer, 2025). Although these requirements can be met within controlled collection systems, their applicability to materials that have leaked into the natural environment is uncertain (Gazeau et al., 2024).
The entry of EPS into the marine ecosystem disrupts established management paradigms. Exposed to solar radiation (ultraviolet (UV)) and mechanical stress from wave action, the material quickly loses its structural integrity (Turner, 2020). Unlike conventional waste streams, marine EPS undergoes severe fragmentation and accumulates a “parasitic load” (water, sand, biomass), which significantly alters its physicochemical properties (Barrientos et al., 2024; Das et al., 2025). Although valorization methods have reached high maturity levels for urban and industrial waste, their application to marine debris remains in an early stage, hindered by major logistical barriers (Matavos-Aramyan, 2024). In organized management systems, research has gradually shifted from simple sanitary landfilling to material recovery methods. However, most modern studies focus disproportionately on “closed-loop” processes, such as chemical dissolution, which require extremely clean input streams to maintain the polymer’s mechanical properties (Chubarenko et al., 2025; Hidalgo-Crespo et al., 2022; Ilyas et al., 2026; Phiri et al., 2020). This strict purity requirement often excludes large quantities of material with even minor contamination.
In contrast, a more realistic and sustainable approach gaining traction involves using EPS in applications where absolute purity is not required. Mechanical recycling aimed at producing composite construction materials – a field attracting increasing research interest as a replacement for mineral aggregates such as sand – allows for the incorporation of material with a higher percentage of foreign impurities without compromising the final product’s performance (Samper et al., 2010; Seid et al., 2025; Tkalčić et al., 2025). In this context, the goal is not to recover “virgin” polystyrene, but to maximize the amount of waste diverted from landfill, making the process resilient to contaminant loads and, therefore, more suitable for realistic large-scale management scenarios (Pin et al., 2023; Xu et al., 2024).
In contrast, marine EPS management lacks systematic infrastructure. As noted by Williams-Wynn and Naidoo (2020), recovery depends almost entirely on voluntary cleanup campaigns rather than industrially organized networks. Additionally, exposure to the marine environment severely degrades the material’s quality (Vourna et al., 2025). Recent research shows that biofouling and photo-oxidation make marine EPS unsuitable for advanced dissolution methods (Tayeh et al., 2025; Tian et al., 2021), as contaminants interfere with the chemical process (Das et al., 2025; Pin et al., 2023). Consequently, there is a clear research gap in developing and economically evaluating intermediate, robust mechanical processing methods (such as simple densification) that could be applied near the collection site, bridging the gap between costly marine retrieval and industrial valorization.
The evaluation of EPS waste management involves not only technical feasibility but also economic viability and environmental impact (Fitriasari et al., 2025). Literature includes numerous life cycle assessment (LCA) and economic analysis (EA) studies comparing various management scenarios, focusing mainly on mechanical recycling versus sanitary landfilling and incineration (Akbarian-Saravi et al., 2025; Bisinella et al., 2025; Kim et al., 2025; Schneider et al., 2023). Recent studies have quantified the costs and emissions of industrial processes for producing densified polystyrene, confirming that mechanical recycling has a significantly lower global warming potential (GWP) than virgin material production, making it financially attractive when the waste stream is stable (Hidalgo-Crespo et al., 2022; Sharifian et al., 2025; Ugwu and Obele, 2023). Similarly, studies on advanced methods, such as catalytic (Gonzalez-Aguilar et al., 2025; Kim et al., 2025) or the use of natural solvents, show that operational cost (OPEX) depends directly on the energy consumption of the processing unit (Akbarian-Saravi et al., 2025; Berrio-Mesa et al., 2025). A common feature of these analyses is the use of “gate-to-gate” system boundaries, which treat collection and transport costs as given or negligible, since they are based on optimized urban networks (Baral et al., 2024; Berrio-Mesa et al., 2025). A thorough review of the literature reveals a critical research gap: the lack of empirical documentation on the true cost and environmental impacts of the “reverse logistics” chain in Chan and Not (2023) and Schneider et al. (2023). Although management has been adequately modelled using robust data from organized infrastructures that demonstrate its economic efficiency, studies on marine debris recovery remain largely theoretical or simulation-based (McIlgorm et al., 2011; Wagner, 2020). Current models often underestimate or entirely overlook the logistical challenges of accessing remote and inaccessible shorelines, mistakenly equating marine recovery with conventional collection processes (Dijkstra and Tirman, 2025; García-Hermosa and Woodall, 2023).
Key parameters, such as the high energy intensity of vessel operations for transporting personnel and heavy equipment, as well as the operational complexity of managing material in hard-to-reach areas, are rarely quantified using primary field data. As a result, a realistic, comprehensive comparative framework contrasting “prevention” (organized urban management) with “remediation” (marine recovery) under real-world conditions is lacking. This deficiency impedes accurate assessment of the true environmental and economic cost of inaction, highlighting the urgent need for studies that incorporate data from actual field operations. Addressing the critical need for empirical documentation of recovery processes, this investigation bridges the gap between theoretical models and operational reality by using, for the first time, primary field data from three sampling cycles. It provides a comprehensive comparative assessment of two scenarios: an integrated marine management model (Scenario A), which includes mapping, collection, and processing of contaminated material, and an Industrial reference model (Scenario B), which simulates processing within an organized network. By exploiting economic analysis and LCA, the present investigation aims to quantify the actual energy and economic costs of the marine debris reverse logistics chain. It also evaluates the technical feasibility of mild mechanical processing (granulation) to produce secondary material suitable for use as aggregate replacement in construction materials (Herki and Khatib, 2013; Mohamed and Al-Hadithi, 2022; Petrella et al., 2020). The aim of the present investigation is to highlight that valorizing marine EPS is feasible even with high contaminant loads, transforming an environmental problem into a cost-efficient resource for the circular economy.
Methodology
Study area and field operations
Survey design and remote sensing
The study area covers the coastline of the Western Saronic Gulf, Greece, with a total length of approximately 150 km. The region features complex geomorphology, featuring a highly indented coastline with steep rocky shores, sea caves, and small, isolated coves. Due to the rugged terrain and complete lack of terrestrial access, these areas are excluded from conventional municipal solid waste management schemes. As a result, they serve as natural accumulation sinks for marine debris, where the pollution load – particularly lightweight polymer fractions such as EPS – accumulates undisturbed over extended periods. To comprehensively map the pollution loads, a systematic terrestrial survey was designed and conducted. A vehicle travelled along the coastal road network, enabling visual inspection of the coastline. However, for the identification of inaccessible and remote shores not visible from the road, the research relied on aerial methods. During the survey, 117 accumulation hotspots were identified, logged, and georeferenced (GPS tagging); these sites were deemed critical for environmental remediation. To accurately assess the spatial extent and nature of the debris, a dual-layer imaging protocol was implemented:
Unmanned aerial vehicle (UAV) survey (aerial remote sensing): Operations were conducted using an UAV (DJI Mavic Mini 2, 10 MP resolution). The drone provided nadir (top-down) and panoramic imagery, allowing estimation of debris dispersion across the supralittoral zone and detection of inaccessible spots that could not be approached or observed from the vehicle.
High-resolution telephotography: Because coastal morphology often obscures debris from aerial observation (occlusion effect), a DSLR camera (10.2 MP sensor) equipped with an 18–135 mm telephoto lens was used as a complementary tool. This method enabled identification of EPS fragments from high vantage points on the road network, even when concealed by dense vegetation.
The collected dataset (imagery and coordinates) was processed to generate a “Pollution Atlas” of the region. The 117 sites were qualitatively categorized based on debris density, establishing a baseline for designing the collection strategy and selecting representative sampling stations, illustrated in Figure 1.
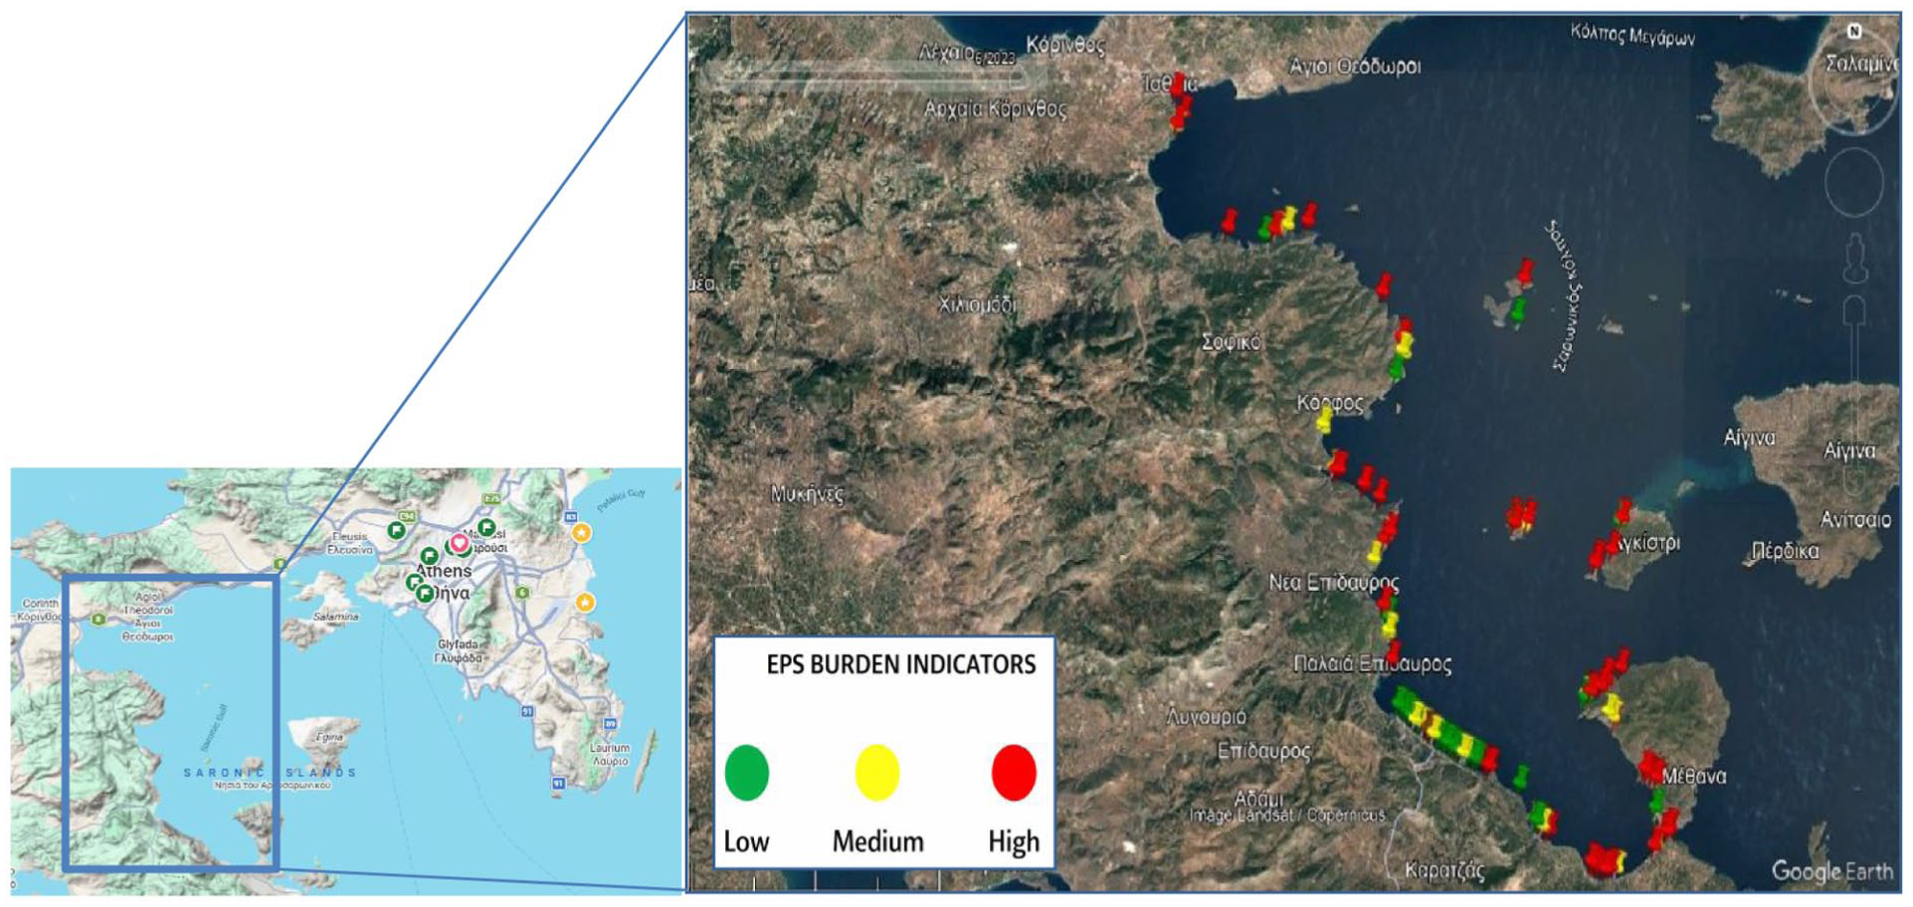
Hard-to-access and inaccessible beaches in Saronic Gulf (marked in 3 colours according to burden indicator) in Greece, with 117 monitoring points.
Sampling strategy and field logistics
To obtain representative primary data, a stratified sampling strategy was used. From the initial network of 117 mapped accumulation points, a subset of 36 stations was selected for physical cleanup and characterization. Site selection was based on the pollution load index established during the remote sensing phase. The collection targeted only areas classified as “High” and “Medium” load, focusing on critical environmental hotspots where the economic viability of recovery is most challenging. Fieldwork was organized into three (3) distinct sampling campaigns, each covering a cluster of twelve (12) stations. This spatiotemporal segmentation enabled precise recording of operational costs per phase and comparative assessment of logistical efficiency.
Given the geomorphological heterogeneity of the coastline, the “Three-Tier access model” was adopted. This classification system determines the required equipment and fuel consumption profile for each site, serving as a key input parameter for the techno-economic analysis. Specifically:
Tier 1: Maritime access only. Applies to shorelines completely isolated from the road network due to steep geological formations. Access was achieved exclusively via the operational vessel. The logistics chain involved: coastal approach → manual collection and deck loading → maritime transport → unloading at port → transfer to vehicle.
Tier 2: Rough terrain access. Applies to difficult-to-access shores reachable only via unpaved and uneven roads. Logistics required the use of a 4 × 4 off-road vehicle to approach the nearest drivable point, often followed by manual hauling of collection bags over significant distances to the loading point.
Tier 3: Standard access. Applies to areas with direct access to a paved or smooth road network. Collection was supported by a light commercial vehicle (van), minimizing transit times and accessibility barriers.
Field operations were conducted by a specialized team of three to four personnel. The recovery process was highly labour-intensive due to the complex environmental matrices where debris was found, such as EPS fragments entangled in maquis vegetation roots or wedged within rocky crevices, see Figure 2. This required careful manual extraction to avoid collecting organic biomass. All polymer fractions with a diameter greater than 2.5 cm (meso- and macro-plastics) were collected. To address the critical constraint of EPS’s high volume-to-weight ratio, a strict in-situ volume reduction protocol was implemented. Bulky items, such as aquaculture boxes and buoy fragments, were mechanically fragmented inside heavy-duty collection bags (90 L). Materials collected from all three campaigns were aggregated at a temporary consolidation hub and then transported to the designated processing facility.
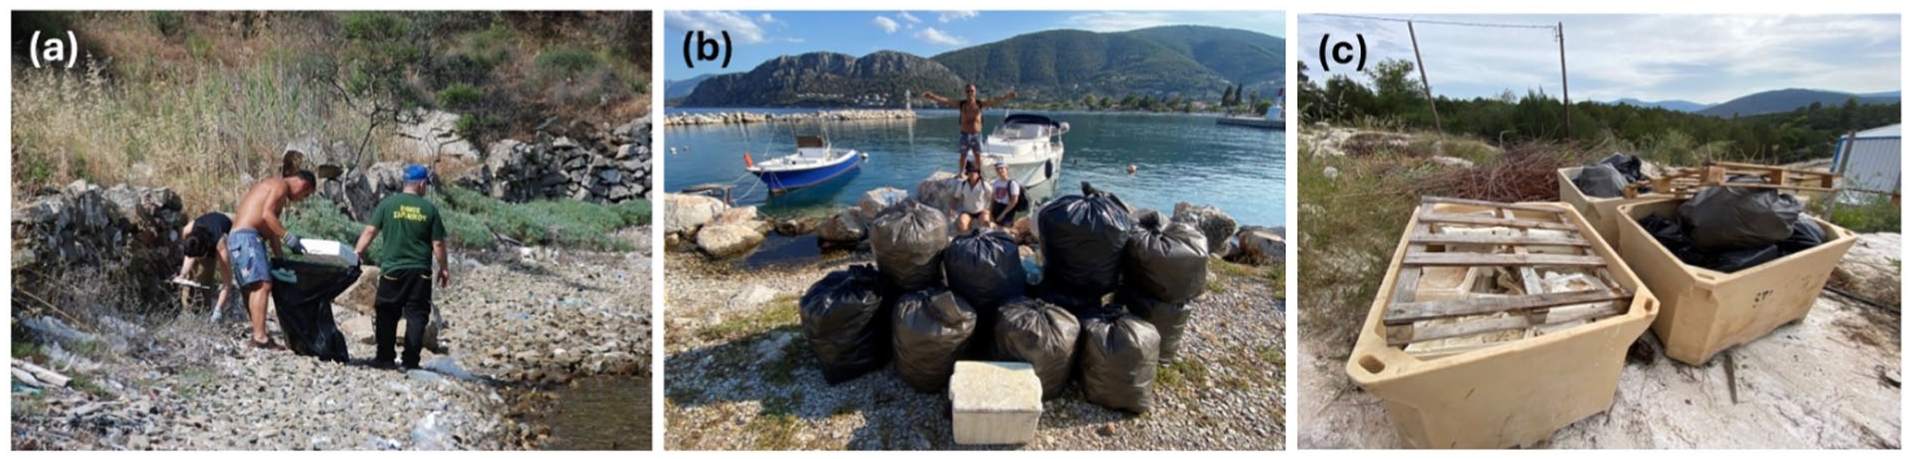
Operational workflow of waste management: (a) on-site bagging, (b) quayside consolidation of the load, and (c) temporary storage in bulk containers prior to processing.
Quantification, packaging, and secondary transport
After the sampling campaigns concluded, all material collected at the consolidation hub underwent a rigorous process to ensure traceability and preparation for secondary transport. Each collection bag, eighty one (81) in total, was individually weighed using an industrial precision scale (0.1 kg) to determine the gross weight. The tare weight of each bag was subtracted to calculate the net recovered mass per station and per campaign. Each unit received a unique identification code (ID tag), linking the physical sample to the geospatial data of its origin point (tier 1, 2, or 3). To address the low material density and optimize transportation costs, a palletization process was implemented. The bags were stacked on standardized EUR-pallets and secured with stretch film and strapping bands. This ensured load stability and prevented leakage during transit, effectively transforming the heterogeneous load into manageable logistics handling units, graphically illustrated in Figure 3. The palletized cargo was loaded onto a light commercial vehicle.
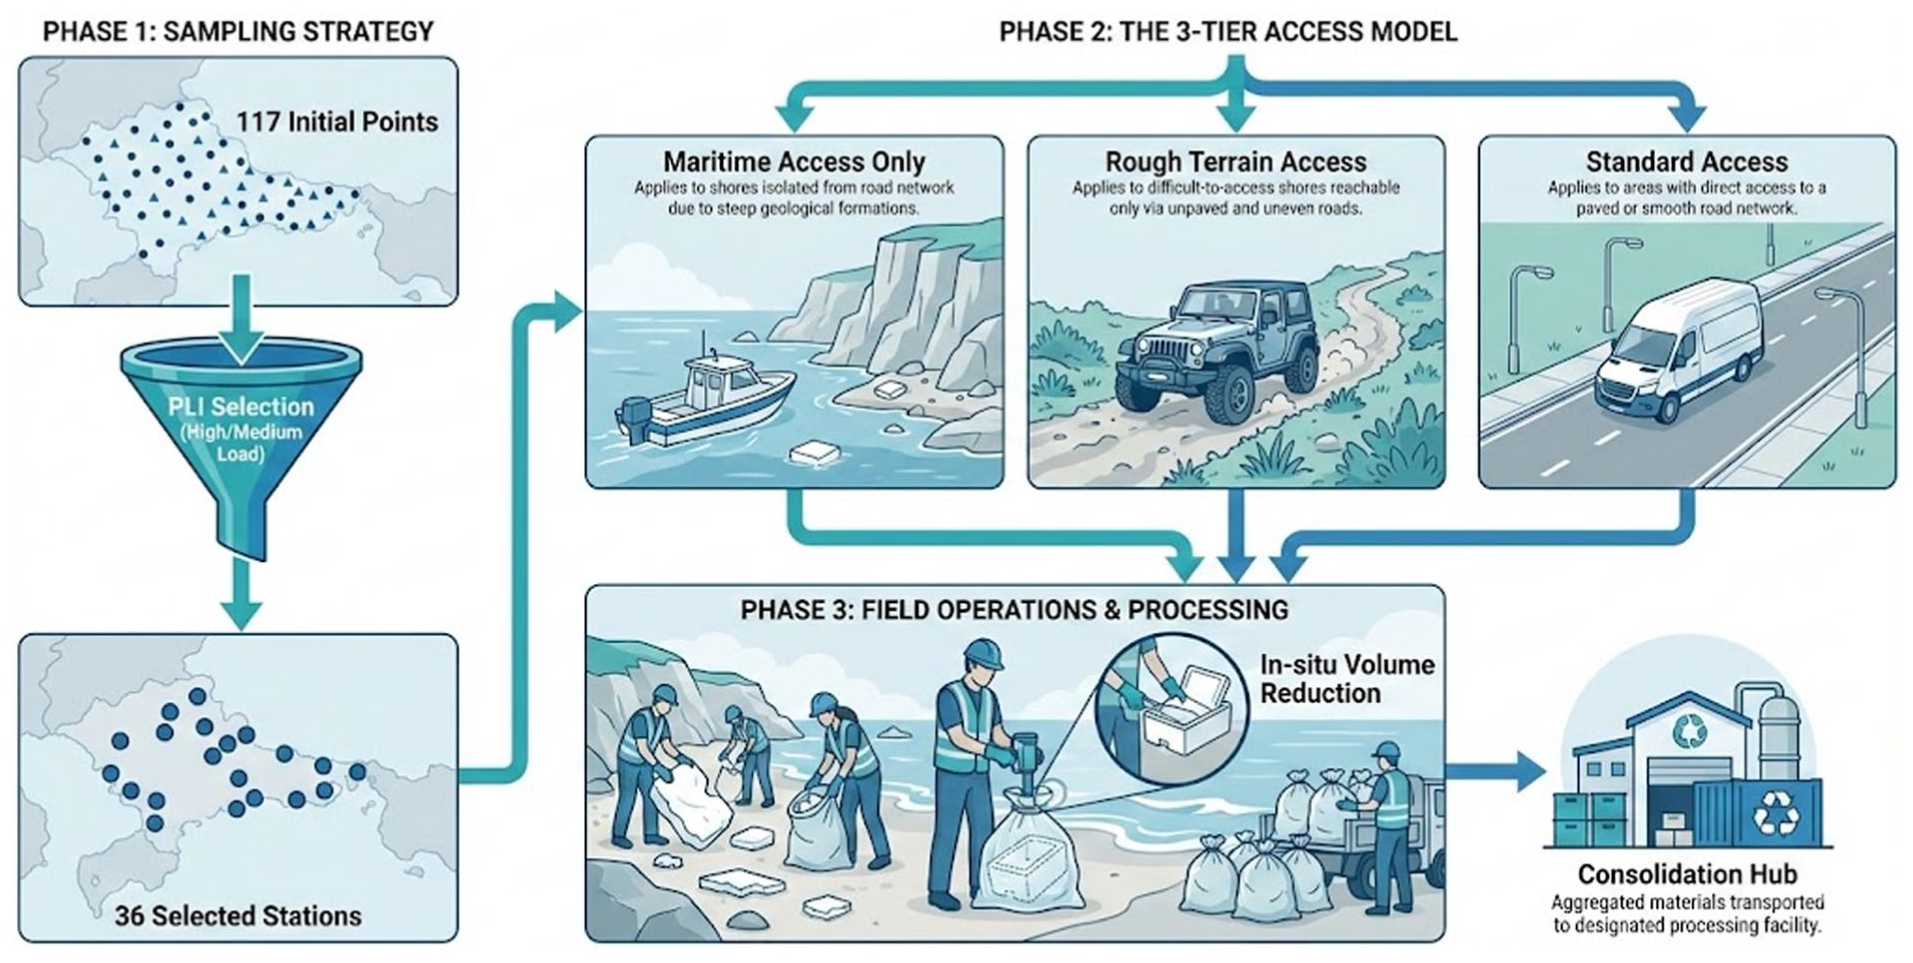
Overview of the sampling strategy and field logistics. The flowchart connects the site selection process based on environmental load with the deployed access methods and material consolidation protocols.
Transportation proceeded from the consolidation hub to the central processing facility, covering a distance of 100 km. This phase marks the conclusion of field operations and the entry of the material into the industrial processing phase.
Material processing
Pre-treatment and mechanical decontamination
EPS waste recovered from the coastal environment showed a wide range of quality degradation (from low to very high) due to prolonged exposure to abiotic factors such as UV radiation and wave action. A predominant feature of the samples was a significant load of adhering impurities, consisting mainly of sandy sediments, stones, dried vegetative debris, and biofouling.
For material decontamination, a rigorous protocol of dry mechanical abrasion was used, see Figure 4. This method was intentionally selected over conventional washing techniques to achieve two objectives: first, to avoid water consumption and wastewater generation; and second, to preserve the physical properties of the material in its “as-found” state, free from chemical cleaning agents. The cleaning process was performed manually with specialized sharp scraping tools. The operational priority was to remove the maximum possible percentage of contaminants while minimizing structural damage to the polymer, thus preventing the loss of recoverable mass and the dispersion of secondary microplastics (fines or dust) into the working environment. During surface cleaning, inspections were also conducted to remove embedded metallic elements often associated with fishing gear waste. After decontamination, the clean EPS fragments were free of moisture and foreign matter that could compromise the mechanical equipment.
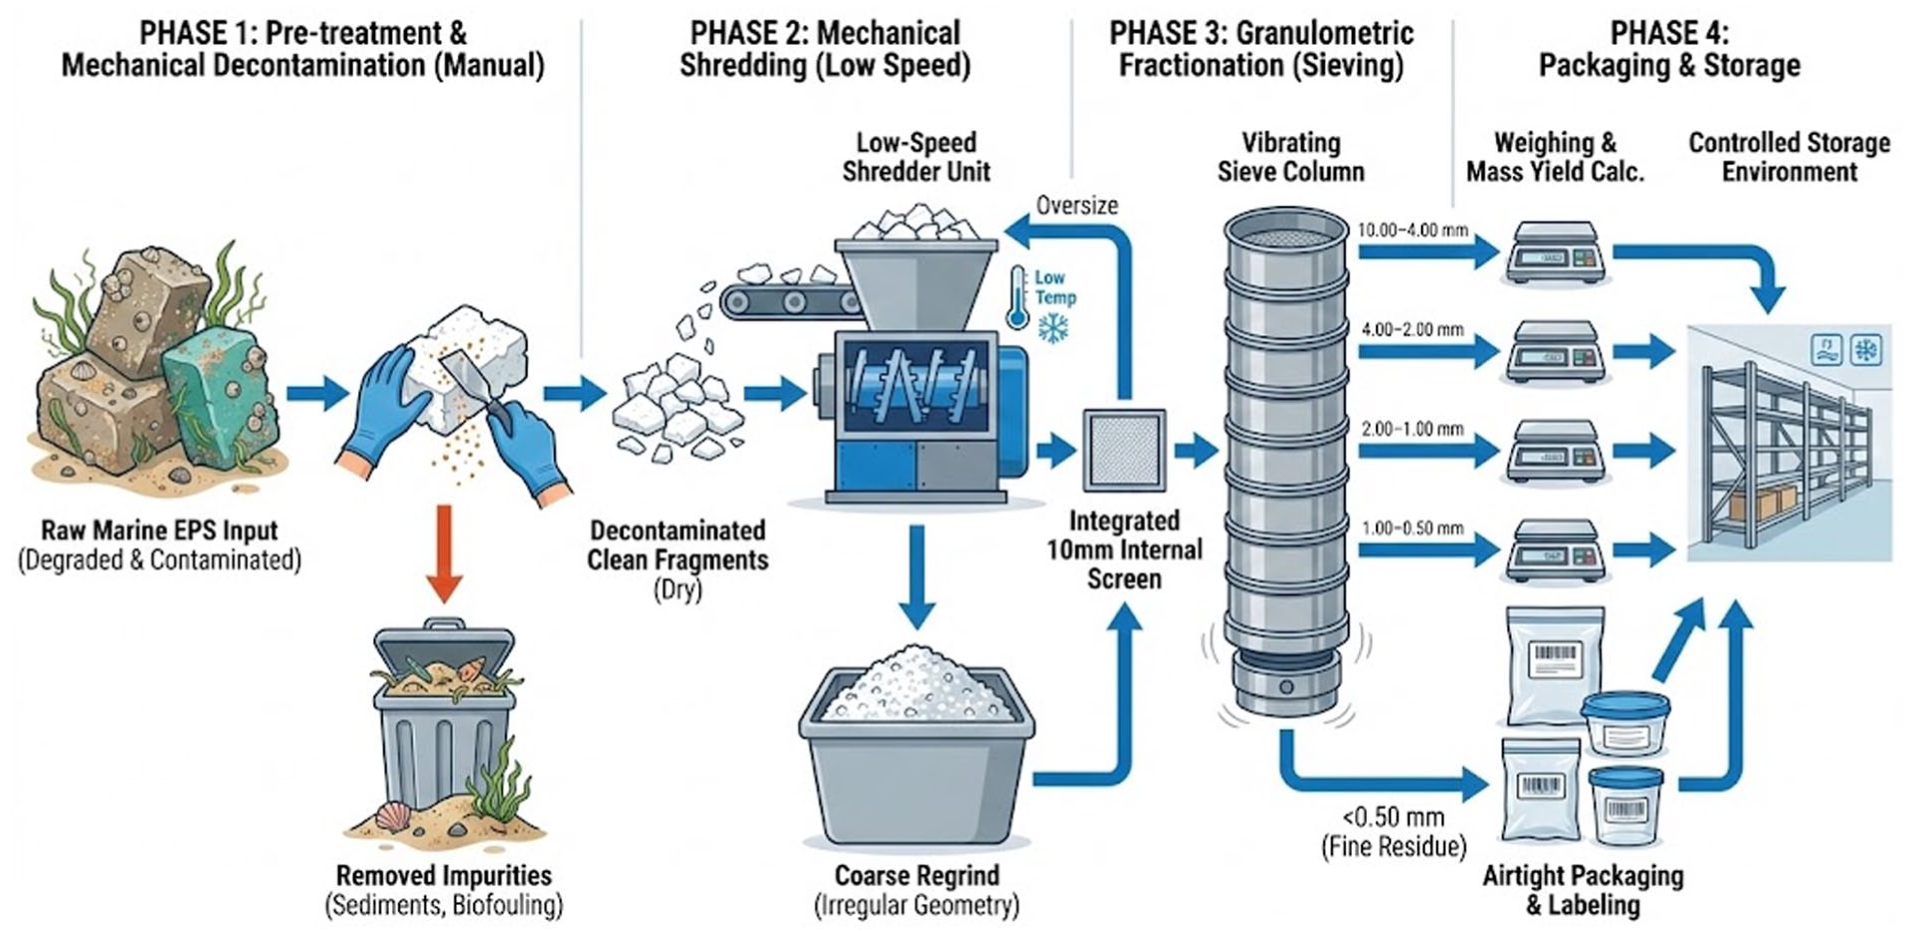
Methodology of the mechanical recycling process applied to recovered expanded polystyrene (EPS), detailing the steps from manual cleaning and decontamination to comminution and final granulometric separation.
Mechanical shredding
The mechanical processing phase began by feeding the decontaminated EPS fragments into a shredding unit designed for low-density porous polymers. The comminution method was selected to reduce volume while preserving the material’s cellular structure. The shredder operated at low rotational speeds, which is critical parameter to the quality of the final product. High cutting speeds in thermoplastic materials such as polystyrene generate high temperatures due to friction. Using a low shear rate prevented thermal degradation or local melting (agglomeration) on the granule surfaces, ensuring the material remained as discrete particles without clumping. Through this process, the irregular fragments were converted into granular material (regrind) of irregular geometry. The comminuted output exited the cutting chamber and was immediately collected in holding containers without mechanical compression to avoid plastic deformation before the sorting stage.
Granulometric fractionation
Size control of the produced fragments was initially performed within the cutting chamber using an integrated internal screen with a 10-mm aperture. This setup ensured that only fragments smaller than the specified diameter could exit the machinery, whereas oversized pieces were recirculated within the cutting chamber until the desired degree of comminution was reached. The resulting mixture, with a guaranteed top size of 10 mm, was then subjected to a secondary precision separation process for further categorization. This process used a column of standard metallic sieves mounted on a controlled mechanical vibration apparatus to isolate specific fractions, see Figure 4. Through sequential sieving, the material was classified into the following five ranges of 10.00–4.00, 4.00–2.00, 2.00–1.00, 1.00–0.50 mm, and the fine residue below 0.50 mm. This separation enabled the isolation of homogeneous granule populations and the generation of standardized material streams ready for packaging.
Packaging and storage
After the fractionation process, each granulometric fraction was collected separately to maintain the integrity of the distinct material streams and prevent cross-contamination between different sizes. Each batch was then precisely weighed, a necessary step for calculating the mass yield of the method and quantifying losses generated as ultra-fine dust during comminution. The recovered material was packaged in airtight containers and polyethylene bags, which were sealed to prevent moisture ingress. Each packaging unit received a unique identification code indicating the processing date, sample origin, and specific granule size range. Finally, the standardized products were transferred to a controlled storage environment, protected from direct sunlight and humidity, thus concluding the production cycle of the secondary raw material.
Definition of scenarios and system boundaries
Functional unit and reference flow
The functional unit of the investigation was defined as the production of 1 kg of mechanically processed recycled expanded polystyrene (r-EPS) granules, clean and suitable for secondary application, graphically illustrated in Figure 5. To accurately allocate environmental and economic impacts within the system boundaries, the necessary reference flow was established. This flow represents the amount of input material required to produce the functional unit, considering the mass balance of the production process. The system design explicitly accounts for inevitable mass losses from the removal of impurities, moisture, and fine fractions during the cleaning, crushing, and sieving stages. Consequently, in both the LCA and economic analysis (ΕΑ), resource and energy inputs have been normalized to the requirement to output 1 kg of clean product, thereby incorporating process yield efficiency into the definition of the system boundaries.
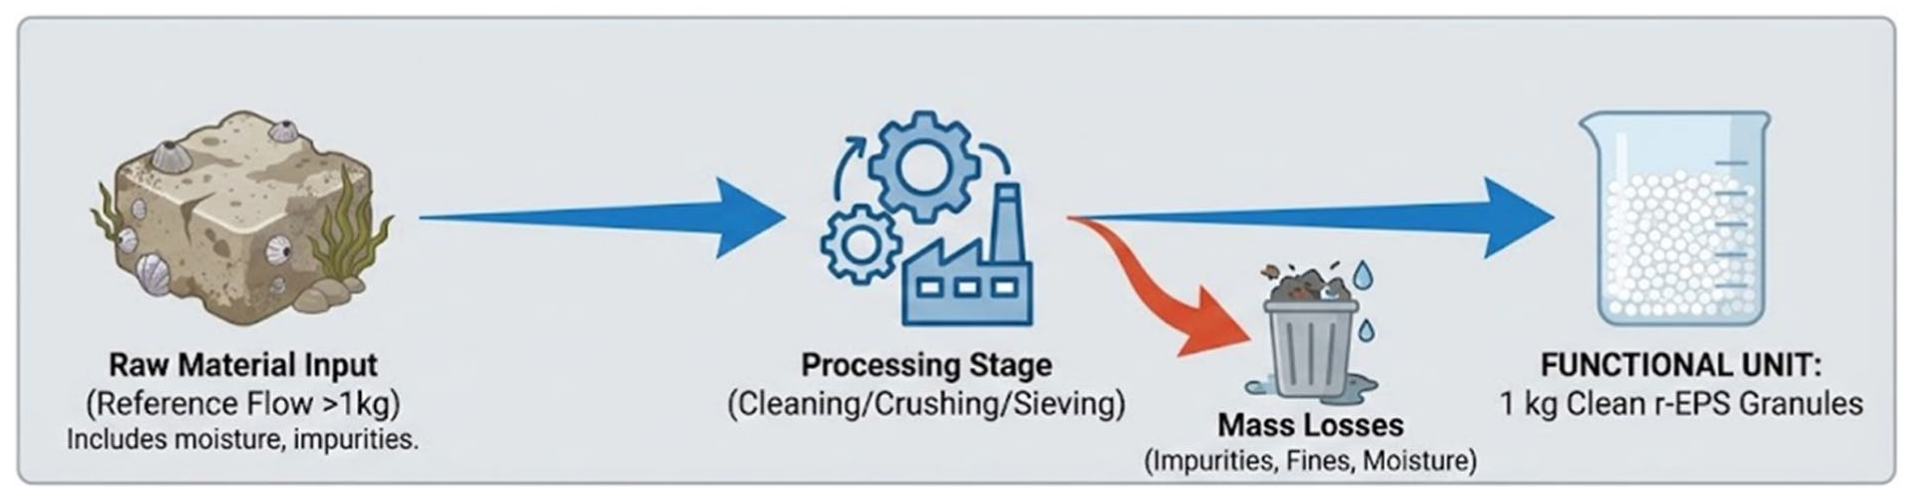
Functional unit definition of the system of the present investigation.
System boundaries and scenarios
The selection and definition of the two investigated scenarios were guided by the research objective to quantify the “operational gap” between two distinct management models. Marine waste management involves high spatial dispersion in the collection area and material degradation due to exposure to environmental factors such as UV radiation and seawater (Çelen-Erdem et al., 2026). In contrast, standard recycling streams in urban areas have more organized collection, with the main challenge being logistics and processing due to the material’s low bulk density (high volume, low weight; Tkalčić et al., 2025).
In this context, Scenario A was designed to simulate the most adverse recovery conditions using a “Shore-to-Gate” approach. The system boundaries start with collection in the marine environment and extend through material processing up to conversion into secondary raw material. To evaluate efficiency, Scenario B was selected as the benchmark scenario using a “Gate-to-Gate” approach. Here, the system boundaries graphically shown in Figure 6 are set at the facility gate, excluding field collection and pre-cleaning stages, as urban packaging waste is an established and homogeneous stream. Contrasting the boundaries of these two scenarios enables precise conclusions about whether marine plastic recycling can be autonomously viable or if it requires management models different from traditional recycling, such as implementing cost-efficient processing units for the direct conversion of waste streams into secondary raw material.
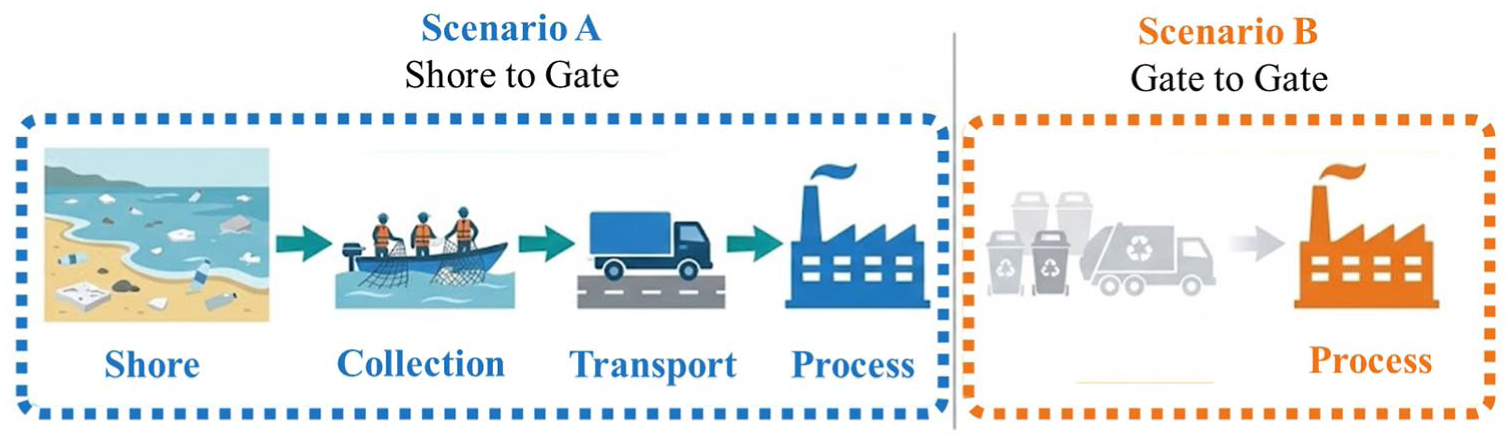
Comparative system boundaries of the two investigated scenarios of the present article: shore-to-gate versus gate-to-gate management scenarios.
Economic analysis methodology
This investigation uses an EA approach to determine the cost of recovering and valorizing marine EPS litter. The analysis is divided into two main phases: (a) the operational phase of collection and transportation, and (b) the industrial phase of mechanical processing. For cost calculation, the activity-based costing (ABC) method was used, allowing precise allocation of resources at each stage of the process (Kokare et al. 2023; Schulz-Mönninghoff and Evans, 2023). In line with the operational design for the collection phase, the economic analysis categorized intervention areas into three accessibility scenarios. This distinction was necessary to quantify the impact of geomorphology and required resources on the final cost, in accordance with the “Three-Tier Access Model” outlined above. The operational cost Co can be calculated in equation (1) by aggregating the individual costs per operational day:

where Cs is the exploratory survey costs, including drone and car rental, specialized labour, and fuel. Cl stands for labour cost, including fees for specialized operators (captains, drone operators) and unskilled workers, whereas Cf goes for fuel cost, calculated based on travel distance and operating/navigation hours. Finally, Cr is the equipment rental cost, including vessels and vehicles, whereas Cls is the logistics and supplies cost, including essential consumables and transportation logistics to the processing facility.
The processing facility located 100 km from the consolidation point. A critical parameter of the methodology is the normalization of costs based on net recoverable material. Since marine EPS contains moisture, sand, and biofouling, a process loss factor was applied. Thus, all unit cost indicators (€/kg) are calculated based on the net output mass rather than the initial collected quantity.
For the manufacturing phase, which includes granulation, sieving, and packaging, a production cost model per kilogram of final product was developed. The model considers several parameters, consisting from the equipment depreciation (Cd), calculated using the units-of-production method and factoring in the initial purchase price, salvage value, and the machinery’s useful life, estimated at 10,000 operating hours as well as energy cost (C e ), based on the specific energy consumption (kWh/kg) of each machine and the average electricity price (€0.15/kWh). Additionally, maintenance cost (Cm) was estimated as a fixed cost per 1000 operating hours for each machine, machine labour cost (Cml) was calculated based on the required operator time per kilogram of processed material and finally facility cost – rend (C fr ), allocated according to the square metres occupied by the equipment and the monthly production capacity, with a base rate of €3/m2. In this regard, the equation for the processing cost (Cp) per kilogram is defined as:

LCA methodology
The environmental modelling of the system was conducted using LCA for Experts® software, Sphera, U.S. which allows detailed representation of complex waste management systems. For the environmental impact assessment framework, the Environmental Footprint (EF) methodology version 3.1, developed by the European Commission was selected (European Commission, 2022). This ensures consistency, comparability, and regulatory relevance of the results within the European Union, as it incorporates updated characterization factors reflecting European conditions. After defining the investigation scenarios and the functional unit, the analysis adopted the “cut-off” approach. According to this approach, marine EPS is considered a “burden-free” material upon entry into the system. Therefore, the environmental burdens associated with the initial production of virgin EPS are excluded from the system boundaries. The analysis flow diagram can be found in Figure 7 and focuses exclusively on the waste management pathway, including collection from the natural environment, transportation, and industrial processing to produce secondary material.
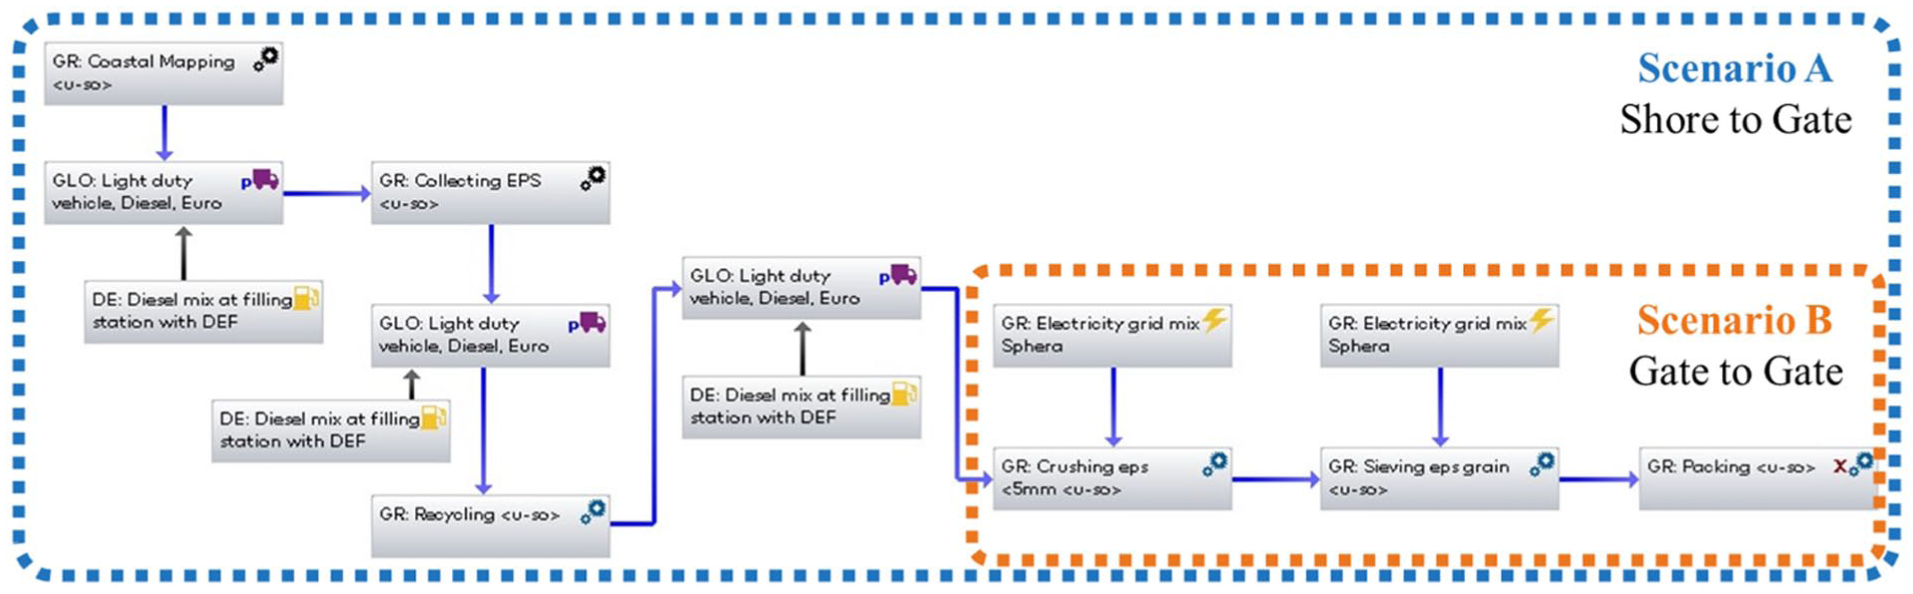
Process flow derived from life cycle assessment (LCA) software.
The life cycle inventory was based on primary data collected during unit operation and includes the following information regarding energy consumption: it was modelled using the Greek electricity grid mix for 2020 (Sphera® database) to accurately capture the carbon footprint of processing. For the transportation, a light-duty Euro 5 vehicle model (collection and transport) was used. For the collection stage (Scenario A), a distance of 10 km per 1.11 kg of collected material was assumed, whereas transportation to the processing facility was estimated at 100 km. Finally, during processing, mass loss was calculated as the amount of biofouling and fines removed from the main product stream.
For a more comprehensive interpretation of the results, a complementary cradle-to-gate comparative analysis was performed exclusively at the material level. In this analysis, the produced r-EPS granules are compared with conventional aggregates (natural and artificial sand). The aim is to document the environmental feasibility of substituting natural resources with recycled marine EPS in construction material applications, without modifying the boundaries of the main LCA system. All input–output data are summarized in Table 1 for transparency.
Life cycle inventory inputs for the EPS waste management system.
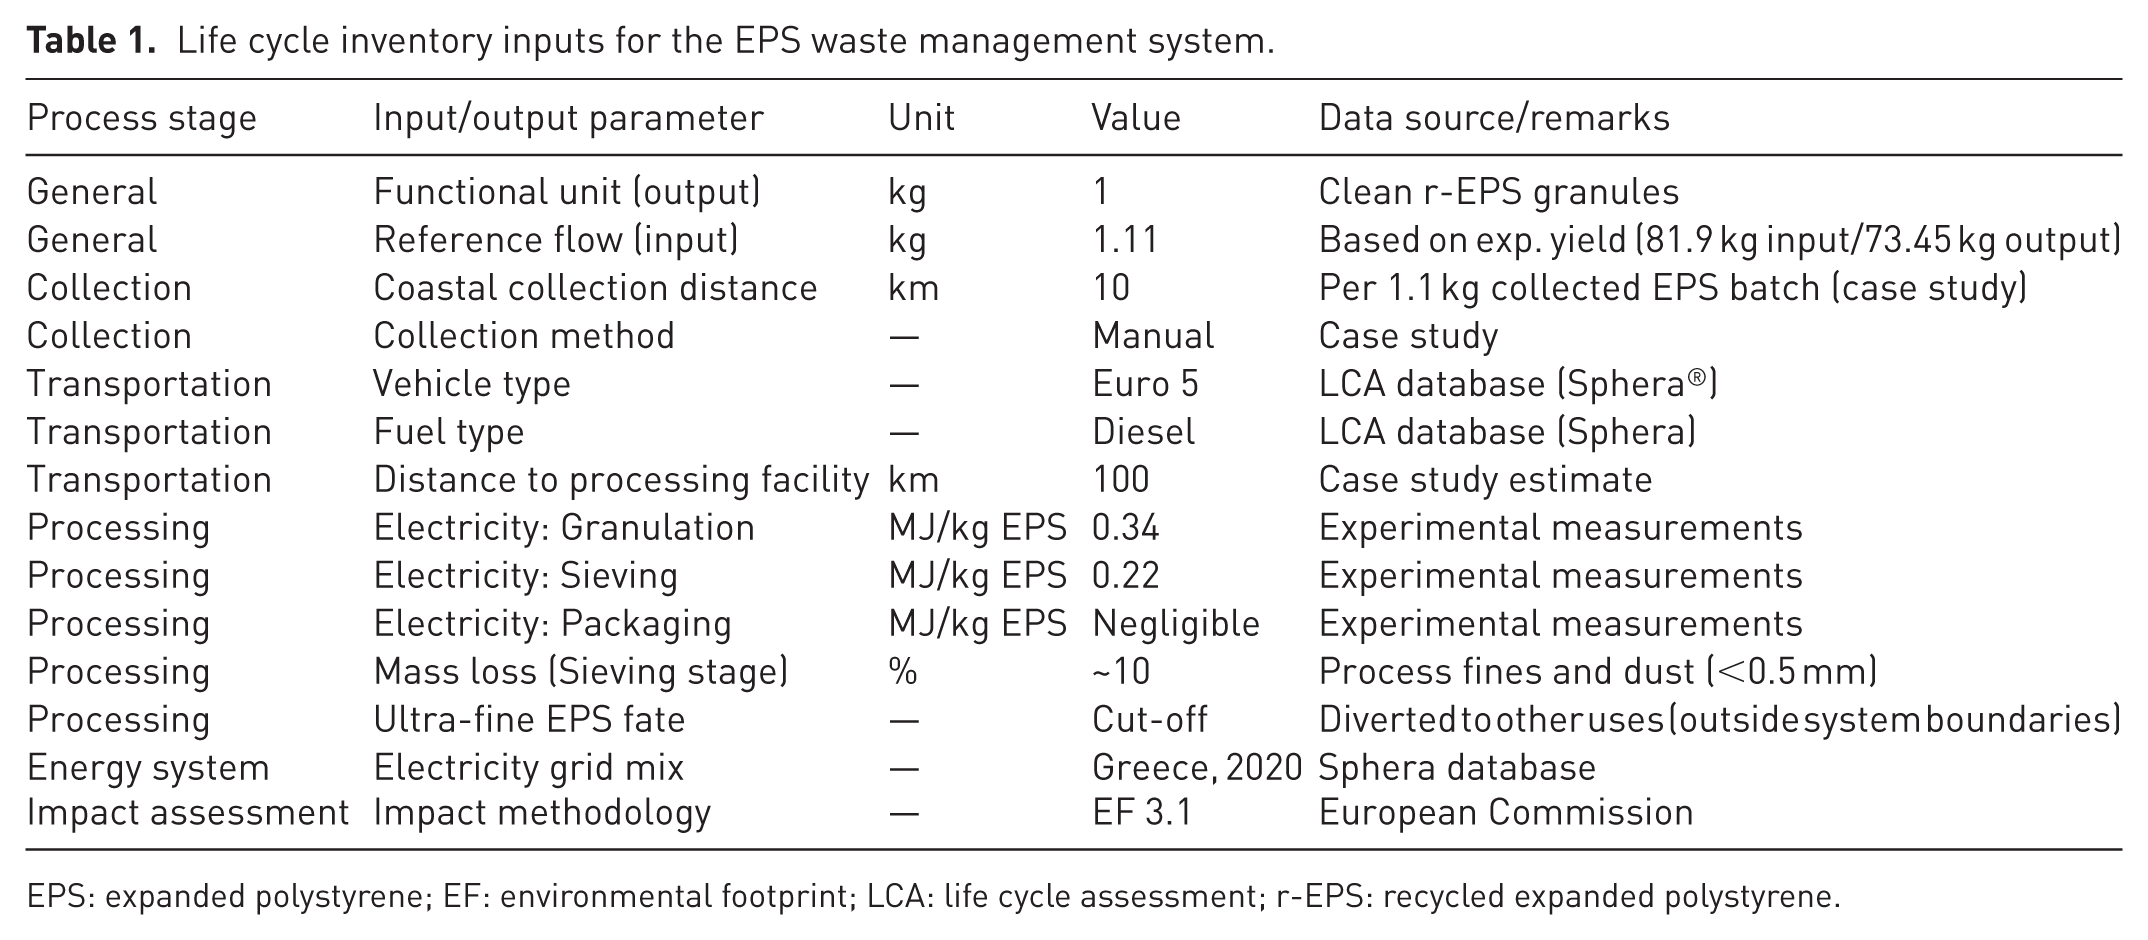
EPS: expanded polystyrene; EF: environmental footprint; LCA: life cycle assessment; r-EPS: recycled expanded polystyrene.
Results and discussion
Collection and production process
Load distribution and collection efficiency
The total mass of EPS waste recovered during the three cleaning cycles was 94.9 kg. The spatial distribution of the load showed significant heterogeneity, highlighting clear differences in accumulation dynamics among the three intervention areas, see Figure 8. Inaccessible beaches were the primary hotspots, contributing 56.7% of the total collected mass (53.8 kg). The most notable finding in this category is the temporal stability of the pollution load. Unlike other categories, quantities remained high across all three cycles (18.19, 15.36, and 20.31 kg, respectively). The third cycle recorded the maximum value (20.31 kg, or 37.7% of the category’s total). This pattern indicates that these shorelines function as permanent accumulation sinks. Their morphology and prevailing hydrodynamic conditions (currents, wave action) lead to the continuous deposition of new material, rapidly replenishing the quantities removed in the previous cycle. The Floating Collection category showed distinctly different behaviour, acting as an indicator of the “Standing Stock” (Hurd, 2000). During the first cycle, the maximum quantity of the study was collected (29.48 kg), representing 78.5% of the total floating material found. In the next two cycles, the mass dropped to significantly lower levels (3.91 and 4.15 kg, respectively). This sharp decrease demonstrates the high effectiveness of the initial intervention in removing the accumulated pollution identified during the mapping phase. It also suggests that continuous monitoring can enable immediate collection, preventing marine litter from becoming stranded in inaccessible areas (Davey, 2021).
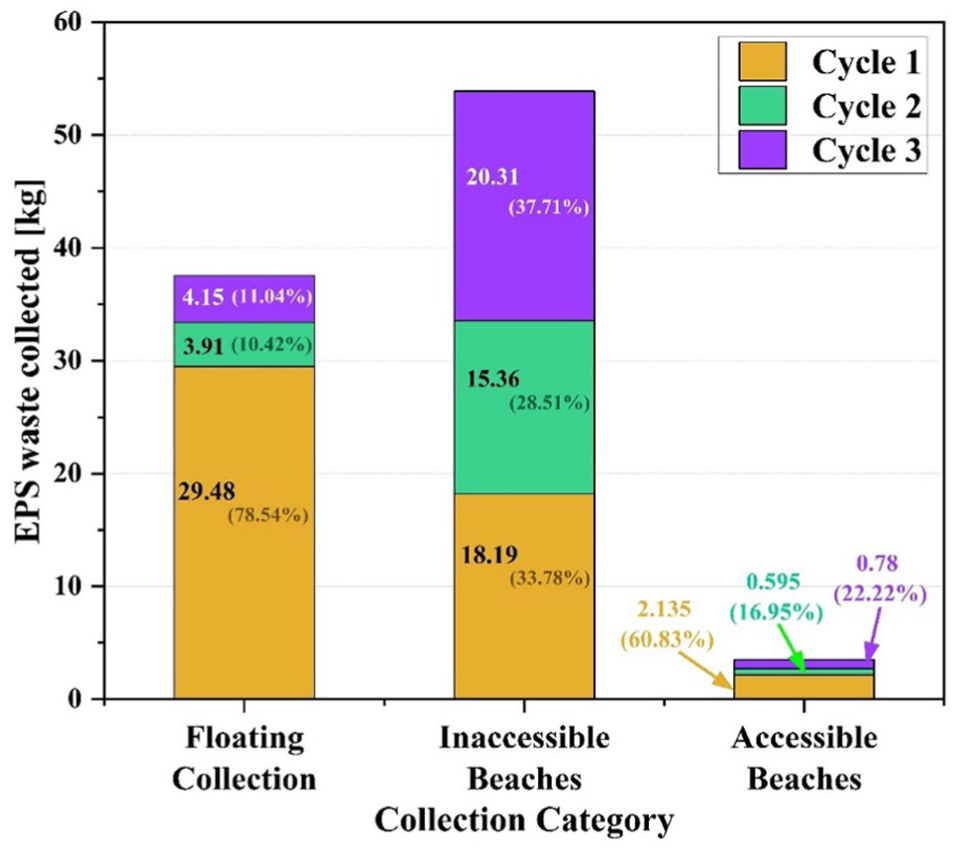
Spatiotemporal distribution of collected expanded polystyrene (EPS) mass across the three cleaning cycles, categorized by collection site as floating, inaccessible and accessible.
Accessible beaches contributed minimally to the total load (only 3.5 kg). Similar to the floating category, a decreasing trend was observed after the first cycle (from 2.13 kg to less than 0.8 kg). This low initial load is likely due to regular cleaning by local authorities or beach users, which prevents long-term material accumulation.
Operational efficiency and the role of debris morphology
The comparative analysis of the recovery rate, expressed in kilograms per man-hour, revealed a fundamental difference in collection dynamics across the intervention areas, see Figure 9. This variation is not random but directly related to the integrity status and distribution of the pollution load in each environment.
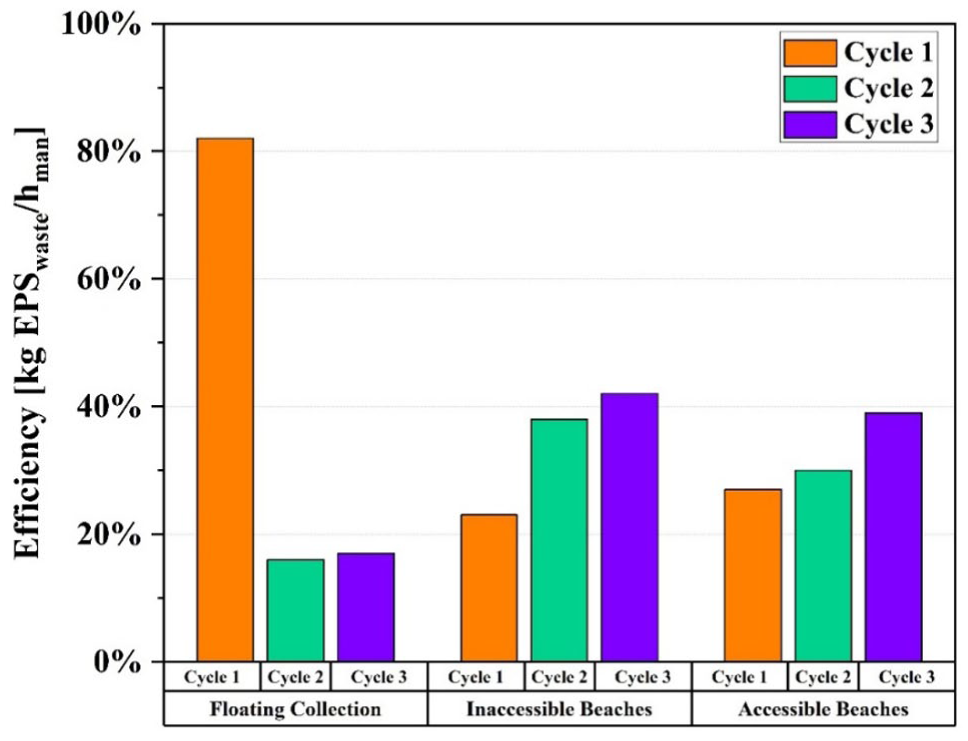
Comparative assessment of recovery rates (collection efficiency) across the three intervention areas.
The exceptionally high efficiency recorded during Cycle 1 of floating collection, reaching a peak value of 0.82 kg/h, is the most significant indicator of operational viability. This performance is due not only to material abundance but primarily to its morphology. As documented by visual recording, the floating load consisted mainly of intact items or large fragments (macro-debris >50 cm), such as fish boxes and aquaculture buoys. These items have an exceptionally favourable mass-to-effort ratio. A single retrieval motion by the vessel crew yielded a significant quantity of mass (often >500 g per item). The use of specialized equipment, such as large-volume mesh bags, allowed for faster handling and compression of the bulky material (Figure 10). Consequently, strategically targeting floating masses serves as a “first line of defence,” enabling removal of the pollutant while it retains its structural cohesion and before it undergoes mechanical fragmentation on the shoreline.
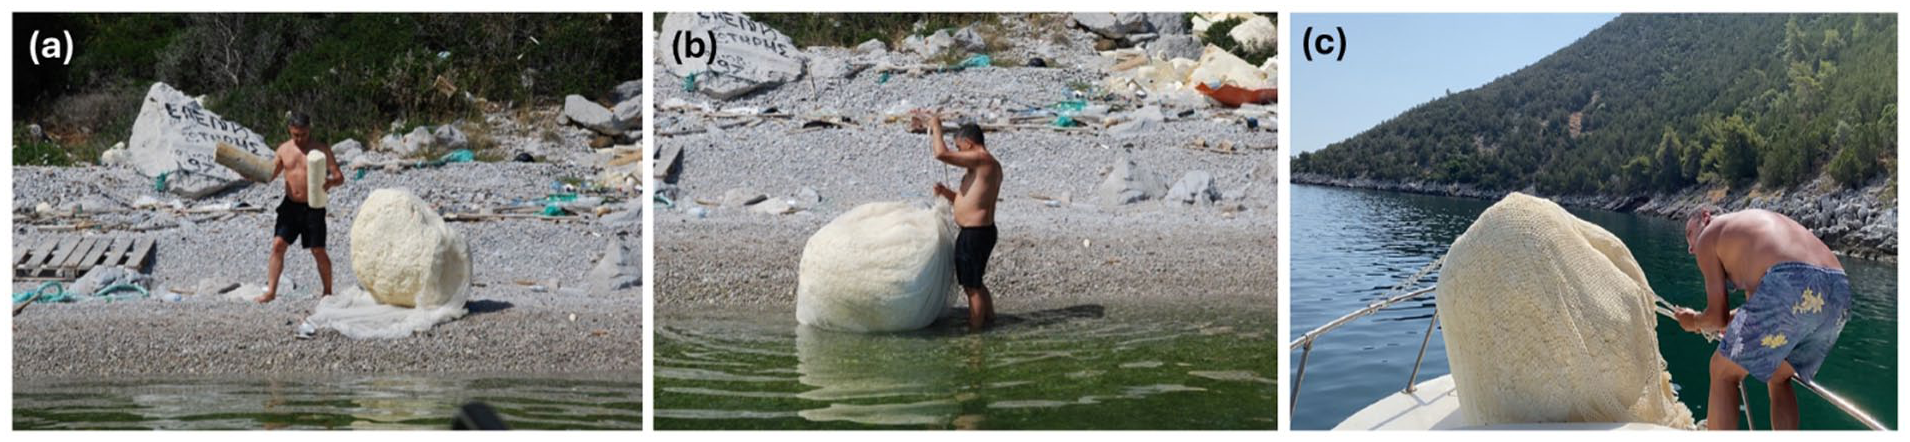
Operational stages of vessel-based macro-expanded polystyrene (EPS) retrieval: (a) collection of large debris items by the boat crew, (b) in-water containment and volume reduction using mesh bags, and (c) hauling and securing the consolidated load onto the support vessel.
The dramatic drop in efficiency in subsequent cycles (<0.20 kg/h) reflects the depletion of these large items. The operation necessarily shifted to locating smaller, dispersed fragments, where search time disproportionately exceeds handling time, confirming the principle of diminishing returns. Conversely, inaccessible beaches functioned as natural mechanical “grinders” and sediment traps. Although the total load was higher in absolute numbers as shown in Figure 9, collection efficiency started at extremely low levels (0.23 kg/h). This apparent paradox is explained by the drastic change in EPS morphology upon impact with the rocks. The combined action of hydrodynamic energy (wave action) and solar radiation (photo-oxidation) led to extensive secondary fragmentation. Instead of large, manageable pieces, field teams had to handle thousands of micro-fragments (meso-debris <15 cm; Andrady, 2022). This shift in scale imposed two critical constraints:
Entrapment mechanism: Due to their small size and low density, the fragmented material penetrates deep into rock crevices and becomes entangled in the root tissue and low branches of coastal vegetation (Figure 11). EPS ceases to be a surface pollutant and becomes integrated into the abiotic and biotic substrate of the shore.
Time penalty: The disentanglement process requires delicate, precise manipulations. To collect the same quantity of mass, that required two motions at sea, on the shore required hundreds of repetitive picking motions, drastically reducing the recovery rate per unit of time.
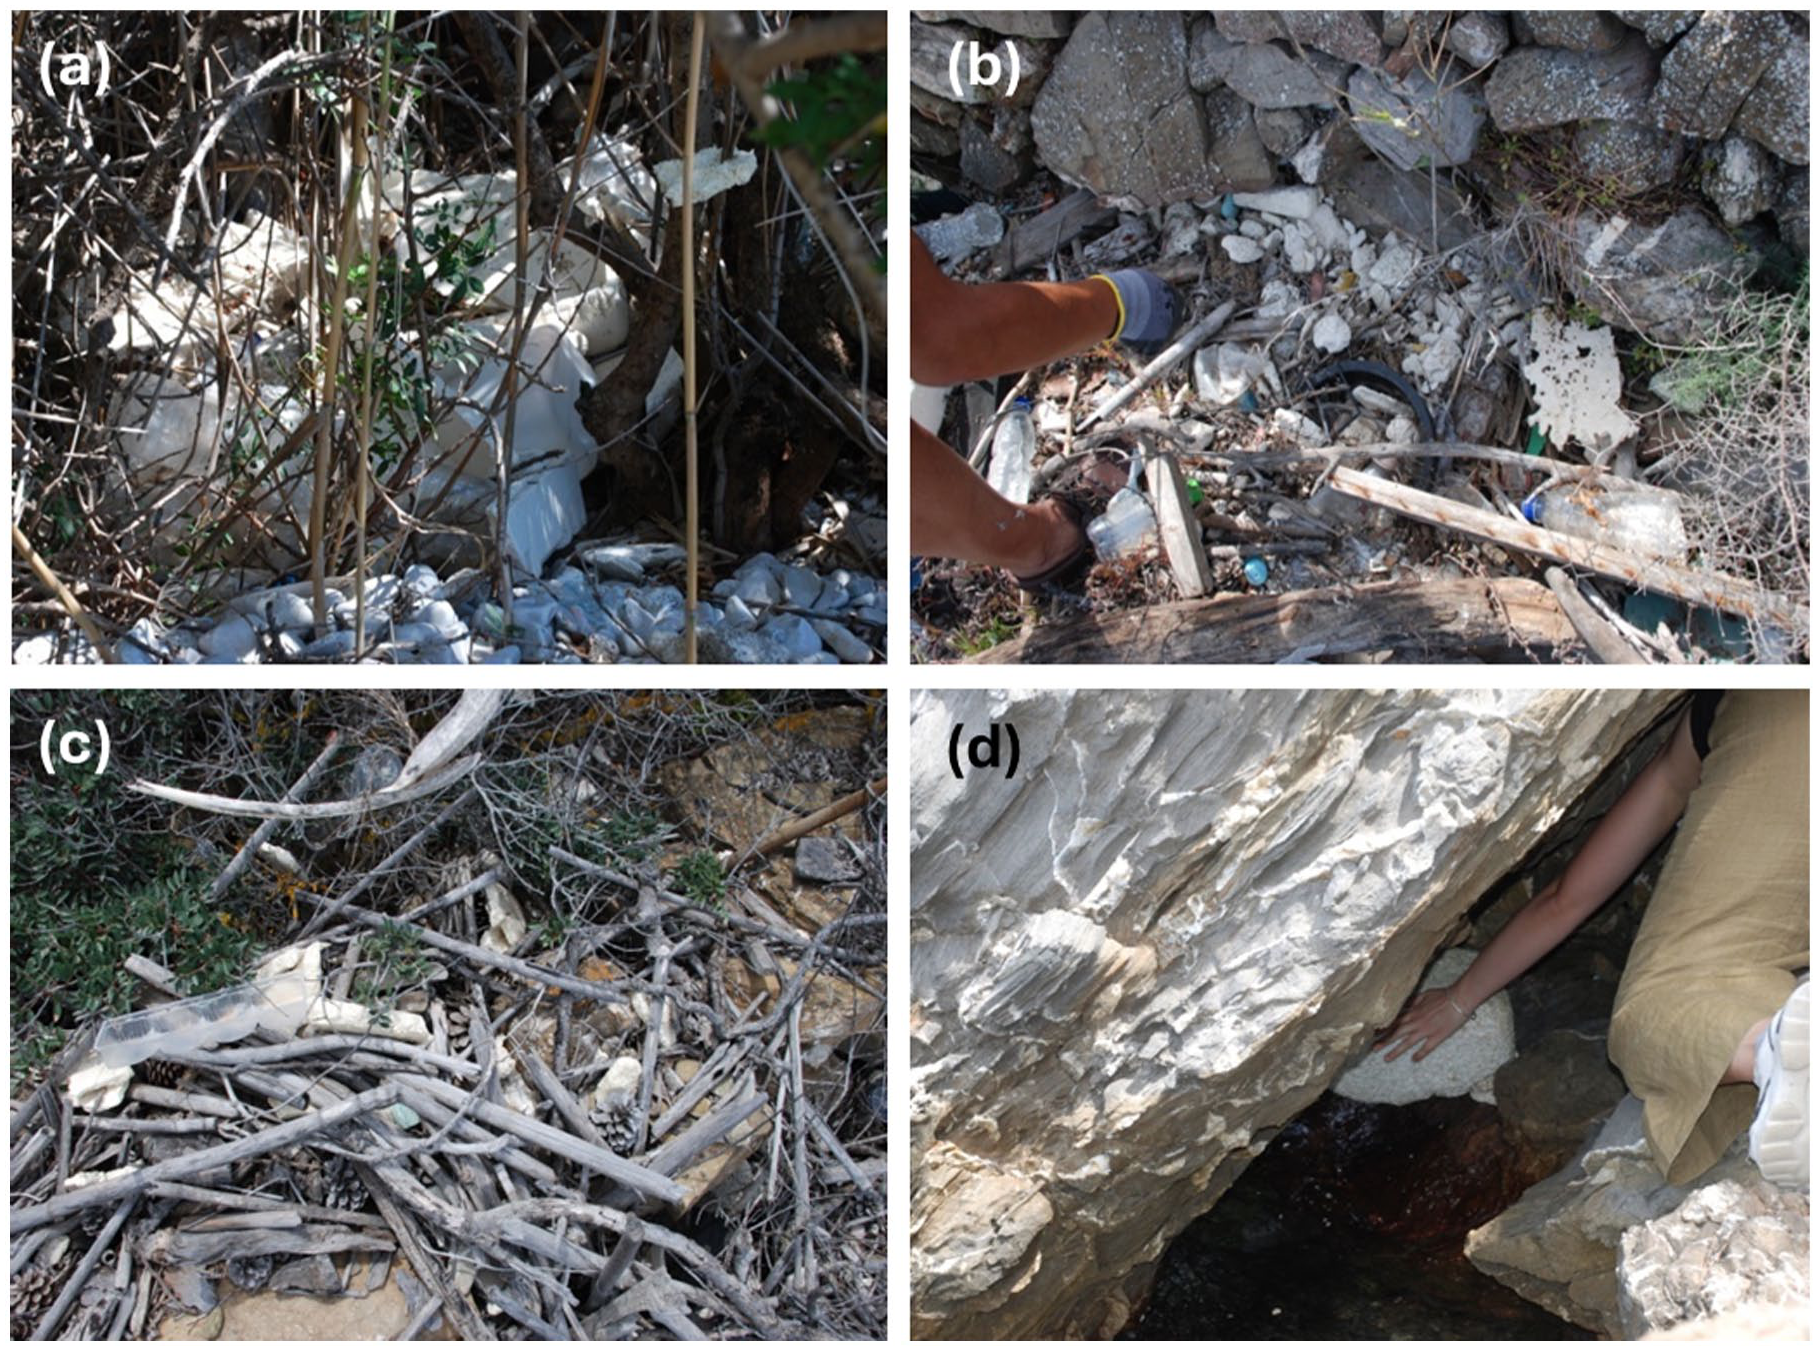
Challenges of manual expanded polystyrene (EPS) collection on rocky terrain include: (a) entanglement in coastal flora, (b) handling fragmented debris mixed with sediment, (c) dispersion of small fragments among driftwood, and (d) extraction of trapped material from deep rock fissures.
Despite the inherent difficulties of the geomorphological terrain, efficiency on inaccessible beaches showed a clear, steady improvement, reaching 0.42 kg/h in Cycle 3. This increase is not due to a change in pollution, but to the operational adaptation of the team (learning curve). The team developed empirical techniques for faster detection of “accumulation zones” behind the wave break line, avoiding aimless searching in low-density areas, which maximized active cleaning time.
Finally, accessible beaches maintained an intermediate and relatively stable efficiency, ranging between 0.20 and 0.40 kg/h. This finding is of particular interest, given that the total pollution load in these areas was extremely low (low standing stock). The maintenance of efficiency at these levels is explained by the high mobility factor. The absence of obstacles on the sandy or pebbly substrate allowed cleaning teams to scan large stretches of coastline more rapidly. Unlike inaccessible beaches, where time is consumed in “disentanglement,” here time is invested in “covering distance.” This balanced the low density of debris, allowing for the collection of dispersed micro-items at a rate comparable to that of inaccessible beaches in their initial stages.
Process assessment
The evaluation of the sustainability of marine EPS recycling extends beyond collection to include the efficiency of its conversion into secondary raw material. This process was analysed through mass balance and the granulometric distribution of the produced material. The total collected input load (94.9 kg) underwent a complete cycle of mechanical recycling, revealing two distinct categories of mass losses directly linked to the environmental history of the material (Figure 12). During manual cleaning and sorting, 13.0 kg of foreign matter were removed, corresponding to 13.7% of the initial mass. This high percentage reflects the “environmental footprint” of marine residence: it includes sand trapped in the material’s pores, salt aggregates, and, primarily, intense biofouling by algae and barnacles, which increase the apparent weight of the debris without contributing recyclable polymer. During mechanical shredding, an additional loss of 8.44 kg (8.9%) was recorded. This loss distinguishes marine EPS from post-consumer domestic EPS: due to prolonged exposure to solar UV radiation, the material has undergone photo-oxidative ageing, making it brittle. Upon impact with the shredder blades, part of the mass is not cut into granules but is pulverized into fine dust (fines <0.5 mm), which is removed as non-usable material through dust extraction.
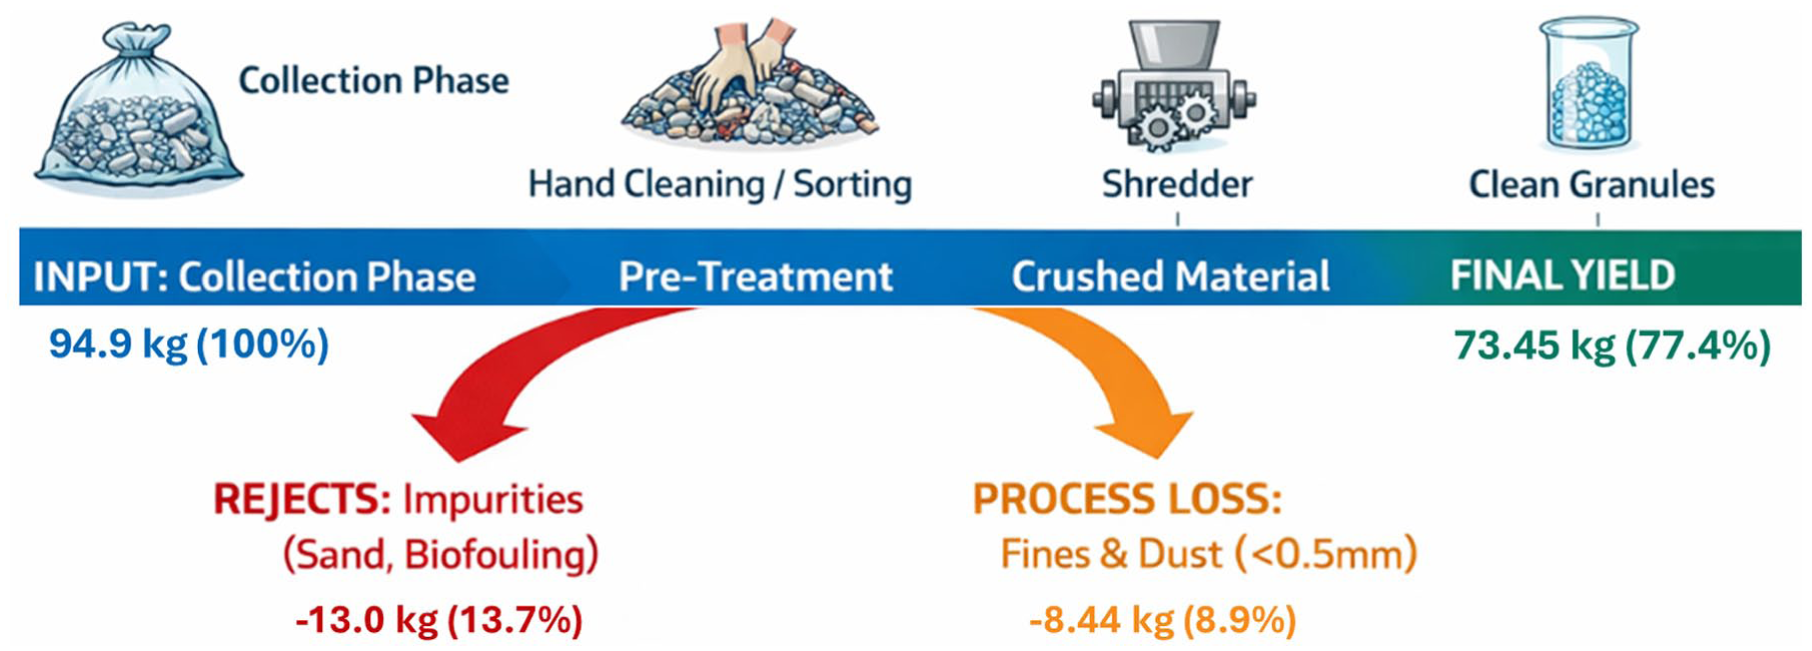
Quantitative analysis of the recycling stages, from raw marine debris input to clean recycled expanded polystyrene (r-EPS) output.
Despite these losses, the process yielded 73.45 kg of clean recycled granulate (r-EPS), achieving a total yield of 77.4%. This percentage is considered highly satisfactory for material that has undergone extreme environmental weathering.
The quality and commercial value of the recovered material were determined through granulometric analysis of the produced granulate (r-EPS), as shown in the frequency histogram (Figure 13). The particle size distribution is clearly skewed towards larger fractions, indicating successful calibration of the production process. Most of the material, totalling 82.8%, is concentrated in the size range of 2–10 mm. Specifically, the 4–10 mm fraction dominates with 45%, followed by the 2–4 mm fraction with 37.8%. This finding is critically important, as these specific granule sizes are most sought after for applications in lightweight concrete and insulating fillers, ensuring immediate valorization of the material in the construction materials market (Amariles-López et al., 2024; Meddage et al., 2022). The smaller fractions (<2 mm) account for less than 18% of the total mass, with the very fine material (0–0.5 mm) limited to just 2.5%. The low presence of “dust” in the final sample confirms that the aspiration system during shredding operated effectively, removing degraded microparticles and leaving a clean, homogeneous product of high added value. The combined analysis of mass and size demonstrates that, despite the structural ageing of marine EPS, mechanical recycling can recover nearly three-quarters of the initial mass as granulate suitable for industrial reintegration.
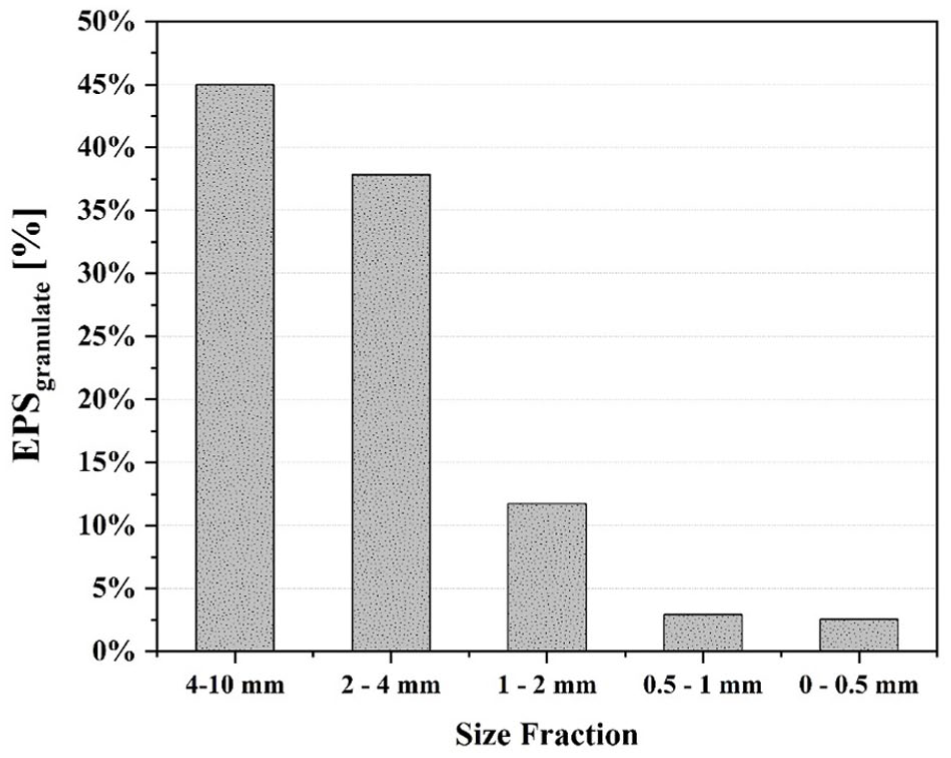
Granulometric analysis of the final recycled product retrieved from coastal expanded polystyrene (EPS) debris.
Economic analysis
Collection phase
The application of the ABC methodology to the collection campaign revealed significant fluctuations in resource allocation, driven by the geomorphology of the intervention areas. The total expenditure of €5.623,10 is not a uniform expense but the result of diverse operational challenges. Primary data processing, as shown in the overall cost distribution, highlights the decisive role of the human factor in material recovery, see Figure 14(a). The analysis underscores the critical impact of labour, as personnel costs account for 48,7% of the total budget. This dominance supports the assumption that marine EPS collection remains a labour-intensive activity, directly dependent on manual intervention and field operating time. At the same time, the combined analysis of fuel costs (8.8%) and equipment rental (26.1%) reveals the nature of the project’s logistical support. Equipment rental, comprising nearly one-third of the total expenditure, demonstrates that the availability of specialized machinery is a prerequisite involving high fixed costs, which are not matched by proportional energy consumption. The fact that equipment costs are triple those of fuel suggests that the economic burden does not arise from travel distances, but from the necessity of using this equipment as operational platforms at accumulation points. Consequently, the operation is characterized by high “readiness and access” costs rather than “transportation” costs.
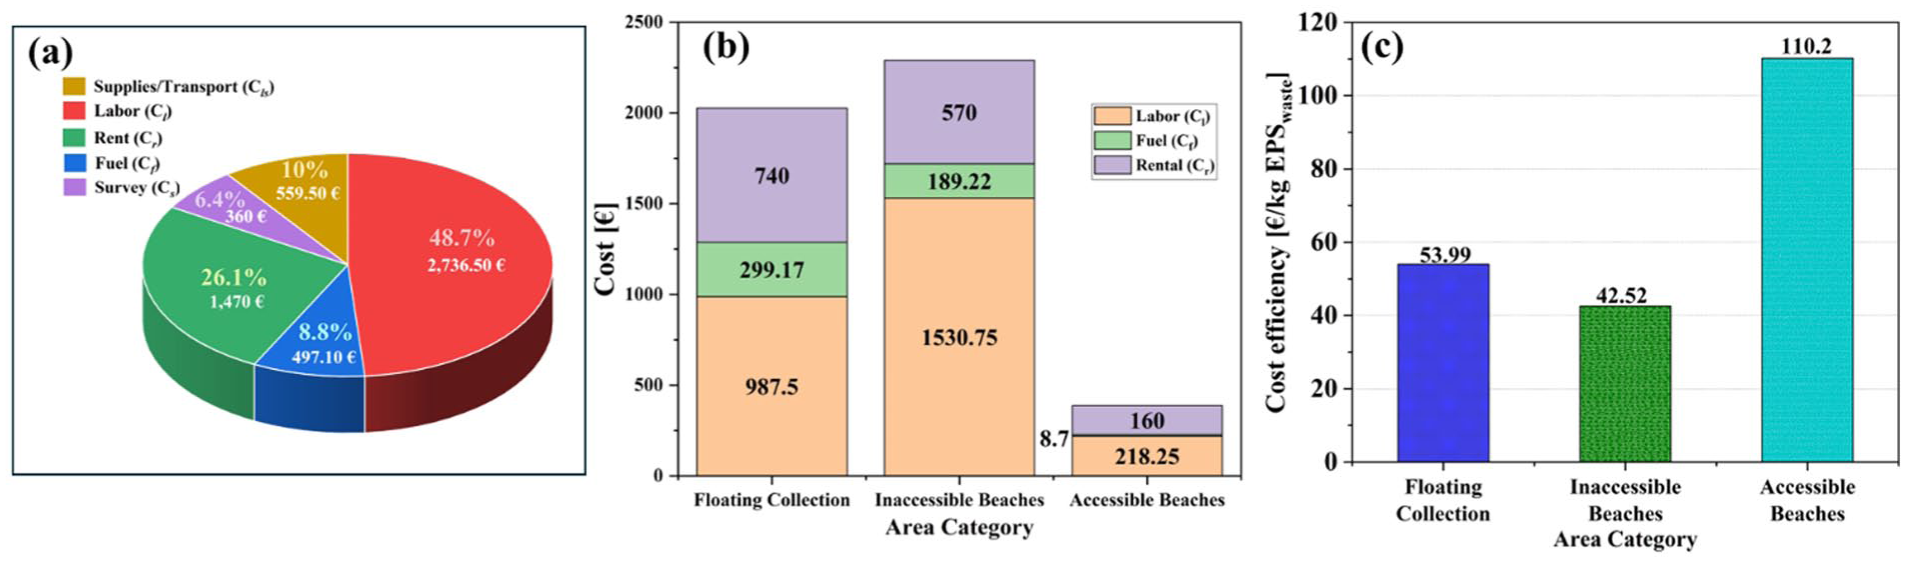
Economic assessment of the marine expanded polystyrene (EPS) collection phase: (a) total cost distribution by resource category, (b) operational cost breakdown per intervention areas, and (c) comparative cost efficiency across intervention areas.
The integration of the preliminary survey cost is particularly important; although it represents only 6.4% of the total, it constitutes a strategic investment in mitigating operational risk. Precise mapping of hotspots enables optimal allocation of expensive resources, ensuring that equipment and personnel are focused exclusively on high-yield areas. Additionally, the integration of field supplies and transportation logistics costs, which account for 10% of the total, highlights the critical expenses incurred between the collection and processing phases. Although the cost of consumables and packaging remains low, the expenditure for transporting the material over a distance of 100 km represents a significant fixed burden. The fact that this logistics segment is nearly equivalent to the total fuel expenditure (8.8%) underscores that geographic distance from the processing facility is a decisive factor for the project’s economic viability. It adds an additional layer of fixed costs before the manufacturing phase begins.
Transitioning to the analysis by intervention areas allows for an understanding of how geomorphology dictates resource allocation, see Figure 14(b). On inaccessible beaches, the surge in labour costs to €1530.75 reflects the physical difficulties and increased man-hours required for material transport over rugged terrain. Conversely, floating collection presents a fundamentally different economic profile, where the need for specialized equipment shifts the emphasis to rental costs (740 €) and fuel (299.17 €). This comparison demonstrates that the operational cost parameter is not static but adapts to the requirements of each area, with accessible beaches maintaining the lowest operational threshold (386.95 €) due to logistical ease.
Evaluation using the unit cost indicator (€/kg) highlights a critical paradox defining the project’s viability, see Figure 14(c). Although inaccessible beaches require the highest total expenditure, they are the most efficient scenario at 42.52 €/kg, as the high density of EPS in these areas enables economies of scale. In contrast, collection at easily accessible points, despite low operational costs, proves economically inefficient, with the unit cost rising to 110.2 €/kg due to the small quantity of recovered material. This analysis concludes that the economic success of the collection phase depends on targeting areas with high waste mass, where the high intervention cost is offset by the large quantity of net recoverable material, resulting in a campaign average of 49.56 €/kg.
Processing phase
In the preceding section, results were presented as aggregated totals that can be converted to a per-kilogram or per-cubic metre basis. In contrast, the processing section presents the economic analysis directly on a per unit weight basis (kg). This approach was chosen because estimating processing costs based solely on the limited quantities collected during the pilot campaign would overestimate unit costs. Therefore, the assessment assumes a medium-scale industrial facility operating under steady material input conditions, based on equipment technical specifications, labour requirements, and facility operating costs. Specifically, the allocation of depreciation and maintenance costs depends directly on the throughput of each machine, making processing speed a primary cost driver. The use of the units-of-production method ensures that the financial burden corresponds to actual equipment usage per unit of product. Rent is allocated based on monthly production capacity and spatial footprint, energy costs are calculated as variable expenses, and labour costs are included only in stages requiring active supervision, such as granulation and packaging.
The transition from collection to processing transforms marine EPS from an environmental pollutant into a secondary industrial product. Data analysis shows that the cost structure is determined by technological intensity and the material’s specific properties, see Figure 15(a). Granulation is the dominant economic driver, accounting for 50.9% of total manufacturing expenditure. This is expected, as granulation is the main mechanical conversion stage, where the need for significant volume reduction requires resource most resources. In contrast, sieving adds only 19.6% to the final product cost, making it the most cost-efficient phase due to its high level of automation. Packaging and storage account for 29.5%, a substantial share for a supporting activity. This cost structure reflects the challenges posed by the intrinsic nature of EPS; its high volume-to-weight ratio imposes a significant financial burden on management and retention, making storage logistics a critical factor in the final cost.
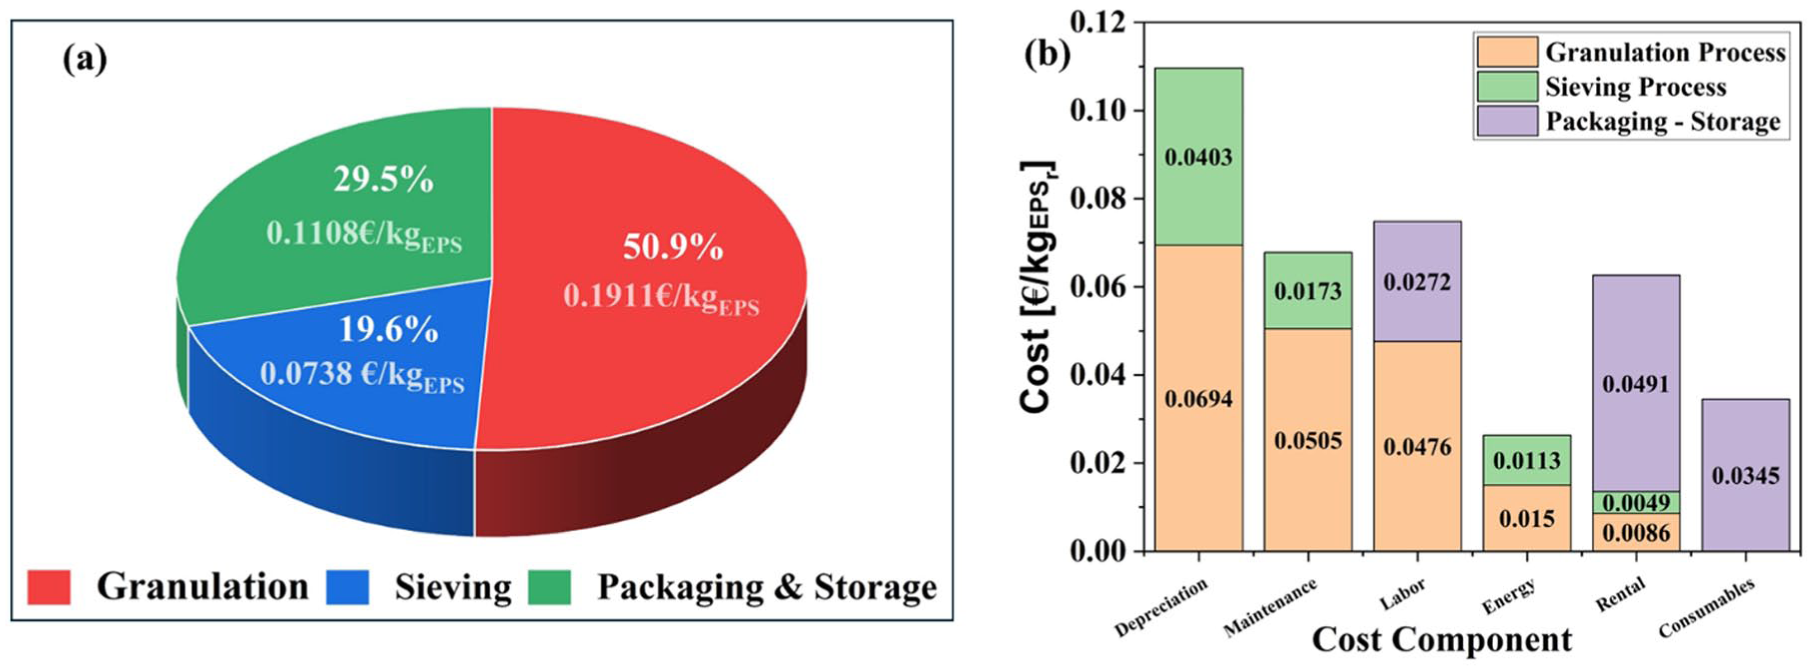
Breakdown of marine expanded polystyrene (EPS) processing costs: (a) total cost distribution by process stage, and (b) detailed analysis of cost components.
A detailed analysis of cost components illustrated in Figure 15(b), provides key insights into the industrial nature of the process, with depreciation identified as the dominant factor, accounting for 36.3% of costs in granulation and 54.6% in sieving. When combined with maintenance costs, this suggests that processing marine EPS – which often contains contaminants such as salts and sand – places increased mechanical stress on equipment, making machine wear a significant economic concern. Additionally, an operational paradox regarding material volume arises, as rent costs are disproportionately high in the storage stage, representing 44.3% of its expenses. The low density of the produced EPS beads means the material occupies a large volume relative to its weight, making space requirements a major economic constraint and highlighting the need for immediate product distribution to the market. The facility’s energy and labour intensity remains stable. Although the process might be expected to be energy-intensive, energy costs are very low, contributing only 7.8% to granulation and 15.3% to sieving, making the facility resilient to energy price fluctuations. In contrast, labour is a significant expense only in stages that require manual feeding and packaging, whereas its complete elimination in the sieving stage demonstrates the value of automation in reducing unit costs.
Comparative of scenarios
To ensure a reliable and comparable assessment between the holistic shore-to-gate approach (Scenario A) and the strictly industrial gate-to-gate process (Scenario B), all costs were normalized to a common unit basis. Processing costs were calculated from the outset per unit of product, whereas the total cost of the collection campaign (5623.10 €) was converted to a unit figure by dividing it by the final recovered quantity of clean EPS (73.45 kg). Additionally, given the extremely low density of the material – estimated at an average of 20 kg/m³ – the comparison was extended to a volumetric basis, as volume, rather than weight, is the primary limiting factor and main cost driver in marine litter logistics. The quantitative analysis reveals a dramatic economic asymmetry between the two scenarios, challenging the traditional perception of industrial recycling. Specifically, Scenario A, which includes the entire value chain, presents a prohibitive total unit cost of 76.94 €/kg (1538.80 €/m³). In contrast, Scenario B, which isolates the processing phase, demonstrates a highly competitive cost of 0.38 €/kg (7.60 €/m³) than can be assessed in Table 2.
Economic assessment and cost comparison per unit of mass (€/kg) and volume (€/m3) for Scenarios A and B.
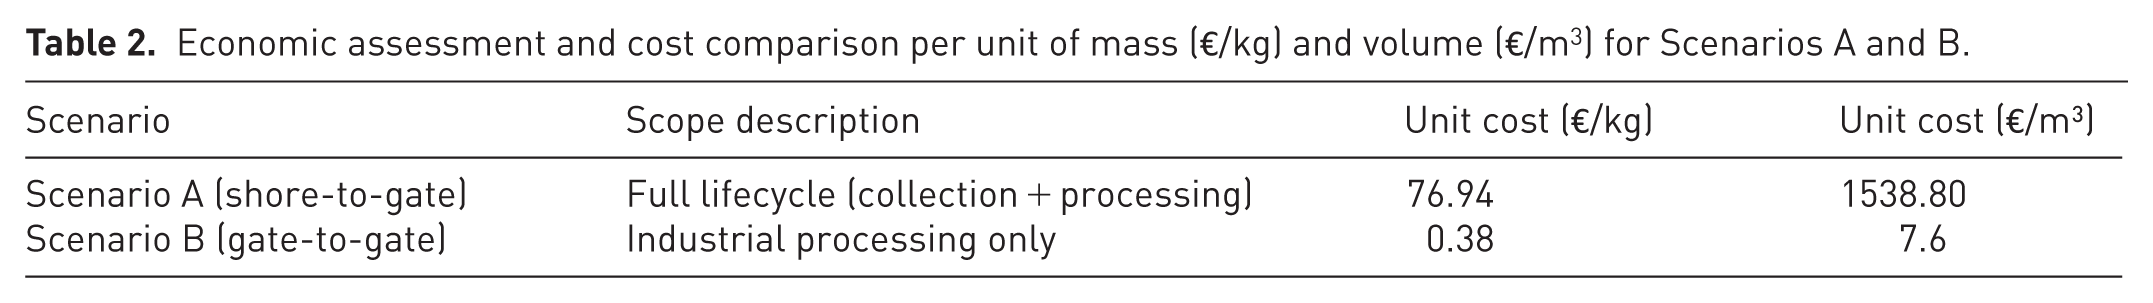
This comparison clearly highlights that the collection phase is not only more expensive but is the dominant cost driver, accounting for 99.5% of the total expense in Scenario A. This underscores that the industrial conversion of marine EPS (Scenario B) is both technically feasible and economically viable, comparable to current terrestrial waste recycling practices. Conversely, the total cost in Scenario A makes the process unsustainable under current market conditions. Therefore, the core challenge of marine EPS management lies in the inefficiency of waste management within the urban and terrestrial environment before leakage into the marine environment occurs. This necessitates a radical reorganization of EPS collection strategies on land to prevent its dispersal into the sea, rather than relying solely on cleanup operations.
Life cycle assessment
Performance of collection and processing stages
The distribution of the carbon footprint across the individual life cycle stages is shown in Figure 16(a). The analysis covers the processing of the total input quantity (94.9 kg) recorded during the experimental procedure, with total emissions of 68.77 kg CO2 eq. The stages related to recovery (coastal mapping and collecting) are dominant, accounting for approximately 83% of the emissions. This highlights the inherent inefficiency of collecting dispersed microplastics. The need to cover a cumulative distance of 1385 km to recover only about 95 kg of material indicates an extremely unfavourable “fuel-to-recovered material” ratio. The environmental benefit of coastal cleanup, therefore, comes at a high cost in terms of fossil fuel emissions from vehicles. In contrast, the recycling process itself (processing) contributes only 11.07%. This is a critical finding, as it demonstrates that mechanical recycling technology is energy-efficient and mature. The issue does not lie with the machinery or the conversion of waste into product, but with the circuitous and demanding process required to bring the waste to the facility gate.
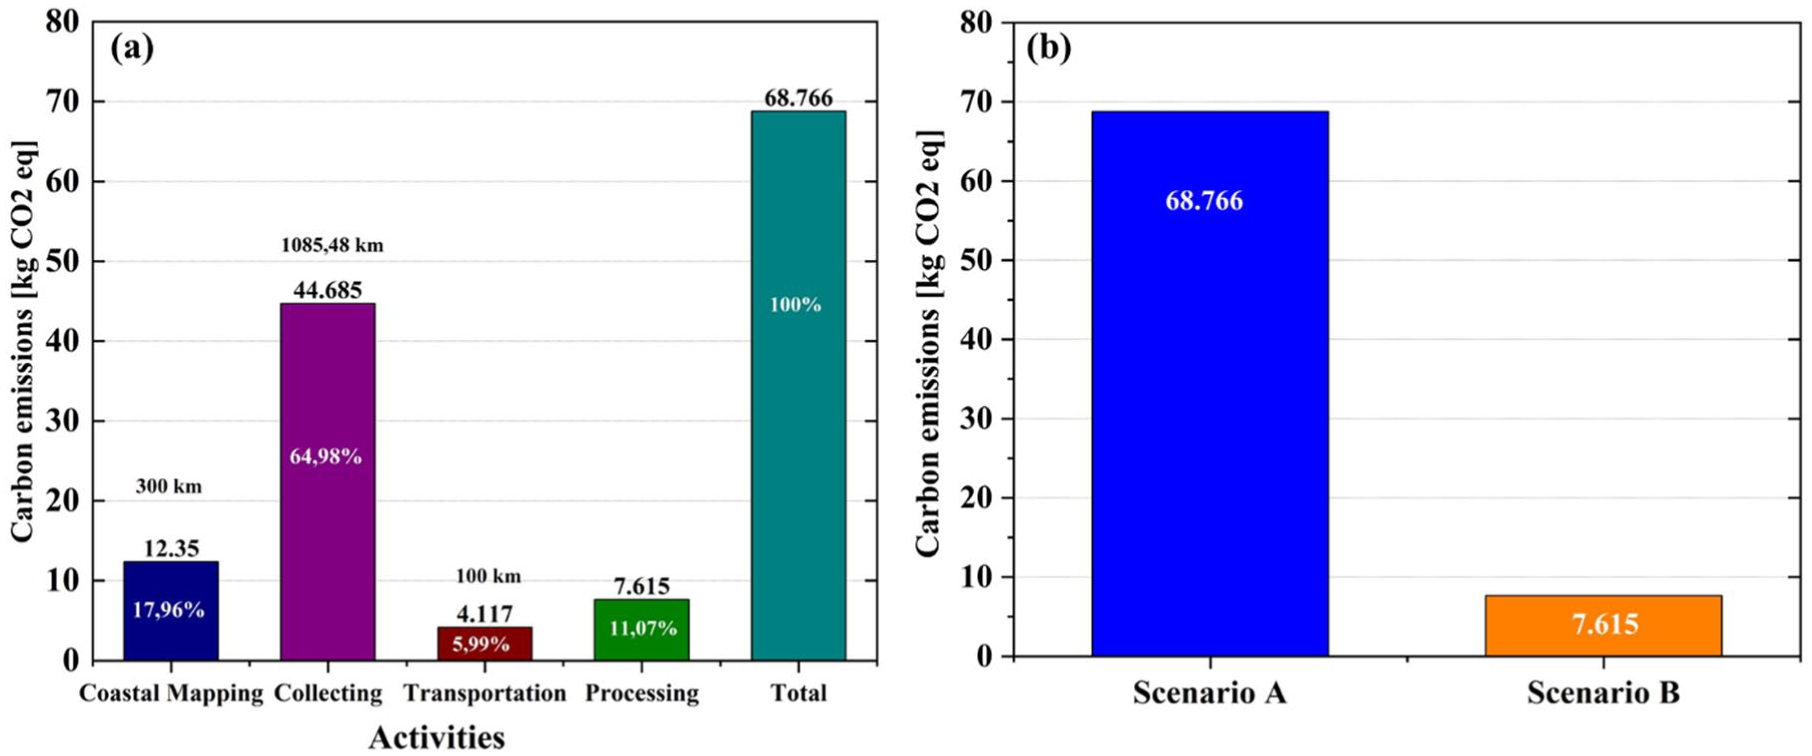
Climate change impact breakdown: (a) life cycle stages contribution and (b) scenarios comparison.
The effect of the system boundaries on the results is clearly shown in Figure 16(b), which compares the total outcomes of the two scenarios. The significant divergence between Scenarios A and B allows for a dual interpretation. Scenario A demonstrates that managing marine pollution is not a straightforward circular economy process but rather an energy-intensive environmental intervention. The high value of the GWP indicator reflects the challenge of reversing pollution (Meinshausen and Nicholls, 2022). In contrast, Scenario B highlights the material’s potential; if marine EPS were collected in a more organized manner, its environmental profile would improve by almost 90%. Therefore, the results indicate that for large-scale recycling of marine EPS to become environmentally sustainable, collection logistics must be optimized, as the current methodology (manual pickup and extensive driving) places a disproportionate burden on the final product.
In addition to the climate change indicator, LCA results were calculated for all impact categories included in the EF 3.1 methodology. The corresponding values for EPS and conventional fine aggregates (natural sand and artificially produced sand) are presented in Table 3. The values are expressed in the respective EF 3.1 reference units, allowing direct comparison between EPS and conventional aggregate materials.
Climate change impact of the production of EPS, crushed and collected sand.
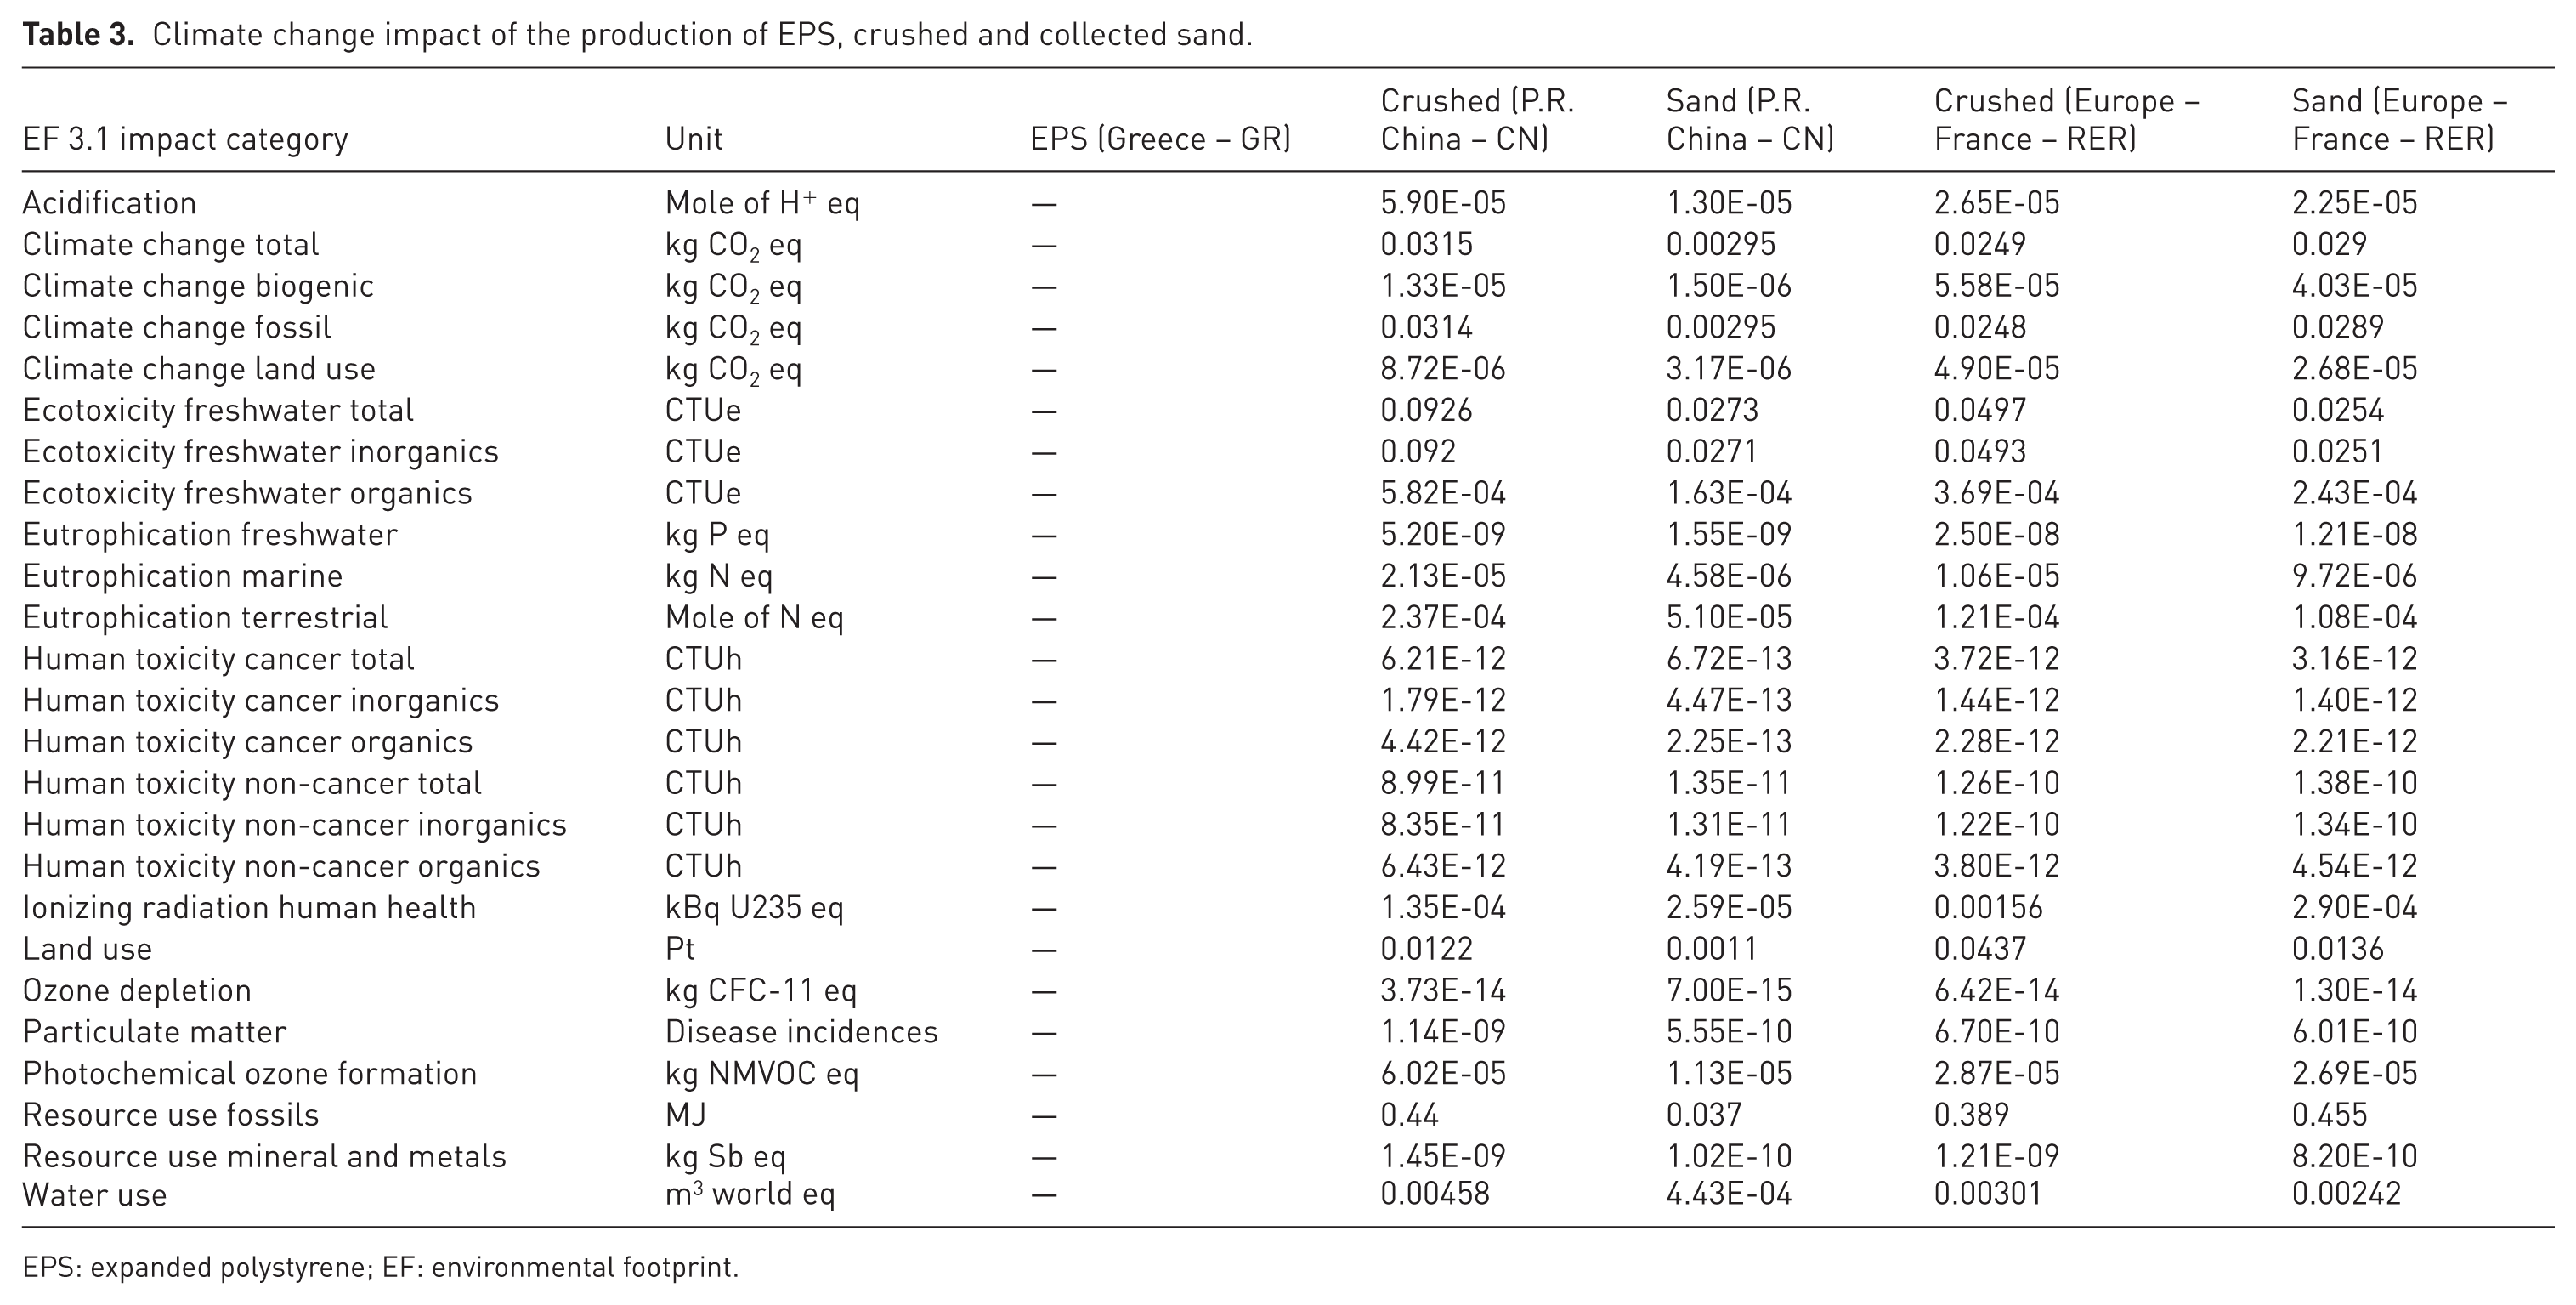
EPS: expanded polystyrene; EF: environmental footprint.
Comparative assessment: r-EPS versus natural aggregates
In the scientific literature on LCA, the choice of functional unit can significantly influence study conclusions. As shown in Figure 17(a), a mass-based comparison presents r-EPS – in both designed scenarios – as environmentally less favourable than all types of sand, which have extremely low emission levels. However, this approach overlooks the physical properties of the materials. Sand has a much higher density than the produced r-EPS. In construction applications, aggregates are replaced by volume rather than by weight, so the true environmental performance is shown in Figure 17(b).
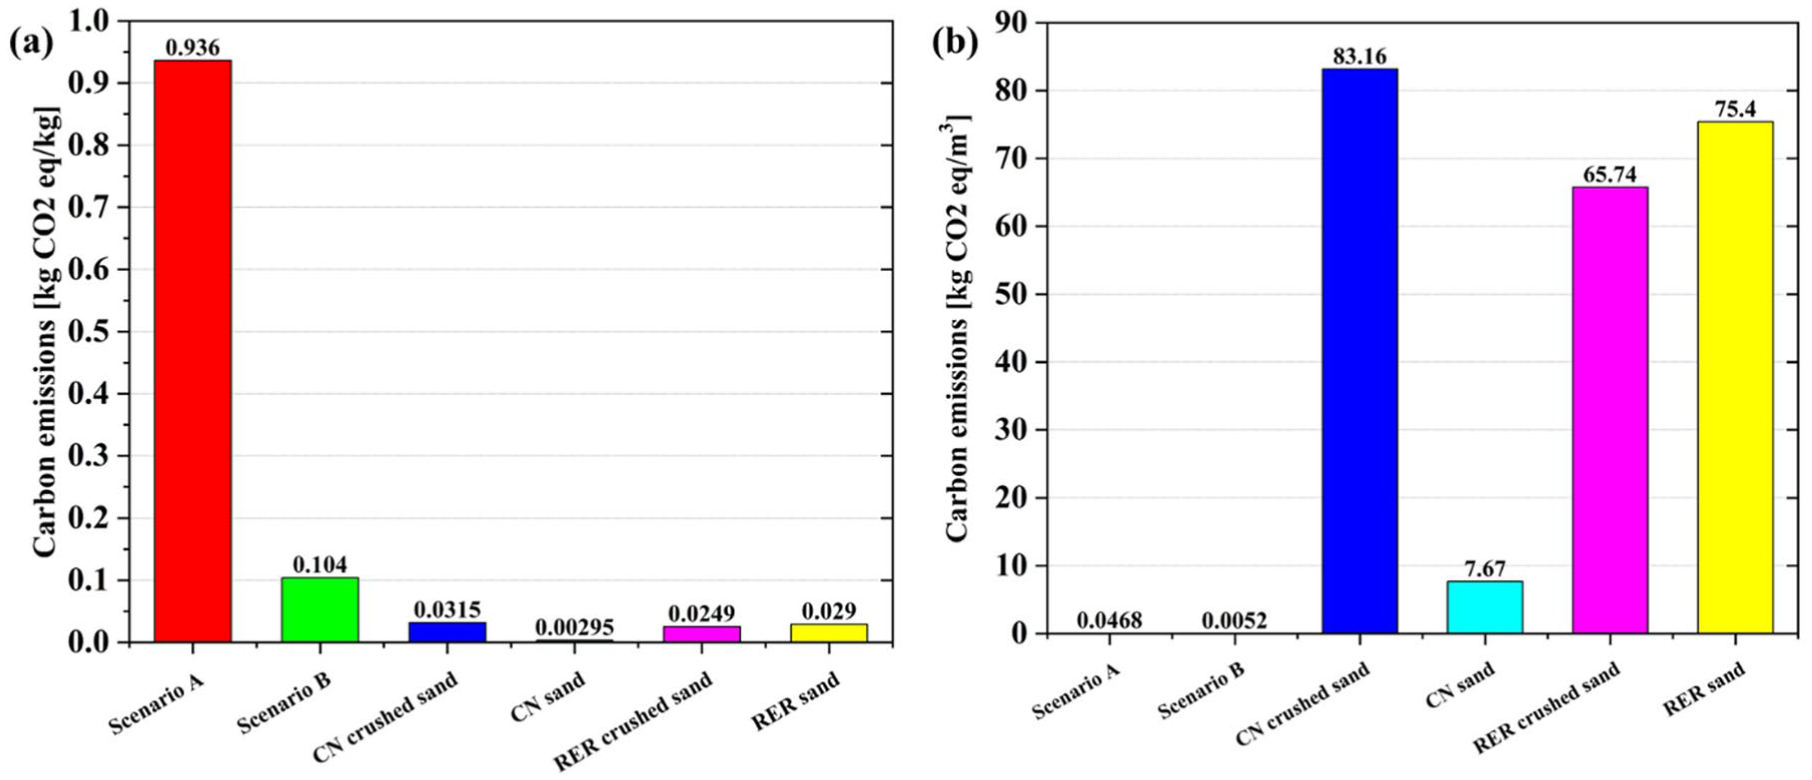
Comparative environmental impact of recycled expanded polystyrene (r-EPS) versus natural aggregates: (a) carbon emissions per unit of mass and (b) carbon emissions per unit of volume.
When normalized to a unit of volume, the data reveal a dramatic reversal. Filling 1 m3 with conventional crushed sand (CN crushed sand) results in emissions of 83.16 kg CO₂ eq/m³, whereas using r-EPS (Scenario A) results in only 0.0468 kg CO2 eq/m3. This represents a 99.9% reduction in carbon footprint per application unit. The use of r-EPS not only reduces emissions but also protects ecosystems. Sand is the second most used natural resource globally after water, and its extraction causes coastal erosion and the destruction of river ecosystems. Every cubic metre of r-EPS integrated into production prevents the extraction and transportation of approximately 1.6 tonnes of natural sand.
Introducing r-EPS to the market as an alternative aggregate transforms an environmental problem – marine pollution – into a sustainable solution for the construction industry. Even in the less favourable Scenario A, which includes demanding coastal collection processes, r-EPS remains orders of magnitude greener per cubic metre than sand, making its use imperative. In conclusion, the true value of the product lies not in producing a cheap material, but in providing a secondary resource that drastically reduces the weight of constructions, minimizes greenhouse gas emissions, and, above all, halts the depletion of the planet’s mineral resources.
From field operations to material valorization
The analysis of the data above shows that the economic and environmental burden of the undertaking is not an inherent feature of recycling, but a direct result of field conditions. Collection and transport from remote, difficult-to-access coastal areas are the main factors driving both costs and emissions. Specifically, the need to cover long distances and use marine vessels to recover extremely low-density material, as described in Scenario A, creates an unfavourable “effort-to-yield” ratio. Labour intensity, transportation to the processing facility, and fuel consumption required per kilogram of recovered material drive operating costs to 99.5% of the total and the EF to 83% of total emissions. Thus, the results show that high economic costs and a high carbon footprint are fully correlated, both arising from the same logistical inefficiency associated with remediating scattered pollutants in remote and hard-to-reach environments.
In contrast, Scenario B demonstrates that the technological solution is already viable. Mechanical processing is highly energy efficient, resulting in both low operating costs and a minimal environmental burden. This indicates that the issue does not lie in the industrial conversion of waste into a product, but in the preceding collection phase. The r-EPS arrives at the facility already burdened with the high economic and environmental cost of remediation – a burden that the cost-effective processing stage cannot retroactively reduce but can productively valorize.
The investigation concludes by examining the end-use phase, where the disadvantage of managing low-density material as waste becomes a comparative advantage as a secondary raw material. Although low EPS density increases transportation costs per kilogram during collection, its use as an aggregate substitute (sand) provides significant value per cubic metre. This means that the high emissions from material collection are fully offset, as the extraction and transport of tonnes of mineral aggregates are avoided. In conclusion, although the collection process is expensive and energy-intensive, it becomes viable through the final application. Converting marine waste into construction material is not just a management solution, but a natural resource conservation strategy, where the environmental benefit from sand substitution outweighs the energy cost of recovery.
Conclusions
This investigation effectively bridges the gap between theoretical models and operational reality by providing empirical evidence based on primary field data. By evaluating three sampling cycles, the research accurately quantified the energy and economic requirements of marine EPS recovery, identifying the critical parameters that determine the sustainability of EPS waste collection in coastal environments. The main conclusions are summarized in three key points:
Quantification of the “cost of inaction”: A major finding of this work is the clear depiction of the disproportionate burden caused by pollutant dispersion. Comparative analysis between the “Management Model” (Scenario A) and the “Processing Model” (Scenario B) showed that the collection phase accounts for 99.5% of the total cost and 83% of the carbon footprint. These data not only reflect a technical challenge but also quantify the actual “cost of inaction”. When waste escapes urban areas and reaches inaccessible shores, its recovery requires energy and economic resources that far exceed those of conventional management. The “geographic penalty” of distance and access difficulty makes cleanup a resource-intensive service, underscoring the urgent need for source prevention strategies supported by incentives for reuse as secondary material.
Technological feasibility of EPS waste processing: Despite the challenges of collecting and transporting EPS waste, the investigation demonstrated the high technical and environmental efficiency of mechanical processing. Converting marine EPS waste into granules (r-EPS) proved to be a mature process with minimal operating costs and a low EF. This finding is crucial, as it confirms that the valorization of marine plastics is not limited by technology or material contamination, but depends solely on optimizing the collection network.
The “real value” of mineral resource substitution: The innovation of the present investigation lies in highlighting the functional value of r-EPS. It showed that using recycled material as a substitute for natural aggregates (sand) in construction provides significant environmental benefits. Despite the high recovery cost, r-EPS achieves a reduction in greenhouse gas emissions of over 99% per cubic metre of application compared to conventional mineral materials. This result changes our perception of the material, demonstrating that r-EPS is not just “recycled waste,” but a strategic secondary resource. Its use serves as a dual environmental lever: it decontaminates marine ecosystems and acts as an “anthropogenic stock,” preventing the extraction of valuable natural resources and protecting biodiversity.
In conclusion, the research finds that the valorization of marine EPS is technically feasible and environmentally necessary. However, the economic viability of this effort depends directly on recognizing collection as an ecosystem remediation service. Integrating r-EPS into the construction materials market is key to transforming an environmental problem into a sustainable solution for the circular economy.
Footnotes
Funding
The authors disclosed receipt of the following financial support for the research, authorship, and/or publication of this article: This research has been financed by the Greek Green Fund, under the “Natural Environment & Innovative Actions 2022” Call (Proposal ID: 555/2022, MIS Acronym: COAST-EPS, Title: Recycling and reuse of polystyrene foams waste in cement-based materials).
Declaration of conflicting interests
The authors declared no potential conflicts of interest with respect to the research, authorship, and/or publication of this article.