






Abstract
Public school feeding programs provide nutritional support to approximately 418 million children worldwide with an annual financial allocation of 48 billion dollars. Despite their significant scale, many developing nations, including Brazil, exhibit a notable deficiency in comprehensive data regarding food waste within educational establishments. Most of the food waste assessment methodologies present challenges to be widely adopted by schools, such as cost and time constraints. In response to this gap, the present study conducted a large-scale assessment of food waste across 20 educational institutions in Brazil with a student population of approximately 9000 individuals, utilizing a low-cost methodology, which encompasses management interviews and compositional analyses. This new and simplified methodological approach enabled the identification of food waste causes and confirmed that it occurs in both preparation and consumption stages, involving school management practices and student behavior. Instead of measuring the leftover food from each student’s plate, this method conducts a compositional analysis of the cafeteria waste. Plate waste was estimated indirectly based on total waste collection and the daily number of students present. The findings revealed a significant disconnection between the perception of managers and the reality of waste generation: 65% of school managers did not consider food waste a relevant issue, despite the fact that 57% of organic waste is avoidable. The most commonly wasted foods were rice and beans, instead of fruits and vegetables, as expected by interviewees, with an average plate waste of 37 g per student. These findings underscore the need for schools to implement food waste measurement practices, enhancing managers’ awareness and encouraging the adoption of prevention strategies. The proposed low-cost and non-intrusive methodology proved to be effective in bridging the knowledge gap in food waste assessment, especially in developing regions.
Introduction
School feeding programs represent a massive food service operation, benefiting approximately 418 million children worldwide. This extensive reach, encompassing roughly 41% of all children enrolled in primary education globally and involving a total investment of US$ 48 billion (WFP, 2023), translates into enormous volumes of food being procured, prepared, and served daily. Consequently, these programs not only create significant potential for waste generation but also present strategic opportunities for implementing sustainable practices. Despite the recognized potential of schools in addressing food waste challenges, a significant gap exists in understanding the magnitude of the issue due to the lack of primary data on waste in school environments (Câmara Interministerial de Segurança Alimentar e Nutricional, 2018; Kasavan et al., 2021; Martins et al., 2014). Significantly, the absence of scalable data prevents policy-makers from identifying waste “hotspots” or evaluating the effectiveness of prevention strategies across entire school districts, where high-precision but resource-intensive methods are often unfeasible.
Food waste quantification in schools employs diverse methodologies categorized primarily into direct methods (weighing and visual assessment) and indirect methods (interviews). Direct weighing, considered the “gold standard,” involves measuring plate waste in grams per portion served (Eriksson et al., 2017). These approaches typically measure three categories: prepared food (food that was cooked), unserved food (prepared food left over after service), and plate waste (the quantity or percentage of edible food served but left unconsumed).
Researchers across multiple countries have implemented various quantification methods with different approaches. Italian studies by Boschini et al. (2020) and Falasconi et al. (2015) utilized weighing to measure food prepared, plate waste, and unserved food across thousands of meals. In Sweden, Malefors et al. (2024) employed direct weighing to assess intervention effectiveness. Mixed methodologies have been useful, exemplified by Blondin et al. (2015), combining semi-structured interviews with direct measurements to quantify fluid milk waste in primary school classrooms, and Sundin et al. (2023), integrating menu analysis and staff interviews with quantitative weighing across 61 Swedish schools. These quantification approaches reveal significant variation in waste levels, from 31–48 g per student in Swedish schools to 40–100 g per meal in Spanish primary schools (Derqui and Fernandez, 2017), and reaching 160 g per student in Italian institutions (Boschini et al., 2020).
Despite their methodological strengths, food waste quantification approaches face significant limitations. Direct weighing methods typically require numerous stakeholders (from kitchen staff to students and researchers), creating logistical challenges and disrupting normal school operations, as evidenced in studies by Boschini et al. (2018), which researchers coordinate data collection across multiple schools simultaneously. These methods often introduce measurement bias, where participants modify their behavior when aware they are being observed (Malefors et al., 2024). Additionally, the resource-intensive nature of comprehensive waste audits represents a substantial barrier, with studies by Derqui and Fernandez (2017) requiring manual analysis of over 10,000 food trays across multiple days. These high labor costs and extensive time commitments limit the feasibility of sustained measurement programs, mainly in developing countries, due to their financial constraints. Consequently, there is a demand for methodologies that can bridge the gap between perception and labor-intensive precision.
In this context, the present investigation addresses the data gap by introducing a diagnostic and scalable alternative that prioritizes broad coverage over high-resolution precision. This study aims to investigate the food waste in Brazilian schools by proposing a new and simplified methodological approach that integrates qualitative and quantitative methods suitable for large-scale implementation. Through field observation associated with compositional analysis of the school waste, it is possible to conduct a comprehensive evaluation through the comparative analysis of administrative perceptions and empirical waste composition data. During institutional visits, the research examines administrative perspectives regarding food waste issues and existing mitigation strategies. These institutional visits provide contextual information essential for the nuanced interpretation of compositional data.
Unlike traditional methodologies, where researchers collect and weigh plate waste from each individual student’s plate, the proposed approach collects all cafeteria waste through aggregated collection and estimates plate waste indirectly based on the daily number of students served. This protocol represents a methodological simplification that overcomes critical limitations identified in previous research by eliminating the need for individual plate measurements and streamlining the process.
The proposed method is a low-cost solution that allows for estimating plate waste and collecting data capable of generating an overview of school waste, particularly suited for the operational and financial constraints of developing countries. While conventional approaches necessitate resource-intensive observation periods and multiple data collection points, the present research methodology enables examination of waste patterns across substantially larger and more diverse school populations with minimal operational interference. The objective of this study is: first, to propose the diagnostic potential of this simplified protocol in a real-world setting (20 public schools), and second, to reveal the discrepancies between manager perceptions and measured waste to support the design of more effective local public policies.
This article is structured as follows. “Materials and methods” section presents the materials and methods used. “Results and discussion” section unfolds the main results obtained through the interviews and compositional analysis, and “Conclusion” section brings the conclusions, practical implications, and limitations of the study.
Materials and methods
Study design
Brazilian public schools provide meals for children and adolescents through the National School Feeding Program (PNAE), which serves approximately 42 million students across 160,000 schools nationwide (Silva et al., 2023). In the Rio de Janeiro municipality, this program delivers approximately 1 million meals daily, consuming about 400 tons of food with an annual investment of R$350 million (Prefeitura da Cidade do Rio de Janeiro, 2023). These school meals play an important role in students’ nutrition and food security, with a significant portion of metropolitan region students considering them their main daily meal. One distinctive feature of Brazilian schools is their internal kitchen system, where food is stored and prepared entirely on-site. Ingredients are delivered directly to schools by suppliers registered with the municipal government.
Twenty public schools from different regions of the city were selected to participate in the study, with students ranging from 4 to 14 years old. The sample was curated to ensure significant profile heterogeneity. This included broad geographic coverage across all regions of Rio de Janeiro, encompassing diverse socioeconomic strata. Furthermore, the selection intentionally balanced schools with active environmental education programs (e.g., school gardens, composting) against those without such initiatives to capture a wide range of institutional realities.
Waste from 2 school days was collected, totaling 40 samples and representing approximately 9000 students, to better understand consumption patterns and identify opportunities for waste reduction. The 2-day sampling period was chosen as a balance between capturing temporal variability in menu composition and ensuring the operational feasibility of a low-cost, non-intrusive protocol.
Meeting at schools
The first stage of the research involved meetings with school management and meal planning staff, conducted between 2022 and 2024. These sessions followed a semi-structured format. To ensure internal consistency and minimize bias, the research team collectively developed the interview instrument, establishing a shared understanding of the research objectives and the intended meaning of each question. This consensus-based approach served as the primary standardization procedure, ensuring a uniform focus across different researchers. During these 2-hour sessions, essential contextual data were gathered to characterize each institution, including student population size, age demographics, and daily meal service volume.
A critical component of these meetings involved assessing administrative perceptions about food waste through targeted questioning. These findings represent self-reported perceptions, providing a baseline for comparison with subsequent quantitative measurements. Key inquiries focused on identifying commonly wasted food items, evaluating the perceived significance of plate waste, determining whether food preparation quantities had been adjusted based on observed leftovers, and establishing whether plate waste was considered problematic. Representative questions included “What are the most wasted foods?” and “Do you consider students’ plate waste relevant?” The complete interview protocol with all questions can be found in Appendix A.
This systematic approach to data collection ensured consistency across all participating schools while providing rich qualitative insights into institutional awareness and management of food waste issues prior to the quantitative assessment phase.
Compositional analysis of school waste
Data collection involved 2 sampling dates per school, resulting in a total of 40 samples of school residues. These collections were conducted in the morning on pre-arranged dates to align with school schedules. Each institution was instructed to segregate waste into designated plastic bags, distinguishing between cafeteria leftovers (plate waste) and kitchen residues, thereby enabling the assessment of waste generated both during preparation and after service.
Following the collection, the samples underwent physical separation into predetermined categories for weighing. Initially, waste was segregated into broad classes: Organic, Plastic, Paper, Glass, Metal, and Others. The organic fraction was further subdivided into two levels (raw or cooked) and five specific sublevels: unserved food, whole foods, inedible parts, plate leftovers, and partially consumed foods (Figure 1). Notably, mixed dishes, such as the traditional Brazilian rice and beans, were classified as a single avoidable fraction as their physical separation was not operationally feasible during the categorization process.
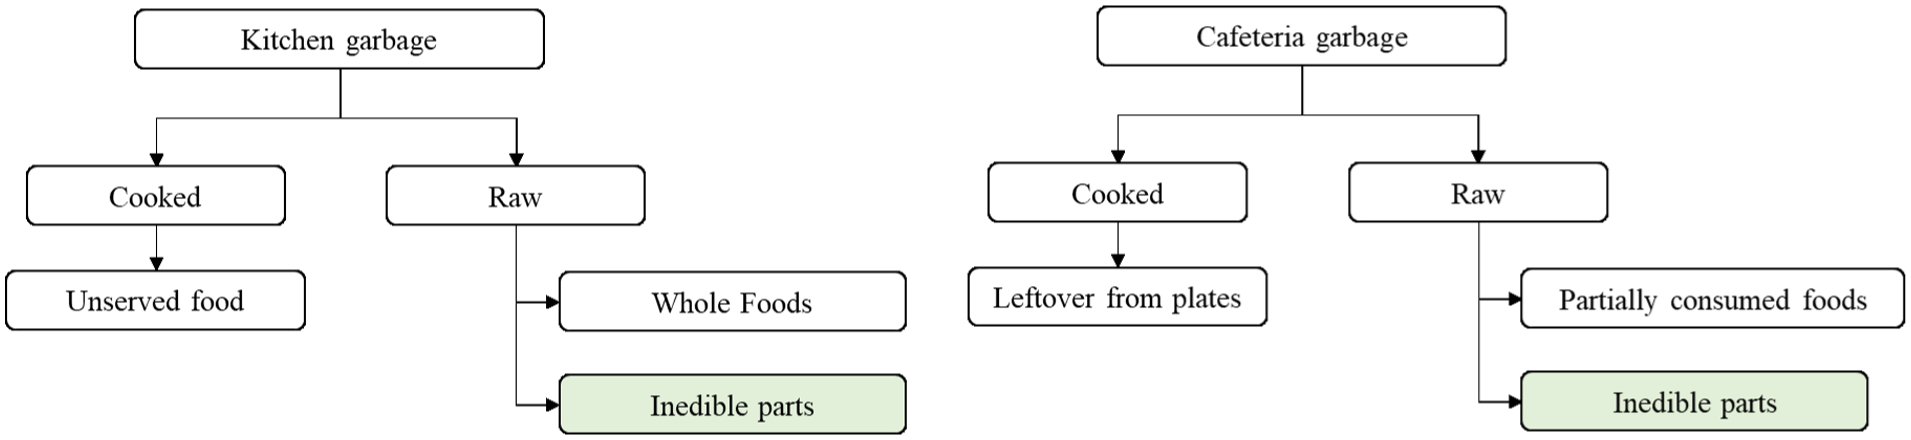
Sampling and analysis flow.
The adopted categorization allows for differentiating between waste considered avoidable and unavoidable. Avoidable waste was defined by Gustavsson et al. (2011) and UNEP (2021) as edible parts of food that could have been consumed but were discarded. Inedible parts, or unavoidable food waste, refer to parts of products normally not consumed, such as peels and bones. Avoidable waste was defined as the sum of whole foods, partially consumed foods, unserved food, and leftovers from plates. Whole raw foods and unserved cooked foods were accounted for by kitchen waste. Partially consumed raw foods and leftovers cooked from students’ plates were accounted for by plate waste. Photographic records of all samples were taken during the compositional analysis. These records serve as visual references for future analyses and comparisons, ensuring the consistency and quality of the experiment. Weighing used Marte LS50 scales (10 g sensitivity) for heavy components and Marte AD1000 (0.01 g sensitivity) for light ones, identifying the mass percentage of each component as a proportion of the total waste.
In line with the study’s objective of providing a simplified and scalable methodology, plate waste was determined via aggregated collection rather than individual plate measurements. To ensure that per capita waste values accurately reflect the population effectively served, calculations were based on a “corrected number of students” to account for absenteeism. This corrected population was determined by multiplying the total number of enrolled students by the procurement-based attendance percentage reported by school managers. This percentage relies on the managers’ extensive empirical experience and historical knowledge of daily school meal participation.
Sources of uncertainty and data quality
As a diagnostic and exploratory method designed for scalability, certain inherent uncertainties in the protocol are acknowledged. These primarily include: (i) the indirect estimation of per capita values derived from aggregated cafeteria waste; (ii) potential mis-sorting of minor waste fractions during the physical separation process; and (iii) the reliance on procurement-based attendance records provided by school management. While these records incorporate empirical adjustments for absenteeism, they remain estimates of the population effectively served.
Ethical considerations
The study protocol was conducted in accordance with ethical guidelines for research involving institutional and non-sensitive data. All participating school managers were fully informed about the research objectives and provided voluntary consent for both the interviews and the waste sampling procedures. To ensure confidentiality and privacy, all schools were anonymized in the dataset, and no individual student data were collected or identified during the process.
Statistical analysis
Data were processed to determine the mass percentage of each food waste category. Normality of the distribution for the 40 samples was assessed using the Shapiro-Wilk test. Given the sample size (n = 40), statistical significance was interpreted with caution, and results are primarily reported as means and standard deviations to reflect the diagnostic nature of the approach.
Results and discussion
Meeting at schools: Perception of school food waste
According to the interviewees, schools receive food deliveries three times a week, with non-perishable products and fresh produce arriving on different days. Designated staff reportedly inspect the deliveries, verify orders, and weigh the food upon arrival. Although school administrators cannot choose suppliers due to centralized procurement systems, they perceive that they retain the authority to reject unsuitable items by documenting quality concerns.
Administrators brought forward during interviews their perception that food supply quality represents one of the most influential factors in total waste generation. They highlighted a critical relationship between procurement systems, food quality, and waste reduction efforts, noting that the state of received food directly impacts both student acceptance and storage longevity.
Regarding storage, food is kept in pantries equipped with freezers and refrigerators. Participants reported common challenges such as increased spoilage during summer and food deterioration over weekends. Among the participants who experienced issues, fruits and vegetables were specifically highlighted. Fifteen participants reported significant storage problems, with fruits (especially bananas) and vegetables (particularly leafy greens) cited as the most problematic items.
Regarding self-reported menu preferences, 90% of interviewees indicated a connection between perceived plate waste and specific menu items. However, they recognize that preparation methods significantly influence consumption; some schools reported a perception of good acceptance for typically rejected foods, such as liver, when well prepared.
The majority of administrators (65%, or 13 out of 20) perceived no significant plate waste in their institutions, particularly among adolescents. Representative perceptions included statements such as: “Adolescent students typically demonstrate high food consumption” and “Food rejection is minimal.” Conversely, seven administrators reported a perception of substantial plate waste, with one director noting higher waste among younger students, which reportedly prompts kitchen staff to adjust portion sizes.
All interviewees reported addressing food waste through constant conversations with students. However, only three schools implemented specific projects, such as food reuse or pedagogical activities related to the UN Sustainable Development Goals. One institution reported a perceived reduction in waste after a 2-month measurement period.
The literature supports that food and nutrition education, when well-executed, can be effective for long-term habit change (Boschini et al., 2018; Rigon et al., 2022). However, in the studied schools, these actions appear to be largely informal and based on verbal guidance rather than standardized institutional programs.
Interviewees cited absenteeism and unexpected events as primary factors generating waste. To mitigate this, respondents identified two self-reported strategies: effective communication between kitchen staff and management, and adjustments in food orders. Establishing these channels reportedly allows for quick adjustments in quantities prepared. For instance, one school reported reducing food preparation on rainy days or Mondays and Fridays, when student attendance is perceived to be lower.
A common practice reported across all institutions is the disposal of serving dish remnants (leftovers). There is a prevalent understanding among school personnel that the donation of leftover food is prohibited. While existing regulations establish stringent guidelines for food safety and donations, they do not explicitly address school food remnants. According to the interviewees, this results in varying interpretations and a precautionary practice of discarding all leftovers, which contributes to the total volume of waste.
Other self-reported actions to minimize waste include incorporating less accepted vegetables into rice and beans to increase acceptability and organizing two lines in the cafeteria to adjust portions. Ten schools reported personalizing portions, while the other 10 perceived an institutional prohibition on such adjustments.
In summary, managerial perceptions of food waste reduction strategies vary significantly. The interviews revealed an absence of standardized approaches or formal institutional programs, leaving each school to address the issue based on individual administrative discretion.
Food waste compositional analysis
Organic food waste generation
The average amount of organic food waste generated in the studied schools was 47.2 kg, ranging from 20 to 109 kg. The standard deviation was 21.7 kg, which underscores the complexity of the issue. The generation per student (per capita) was calculated by dividing the average value of the total mass generation from the two samples of each school by the number of students, already considering the estimate of absenteeism (data provided during the interviews). The per capita generation in (g·student−1·day−1) in each school is shown in Table 1.
Per capita waste values for each category (g·student−1·day−1).
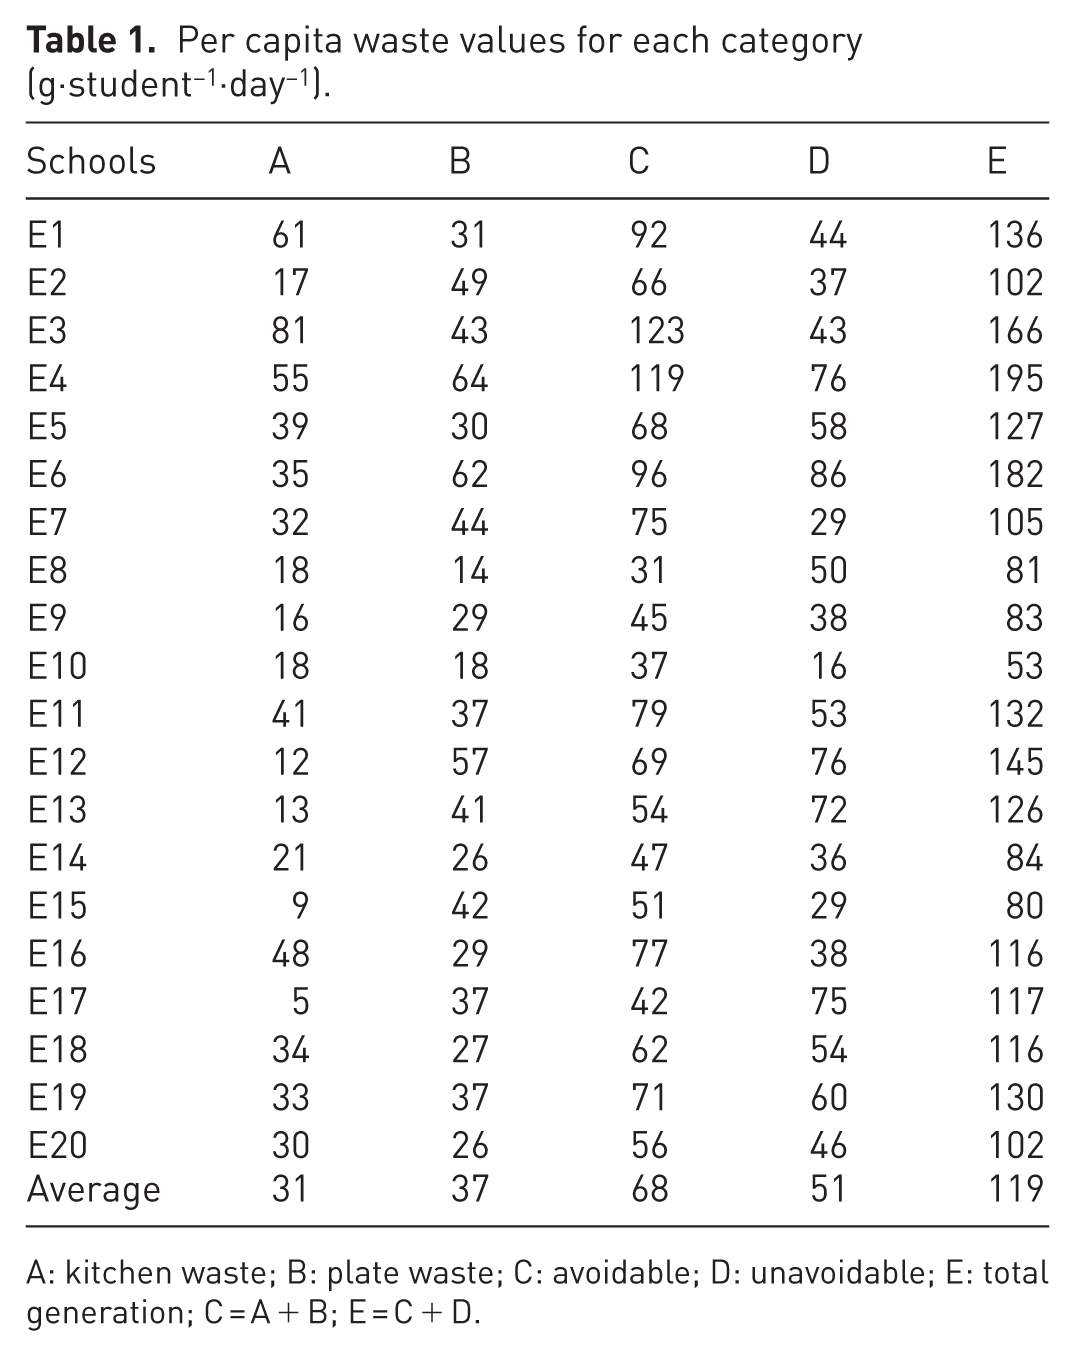
A: kitchen waste; B: plate waste; C: avoidable; D: unavoidable; E: total generation; C = A + B; E = C + D.
The average organic waste generation was 119 g per student per day. The data showed no significant deviation from normality (p = 0.67) according to the Shapiro-Wilk test applied to the full dataset of 40 raw samples (n = 40).
Total per capita generation ranged from 53 to 195 g, with a standard deviation of 35.6 g. Literature shows high variability in food waste in schools; for example, Moura et al. (2024) reported an average per capita waste of carbohydrate sources of 53.1 g with a standard deviation of 29.21 g, while Martins et al. (2014), after weighing the plate waste of 471 students, found an average of 49.5 g with a standard deviation of 51.3 g. These results demonstrate that, in the context of food waste research, high data variability is expected and reflects the complexity and diversity inherent to food consumption and waste patterns in environments such as schools.
Food waste varied substantially among the schools. For example, school E6 generated a lot of waste because of watermelons, which have high water content. School E3 had isolated instances of high waste, with 13 kg of apples and 15 kg of green beans discarded. In contrast, school E10 had the lowest per capita waste because of less rice and beans and no vegetable peels. These examples illustrate how menu choices, isolated incidents, and food preparation practices impact waste levels, emphasizing the need for careful comparisons between schools.
Avoidable (food waste per capita)
Avoidable waste, including whole foods, partially consumed foods, unserved food, and leftovers from student plates, accounted for 57% of total organic waste in schools. The highest per capita avoidable waste was 123 g·student−1·day−1, while the lowest was 31 g·student−1·day−1, with an average of 68 g·student−1·day−1, indicating significant variation among schools.
Avoidable waste was evenly distributed between the kitchen and the cafeteria. Specifically, 46% of the total waste was attributed to kitchen waste, while 54% originated from the cafeteria, primarily as plate waste (Figure 2). It is essential to note that this categorization is based on the location where the waste occurred, and it does not necessarily reflect the underlying causes of the waste. For instance, the higher amount of waste found on students’ plates may be linked to the menu choices rather than student behavior.
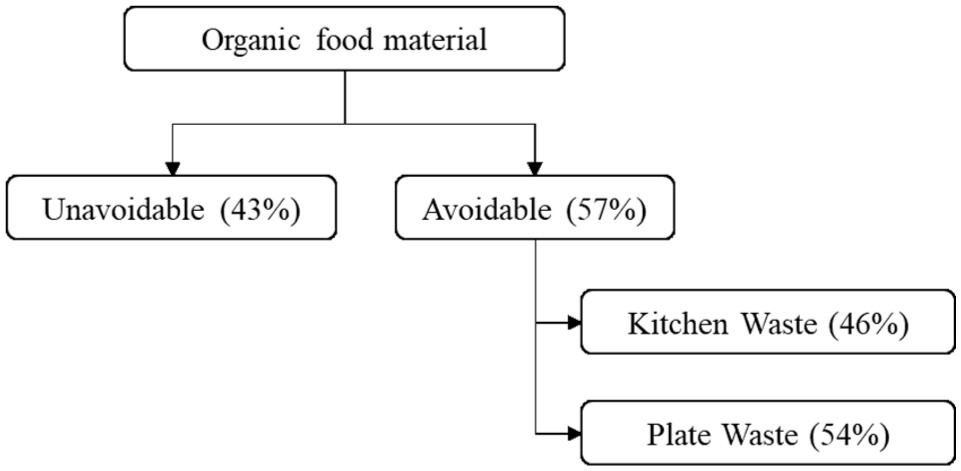
Results compositional analysis.
Considered as the most wasted avoidable food, rice and beans accounted for 59% of the total (Figure 3). Other foods frequently found in the waste were fruits and vegetables, such as oranges, apples, carrots, and bread. In this study, mixed dishes (e.g., rice and beans served together) were classified as avoidable waste and weighed as a single composite category, as the low-cost nature of the protocol did not allow for the physical separation of combined food items.
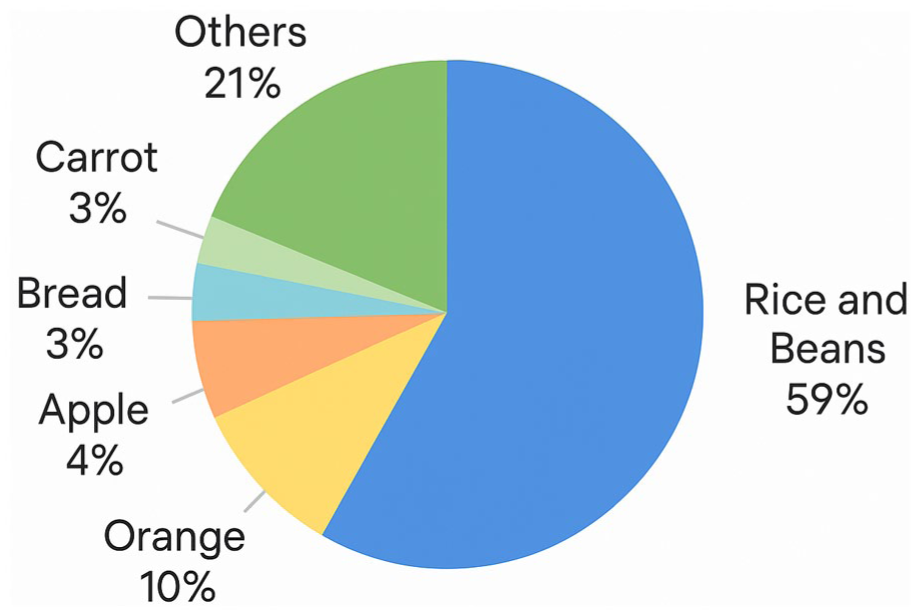
Most wasted food in schools.
Unavoidable (non-edible parts) food waste
Unavoidable food waste, primarily consisting of peels, seeds, and cores, represented 43% of the total organic waste generated in the schools (Figure 2). On average, the generation of unavoidable waste was 51 g·student−1·day−1, with values ranging from 16 to 86 g·student−1·day−1 across the 20 institutions. This significant volume is intrinsically linked to the Brazilian school feeding program’s commitment to serving fresh, minimally processed fruits and vegetables. For instance, non-edible parts of bananas and oranges, staples in these menus, account for approximately 35% and 25% of their total mass, respectively (Laurentiis et al., 2018).
The observed variability between schools can be attributed to differences in the specific menus served on the sampling days, as schools focusing on whole fruits (such as oranges and bananas) naturally exhibit higher unavoidable fractions compared to those serving processed or pre-peeled items. Even if avoidable waste were entirely eliminated, these non-edible fractions would persist. Therefore, in alignment with circular economy principles (Papargyropoulou et al., 2022; Teigiserova et al., 2020; UNEP, 2024), management should prioritize preventing the waste of edible portions while redirecting unavoidable parts toward valorization routes such as composting or biomethanization. Currently, only 25% of the surveyed schools (5 out of 20) have implemented on-site composting systems. These initiatives serve a dual purpose: treating organic residues and acting as pedagogical tools to educate students on nutrient circularity and bioeconomy.
Plate waste
The estimated average per capita plate waste was approximately 37 g·student−1·day−1, a value significantly lower than reported in other studies. For example, Rabelo and Alves (2016) found an average of 77.8 g in Brazil, Boschini et al. (2020) recorded 160 g in Italy, Martins et al. (2014) reported 49.5 g in Portugal, and Petchoo et al. (2022) found 71.4 g in Thailand. However, direct comparisons should be made with caution due to methodological differences. While most cited studies utilized individual plate weighing or visual scales, the current approach estimates plate waste through aggregated collection.
In the 40 samples analyzed, rice and beans were the most prevalent items, appearing in 38 samples and constituting 84% of the total plate waste mass. Bread was present in 45% of samples, while potatoes appeared in 12.5%. High-protein items (chicken, meat) and fruits (e.g., bitten apples) were less frequent. The predominance of rice and beans reflects fundamental Brazilian dietary habits; the 2021 IBGE Household Budget Survey identifies these as the most consumed foods nationally (Instituto Brasileiro de Geografia e Estatística, 2021).
Consistent with findings by Lourenco et al. (2022) regarding household waste, rice and beans also dominate school waste. In households, waste is often driven by a cultural preference for fresh food (Porpino et al., 2015), whereas in the studied schools, the evidence suggests a link between overproduction and plate waste. Excessive preparation of these staples often leads to oversized portions being served, regardless of student appetite. Consequently, improving meal planning and aligning serving sizes with actual student consumption patterns are critical leverage points for significant waste reduction.
Kitchen waste
In this study, kitchen waste is operationally defined as the sum of discarded raw ingredients and unserved cooked food (leftovers). The average kitchen waste per student was about 31 g day−1, with unserved food, primarily rice and beans, found in 91% of collected samples. Whole raw foods in school waste samples accounted for only 8% of the total organic food.
The generation of kitchen waste was primarily attributed to overproduction. This was often driven by a mismatch between meal planning and the actual student attendance on the sampling days, which was recorded through daily consumption logs provided by school managers. This finding aligns with Eriksson et al. (2017), who highlighted that inadequate planning in public food services frequently results in a discrepancy between prepared volume and actual demand.
The results obtained (12.5 kg day−1) are consistent with the range reported by Ramos et al. (2023) in Northeast Brazil (0–15 kg day−1) and significantly lower than the values observed by Godoi and Sehnem (2022) in Florianópolis (45–65 kg day−1). As noted by Ribeiro (2018), reducing unserved food depends on two critical factors: the effectiveness of menu management and the level of meal acceptance by students, which directly influences whether prepared food remains in the pans or is transferred to the plates.
Comparative analysis: Results of compositional analysis and interview perceptions
The analysis of interviewees’ responses and compositional results reveals discrepancies between school managers’ perceptions and the experimental findings, as shown in Table 2. Most interviewees considered plate waste as insignificant. Nevertheless, plate waste makes up 54% of avoidable waste, yet all 40 samples showed plate leftovers. In addition, while most managers acknowledged storage losses, they overlooked kitchen leftovers, which accounted for 46% of total avoidable waste. As mentioned before, 8% of total organic waste is whole foods that could be avoided.
Interview versus compositional analysis.
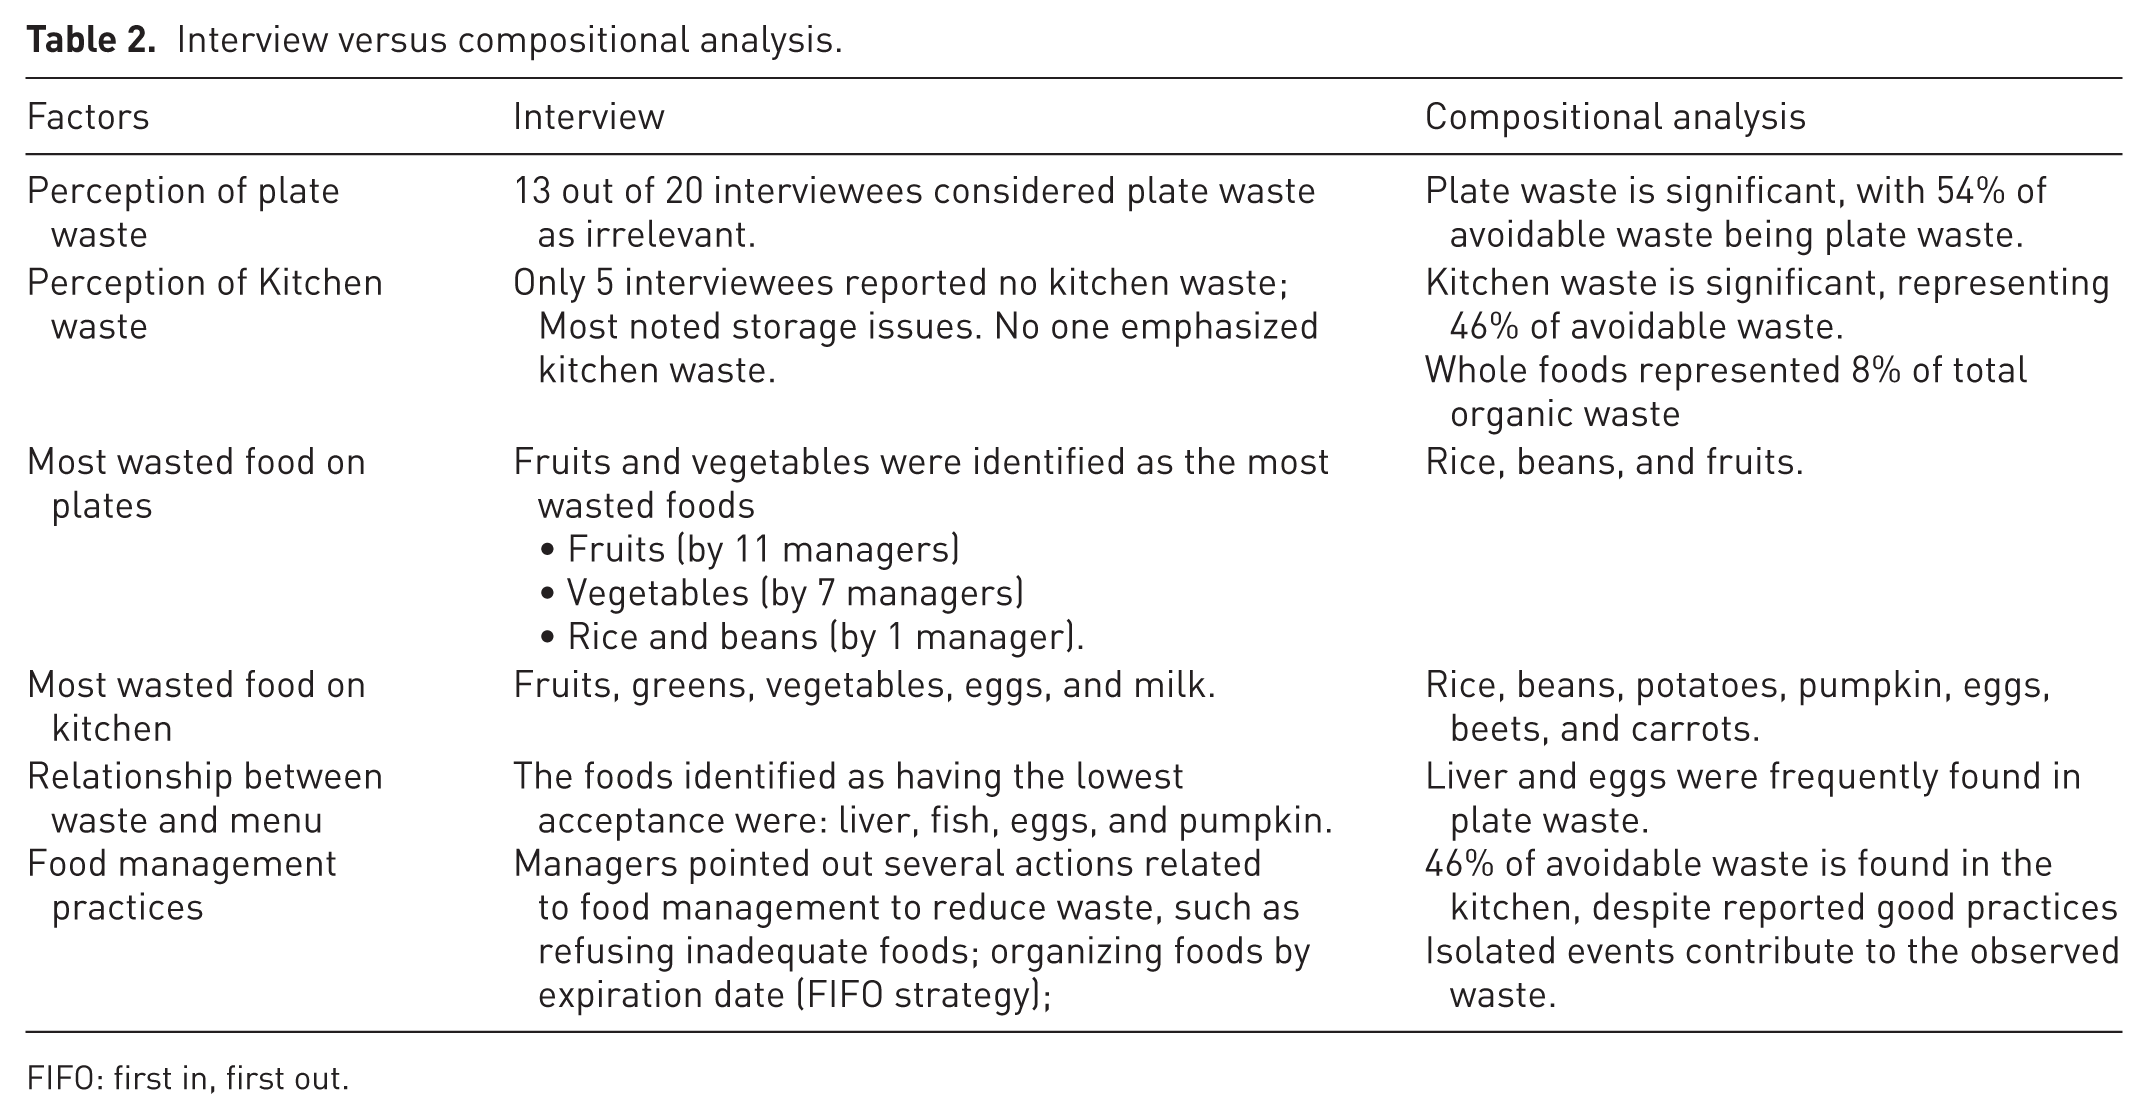
FIFO: first in, first out.
Regarding the most wasted food categories, respondents signaled that fruits, vegetables, and greens were problematic, but the analysis showed that rice and beans constituted the largest portion of waste from students’ plates. The absence of rice and beans as a “problem” by interviewees suggests that they do not perceive the waste generated from these staples as significant. This discrepancy may be attributed to a “normalization” of waste involving these items, where their frequent disposal is no longer perceived as a significant loss by staff. Furthermore, there is a widespread perception that fruits and vegetables are the most wasted foods due to their high perishability and low acceptance among students. This perception reinforces the importance of compositional analysis for the adoption of more effective measures to reduce waste.
Food service managers often focus on vegetable waste due to the expected lower acceptance by students. Although fruits and vegetables were not the most wasted, they remain a significant concern in food waste. In the literature, studies in Brazil (Rigon et al., 2022; Torrent et al., 2018) indicate that fruits and vegetables are often the most wasted due to low students’ acceptance, a trend also seen in the United States (Byker et al., 2014; Cohen et al., 2014). Additionally, research in Faro, Portugal, found an average food waste of 40.2% in schools, with vegetables being the most discarded items (Moura et al., 2024).
Respondents, in general, indicated that low acceptance of menu food items is a decisive factor in generating waste. They cited beef liver protein as the least accepted food. Eggs also emerged as an issue, with 34 kg wasted, accounting for only 1.8% of total discarded food, primarily due to their lighter weight. This result indicates the importance of joint work among different actors that encompasses coordinated actions from menu development, interventions with students on food and nutrition, and support for meal preparers to design strategies for including these foods in students’ diets. Engaging students in food selection and preparation can improve acceptance of such foods, as highlighted by Blondin et al. (2015).
Despite the existence of control mechanisms in food management, such as the rejection of unsuitable food and the implementation of the FIFO (first in, first out) strategy, the level of avoidable waste observed is still relevant. Kitchen management contributed to 46% of the avoidable waste, emphasizing the need for better meal planning and preparation practices. Elnakib et al. (2021) found that staff training in the USA led to a 7% reduction in food waste, underscoring the efficacy of such strategies.
Furthermore, compositional analysis suggests that, in addition to regular daily waste, isolated events can generate significant volumes of residues. This indicates the need for strategies that address both routine waste patterns and occasional higher-volume disposal events, a phenomenon previously documented by Lourenco et al. (2022) in households but that is also evident in school environments. The compositional analysis identified seven waste samples with disposal levels that deviated substantially from the typical pattern. Examples of these asymmetric disposal events included 14 kg of apples, 15 kg of green beans, and 14 kg of carrots, highlighting the sporadic nature of these high-volume waste incidents. These asymmetric disposal events highlight the sporadic nature of high-volume incidents, which require further investigation to understand the specific triggers, such as sudden attendance drops or preparation errors.
The comparison of interviews and the compositional analysis allowed not only to observe the discrepancies discussed above, but also to point out different actions that must be taken to reduce the food waste in Brazilian schools. The absence of food waste measurement practices in schools contributes to these discrepancies since managers are limited in understanding the problem without a diagnosis process. The data collected was synthesized through thematic categorization to ensure a robust comparison between these qualitative perceptions and the quantitative measurements.
Conclusion
Through the proposed simplified and novel dual-approach methodology, combining semi-structured interviews with compositional waste analysis, the research generated comprehensive empirical data about food waste in 20 schools in Rio de Janeiro, Brazil. This study revealed a significant disconnection between manager perception and reality: while 65% of school managers did not consider food waste a relevant issue, the analysis demonstrated that approximately 57% of school waste is considered avoidable. The research documented an average plate waste and kitchen waste of 37 and 31 g per student, respectively. Unavoidable waste accounts for 43% of total waste, suggesting that a circular approach is required to valorize these organic streams. These findings provide the empirical foundation for informed discourse and public policy formulation in Brazil.
Overall, school managers frequently attribute food waste to student-related factors, such as absenteeism and menu preferences, as well as to food type and perishability (e.g., fruits and vegetables). Conversely, they tend to overlook issues inherent to internal planning and preparation processes. Despite constraints regarding indirect per capita estimation from aggregated data and limited temporal representativeness, restricted to two sampling days per school, this approach successfully supports the design of evidence-based interventions.
This research proposed a low-cost and non-intrusive methodology to bridge the knowledge gap in food waste assessment in developing regions where scalable and resource-efficient methods are often lacking. By providing both qualitative insights into perceptions and quantitative measurements of actual waste, this study supports the design for evidence-based interventions that can simultaneously address waste reduction imperatives while fulfilling educational objectives. These analytical strategies can be disseminated to other educational institutions, thereby establishing a network of best practices for waste reduction initiatives within the global context of school feeding programs.
Practical implications
This study offers three practical implications. The first practical implication is that the mixed methodology confirmed that, before the proposal of food waste interventions in schools, the diagnosis step must be carried out carefully. The direct measurement method proved that perceptions of the school managers were incoherent with reality. The distortions between the results of the two applied methods suggest that the first intervention is to increase the awareness of school managers about the food waste issue and its main causes. The second practical implication is that the approach in schools must be comprehensive and coordinated, considering the necessity for strategic interventions from kitchen to table: adjustment of portion sizes to match student consumption patterns; enhancement of meal planning processes; implementation of systematic food management protocols; provision of specialized training for kitchen staff; and adoption of the waste hierarchy framework with emphasis on prevention and reduction at the source.
Furthermore, the proposed protocol is specifically designed for self-implementation by schools. It requires minimal resources, primarily basic weighing equipment and approximately 4–6 hours of staff time per sampling day, ensuring feasibility for educational institutions in developing countries with constrained budgets.
Last but not least, the proposed method is relatively simple and low-cost, allowing its self-implementation by schools during their diagnostic phase. This provides an opportunity to engage students and staff in the problem and propose interventions more appropriate to each school’s context.
Limitations
This study presents some limitations that require attention in future research. The methodology utilizes indirect plate waste estimation through aggregated collection, which prevents the identification of waste patterns linked to distinct student profiles. Consequently, the accuracy of per capita values is highly dependent on the precision of daily student attendance records. In addition, the findings reflect a limited temporal representativeness, as the data collection was restricted to two sampling days per school. While the study covered 20 schools and 9000 students, the results cannot be generalized to all regions because of socioeconomic and geographic diversity. Finally, a potential behavioral bias from school administrators who were notified about waste collection should be considered when interpreting results. Future research should consider longitudinal assessments and the impact of different menu cycles on waste generation patterns.
Footnotes
Appendix A: Interview protocol
School Name:
Principal’s Name:
Phone:
Email:
Neighborhood:
Visit Date:
Observations:

Ethical considerations
The study was conducted in accordance with ethical standards for research involving human participants. Informed consent was obtained from all school managers participating in the interviews, and all data were anonymized to ensure the confidentiality of the institutions and individuals involved.
Funding
The authors received no financial support for the research, authorship, and/or publication of this article.
Declaration of conflicting interests
The authors declared no potential conflicts of interest with respect to the research, authorship, and/or publication of this article.