
Abstract
The aims of the study were (a) to develop a scale to measure university students’ task value and (b) to use confirmatory factor analytic techniques to investigate the construct validity of the scale. The questionnaire items were developed based on theoretical considerations and the final version contained 38 items divided into 4 subscales. Analyses were conducted on 2 samples of university students (n1 = 430, n2 = 430). The results of confirmatory factor analysis suggested a modified version of the 4-factor model. The scale may have construct validity for the current sample of university students. Finally, possible applications for this scale, including for the early identification and prevention of problematic task values among university students, and implications for further psychometric research are highlighted.
Introduction
Expectancy-value theorists argue that performance and choice can be facilitated by high levels of confidence in one’s academic abilities and by valuing doing well in school (Atkinson, 1957; Eccles et al., 1983; Wigfield, 1994; Wigfield & Eccles, 1992). Some students may underachieve at school because they do not value the outcomes associated with school. To reverse underachievement that stems from low task value, educators may want to build task value into students’ scholastic experiences (McCoach & Siegle, 2002). The Motivated Strategies Learning Questionnaire (Pintrich, Smith, Garcia, & McKeachie, 1991) and the Class Value Assessment (McCoach & Siegle, 2002) evaluate the value students place on importance, interest, and utility, but they do not mention cost. Whereas Anderson (2000) categorized concepts of cost into economic, time-related, and psychological considerations, no scale was developed. The development of a valid measure to understand students’ values with respect to academic learning is the first step toward prevention and intervention. Therefore, creation of an Achievement Task Value Scale for university students and examination of the reliability and validity of such a scale via confirmatory factor analysis (CFA) constitute the objectives of this study.
Expectancy-Value Model of Achievement and Constituents of Achievement Task Value
Eccles and Wigfield explored students’ learning motivations and developed the expectancy-value model (Eccles et al., 1983; Eccles & Wigfield, 2002; Wigfield & Eccles, 1992, 2002).
According to the model of expectancy value developed by Eccles et al. (1983), two factors predict academic behavior: expectancies for success and the achievement task value associated with the task (Schunk, Pintrich, & Meece, 2008). Wigfield and Eccles (2002) define expectancies for success as “children’s beliefs about how well they will do on an upcoming task” (p. 94). Therefore, if the success rate is high after the evaluation, the motivation to learn a particular subject can be increased. Eccles and Wigfield (2002) defined task value as “the reasons individuals have for engaging in different achievement tasks” (p. 112), which also refers to how students view an academic task. Achievement task refers to the main tasks that students perform in school, including those related to their schoolwork, academic achievements, participation (studying, completing assignments, doing homework, attending classes, and engaging in coursework), and so on. Thus, achievement task value was one of two factors affecting students’ learning motivations and behavior. Therefore, increasing students’ achievement task values may be an important way to increase students’ motivation for learning.
Components of Achievement Task Value
This study requires a more detailed examination of the subcomponents of achievement task values. Based on studies by Eccles (2005) and Wigfield and Eccles (2002), achievement task value can be further subdivided into four components: importance of attainment, intrinsic interest, utility, and cost. The following paragraph presents the constituents of achievement task values and discusses the feasibility of measuring this construct.
Degree of importance is defined as how well a task fits with one’s self-identity; when a task fits into a student’s self-identity, it is highly important to that student. Conversely, when doing well on a task does not match the individual’s self-identity, it is of little importance. For example, a student majoring in a foreign language may think that achievements in math-related tasks are not crucial to being a good student; thus, math would be accorded a low level of importance. Thus, we can assess the relevance of a given subject to a student’s self-identity to measure that student’s valuation of the importance of that subject.
Second, the interest component refers to the pleasure and enjoyment experienced during participation in the activities, or as a personal interest (Eccles & Wigfield, 2002). Hidi and Baird (1986) and Schiefele (1999) found that tasks with certain characteristics interested students. First, tasks that are relevant to daily life and provide pleasure and experiences of success tend to interest individuals. Second, tasks offering a sense of autonomy and those compatible with other interests also tend to interest individuals. Finally, because students internalize the values of people whom they respect, they may spend more time studying when they respect an individual who values academic achievement. This may lead to better performance and generate interest in academics. Thus, the following factors should be considered in assessments of the value placed by students on tasks: relevance to daily life, opportunities for success and pleasure, possibilities for autonomy or control, compatibility with an individual’s interests, and existence of significant others who value achievement of the task.
Moreover, utility is determined by the association of the task with the individual’s long- or short-term goals and the beneficial consequences of the task (Eccles & Wigfield, 2002). Tasks that are strongly correlated with an individual’s career have a higher utility value. Thus, some students learn a subject due to the relationship between that subject and their goals for the future rather than due to personal interest in the subject. By definition, subjects in this category have high utility value. These goals include passing exams for advancement, expanding future job opportunities, gaining interpersonal recognition (e.g., “Most classmates are not good at statistics. If I were good at it, I would stand out and got rewarded.”), improving interpersonal communication, and accumulating life experiences (e.g., “English is useful when traveling overseas, and math is useful for calculations in daily life.”). Consequently, the relationship between a subject and the long- or short-term life goals of students should be considered in attempts to understand utility value.
Finally, cost includes comparisons among the potential consequences of decisions. The factors affecting cost include the following: the effort required to succeed, the costs of being unable to choose other valuable options, the psychological cost resulting from failure, perceived task difficulty, and so on (Eccles et al., 1983; Eccles, 1987; Eccles & Wigfield, 1995; Wigfield & Eccles, 1992). Anderson (2000) categorized concepts of cost into economic, time, and psychological factors and believed that individual perceptions of the costs of each task vary.
Based on the literature on task achievement value theory, this research developed a Task Achievement Value Scale for use in university learning and counseling centers. Reliability and validity will be examined through CFA.
Method
Participants
The sample consisted of 925 college students enrolled in public and private universities (including universities and colleges of technology) located in different parts of Taiwan.
Following data collection, data were hand coded and questionnaires with incomplete answers or all the same answers were discarded. The SPSS software was used to identify outliers, which were also discarded. The sample used in the formal analysis included a total of 860 participants (247 public and 613 private university students; 307 males and 553 females).
The ratio of students in private/public colleges in this study was 2.45, which is close to the actual 2.70 ratio of students in private/public colleges in Taiwan. Thus, this sample is representative of the population of Taiwanese university students.
Development of the Research Tool
Preliminary Development of Scale Items
This scale was developed based on the expectancy-value model of success proposed by Eccles and Wigfield, and items were developed to address the four important dimensions noted above: importance, interest, utility, and cost.
First, the researcher distributed questionnaires containing open-ended questions to 60 students from the university (most of these students majored in the social sciences). These students were invited to share opinions about their values in terms of the aforementioned dimensions. The researcher interpreted, organized, analyzed, and categorized students’ answers to develop the preliminary version of the structured questionnaire. After the deletion or synthesis of redundant items, 80 items remained for the pretest.
Next, two experts specializing in learning and testing reviewed and checked the quality of the 80 items; items were then modified accordingly.
Item Analysis for the Pretest
First item analysis for the pretest
The authors distributed questionnaires to 196 students, primarily social science majors in the same university, who had not responded to the open-ended questionnaire. All 196 questionnaires were returned. After deleting three questionnaires with missing data on three or more items, 193 valid questionnaires were used for analysis. After conducting an item analysis for each subscale (importance, interest, utility, and cost), the authors deleted items with low discriminative value (t-test) and those with a low adjusted correlation coefficient (<0.3). This process yielded 60 items.
Second item analysis for the pretest
Because some students answered with “no comment” in the first pretest, the scaling system was modified, and a second pretest, based on the 60 items extracted from the results of the first pretest, was conducted.
In the second pretest item analysis, the scale was changed from 5 (from extreme disagreement to extreme agreement) to 7 (from 0% agreement to 100% agreement) points. It was thought that asking students to choose based on degree of agreement would render them less likely to choose a number in the middle range. Generally, the no-comment response in Likert-type scales is considered to be located between disagree and agree. However, in a percentage-agreement questionnaire, 0% agreement means the least agreement possible or extreme disagreement, which differs from an opinion in the middle range. Thus, a student who might otherwise select no comment would not choose 0% agreement.
For the second pretest, the researcher distributed 224 questionnaires to students with a variety of majors from four different universities. Some participants were social science majors, and others were natural science majors. Of the 224 questionnaires that were returned, two with missing data on three or more items or the same answers to every question were discarded. After this process, 222 valid questionnaires remained. Finally, item analysis was conducted. The same criteria used in the first pretest were used to evaluate and select items. A total of 40 items were selected for inclusion in the final version of the scale.
Construction and content of the final scale
After two rounds of pretesting and deletion, the Achievement Task Value Scale for University Students included four subscales: importance, interest, utility, and cost. The importance subscale focused primarily on perceptions about the match between tasks and self-identity. This subscale included the following items: “Academic learning has an effect on the future of university students” and “Coursework (schoolwork) is the personal duty and responsibility of a university student.” The interest subscale focused primarily on enjoyment related to achieving a task. This subscale included the following items: “University classes are much more diverse and interesting than high school classes” and “I really enjoy the energetic and humorous teaching style of some university teachers.” The utility subscale mainly addressed the congruence among tasks, career goals, and potential future benefits. This subscale included the following items: “College coursework is useful for increasing professional knowledge and skills” and “The academic knowledge gained in college can be used when we graduate and enter the job market.” The cost subscale focused on the anticipated costs of successful task achievement. This subscale included the following items: “If you want to get a good grade in college, you have to spend time and energy” and “Learning in college is for our own good; therefore we should study hard.”
For the final test, conducting based on the results of the second pretest, the authors distributed questionnaires to students in universities and colleges throughout Taiwan. These students were from different locations of the universities/colleges in Taiwan and included science, engineering, nursing, liberal arts, and social sciences majors. The total sample consisted of 860 university students after incomplete questionnaires were discarded. Items 19 and 38 were deleted because they were too strongly correlated with other items. Thus, a total of 38 items and four subscales (importance, utility, interest, and cost) were included in the final version of the scale.
Results
Descriptive Statistics
This study included a sample of 860 students from 19 universities/colleges in different locations of Taiwan. The average scores on the 38 items ranged between 4.64 and 6.11, and the standard deviations ranged from 0.940 to 1.343. Because estimates of the SEM calculated via the maximum-likelihood (ML) method are affected by the distribution of variables, an absolute skewed value greater than 0.3 for variable allocation would be considered extreme skewness. If the absolute value of kurtosis were greater than 10, it would be regarded as inappropriate; if it were greater than 20, it would be considered extreme kurtosis (Kline, 1998). The descriptive statistical analysis found skewness values ranging from −1.06 to −0.244 and kurtosis values ranging from −0.027 to 1.603. The pattern of skewness and kurtosis is also consistent with the assumption of a normal distribution.
Confirmatory Factor Analysis (CFA)
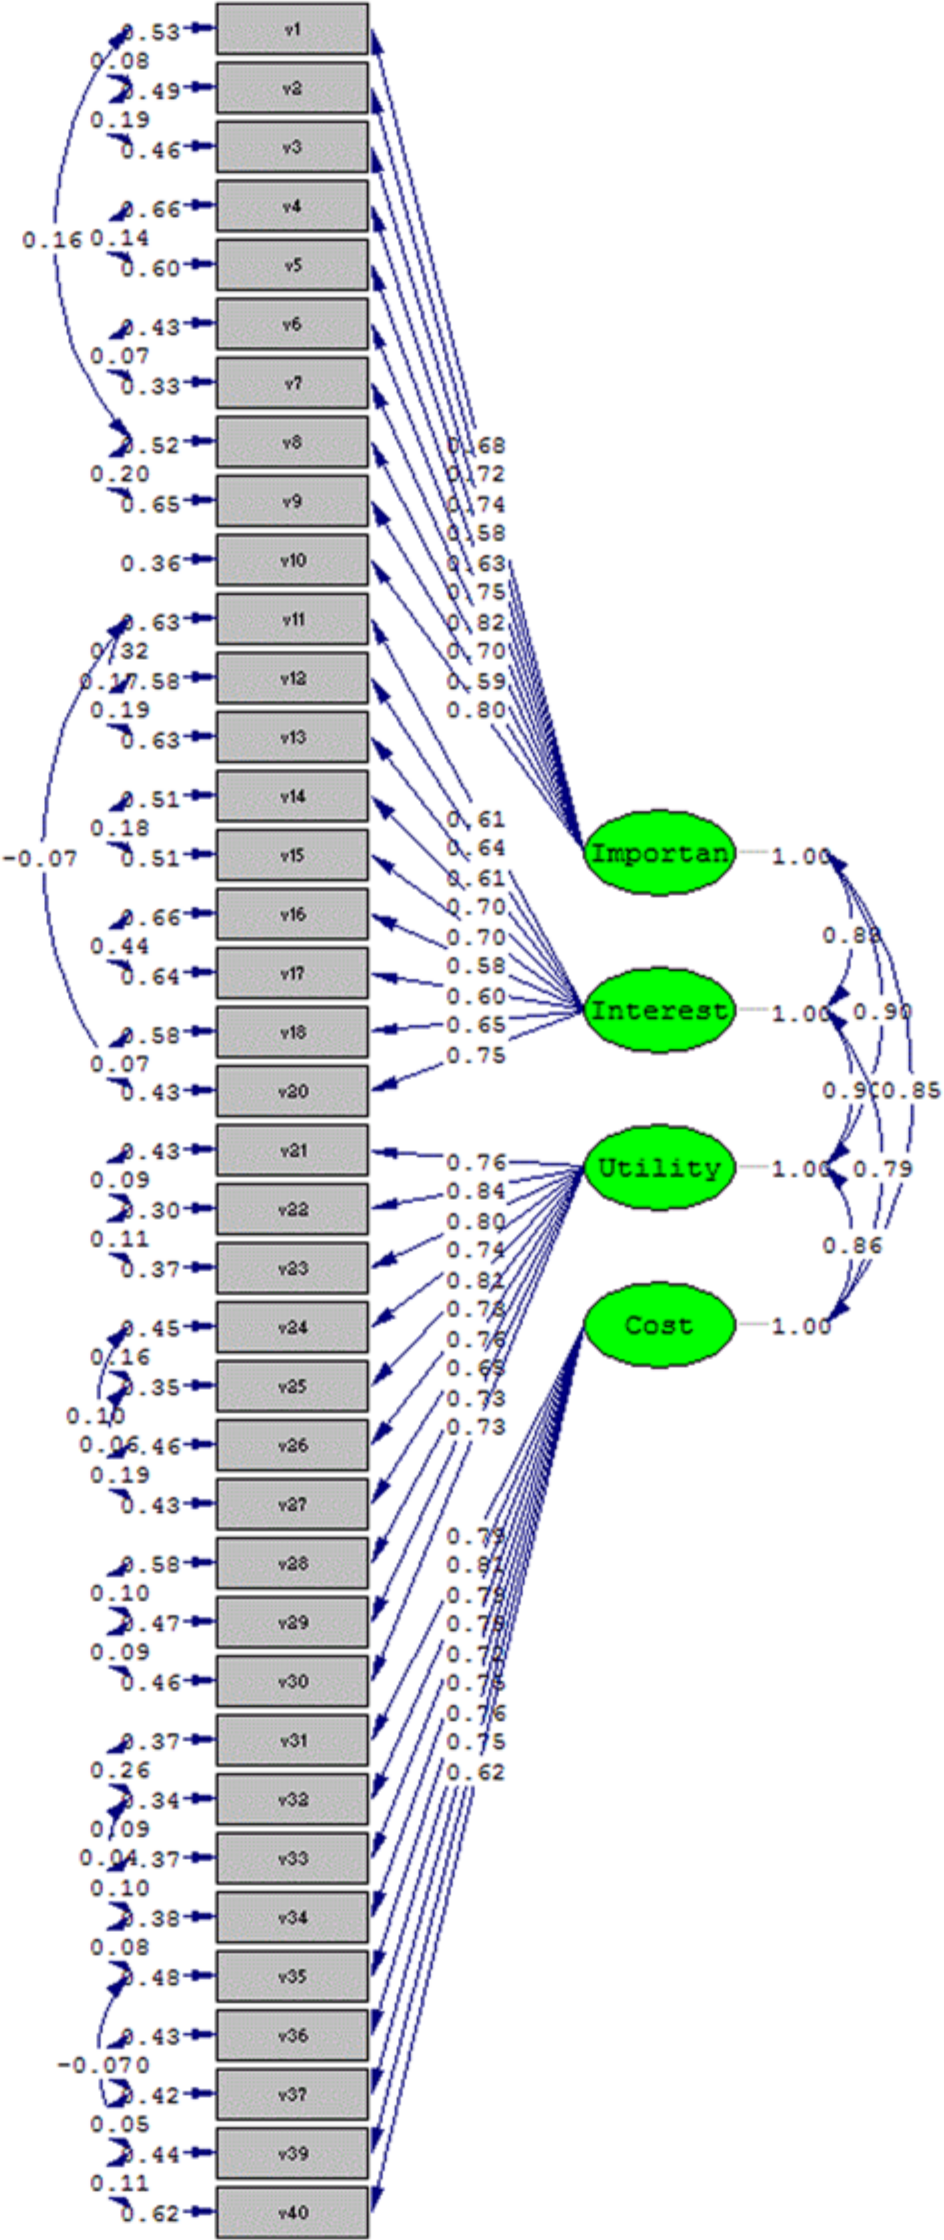
CFA was used to examine the composite reliability and construct validity of the Achievement Task Value Scale for University Students. In this step, a total of 860 subjects were randomly divided into two groups for model testing: 430 students were included in the calibration sample and another 430 students were included in a validation sample for purposes of experimental verification. LISREL ver. 8.80 was used for the CFA, and the ML method was used to estimate parameters to test the factor validity of this scale. This study used the average values of each subscale as observable variables to design the measurement model for the Achievement Task Value Scale for University Students.
This article used a one-step four-factor correlated model. In addition, the experimental validation sample was used for cross-validity to examine the goodness of fit of different samples.
According to the indices, the calibration sample model met the criteria for a good model fit (CFI = 0.98, RMSEA = 0.064, SRMR = 0.055). The validation sample produced statistics that indicated a good fit with the current data (CFI = 0.99, RMSEA = 0.057, SRMR = 0.049); the goodness of fit of both samples was consistent and congruent with accepted standards. When applying the estimators set in the calibration sample to the validation sample, the indices of the model matched the expectations of the theoretical model. In addition, similar explanatory power was shown in the different samples, signifying cross-validation (see Figures 1 and 2).

Confirmatory factor analysis for Achievement Task Value Scale for University Students (calibration sample).
Confirmatory factor analysis for Achievement Task Value Scale for University Students (validation sample).
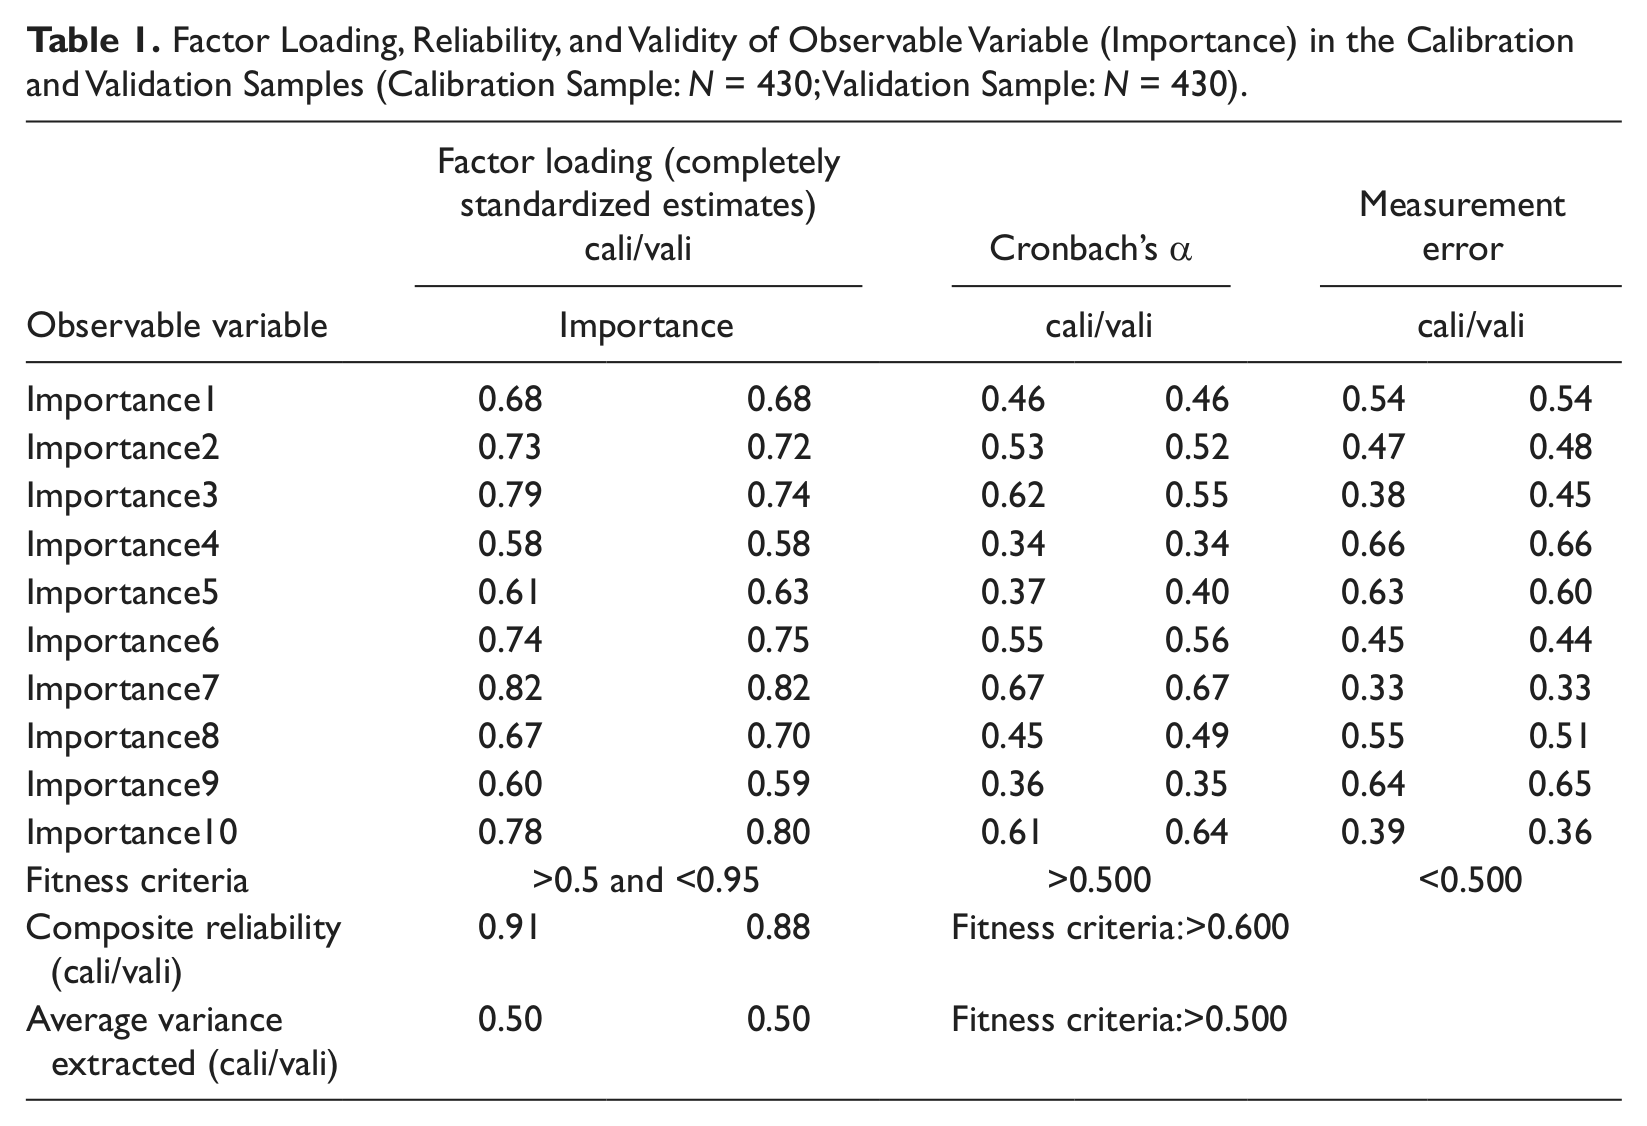
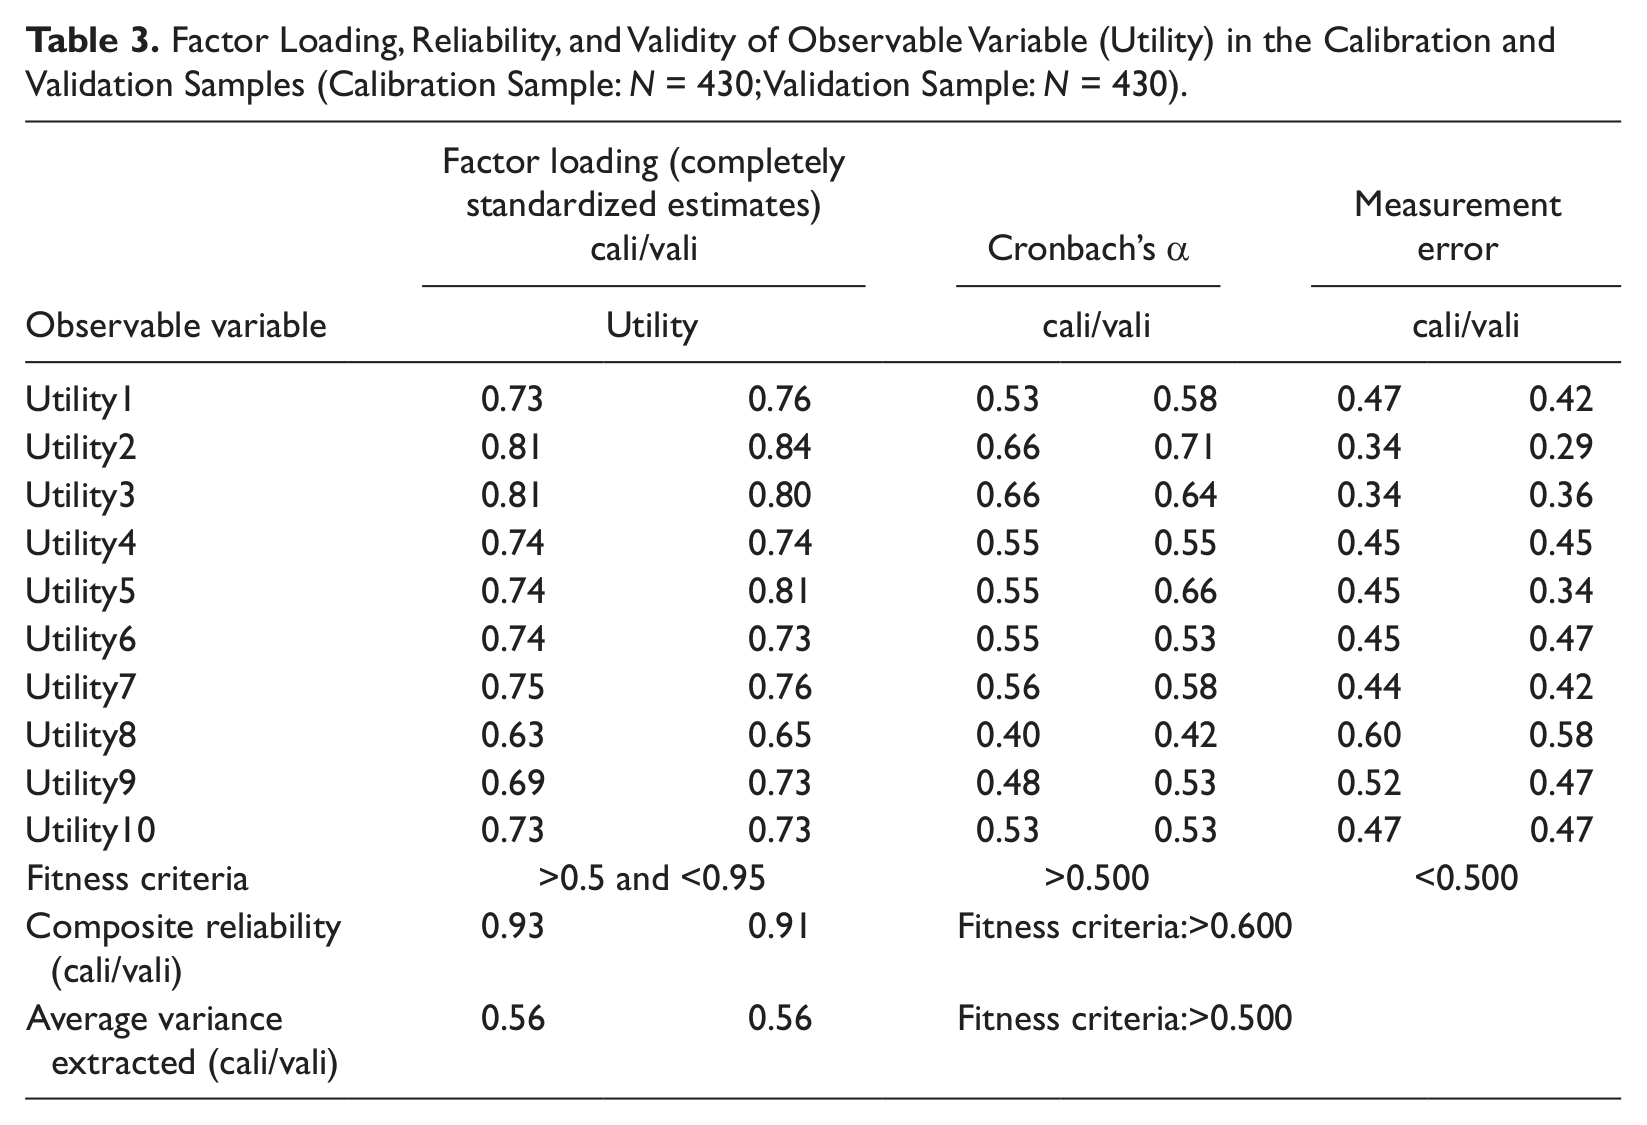
Tables 1 to 4 show that, in the calibration sample, the factor loadings (completely standardized estimates) of the observable variables corresponding to the latent variables ranged from 0.54 to 0.85, which were all above the standard of 0.50 and below 0.95. The t values were over 1.96, indicating that all observable variables corresponding to latent variables were valid. Furthermore, the composite reliability of the four latent variables ranged from 0.87 to 0.93, which exceeded the standard of 0.6, indicating that the observable variables corresponding to the latent variables were well constructed. Finally, the average variance extracted for the four latent variables ranged from 0.44 to 0.58.
Factor Loading, Reliability, and Validity of Observable Variable (Importance) in the Calibration and Validation Samples (Calibration Sample: N = 430; Validation Sample: N = 430).
Factor Loading, Reliability, and Validity of Observable Variable (Interest) in the Calibration and Validation Samples (Calibration Sample: N = 430; Validation Sample: N = 430).

Factor Loading, Reliability, and Validity of Observable Variable (Utility) in the Calibration and Validation Samples (Calibration Sample: N = 430; Validation Sample: N = 430).
Factor Loading, Reliability, and Validity of Observable Variable (Cost) in the Calibration and Validation Samples (Calibration Sample: N = 430; Validation Sample: N = 430).
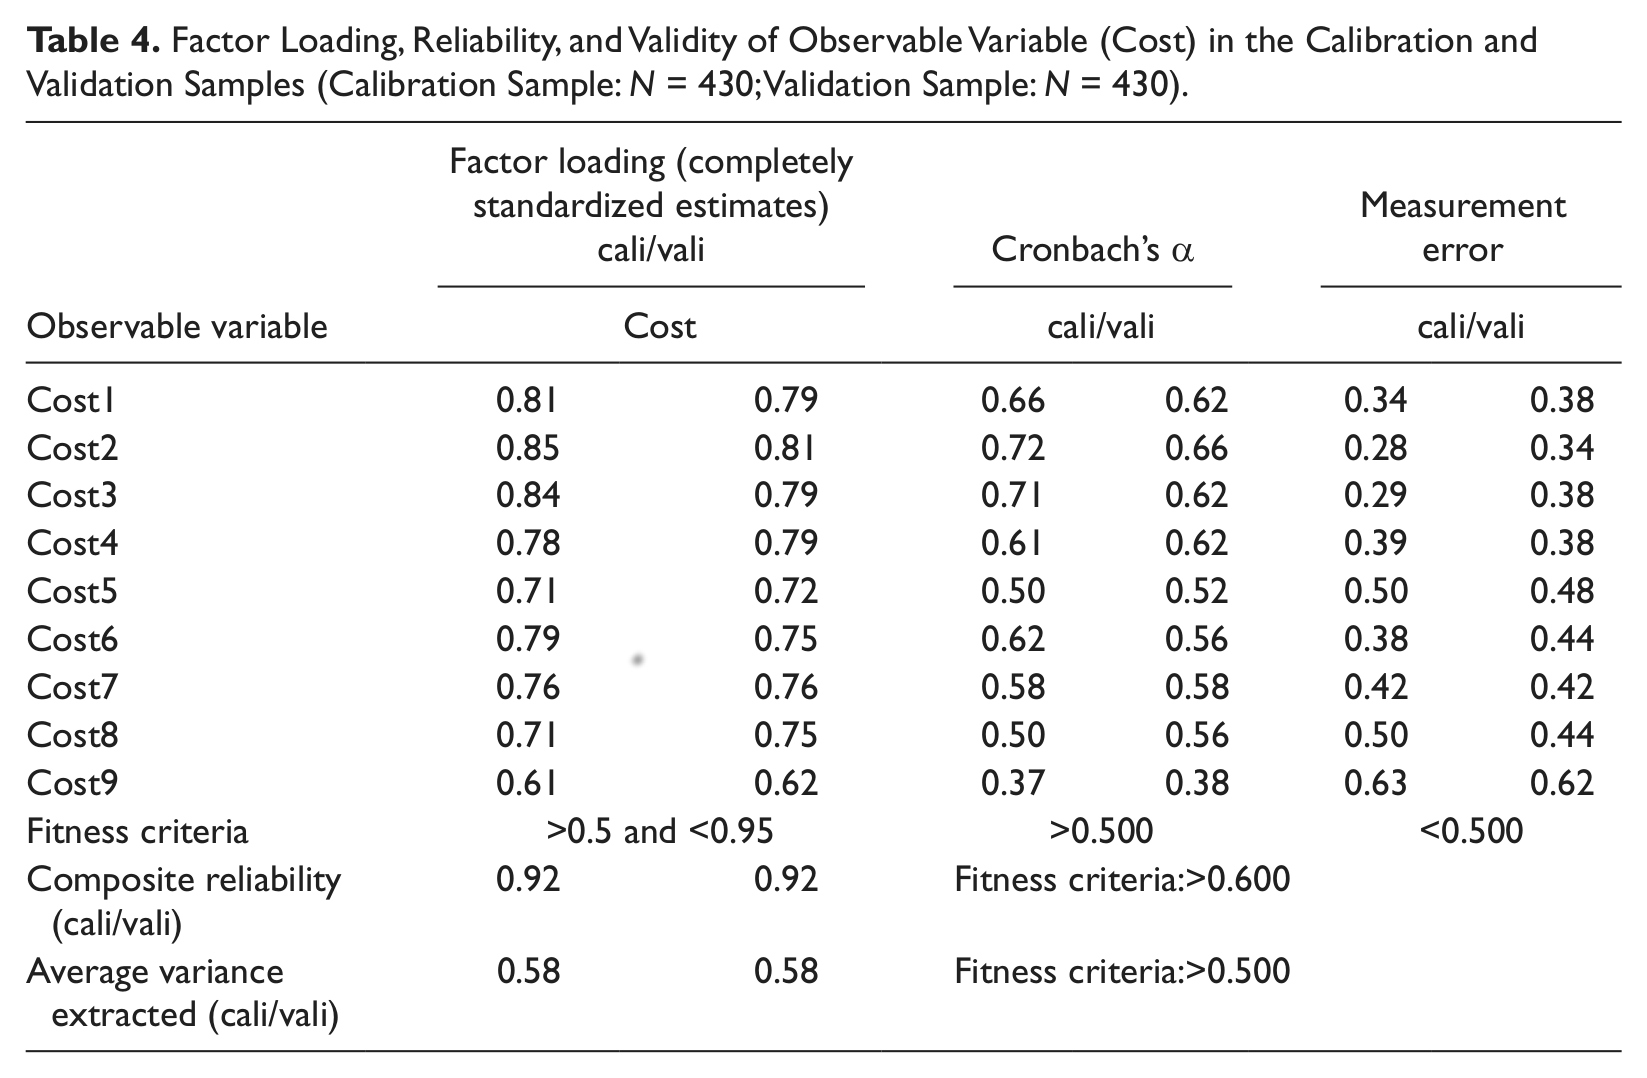
In the validation sample, the factor loadings (completely standardized estimates) of all the observable variables corresponding to the latent variables ranged from 0.58 to 0.84. The overall t values of the observable variables were higher than 1.96, indicating that all observable variables corresponding to latent variables had good validity. Furthermore, the composite reliability of the four latent variables ranged from 0.87 to 0.92, indicating that observable variables corresponding to latent variables were well constructed. The average variance extracted for the four latent variables ranged from 0.44 to 0.58. Overall, the observable variables appropriately corresponded to the latent-variable model established by the researcher.
Discussion
The objective of the present study was to examine the construct validity of the Achievement Task Value Scale across two samples. Taken together, these findings suggest that university students follow a similar four-factor structure in their self-report of achievement task value. Thus, it can be concluded that the university students in this study had a similar interpretation of the items on the Achievement Task Value Scale regardless of whether they were part of the validation or the calibration sample.
These data complement the recent findings reported by Eccles (2005) showing that achievement task values can be divided into four factors. The present findings are also consistent with those of a study conducted by Wigfield and Eccles (2002), who emphasized that four factors (importance, interest, utility, and cost) comprise the model.
The findings presented here are important as they represent an initial step toward the development of an Achievement Task Value Scale that tests the value of importance, interest, utility, and cost at the same time.
Implications and Future Directions
The current study has important clinical and research implications.
The overall fit of the model of the present scale was acceptable. However, modifications and additional items are needed to increase its construct validity.
The norms for the Achievement Task Value Scale were not established in this study, and the authors suggest that norms be established after the completion of studies with adequate sample sizes.
This article did not include the establishment of cutoff D-scores for applications of the scale. Thus, additional psychometric studies are need to longitudinally examine the utility of the Achievement Task Value Scale for predicting relevant problems of students and for establishing thresholds for prevention and intervention (Lou, 2005).
Support for the four-factor structure of the Achievement Task Value Scale does not, in itself, directly support prevention or early intervention efforts, and further research into potential interventions and monitoring strategies is warranted.
One limitation of the current study is its sample, Taiwanese university students, which may limit the generalizability of the findings. Future research should test the factorial invariance of the Achievement Task Value Scale across different racial/ethnic and language groups.
Footnotes
Acknowledgements
The authors thank the reviewers for their valuable comments on an earlier version of this manuscript.
Declaration of Conflicting Interests
The authors declared no potential conflicts of interest with respect to the research, authorship, and/or publication of this article.
Funding
The author(s) disclosed receipt of the following financial support for the research, authorship, and/or publication of this article: Preparation of this paper was facilitated by grants from the National Science Committee of Taiwan (NSC 95-2413-H-468-002- and NSC 100-2511-S-451-002-).