
Abstract
New editions of the Wechsler Adult Intelligence and Memory scales are now available. Yet, given the significant changes in these new releases and the skepticism that has met them, independent evidence on their psychometric properties is much needed but currently lacking. We administered the WAIS-IV and the Older Adult version of the WMS-IV to 145 older adults. We examined how closely our data matched the normative sample by comparing our scaled scores with those of the publisher and by evaluating interrelations among subtests using confirmatory factor analysis. Not surprisingly, scaled scores from our sample were somewhat higher than those from the normative sample on some tests. Factor analysis on our sample provided support for a higher-order model of the WAIS-IV/WMS-IV Older Adults battery combined. In addition, allowing some subtests to load on more than one factor significantly improved model fit. The best fitting model for our sample was also the best for the normative sample. Overall, the data suggest that the factor analysis models generated from the normative samples for the new WAIS-IV and WMS-IV are reliable.
The Wechsler Adult Intelligence and Memory scales are among the most commonly used by neuropsychologists (Butler, Retzlaff, & Vanderploeg, 1991; Rabin, Barr, & Burton, 2005; Sullivan & Bowden, 1997) and have been considered by many to be the gold standard (Hartman, 2009; Stanos, 2004). Recently, new editions of both tests have been released (the Wechsler Adult Intelligence Scale—fourth edition (WAIS-IV; Wechsler, 2008) and the Wechsler Memory Scale—fourth edition (WMS-IV; Wechsler, 2009). These new versions were deemed necessary to improve the match with the psychological constructs they are purported to measure and to provide updated norms. Yet, given the significant changes in these new releases and the questions that have met them (e.g., Loring & Bauer, 2010), independent evidence on their psychometric properties is much needed but currently lacking. Here, we present data from 145 older adults who completed the WAIS-IV and the Older Adult version of the WMS-IV. We examined how closely our data matched the normative sample by comparing our scaled scores with those of the publisher and by evaluating interrelations among subtests in our data using covariances and factor analyses. We then examined the factor structure of the WAIS-IV and the WMS-IV Older Adult battery in the normative sample. In addition, we tested for measurement invariance in the covariance structure across the two samples.
Construction of the WAIS and WMS
All versions of the WAIS and WMS combine scores from multiple subtests into factors or indexes, with the goals of improving reliability and validity and of providing an interpretative framework for the observed measures. Although the WAIS and WMS have practical (but not atheoretical; see Coalson, Raiford, Saklofske, & Weiss, 2010; Kaufman, 2010) origins, their evolution has been influenced not only by factor analyses of previous versions, but also by current theories of intelligence, cognition, and neuropsychology. The WAIS-IV subtests are similar to those in the WAIS-III, with two core additions: visual puzzles (included in the perceptual reasoning index) and digit span sequencing (included in the working memory index; Wechsler, 2008).
Compared with its previous version, the WMS-IV contains several major changes, including a new visual designs subtest and two new working memory subtests (spatial addition and symbol span). In addition, an abbreviated battery is now recommended for older adults (age 65 to 90). For a schematic presentation of the evolution of the two batteries, see Table 1.
Evolution of Factors in the Various Versions of the WAIS and WMS.
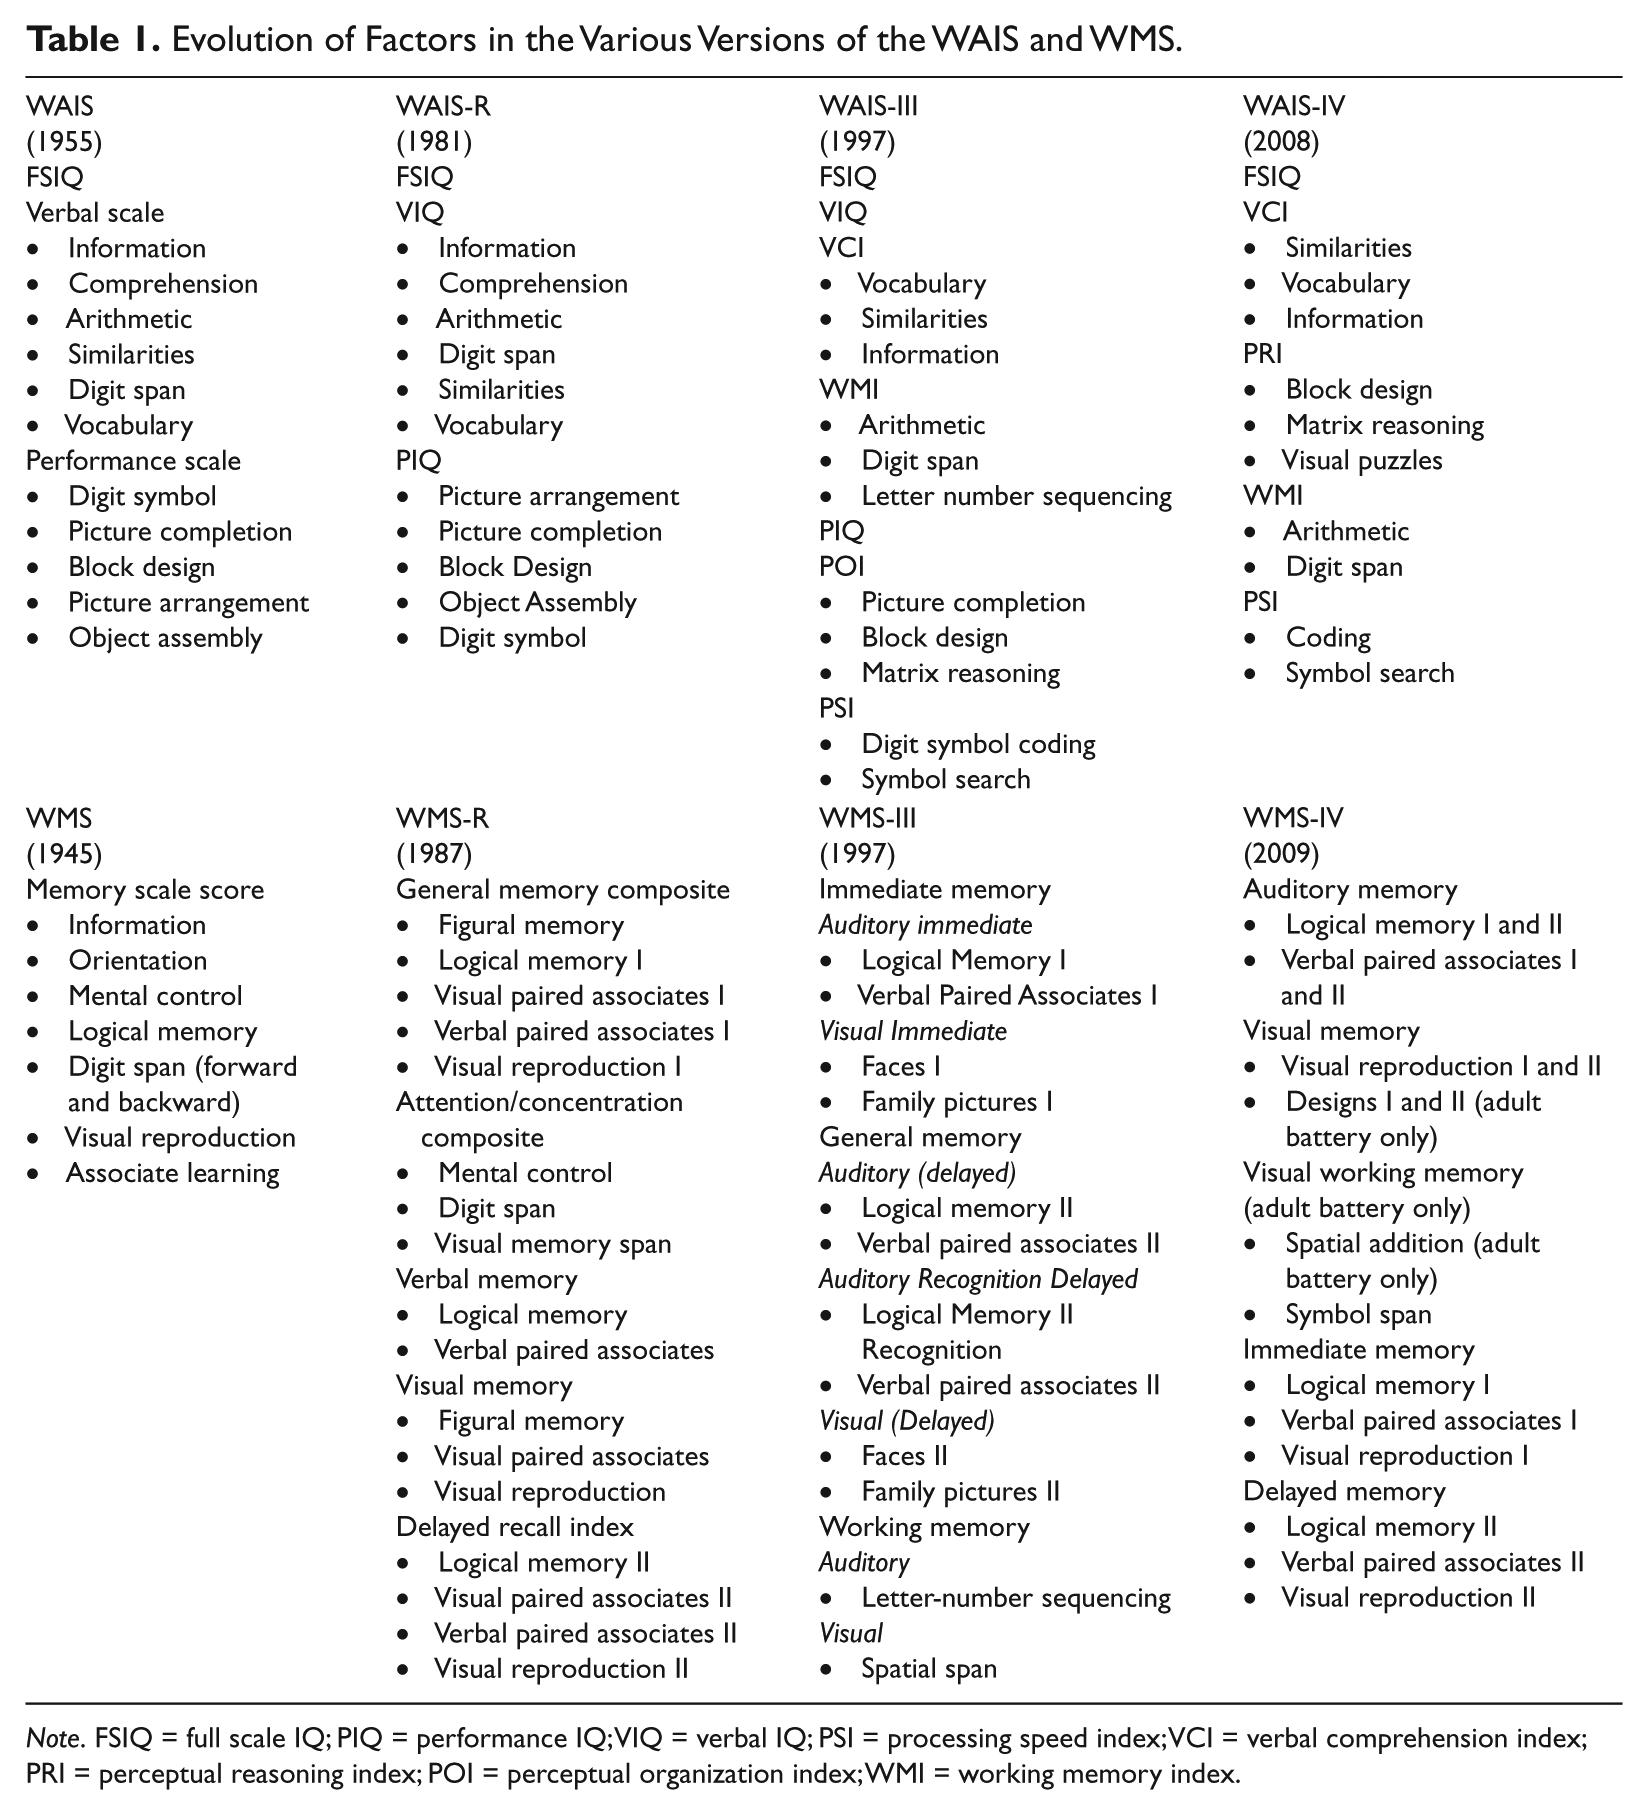
Note. FSIQ = full scale IQ; PIQ = performance IQ; VIQ = verbal IQ; PSI = processing speed index; VCI = verbal comprehension index; PRI = perceptual reasoning index; POI = perceptual organization index; WMI = working memory index.
One recent strategy has been to examine the WAIS and WMS simultaneously, in part because the newer versions have been co-normed. Such studies of previous editions of the WAIS and WMS have found evidence for five- and/or six-factor models. For example, Bowden and coworkers (Bowden, Carstairs, & Shores, 1999; Bowden et al., 2001) advanced a five-factor model for the WAIS-R and WMS-R consisting of verbal comprehension, perceptual organization, attention-concentration/working memory, and verbal memory and visual memory. Tulsky and Price (2003) proposed a similar model for the third edition of the tests, except that they added a processing speed factor. Allowing some subtests to load on more than one factor significantly improved model fit.
Research on the WAIS-IV and WMS-IV
To date, only one study has examined the WAIS-IV and WMS-IV together. Holdnack, Xiaobin, Larrabee, Millis, and Salthouse (2011) found support for a higher-order six-factor model with a first order general ability factor and second order verbal comprehension (consisting of the vocabulary, similarities, and information subtests), perceptual reasoning (block design, visual puzzles, and matrix reasoning subtests), working memory (digit span, arithmetic, symbol addition, and symbol span subtests), processing speed (coding and symbol search subtests), and memory (logical memory 2, verbal paired associates 2, designs 2, and visual reproduction 2 subtests) factors. Allowing the arithmetic, symbol span, logical memory 2, and visual reproduction 2 subtests to load on more than one factor significantly improved model fit.
We built on Holdnack et al.’s (2011) report in two ways. First, they used the publisher’s normative dataset, as have all the other extant reports on WAIS-IV and/or WMS-IV (Benson, Hulac, & Kranzler, 2010; Bowden, Saklofske, & Weiss, 2011; Brooks, Holdnack, & Iverson, 2011; Canivez & Watkins, 2010; Drozdick & Cullum, 2011; Hoelzle, Nelson, & Smith, 2011; Salthouse & Saklofske, 2010). Thus, to date, the WAIS-IV and WMS-IV have not been evaluated in an independent sample. Second, Holdnack et al. excluded participants who were over the age of 65, because they completed the WMS-IV Older Adult battery only. Thus, to date, no study has evaluated the factor structure of the WAIS-IV and WMS-IV in older adults.
Method
Participants
The study presented here was approved by the Ethics Committee of the University of Ottawa. One hundred and forty-five (94 females: 65%) community dwelling people between 65 and 92 years of age (mean = 73.17 years, SD = 6.50) were recruited from diverse socioeconomic backgrounds, using advertisements in two free magazines for seniors and flyers in community centers and subsidized housing buildings. Participants’ education ranged from 7 to 22 years (mean = 13.96 years, SD = 2.83); 2.1% of participants had Grade 8 or less, 13.8% had between Grade 9 and Grade 12, 33.1% had a high school diploma, 17.9% had some college or university, and 33.1% had a bachelor’s, graduate, or professional degree. The exclusion criteria included age younger than 65, lack of proficiency in English, diabetes, brain disease, chronic hepatitis, and presence of mental health problems such as anxiety and depression. Participants were compensated CAN$100. In the sample, 87.6% were Caucasian, 0.7% African American, 3.4% Asian, 4.8% South Asian, 0.7% Hispanic, and 2.8% were from a mixed background. Sixty-six percent of the sample reported experiencing memory problems.
The publisher’s normative sample consisted of 286 participants who completed both the WAIS-IV and the WMS-IV Older Adults battery. The mean age of participants in this subset of the normative sample was 78.78 years (SD = 6.91). In this sample, 17% of people had Grade 8 or less, 13% had between Grade 9 and Grade 12, 38% had a high school diploma, 19% had some college or university, and 13% had a bachelor’s, graduate, or professional degree. 1
Measures
Wechsler Adult Intelligence Scale Fourth Edition
The 10 core subtests yield four index scores (verbal comprehension, perceptual reasoning, working memory, and processing speed), as well as Full-Scale IQ. The WAIS-IV was normed on 2,200 people aged 16 to 90 years old, 600 of whom were over the age of 65 (mean age of 75.68 years, SD = 7.68). In that sample, 14% of people had Grade 8 or less, 12% had between Grade 9 and Grade 12, 35% had a high school diploma, 20% had some college or some university education, and 19% had a bachelor’s, graduate, or professional degree. Full Scale IQ construct validity was assessed by the publisher using a number of other cognitive measures including the WAIS-III (r = 0.94) and the subtests of the WMS-III (rs range from r = 0.34 to r = 0.69). For people 65 years of age and older, reliability coefficients for the WAIS-IV subtests range from r = 0.78 to r = 0.96 and for the WAIS-IV composite scores range from r = 0.91 to r = 0.98. The reliability coefficient for Full Scale IQ is r = 0.98 (Wechsler, 2008).
Wechsler Memory Scale Fourth Edition
The Older Adult battery (for people 65 to 90 years old) consists of seven subtests: logical memory 1 and 2, verbal paired associates 1 and 2, visual reproduction 1 and 2, and symbol span, yielding four indexes: auditory memory, visual memory, immediate memory, and delayed memory. The WMS-IV Older Adult battery was normed on 500 people aged 65 to 90 (mean age of 77.35 years, SD = 7.11). In that sample, 13% of people had Grade 8 or less, 13% had between Grade 9 and Grade 12, 35% had a high school diploma, 19% had some college or some university education, and 20% had a bachelor’s, graduate, or professional degree. According to the publisher, the WAIS-IV FSIQ index’s correlations with the different subtests of the WMS-IV Older Adult battery range from r = 0.44 to r = 0.62, and with the WMS-IV index scores range from r = 0.57 to r = 0.71. The reliability coefficients for the WMS-IV Older Adult battery subtests range from r = 0.74 to r = 0.96, and for the indexes range from r = 0.92 to r = 0.97.
Analyses
Analyses of Variance
In order to determine how similar the normative data were to our new sample, we obtained the scaled scores (i.e., age-adjusted; mean = 10, SD = 3) for healthy older adults from the normative samples for the WAIS-IV (n = 600) and WMS-IV (n = 500) from the publisher. We compared their data against ours using a pair of mixed analyses of variance (ANOVAs), one for WAIS-IV subtests and the other for WMS-IV subtests that were included in the factor analyses. We report effect sizes (Cohen’s d) in all post hoc comparisons to help interpret the practical significance of these findings: d = 0.2 is considered small, d = 0.5 moderate, and d = 0.8 is considered large (Cohen, 1988).
Correlations
Before proceeding with our factor analyses, we ran exploratory Pearson correlations among subtest scores (shown in Table 2). Following the procedure employed by Holdnack et al. (2011), we omitted the immediate versions of the WMS-IV subtests (e.g., logical memory 1) from our analyses (see Holdnack et al., 2011).
Correlation Matrix With Means and Standard Deviations of Subtest Scaled Scores for Our Sample.
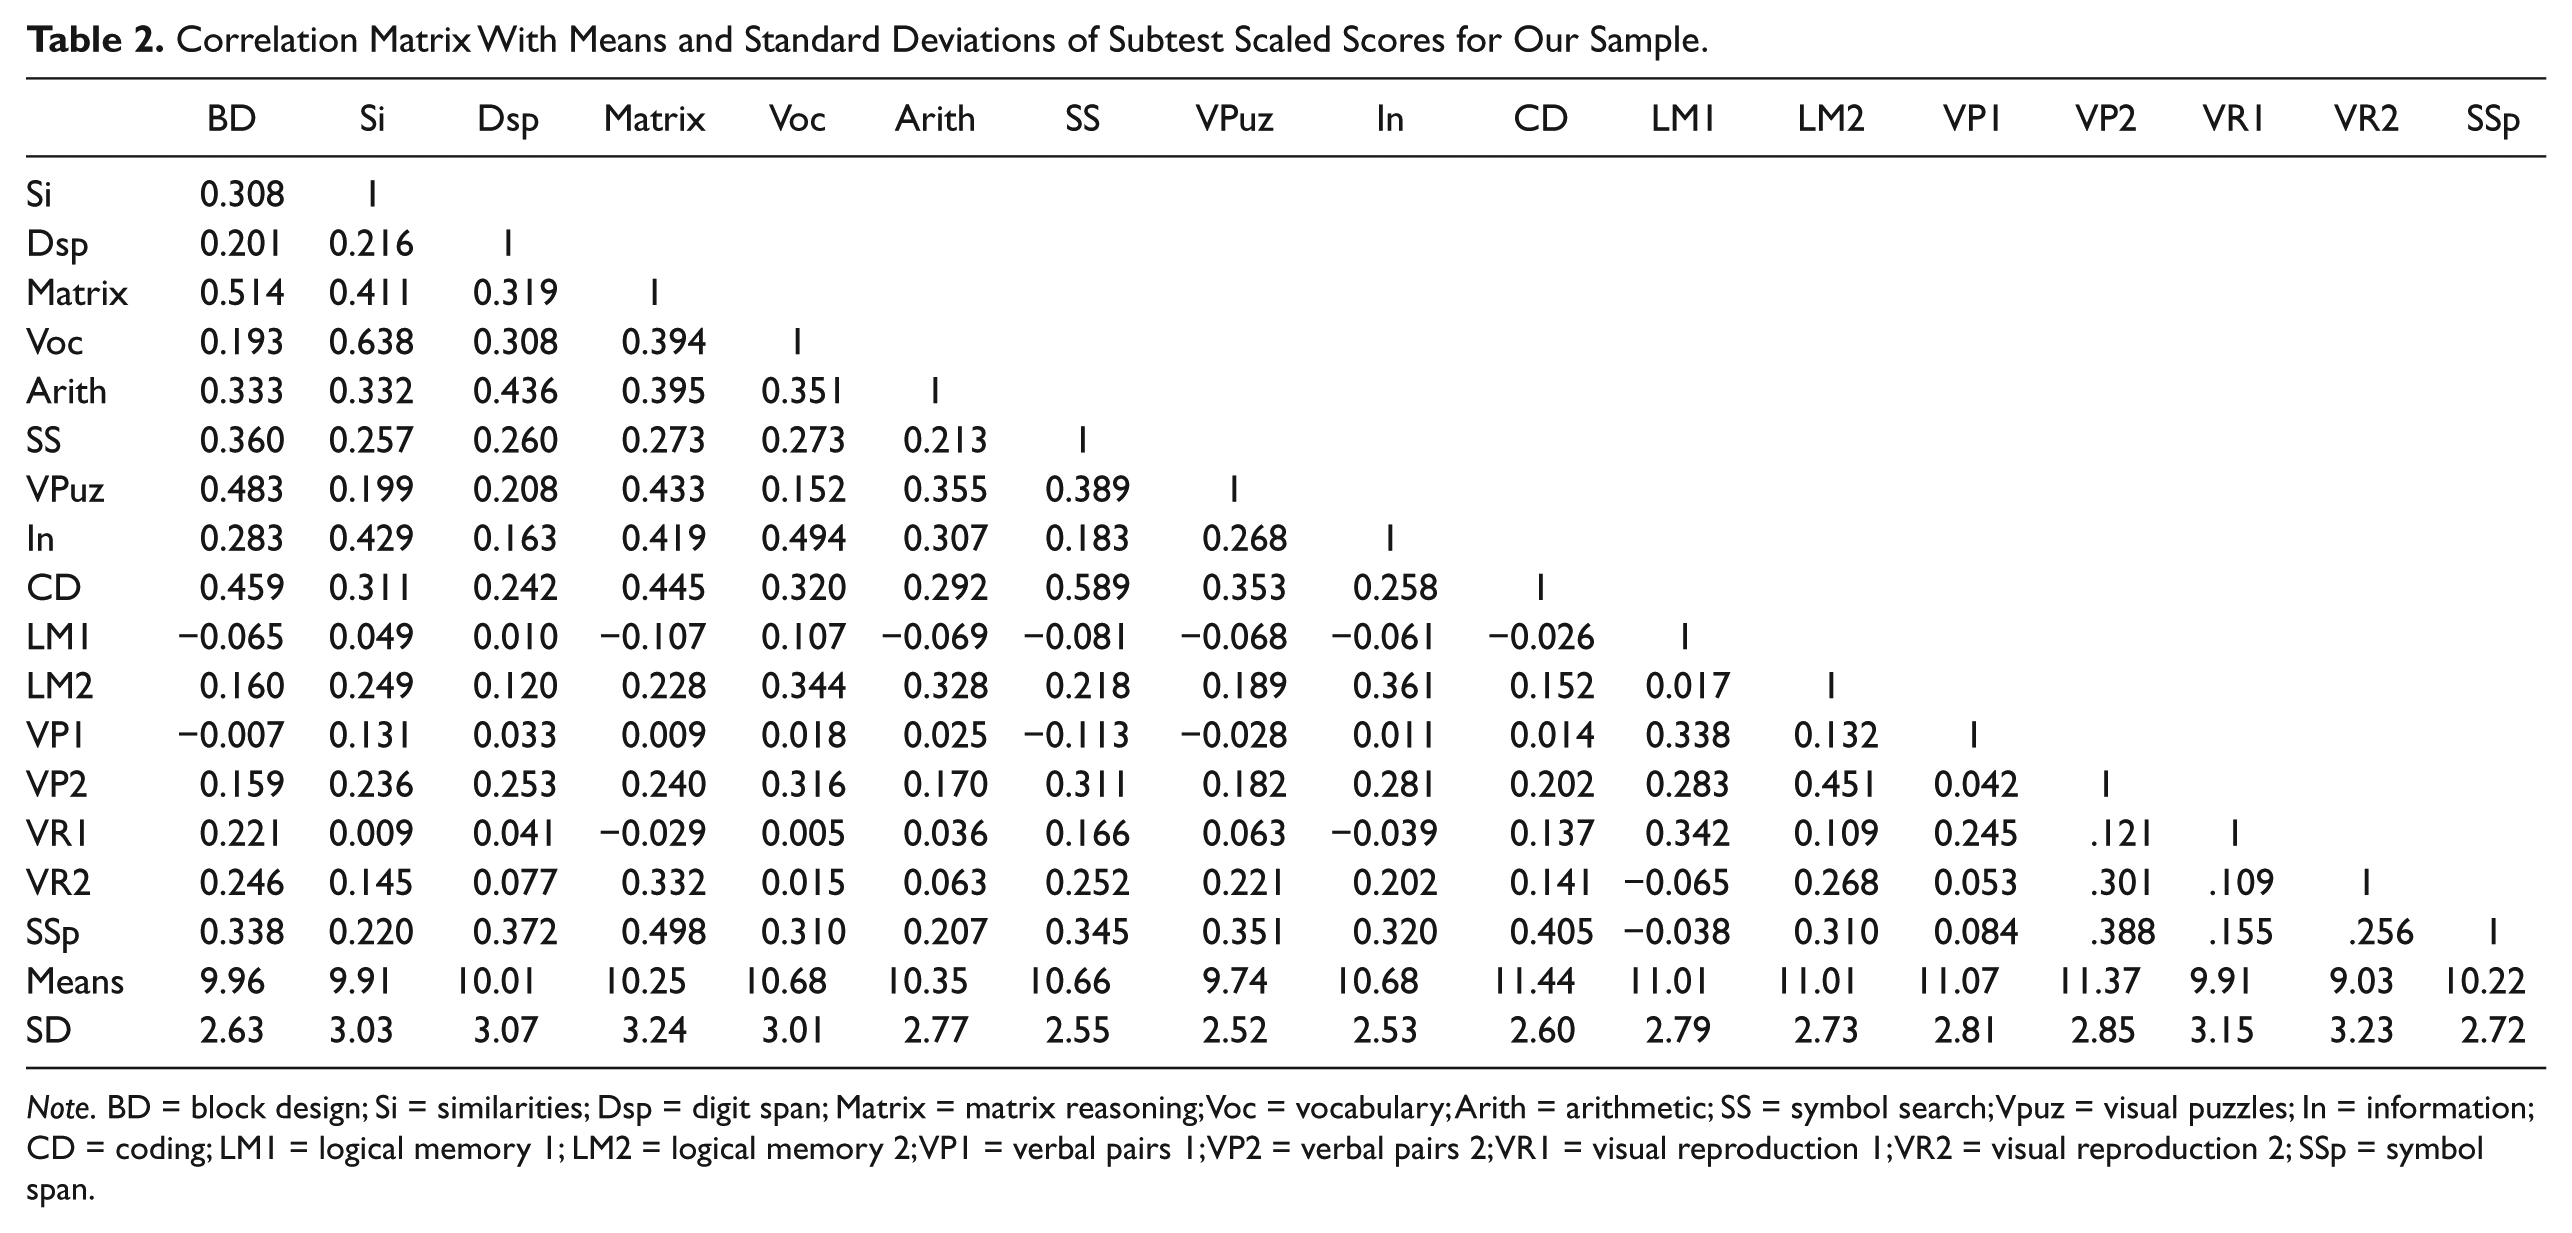
Note. BD = block design; Si = similarities; Dsp = digit span; Matrix = matrix reasoning; Voc = vocabulary; Arith = arithmetic; SS = symbol search; Vpuz = visual puzzles; In = information; CD = coding; LM1 = logical memory 1; LM2 = logical memory 2; VP1 = verbal pairs 1; VP2 = verbal pairs 2; VR1 = visual reproduction 1; VR2 = visual reproduction 2; SSp = symbol span.
Confirmatory Factor Analyses
We used AMOS-18 and AMOS-19 to discover the best fit for our four main a priori specified models. CFA is preferred over exploratory factor analysis when a specific theoretical model exists (Tabachnick & Fidel, 2007).
Invariance Analyses
We used AMOS-19 to test for strong factorial invariance across the two groups by specifying that factor loadings and intercepts to be equal (constraints were imposed on all factor loadings and latent factors in the model.)
Models
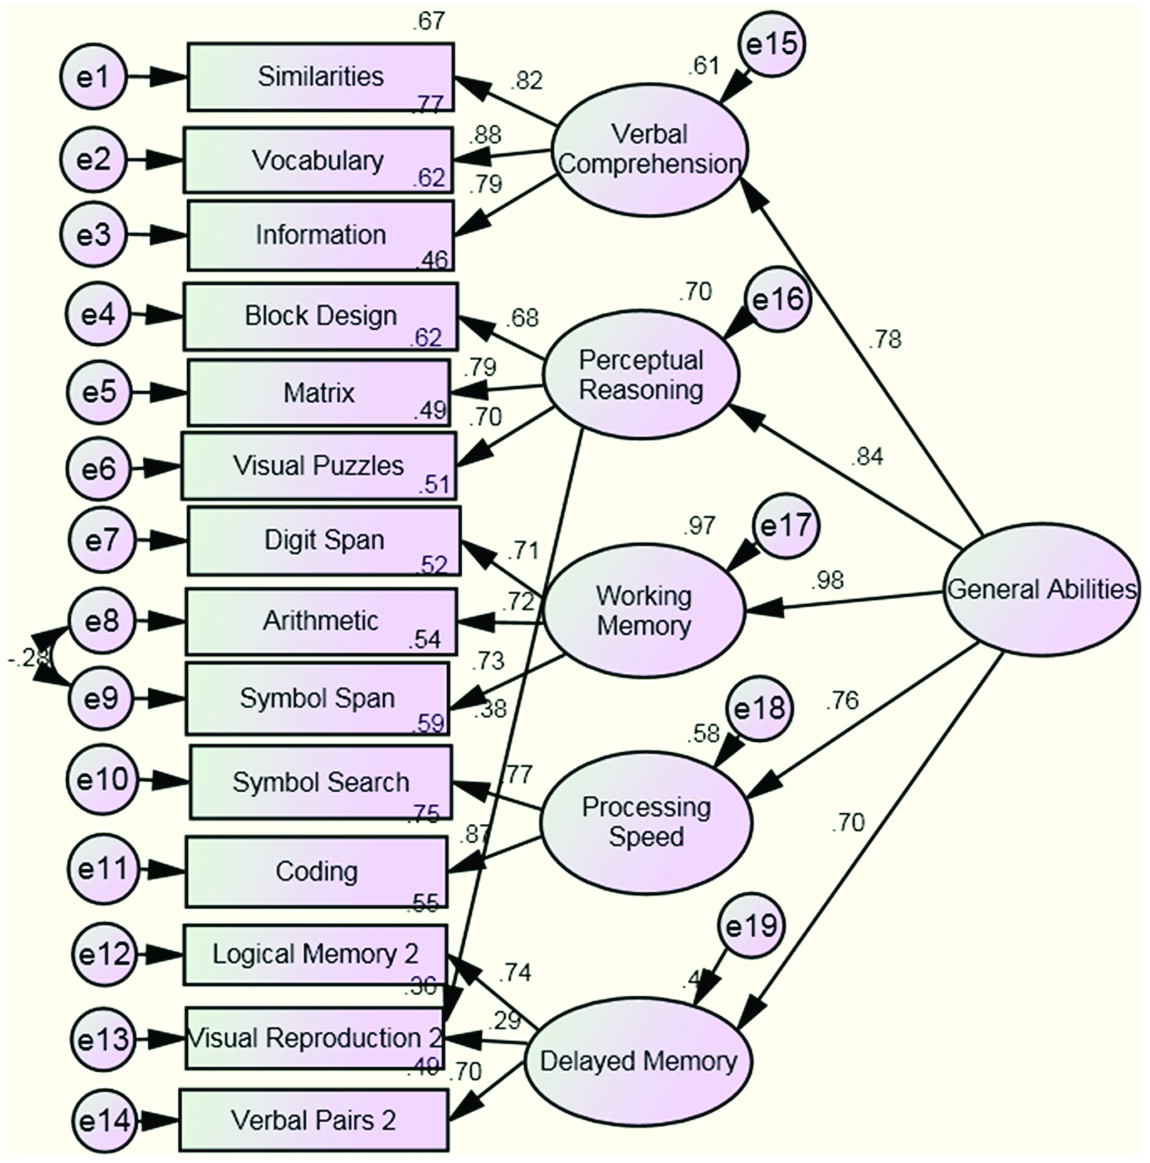
We began by replicating the typical model for WAIS-IV alone, given that the WAIS-IV model is very similar to its previous versions, and has been relatively well accepted. Higher-order models presented below include general ability as an overarching second-order factor, whereas first-order models do not. The typical WAIS model (shown in Figure 1) is a higher-order model (HO WAIS-IV), that includes a second-order general ability factor and first-order verbal comprehension (similarities, vocabulary, and information subtests), perceptual reasoning (block design, matrix reasoning, and visual puzzles subtests), working memory (arithmetic and digit span subtests), and processing speed (coding and symbol search subtests) factors. We also evaluated a first-order model of the WAIS-IV (FO WAIS-IV), which was identical to the higher-order model except that it did not include the second-order general ability factor. We examined the modification indices for potential cross-loading paths that would improve the model fit.
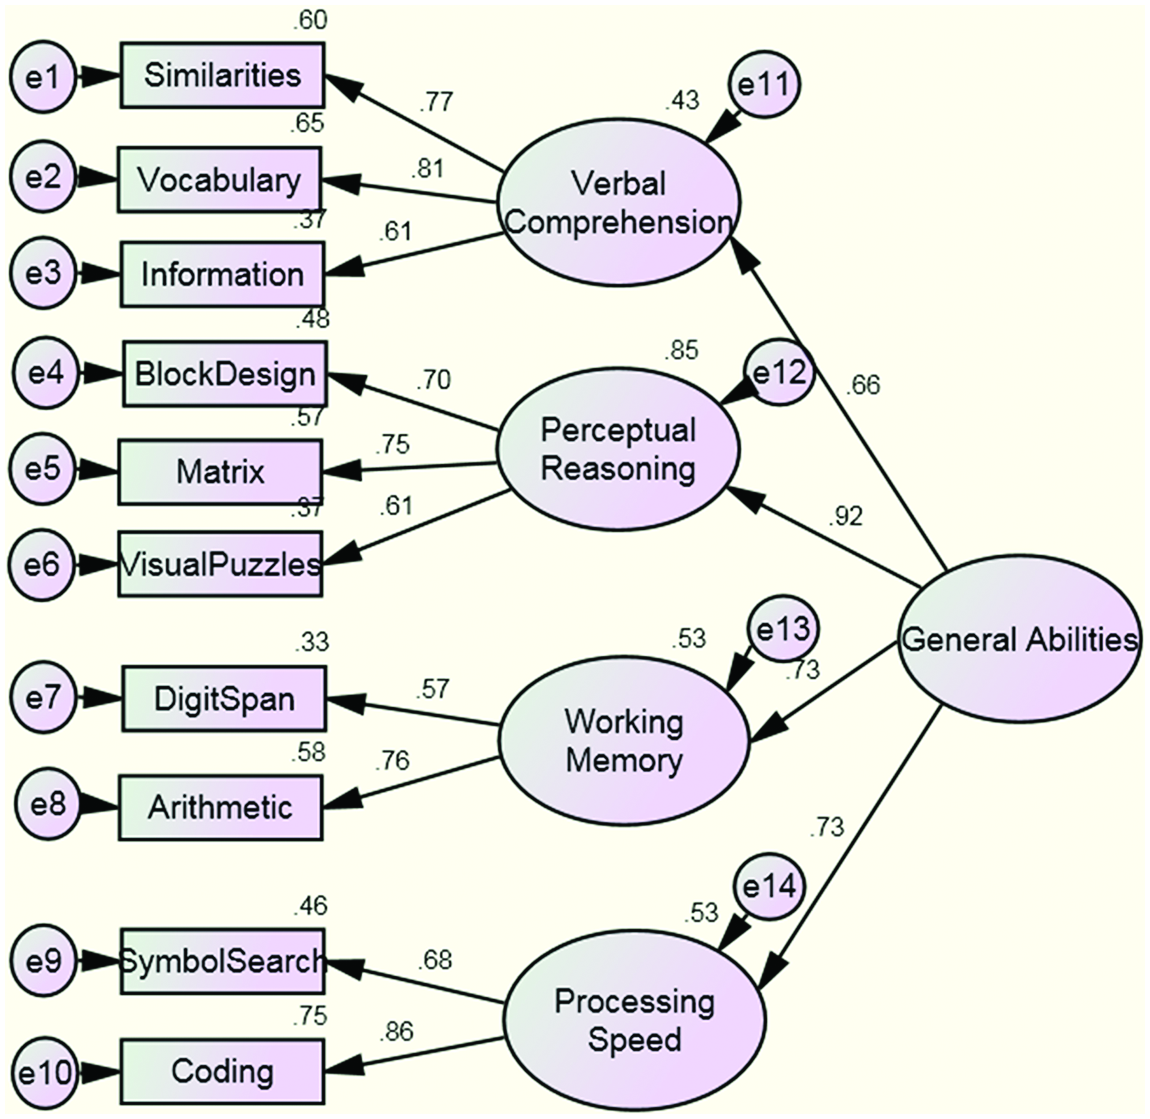
Higher-order model for the WAIS-IV using the present sample.
We then added scores from the WMS-IV to evaluate the best-fitting possible model advanced by Holdnack et al. (2011). First we tested the first-order model, which consisted of the same verbal comprehension, perceptual reasoning, working memory, and processing speed factors as the WAIS-IV only models, but also included the publisher’s delayed memory factor from the WMS-IV (logical memory 2, verbal pairs 2 and visual reproduction 2 subtests) and added the symbol span subtest to the working memory factor. We examined the modification indices for cross-loading paths that would improve the model fit. In addition, we examined whether the cross-loadings described in Holdnack et al. (2011) would also improve the model fit in our models. The variants included freeing up the correlated uniqueness of error terms 8 and 9, which was also kept for all consequent variants (FOa. WAIS/WMS-IV), allowing the arithmetic subtest to cross-load on the verbal comprehension and working memory factors (FOb. WAIS/WMS-IV), allowing the logical memory 2 subtest to cross-load on the delayed memory and the verbal comprehension factors (FOc. WAIS/WMS-IV), allowing the visual reproduction 2 subtest to cross-load on the perceptual reasoning and delayed memory factors (FOd. WAIS/WMS-IV), and allowing the visual reproduction 2 subtest to cross-load on the perceptual reasoning and delayed memory factors and the symbol span subtest to cross-load on the delayed memory and the working memory factors (FOe. WAIS/WMS-IV; see Table 4).
We then evaluated a higher-order model for our sample by adding a second-order general ability factor (HOa WAIS/WMS-IV; shown in Figure 2). This provided information regarding the statistical contribution of the general ability factor to the model fit.
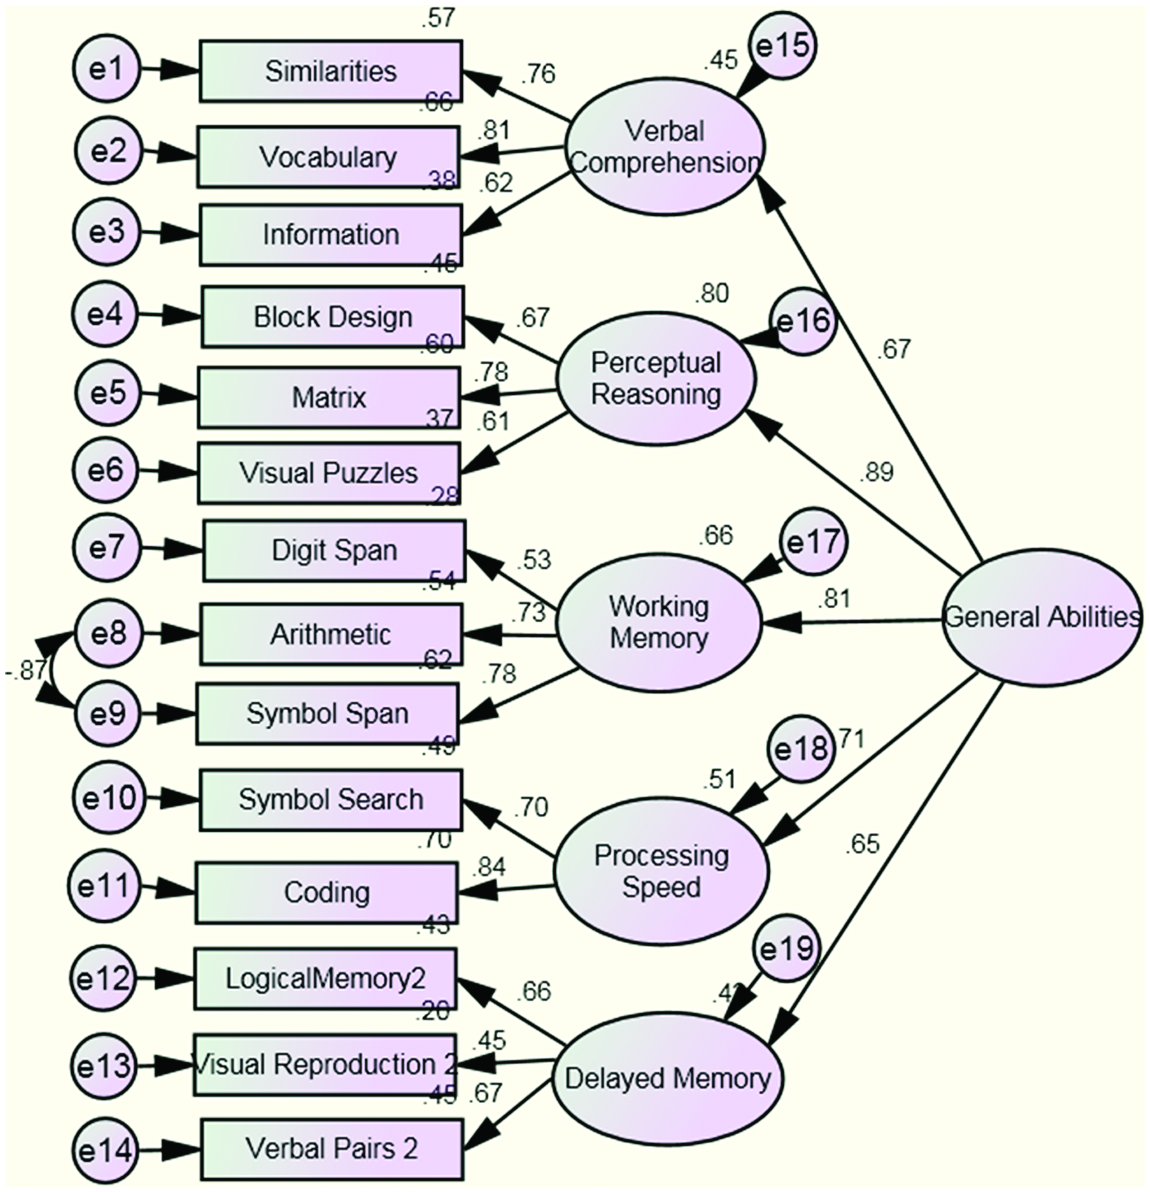
Higher-order model for the combined WAIS-IV and WMS-IV batteries for the present sample.
Next, we conducted the same factor analyses on the normative sample, using the publisher’s data on the 286 older adults who completed both the WAIS-IV and the Older Adult battery of the WMS-IV (see Figure 3).
Higher-order model for the combined WAIS-IV and WMS-IV batteries for the normative sample.
For all models, we used a χ2-test to evaluate goodness of fit (Byrne, 2001). However, because χ2 is potentially over-sensitive to larger sample sizes, we examined additional fit indices (as suggested by (Barrett, 2007; Byrne, 2001): the adjusted goodness-of-fit index (AGFI; Bentler, 1983), root mean squared error of approximation (RMSEA; Steiger, 1990), standardized root mean square residual (SRMR; Bentler & Wu, 1995), Tucker–Lewis nonnormed fit index (TLI; Tucker & Lewis, 1973), comparative fit index (CFI; Bentler, 1990), and Schwarz’s Bayesian information criterion (BIC; Schwartz, 1978). RMSEA indicates the extent of fit between the model and the population covariance matrix under optimal parameter values; adequate fit is indicated by RMSEA values of 0.05 or less. SRMR indicates the match between the observed and implied model covariance matrices; a good fit is indicated by smaller residuals; values less than 0.08 are considered a good fit (Hu & Bentler, 1999; Meade, Johnson, & Braddy, 2008). CFI reflects how well the hypothesized model fits with the independence model where all correlations among variables are zero; a good fit occurs when CFI is 0.95 or higher (Hu & Bentler, 1999). Smaller BIC values are preferred and a difference of more than 10 points in the indices suggests a better model fit (Raftery, 1993).
Results
ANOVA
Our sample’s WAIS-IV and WMS-IV scores are shown in Table 2. For WAIS-IV, a mixed 2 (sample: ours vs. normative) × 10 (subtest) ANOVA yielded no significant main effect of sample (F[1, 743] = 1.91, MSE = 46.47, p = .17), but a significant effect of subtest (F[9, 6687] = 6.50, MSE = 4.63, p < .001), and a significant interaction between sample and subtest (F[9, 6687] = 9.71, MSE = 4.63, p < .001). Post hoc independent t-tests with α Bonferroni corrected to 0.005 indicated that two of our sample’s subtest scores were significantly above the normative means (for all normative WAIS and WMS scaled scores, mean = 10 and SD = 3): Information (t[743] =3.07, p = .002, d = 0.31), and coding (t[743] = 5.10, p < .001, d = 0.49). Our sample’s vocabulary scores were marginally higher than the normative group’s (t[743] =2.78, p =.006, d = 0.26). The Cohen’s d values suggested that the differences between our sample and the normative data were small (on vocabulary and information) to moderate (on coding).
For WMS-IV, a mixed 2 (sample: independent versus normative) × 7 (subtest) ANOVA indicated a main effect of sample (F[1, 642] = 6.29, MSE = 30.33, p = .01), a main effect of subtest (F[6, 3852] = 17.70, MSE = 5.37, p < .001), and a significant interaction between sample and subtest (F[6, 3852] = 16.62, MSE = 5.37, p < 0.001). Post hoc independent t-tests (Bonferroni corrected to 0.007) showed that four of our scores were significantly above the normative mean: logical memory 1 (t[643] =4.05, p < .001, d = 0.38), logical memory 2 (t [643] =2.91, p = .004, d = 0.28), verbal paired associates 1 (t[643] =4.45, p < .001, d = .43), and Verbal Paired Associates 2 (t[643] =4.12, p < .001, d = 0.39); these differences were in the small-to-moderate range. One of our scores was significantly below the normative mean: visual reproduction 2 (t[643] = −4.27, p < .001, d = −0.39).
Correlations
As expected, all correlations among the subtests were positive and almost all were statistically significant (even when we used a stringent alpha level of 0.005, to adjust for multiple correlations), as shown in Table 2. Particularly high correlations occurred between scores that are part of the same index. For example, vocabulary and similarities both load on the verbal comprehension index and yielded r = 0.64, and symbol search and coding both load on the processing speed index and yielded r = 0.59.
Confirmatory Factor Analysis
Examination of the WAIS-IV higher-order and first-order (HO WAIS-IV and FO WAIS-IV) models of our sample data (Figure 1 and Table 3) revealed a similar pattern. The fit statistics for the two models indicated a good fit for both as evident by CFI values close to 1, high TLI values, and RMSEA values close to and lower than 0.50. Evaluation of the modification indexes for both models did not suggest that allowing cross-loadings would significantly improve the model fit. The lower BIC value of the higher-order model was indicative of better fit for the more parsimonious model that included general ability as a second-order factor, thus we preferred the higher-order model.
First-Order and Higher-Order Models for the WAIS-IV Using the Present Sample.
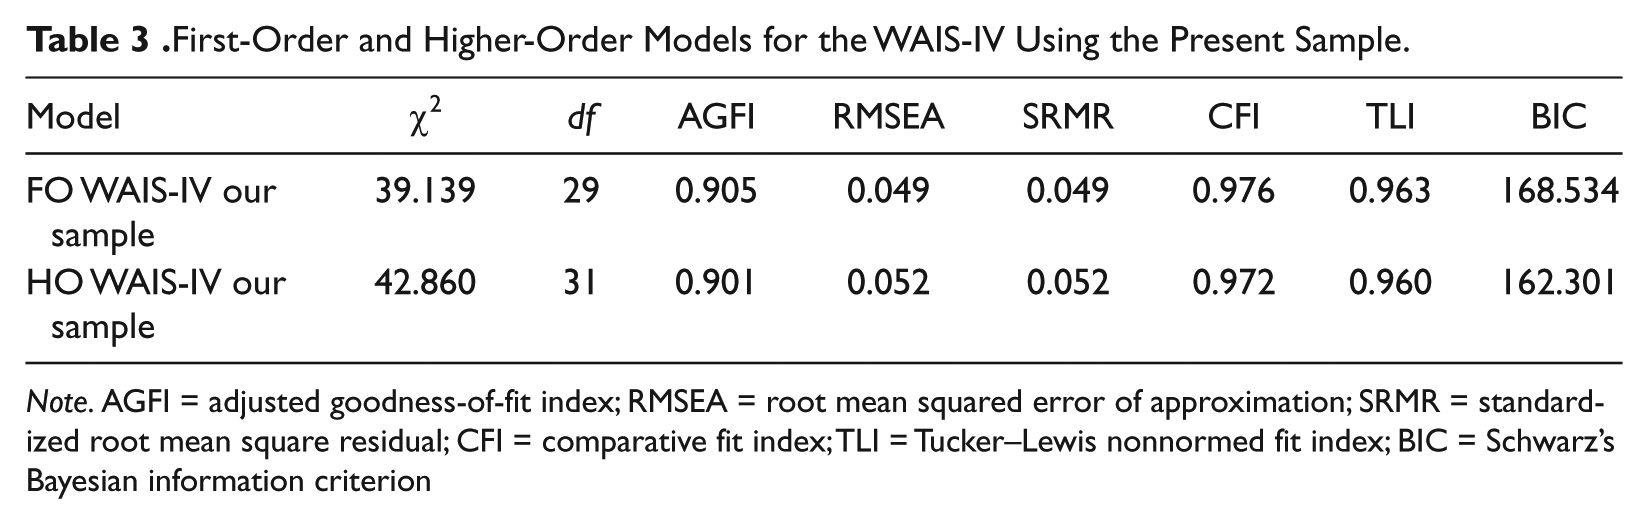
Note. AGFI = adjusted goodness-of-fit index; RMSEA = root mean squared error of approximation; SRMR = standardized root mean square residual; CFI = comparative fit index; TLI = Tucker–Lewis nonnormed fit index; BIC = Schwarz’s Bayesian information criterion
When we examined the combined WAIS-IV/WMS-IV first-order model (Table 4), the fit statistics of the model were less than satisfactory as indicated by CFI and TLI values of less than 0.95, and a RMSEA of 0.077, which was higher than the suggested 0.05 or less. Examination of the fit indices suggested that freeing up the unique variances of two subtests within the same factor (symbol span and arithmetic, which loaded on the working memory factor) would significantly improve the model fit. Freeing up the two unique error variances let to a χ2 reduction of 22 points, df = 1, p < .001, and a higher CFI (0.940), higher TLI (0.917), and lower RMSEA (0.061). In addition, we examined if the cross-loadings described in Holdnack et al. (2011) will also improve the model fit in our models. Only one of the cross-loadings (allowing the visual reproduction subtest to cross-load on the perceptual reasoning and delayed memory factors) had a significant χ2 value, however, the factor loading was small (less than 0.25), thus we did not retain this path in our final model. We then evaluated a higher-order model for our sample by adding a second-order general ability factor (HOa WAIS/WMS-IV; shown in Figure 2). The fit statistics of the two models were comparable, however, similarly to the WAIS-IV only model, the BIC value favoured the more parsimonious higher-order model. Thus, in the end we retained the higher-order model with freed up unique error variances of the arithmetic and symbol span subtests (HOa WAIS/WMS-IV).
First-Order and Higher-Order Models for the WAIS-IV/WMS-IV Using the Present Sample.
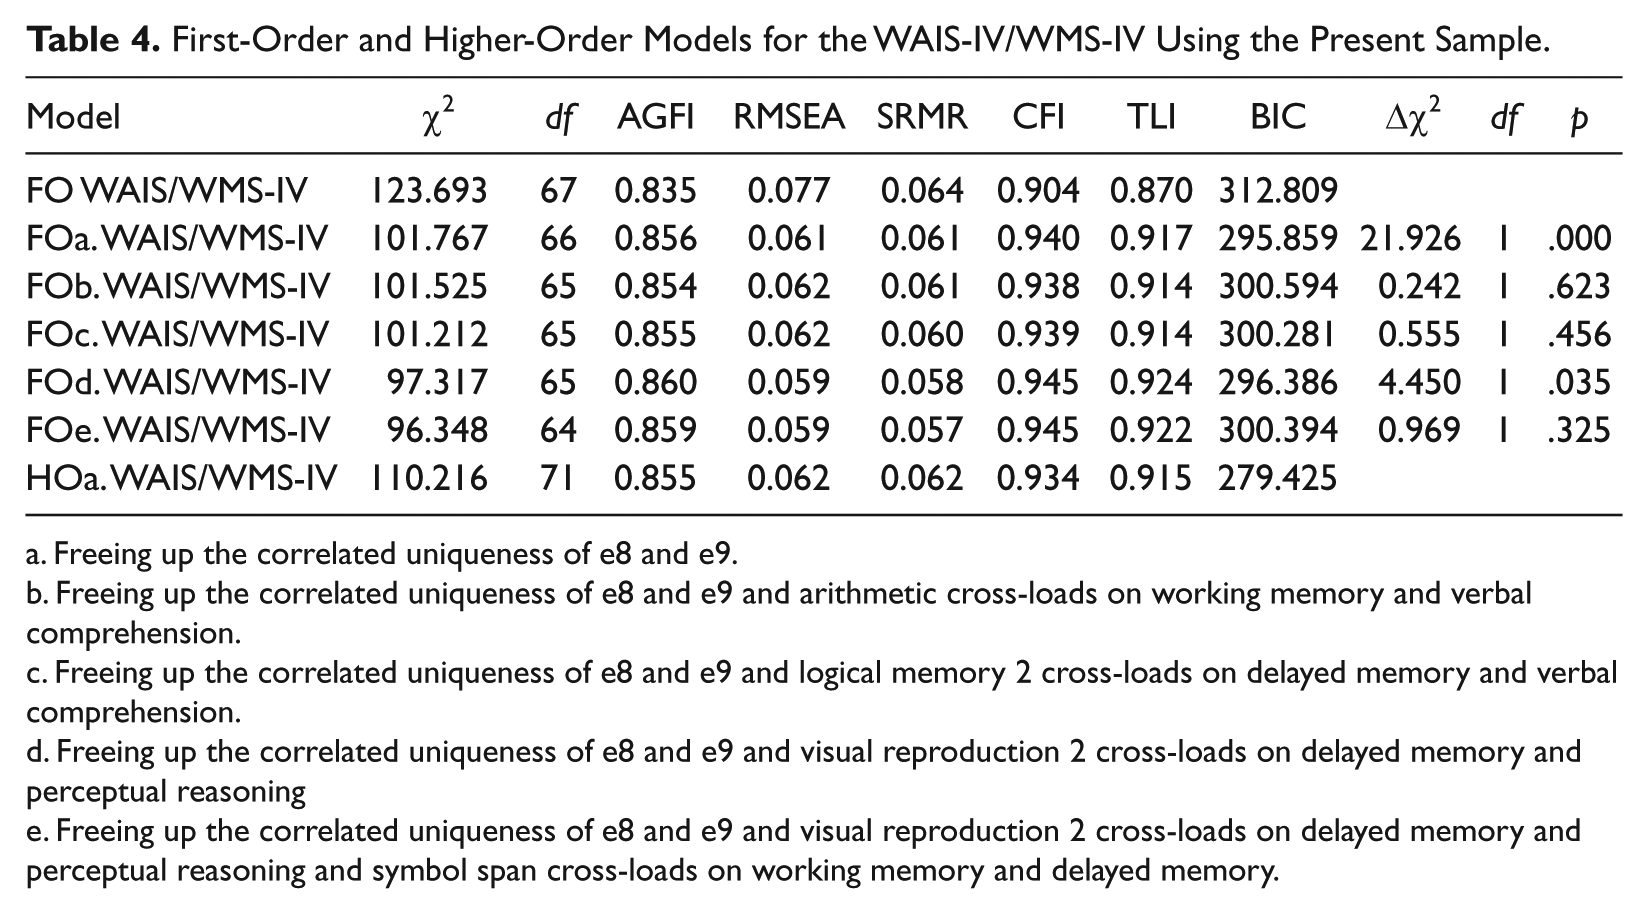
Freeing up the correlated uniqueness of e8 and e9.
Freeing up the correlated uniqueness of e8 and e9 and arithmetic cross-loads on working memory and verbal comprehension.
Freeing up the correlated uniqueness of e8 and e9 and logical memory 2 cross-loads on delayed memory and verbal comprehension.
Freeing up the correlated uniqueness of e8 and e9 and visual reproduction 2 cross-loads on delayed memory and perceptual reasoning
Freeing up the correlated uniqueness of e8 and e9 and visual reproduction 2 cross-loads on delayed memory and perceptual reasoning and symbol span cross-loads on working memory and delayed memory.
Once we had completed the analyses for our sample, we returned to the normative dataset and replicated our initial analyses with it (Figure 3 and Table 5). We found essentially the same patterns in the normative dataset as we found in our sample. That is, freeing up the unique error variances of the same two subtests significantly improved the model fit. In the normative sample model, the same cross-loading path led to a significant χ2 value (allowing the visual reproduction to cross-load on the perceptual reasoning and delayed memory factors). In this model, however, the factor loading was higher (0.38), thus we retained the cross-loading path in the model. Adding the general ability factor as a second-order factor in the model led to a better fitting model as indicated by the lower BIC value. The model that we retained was the higher-order model with freed up unique error variances for the arithmetic and symbol span subtests and a cross-loading of the visual reproduction subtest to the perceptual reasoning and delayed memory factors (HOd. WAIS/WMS-IV normative sample).
First-Order and Higher-Order Models for the WAIS-IV/WMAS-IV Using the Normative Sample.
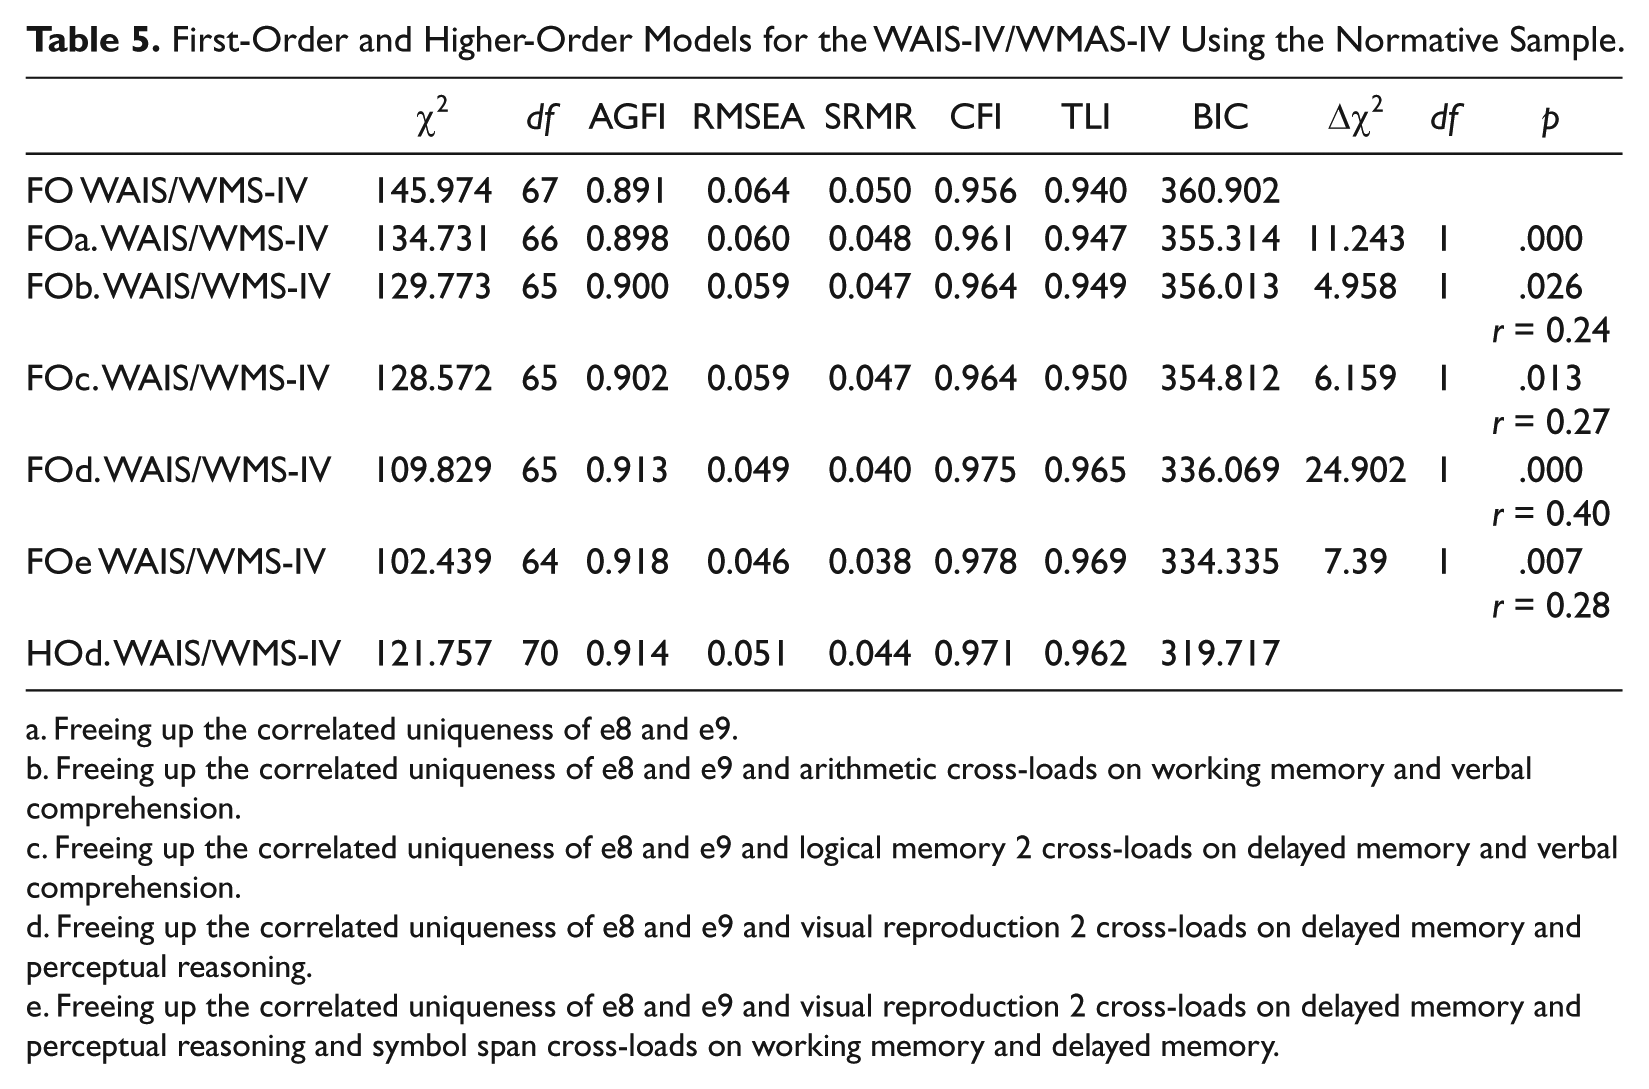
Freeing up the correlated uniqueness of e8 and e9.
Freeing up the correlated uniqueness of e8 and e9 and arithmetic cross-loads on working memory and verbal comprehension.
Freeing up the correlated uniqueness of e8 and e9 and logical memory 2 cross-loads on delayed memory and verbal comprehension.
Freeing up the correlated uniqueness of e8 and e9 and visual reproduction 2 cross-loads on delayed memory and perceptual reasoning.
Freeing up the correlated uniqueness of e8 and e9 and visual reproduction 2 cross-loads on delayed memory and perceptual reasoning and symbol span cross-loads on working memory and delayed memory.
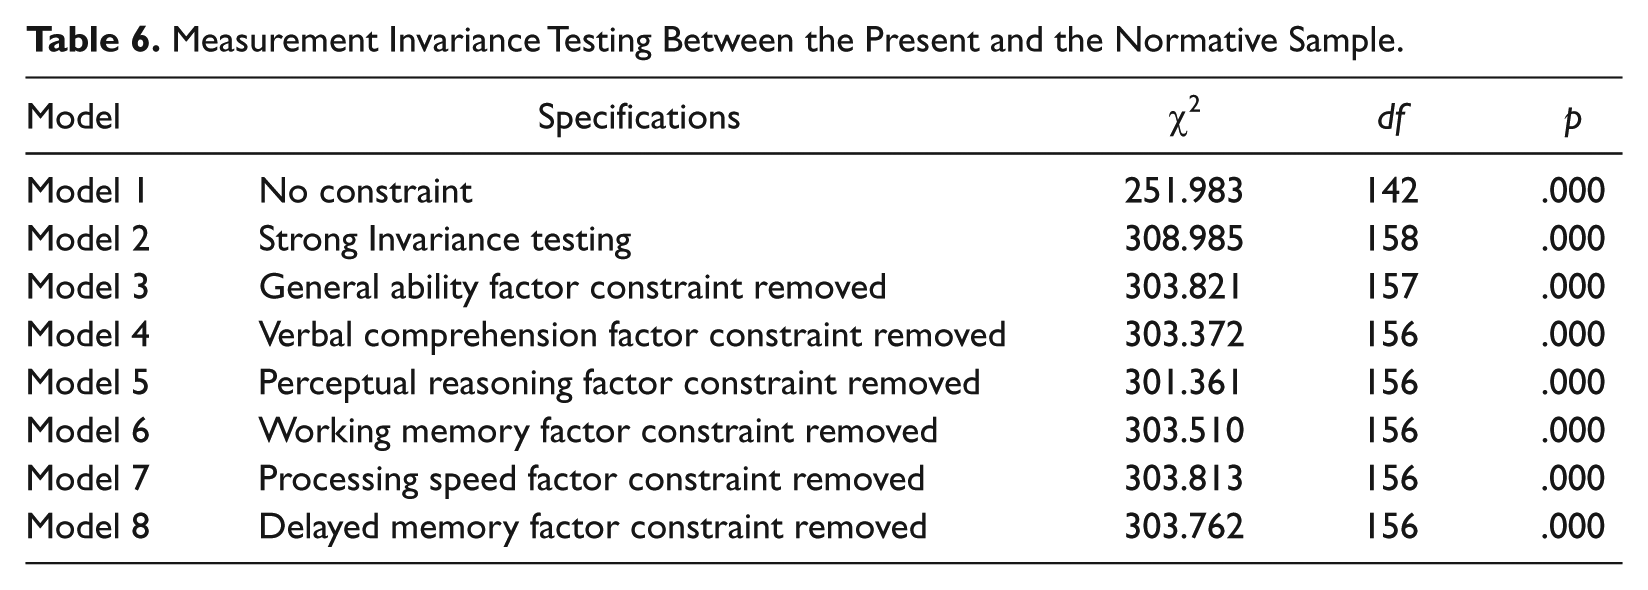
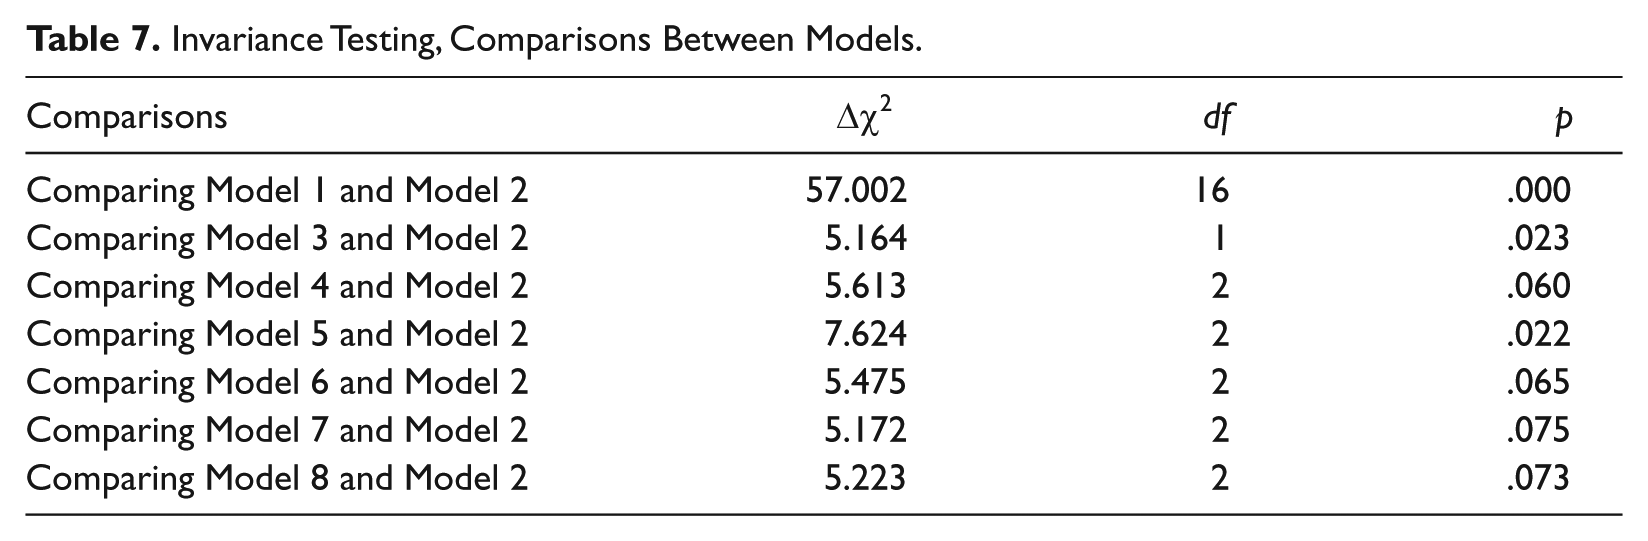
In addition to examining the factor structure of the WAIS-IV and WMS-IV batteries combined in our sample and the normative sample, we conducted analyses of invariance to test the assumption of equal variance across the two samples. We imposed equality of variance constraints on all factor loadings and all latent variables, including the second-order general ability factor (Model 2; see Table 6). The model we used to test the equality of variance assumption was the most parsimonious higher-order model with freed up unique error variances for the arithmetic and symbol span subtests. Results indicated that there was a statistically significant difference between Model 1 (the model with no constraints imposed) and Model 2, Δχ2 = 57.002, df = 16, p < .001, thus we failed to establish strong measurement invariance. Next, we removed the constraints imposed on the second-order general ability factor to evaluate the contribution of the factor to the invariance in the model across the two samples and compared this model to Model 2. Results indicated that there was a statistically significant invariance across the two samples in their scores on the general ability factor, Δχ2 = 5.164, df = 1, p = .023. Next, we systematically evaluated the invariance in the other five factors by removing the equality constraints for one factor at a time (see Table 7). The only other factor for which results were statistically significant was the perceptual reasoning factor, Δχ2 = 7.624, df = 2, p = .022. Thus, we established weak measurement invariance between our sample and the normative sample, but failed to establish strong measurement invariance. The two factors contributing to the invariance in the most constrained model were the general ability factor and the perceptual reasoning factor.
Measurement Invariance Testing Between the Present and the Normative Sample.
Invariance Testing, Comparisons Between Models.
Discussion
We collected independent evidence on the new WAIS-IV and WMS-IV for older adults. Our scaled scores for the WAIS-IV and WMS-IV subtests were relatively close to the published norms, albeit slightly higher. This finding is similar to many previous studies bringing community members into a university for testing (e.g., Glisky, Rubin, & Davidson, 2001; Salthouse, 2010; Soubelet & Salthouse, 2011; Tucker-Drob, 2011). We had a slightly younger, more highly educated sample than the WAIS and WMS normative groups. The largest differences between our sample and the normative one were for coding (d = 0.49) and verbal paired associates 1 (d = 0.43), but these were still only approximately half a standard deviation in size. Note too that our mean scaled scores were not always above the norm: visual reproduction 2 was significantly below the normative mean.
Our best-fitting models were very similar to the ones previously published in young and middle-aged people from the normative sample (Holdnack et al., 2011). This was the case even though we had to omit the designs and spatial addition WMS-IV subtests used by those authors, because those subtests are not part of the WMS-IV Older Adult battery. In addition, the freeing of the same unique error variance led to a significant improvement in the model fit in our sample and the normative sample. Once we had ascertained the best-fitting model for our data, we found that it also fit well with the normative data.
Thus, even though cognition declines with age (especially in memory and processing speed), the interrelations among the factors that make up the WAIS-IV and WMS-IV appear to remain relatively stable in aging. Consistent with this idea, Salthouse and Saklofske (2010) reported that the factor structure of the WAIS-IV normative sample data was similar in younger and older adults (e.g., see also (Bowden, Weiss, Holdnack, & Lloyd, 2006).
We were able to establish weak measurement invariance between our sample and the normative sample, indicating that the factor loading variances remained the same across the two samples. However, we failed to establish strong measurement invariance; the two factors contributing to the variability across the two samples were general ability and perceptual reasoning. This finding makes clear the need for new, independent samples to be collected and compared against the normative one.
Future Work
The present study is the first to independently examine the factor structure of the combined WAIS-IV and WMS-IV Older Adult batteries. In future work, along with further replication of the aging findings in new datasets, we must also examine performance in dementia as well as in other (e.g., developmental and psychiatric) disorders. When constructing the new norms, the publisher screened out possibly impaired participants using a new brief cognitive status test. The publisher also provides normative data from people with Alzheimer’s disease and mild cognitive impairment, but these need to be supplemented by researchers in the field. For instance, only 36 people with MCI (collapsed across subtype) were administered the Older Adult WMS-IV (Wechsler, 2009). Arguably the best strategy would be to follow cognitively normal and mildly impaired participants for a few years and then retroactively exclude those who end up showing signs of dementia. Of course, very few studies do this, for reasons of feasibility.
Finally, further theoretical and empirical work is needed on WAIS-IV and WMS-IV. On a theoretical level, although both the WAIS and WMS have evolved to better conform to current theories of intelligence, cognition, and neuropsychology (Coalson et al., 2010; Drozdick, Wahlstrom, Zhu, & Weiss, 2012; Kaufman, 2010), in particular the WAIS remains the focus of considerable controversy. For example, many researchers have argued that the WAIS is better described by the Cattell–Horn–Carroll theory than by the model outlined in the Wechsler manual (e.g., Benson et al., 2010; Ward, Bergman, & Hebert, 2012); for a review, see (McGrew, 2009), but there is still disagreement over this issue, and competing theories and measures of intelligence exist (e.g., Reynolds & Kamphaus, 2003).
On an empirical level, our confirmatory analyses were guided by Holdnak et al. (2011), but we needed to make adjustments to our models because the WMS-IV Older Adult battery does not include two of the subtests used in the general WMS-IV battery that Holdnack et al. used in their study. Thus, we could not test all their possible models. Thus, future work using both the Older Adult and the standard WMS-IV battery is potentially fruitful. Not only confirmatory, but also further exploratory factor analyses (especially with cognitively-impaired groups) will likely be useful. Exploratory factor analyses have yielded several interesting findings with previous editions of the WAIS and WMS (e.g. Bowden et al., 1999; Bowden et al., 2001; Burton, Ryan, Axelrod, Schellenberger, & Richards, 2003; Millis, Malina, Bowers, & Ricker, 1999; Price, Tulsky, Millis, & Weiss, 2002; Tulsky & Price, 2003), and it is likely that such work with the new versions will too.
Footnotes
Declaration of Conflicting Interests
The authors declared no potential conflicts of interest with respect to the research, authorship, and/or publication of this article.
Funding
The authors disclosed receipt of the following financial support for the research, authorship, and/or publication of this article: This work was supported by grants from the Natural Sciences and Engineering Research Council of Canada (D. M., P. D., C.M.).