
Abstract
This study assesses the ability of a brief screening form, the Behavioral and Emotional Screening System–Student Form (BESS-SF), to predict scores on the much longer form from which it was derived: the Behavior Assessment System for Children–Second Edition Self-Report of Personality–Child Form (BASC-2-SRP-C). The present study replicates a former study included in the BESS manual with an entirely new sample. Participants included 252 students from a large, urban, Southwestern U.S. city school district in the third through fifth grades. The sample’s ethnic majority was Hispanic (81.7%). Results revealed high specificity and negative predictive values between the screener and omnibus form, suggesting a child who identifies as not “at-risk” on the BESS-SF will likely identify as not “at-risk” on the BASC-2-SRP-C domains. These results effectively replicate the previous findings with a new sample of largely Hispanic (Latino/a) students from a large urban school district.
According to the Centers for Disease Control and Prevention (2013, p. 1), “A total of 13%–20% of children living in the United States experience a mental disorder in a given year, and surveillance during 1994–2011 has shown the prevalence of these conditions to be increasing.” However, the U.S. Public Health Service (2000) documented only 20% of children living with mental health disorders are properly identified and provided with mental health services. These disparities are often exaggerated in minority populations, and Hispanic youth are no exception.
Regarding population subgroups, the U.S. Department of Health and Human Services (2001) revealed Hispanic youth had similar rates of mental health problems as White youth, but utilized services at half the rate. Furthermore, data showed 84% of children with parents born in the United States were insured, whereas only 47% of Latino/a or Hispanic children with immigrant parents were insured, potentially limiting their access to services in their community. Criteria for clinical diagnoses also fail to account for cultural norms, which might prevent individuals with problematic symptoms from receiving a diagnosis, or increase their chance of being misdiagnosed (Dowdy, Dever, DiStefano, & Chin, 2011; U.S. Department of Health and Human Services, 2001). Thus, mental health screening research with Latino/a children represents an inquiry area of particular need.
The scientific community and policy sectors support mental health screening practice as a means of detecting, preventing, and addressing emotional and behavioral problems in children (Cook, Volpe, & Livanis, 2010; Feeney-Kettler, Kratochwill, Kaiser, Hemmeter, & Kettler, 2010; Kamphaus et al., 2007; Lane et al., 2011; President’s New Freedom Commission on Mental Health, 2003; U.S. Department of Health and Human Services, 2005). In particular, a desirable goal of screening programs involves detecting early disorder symptoms via demonstrations of emotional and behavioral risk (National Research Council and Institute of Medicine, 2009).
Correctly identifying individuals in an educational setting in need of specific instruction and services requires using universal screening tools that are contextually appropriate, technically sound, and efficient. A predominant sign of a screening instrument’s technical adequacy lies in the predictive validity of its scores (Glover & Albers, 2007), the extent to which a score on the screener predicts an individual’s score on a more comprehensive measure.
The Behavioral and Emotional Screening System (BESS) screener and the comprehensive Behavior Assessment System for Children–Second Edition (BASC-2) are two social-emotional assessment tools commonly used in U.S. schools, including the large urban district utilized for this investigation. The BESS and BASC-2 each have separate forms for teacher, parent, and student responses. The BASC-2 and BESS manuals provide initial findings on the predictive validity of the scores from these measures, and their ability to correctly identify individuals with social, emotional, and behavioral problems (Kamphaus & Reynolds, 2007; Reynolds & Kamphaus, 2004). For the self-report versions of each, the manual reports that Pearson product–moment correlation values between the BESS–Student Form (SF) and the Child and Adolescent forms of the BASC-2 Self-Report of Personality (SRP) composite scores ranged from .70 to .86. Regarding the measures’ classification accuracy for students from screener to comprehensive measure scores, the BESS manual reports sensitivity values ranged from .52 to .66; specificity from .93 to .95; positive predictive values (PPV) from .59 to .72; and negative predictive values (NPV) from .91 to .91.
This study served the purpose of replicating findings from the norming study with a subpopulation of students not heavily represented in the norming sample. If the BESS-SF and BASC-2 SRP are to be used in school populations, it is important that research resembles the demographics of all school sub-populations commonly found in U.S. schools, particularly the urban schools that enroll the majority of American students. Furthermore, renewed interest in conducting replication studies exists because they can account for study imperfections, sampling error, lack of internal validity, control for fraud, generalization, and verification of prior study’s hypotheses (Hunter, 2001; Schmidt, 2009). To date, no other replication studies have assessed the predictive ability of BESS-SF with respect to the BASC-2 SRP.
Method
Sample
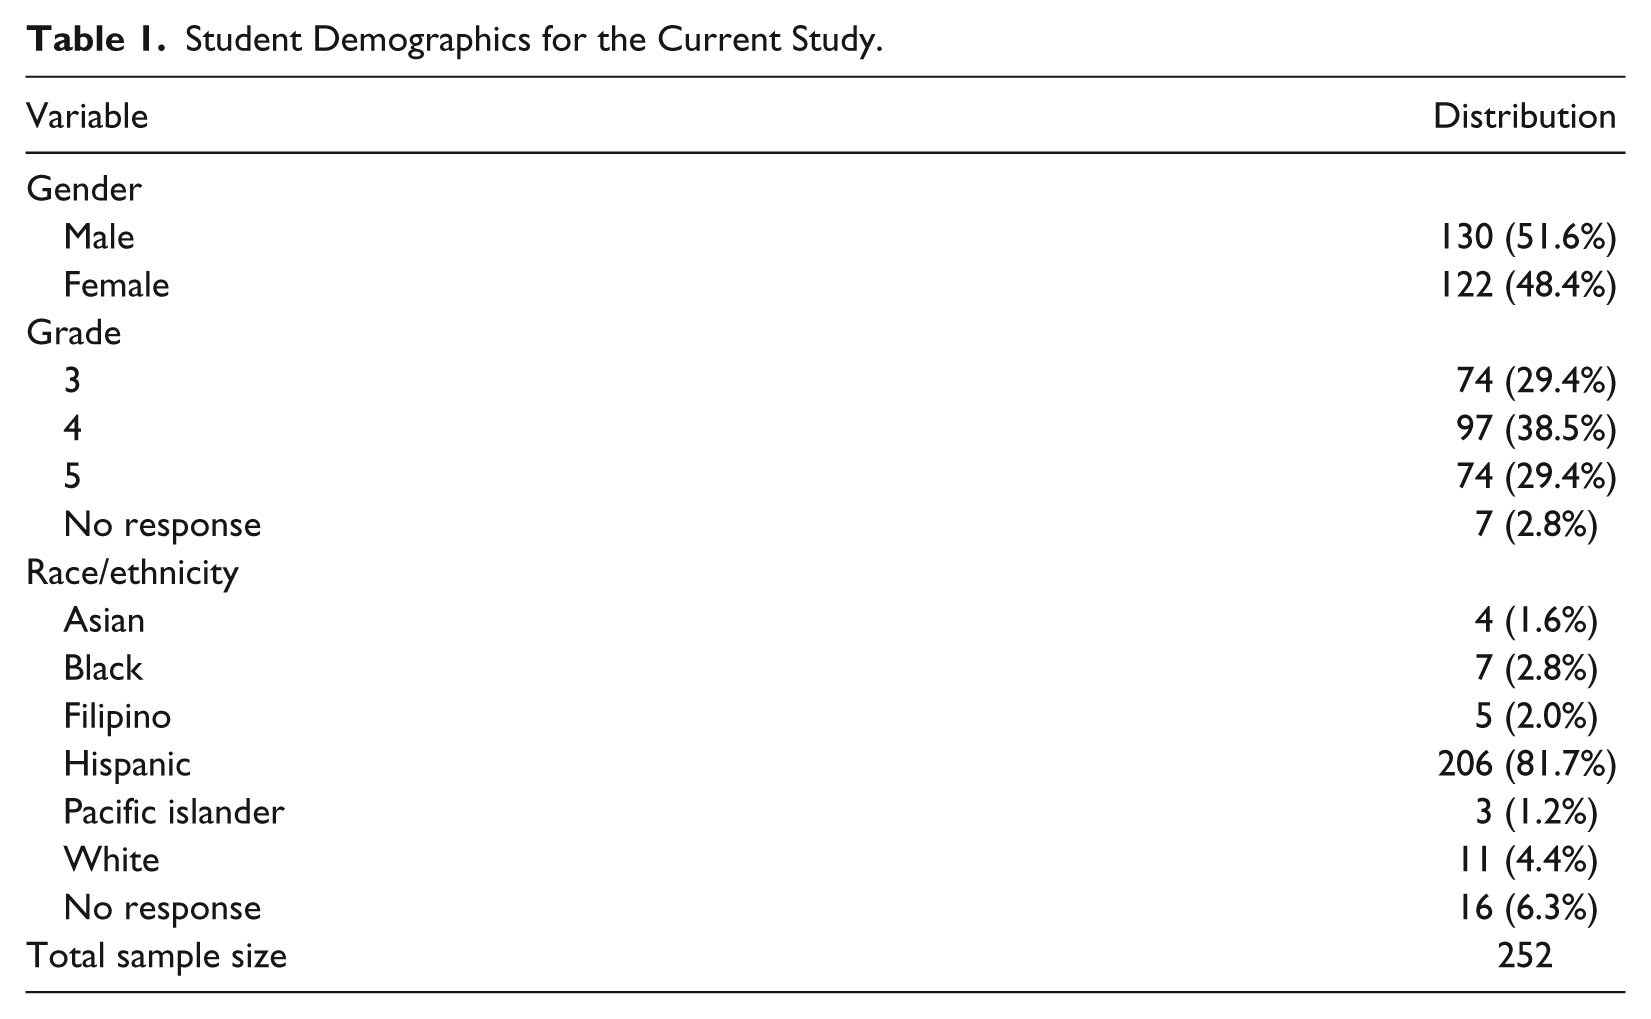
The sample was part of a larger research study, Advancing Children’s and Teacher’s Success through Early Screening and Intervention through the Institute of Education Sciences of the U.S. Department of Education (Grant R324B060005 to R.W. Kamphaus and C. DiStefano). This larger study examined the longitudinal validity of the scores from universal screening measures. Participants in this analysis included 252 students, in third through fifth grade, from a Southwestern U.S. urban school district. Table 1 presents demographic information. There were slightly more males (51.6%) than females (48.4%) in the study. The ethnic majority was Hispanic (81.7%), which mirrors the demographics of the region. This proportion, however, varies greatly from the proportion in the original norming sample of the BASC-2 and BESS. Students with emotional and behavioral disorders were not overly represented in this sample, due to their lack of inclusion in classrooms with their typically developing third- through fifth-grade peers. For our analysis, the final sample included 252 students who completed both the BESS screener and the comprehensive BASC-2, 250 of whom completed every question on both measures. Three students skipped several questions on different BASC-2-SRP-C composite scales, resulting in a lack of composite scores and their exclusion from parts of the analyses. Specifically, one student did not have a School Problems composite score, the second did not have an Internalizing Problems score, and the third was missing composite scores for Internalizing Problems and the Emotional Symptoms Index.
Student Demographics for the Current Study.
Procedure
Participants for this study were randomly selected from Grades 3, 4, and 5 from 20 elementary schools. No more than four students (two males, two females) per classroom were selected for participation. Project coordinators obtained informed parental consent as well as student assent for each participant; and students were given approximately US $10-worth of books in exchange for their participation. Researchers accessed school records to obtain student demographic information, where students were classified as English or Limited English Proficiency (LEP). Local site coordinators reported that roughly 30% of parents declined to give consent for their child to participate, and less than 1% of students declined to give assent. Demographic information was not collected on students whose parents declined study participation.
Measures
BASC-2 SRP
The BASC-2 SRP is designed to measure an individual’s self-perceived personality, affect, and attitude (Reynolds & Kamphaus, 2004). The BASC-2 SRP measures five domains including: Inattention/Hyperactivity, Internalizing Problems, Personal Adjustment, School Problems, and the Emotional Symptoms Index. BASC-2 SRP administration takes children approximately 20 to 30 min to complete, requires minimal professional training, uses computer-generated scoring, and is available in both English and Spanish.
Although the BASC-2 SRP is available for ages 8 to 25 years old, the current study only used the Child Form for 8- to 11-year-olds (Reynolds & Kamphaus, 2004). The BASC-2-SRP-C includes 139 items regarding children’s thoughts and feelings. The form requires children to indicate the perceived frequency with which they think, feel or act, with individual responses depicted through either 4-point Likert-type scale (never, sometimes, often, and almost always) or a dichotomous (true/false) scale. These answers are summed into raw scores that are converted to normed T-scores (M = 50, SD = 10). For the BASC-2 SRP, T-scores have ranges that reflect the level of adjustment associated with the individual. For the four clinical domains (Internalizing Problems, Inattention/Hyperactivity, School Problems, and the Emotional Symptoms Index), the higher the T-score, the more “at-risk” one is for problems. Specifically, T-scores of 59 and below imply normal displays of risk, whereas scores from 60 to 69 are considered “at-risk”; and a score 70 or higher implies clinically significant risk. For the purpose of this predictive validity study, scores depicting normal displays of risk (59 and below) indicate negative results, whereas scores depicting higher than normal displays of risk, in the “at-risk” and clinically significant range (60 and higher) indicate positive results. The results of numerous receiver operating characteristic (ROC) cut score analyses revealed the most optimal cut scores were similar to the demarcations at one and two standard deviations above the mean (DiStefano & Morgan, 2011). Thus, as the ROC analyses results vary by sample, the cut scores selections based on standard deviation units seemed like a reasonable starting point for identifying risk. The BASC-2 SRP scores demonstrate practical psychometric properties with internal consistency reliability values ranging from .85 to .96, and adjusted test score stability values ranging from .75 to .80.
BESS-SF
The BASC-2 BESS-SF is a 30-item screening tool used to measure levels of self-reported risk by youth for behavioral and emotional problems (Kamphaus & Reynolds, 2007). As an abbreviated version of the BASC-2 SRP, the BESS-SF intends to measure four domains found in the BASC-2 SRP: Internalizing Problems (10 items), Inattention/Hyperactivity (5 items), Personal Adjustment (9 items), and School Problems (6 items; Dowdy, Dever, et al., 2011). Only the BESS-SF total T-score is available as an indicator of mental health risk; separate scores for the four domains are not offered due to limited included items for two of the factors (Dowdy, Twyford, et al., 2011). Ultimately, the BESS-SF detects any presence of risk, whereas the BASC-2 SRP clarifies the kind of risk an individual experiences. The BESS-SF requires minimal informant training, takes less than 5 min to complete, and has forms available for Spanish and English speakers.
The BESS-SF was normed for students in Grades 3 through 12. Similar to the BASC-2 SRP, the BESS-SF uses a 4-point Likert-type scale and normed T-score derivation. However, BESS classifications have slightly different T-score cut points than the BASC-2 SRP, where T-scores ranging from 20 to 60, suggest a normal level of risk, while 61 to 70 suggests an elevated level of risk, and scores of 71 or higher suggest an extremely elevated level of risk. The BESS-SF scores exhibit a split-half reliability range through the Spearman–Brown formula (.90-.96) and test score stability range (.80-.91) (Dowdy, Twyford, et al., 2011).
The BESS-SF moderately correlates with other emotional and behavioral problem measures including the Achenbach System of Empirically Based Assessment Youth Self-Report (Achenbach & Rescorla, 2001), The Revised Children’s Manifest Anxiety Scale (Reynolds & Richmond, 1985/2000), Children’s Depression Inventory (Kovacs, 2001), and Conners Rating Scales (Conners, 1997; Dowdy, Twyford, et al., 2011).
Statistical Analyses
Two separate data sets were used from the same sample: one containing student scores on the BESS-SF and one containing student scores on the BASC-2-SRP-C. To conduct the analyses necessary to examine predictive validity of the BESS scores, the two data sets were merged in SPSS using the project identification number for each individual research participant’s student-report form. Indicator variables were created to classify students as having an “at-risk” T-score, treated as the “positive” outcome in this study. “At-risk” scores included a BESS-SF T-score at or above 61 or a BASC-2-SRP-C clinical scale T-score at or above 60 (Kamphaus & Reynolds, 2007). Correlation coefficients between the BESS-SF T-score and the clinical scales of the BASC-2-SRP-C were calculated to gauge how well their similar constructs aligned with each other. A cross-tabulation analysis was run on each BASC-2-SRP-C clinical scale composite score, using the BESS-SF T-score as the predictor of the respective BASC-2-SRP-C composite score. The resulting output was used to calculate specificity, sensitivity, NPV, and PPV.
In Figure 1, Box A refers to the number of cases correctly identified as “at-risk” in both the predicting (BESS-SF) and outcome (BASC-2-SRP-C) measures. This is known as a “True Positive,” where an individual is accurately identified as “at-risk.” Box B refers to the number of cases identified as “at-risk” on the predicting measure (BESS-SF) and not on the outcome (BASC-2-SRP-C) measure. This is known as a “False Positive,” when an individual is reported as “at-risk,” but in actuality is not. Box C refers to the number of cases that were identified as “at-risk” by the predicting measure (BESS-SF), but identified as “at-risk” by the outcome measure (BASC-2-SRP-C). This is known as a “False Negative,” where an individual is not identified as “at-risk,” but further evaluation detects “at-risk” characteristics. Box D refers to the number of cases that were not indicated on either the predicting (BESS-SF) or the outcome (BASC-2-SRP-C) measures. This is known as a “True Negative,” where an individual is not shown to be “at-risk” on either the predictive (BESS-SF) or outcome (BASC-2-SRP-C) measure.
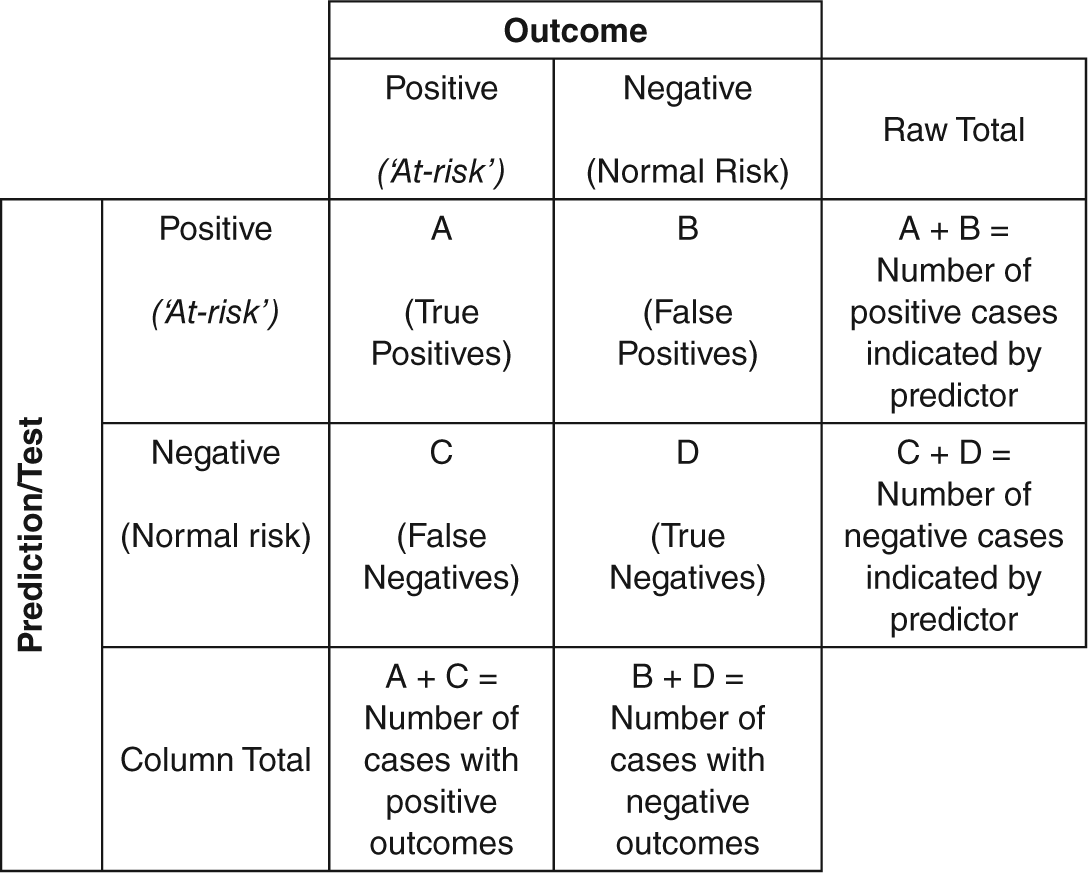
Summary of relationships between predictors and outcomes.
Sensitivity and PPV
Sensitivity is the probability of a predictor showing a True Positive, as identified in Figure 1. Sensitivity calculations involve dividing the frequency of True Positives by the total number of positives yielded by the outcome measure (A/[A + C]). PPV is a similar construct to sensitivity. This is calculated by dividing the number of True Positives by the total number of positives yielded by the predictive measure (A/[A + B]).
Specificity and NPV
Specificity is the probability of a predictor showing a True Negative, also identified in Figure 1. Specificity is calculated by dividing the frequency of True Negatives by the total number of negatives yielded by the outcome measure (D/[B + D]). Just as PPV relates to sensitivity, NPV relates to specificity. This is calculated by dividing the number of True Negatives by the total number of negatives yielded by the predictive measure (D/[C + D]).
Results
Correlation Analysis
The relationship between the total BESS-SF T-score and the composite scores for each domain of the BASC-2-SRP-C was investigated using Pearson product–moment correlation coefficients. All correlations were greater than .69 and were significant at the .01 level of significance (Table 2). Thus, each BASC-2-SRP-C composite score had a strong, positive linear relationship with the BESS-SF T-score.
Correlations Between the BESS-SF and the BASC-2-SRP-C Composite T-Scores.
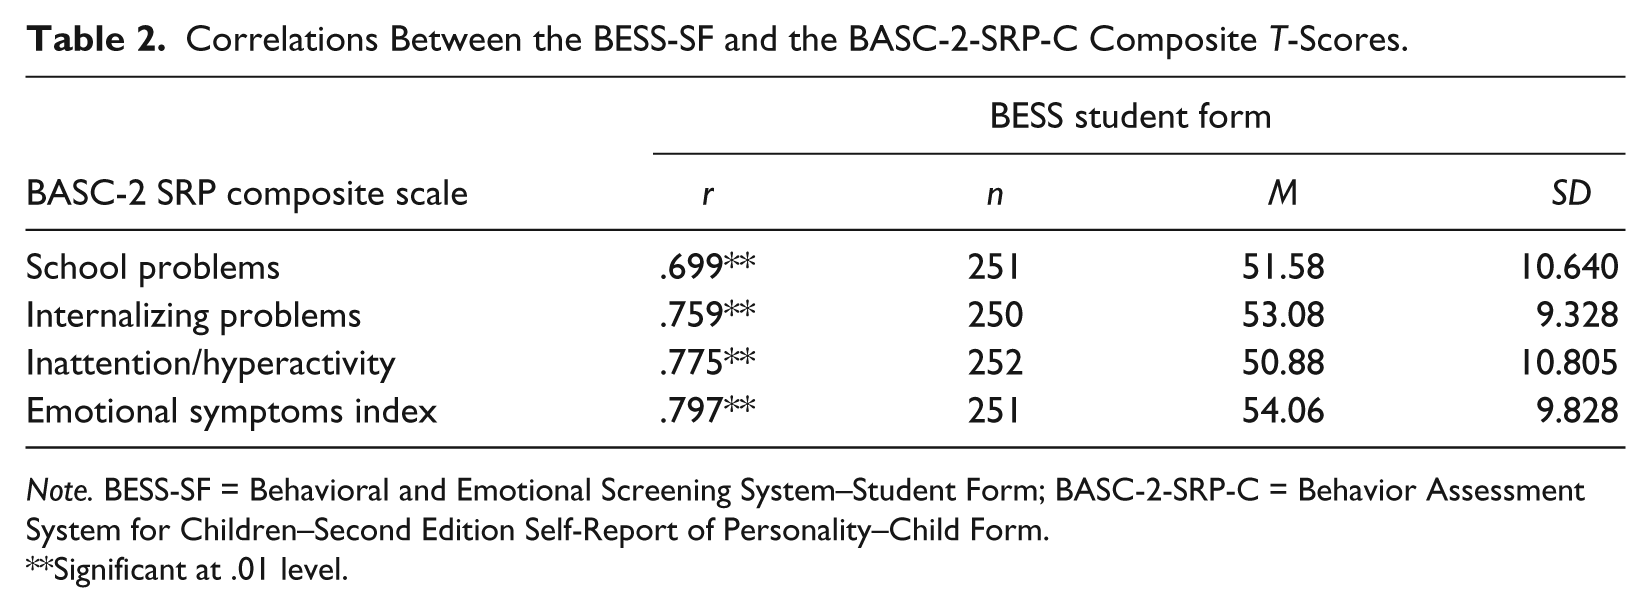
Note. BESS-SF = Behavioral and Emotional Screening System–Student Form; BASC-2-SRP-C = Behavior Assessment System for Children–Second Edition Self-Report of Personality–Child Form.
Significant at .01 level.
Accuracy of Classification Status
The BESS manual reported all four classification accuracy statistics, using the BESS as a predictor of BASC SRP outcomes. To replicate these previous findings, a discussion of all four statistics is provided here for comparison with the original results. Glascoe (2005) standards for evaluating specificity (close to 80%), sensitivity (preferred range between 70% and 80%, with 50% and above being acceptable), and NPV (30%-50%) were used.
BASC-2-SRP-C composite T-scores were coded into dichotomous variables: positive or negative for “at-risk” status. To be coded as “at-risk” (positive) on the BASC-2-SRP-C measure, student T-score had to be in the “at-risk” or “clinically significant” range, whereas for the BESS-SF, the student T-score had to be in the “elevated” or “extremely elevated” range. Thus, being “positive” on the BESS-SF notes if a T-score is indicative of higher than average behavioral and emotional risk score in any regard, and if individuals require any need for follow up. Being “positive” on the four clinical BASC-2-SRP-C measures informs whether a person demonstrates higher than average “at-risk” scores in one or more composite areas, which denotes a specific clinical and adaptive behavior deficit.
SPSS cross tabulation values of sensitivity, sepcificity, PPV, and NPV were used to evaluate the classification accuracy of the BESS-SF with respect to the BASC-2-SRP-C. Table 3 shows the accuracy classification measures for being “at-risk” on each of the four BASC-2-SRP-C composite scales and being “at-risk” on any one of the four composite scales. The base rates for each of the four BASC-2-SRP-C composite scales range between .21 and .27. The base rate for participants to be high on at least one of the composite scales is .42
Classification Evaluation of Accuracy for BESS-SF.
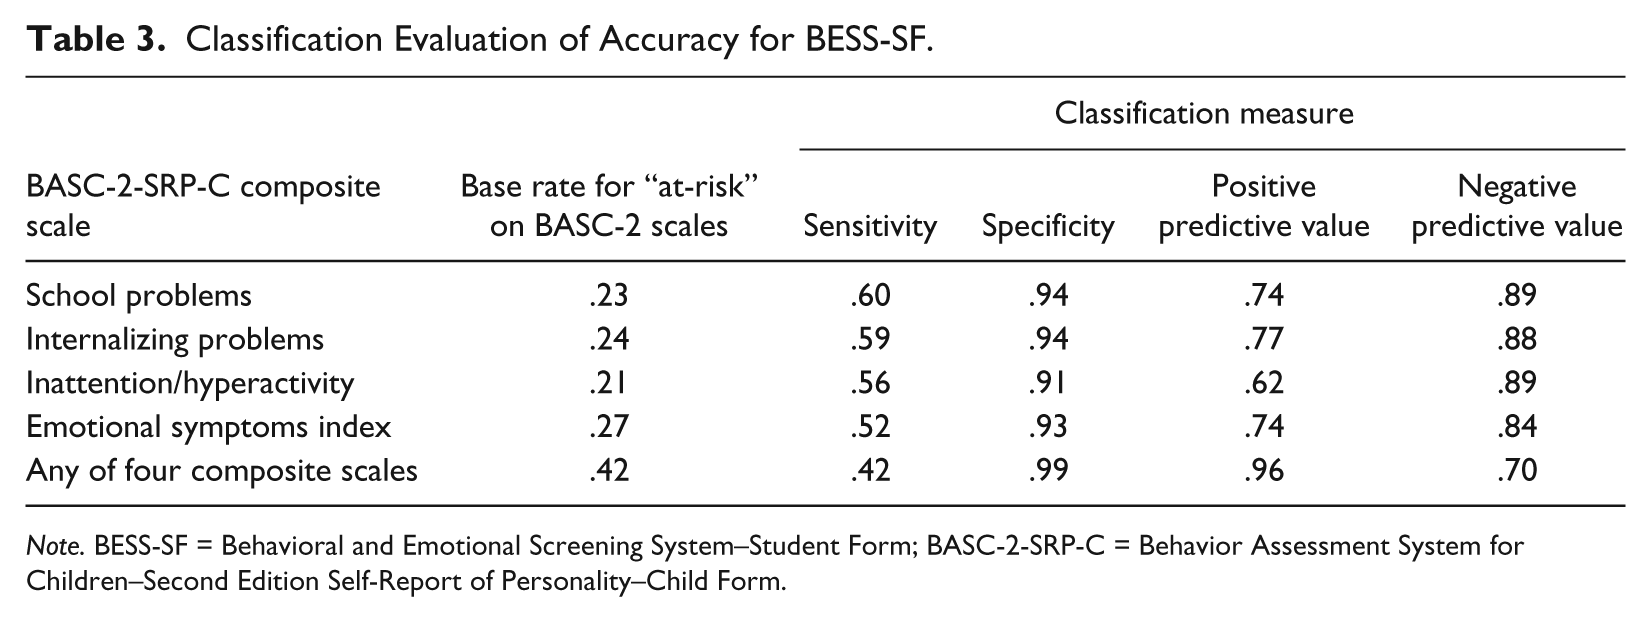
Note. BESS-SF = Behavioral and Emotional Screening System–Student Form; BASC-2-SRP-C = Behavior Assessment System for Children–Second Edition Self-Report of Personality–Child Form.
The calculated specificity values indicate that of the total number of participants who identified as negative for risk on each of the four outcome measures (BASC-2-SRP-C composite scales), over 90% also identified as negative for risk on the BESS screener. In similar regard, the NPVs ranged from .84 to .89; meaning that of total number of participants who identified as negative on the predictive measure (BESS-SF), 84% to 89% of participants also identified as negative on each of the BASC-2-SRP-C composite scales. In addition, when students identified as being negative for risk on any of the four composite scales, specificity was 99% and NPV was 70%. These results depict high specificity and NPVs for the BESS-SF’s predictive abilities of true negatives on the BASC-2-SRP-C.
The sensitivity results show that of the total number who identified as positive for risk on each of the four outcome measures (BASC-2 SRP composite scales), 52% to 60% of participants also identified as at risk on the BESS-SF. The PPVs indicate that of the total participants who scored positive regarding their risk on the BESS-SF, 62% to 77% of participants were indicated as at risk on each of the BASC-2 SRP composite scales. In addition, when students are identified as being positive for risk on any of the four composite scales, sensitivity is 42% and PPV is 96%. These results depict moderate to high sensitivity and PPVs for the BESS-SF’s predictive abilities of true positives on the BASC-2 SRP.
Discussion
The current study’s results revealed consistently high positive correlations among student BESS-SF total T-scores and all composite scale T-scores on the BASC-2-SRP-C. These results document the high predictability of the BESS-SF in relation to the BASC-2 SRP. In addition, there was high specificity and NPVs between the two instruments. Specificity was prioritized to meet the goal of avoiding children’s exposure to unnecessary stigmatization as a result of being labeled “at-risk” from the screening process. These results suggest scores on the screening measure are accurate by demonstrating children who identify as not “at-risk” on the BESS-SF will likely identify as not “at-risk” on BASC-2 SRP domains. Likewise, there were moderate to high sensitivity and PPVs; suggesting children identifying as “at-risk” on the BESS-SF have a moderate chance of being identified as “at-risk” on at least one of the BASC-2 SRP domains. These findings are congruent and consistent with previous research findings from norming sample analyses (e.g., Reynolds & Kamphaus, 2004). Overall, these results suggest teachers and school psychologists can rely on the self-report BESS-SF with confidence as a preliminary identification screener of students requiring further assessment.
One criticism of universal screening in schools is the burden on teacher’s time. In a study of teacher stress and the mediating role of collective efficacy beliefs, among a sample of 951 teachers, female teachers reported high levels of stress due to workload and student misbehavior (Klassen, 2010). The BESS-SF, therefore, is a viable measure for use in a classroom setting given that it is quick, convenient, and requires no training in its administration. Furthermore, the self-report nature of the BESS-SF places less responsibility on teachers or parents, and elicits the most accurate perspective of a student’s internalized well-being (Cook et al., 2010). This is consistent with previous research that showed while teachers are highly reliable raters of school problems and parents are highly reliable raters of externalizing problems; students are more reliable raters of their own internalizing symptoms (Dowdy, Twyford, et al., 2011). This measure’s characteristics might be more attractive for both small and large school systems as it can be implemented in classrooms with minimal burden on teachers or other school personnel.
Limitations
Several limitations should be acknowledged when interpreting these findings. First, 29 of the 30-item BESS-SF screener questions, also appear on the 139 item BASC-2 SRP, which can inflate correlation values. Due to the necessity to calculate BASC-2 SRP norm-referenced composite T-scores, the decision was made to retain overlapping items for this analysis. In addition, school psychology best practice follows universal screening with a comprehensive rating scale measure to better identify specific areas of risk.
The sample this study used, varied greatly from the norming sample regarding the demographics. A delimitation of this study is the greater percentage of Hispanic students (81.7%) compared with the norming sample. The majority of the norming sample was White (62.7%), with Hispanic and African American children each representing approximately 16% of the sample. However, this study was limited to children in Grades 3 through 5 (ages 8-11), whereas the norming sample included individuals ages 8 to 18. In regard to making generalizations about this study’s confirmatory nature to the findings in the BASC-2 and BESS manual, this study is limited because it does not depict the same demographics as the norming sample. Despite these differences, the resulting analyses closely resemble those found in the BESS manual for sensitivity (52%-60% for each of the four specific clinical domain, and 42% for any clinic domain), specificity (91%-94%; 99%), PPV (62%-77%; 96%), and NPV (84%-89%; 70%). These results indicate that the BESS-SF and BASC-2-SRP-C function, as the manual describes, as an assessment of risk for predominately young (Grades 3 through 5) and Hispanic populations.
The number of students included in this study with clinically diagnosed behavioral and/or emotional issues is unknown. It is expected that the number in this sample would be small. Students with clinically diagnosed problems leading to a special education or individualized education plan (IEP) would not necessarily be placed in traditional classrooms with their peers in the sampled schools.
Despite these limitations, our findings suggest that a two-stage, voluntary, school-based screening process is a viable means of increasing the detection and referral for tiered services of youth in Grades 3 to 5, who are “at-risk” for emotional and behavioral problems. A brief self-administered screener followed by a clinical and adaptive skill omnibus assessment measure appears to be an effective method for identifying clinically “at-risk” students.
The findings underscore a potential role of school-based mental health screening in identifying students in need of emotional and behavioral prevention or intervention services. However, several barriers still exist that prohibit the widespread implementation of school-based mental health screening. These include low acceptability of screening to superintendents and school professionals who tend to find school-wide screening less acceptable than curriculum-based or staff in-service training prevention efforts (Scherff, Eckert, & Miller, 2005), the dependence of screening on school personnel enthusiasm and readiness to participate (Hallfors et al., 2006), and the lack of evidence-based research that match interventions to “at-risk” domains on screening and comprehensive behavior measures. To maximize the benefits of multi-gating approaches to universal screening, a focus on building the capacity to expeditiously connect students to community and school-based services is necessary.
With these findings, the BESS-SF can be used with additional confidence that it efficiently allows school districts to meet student’s social and emotional needs. Additional practical considerations for those wishing to incorporate the BESS-SF into school practices fostering public and institutional trust and acceptance of universal, voluntary mental health screening; identifying funding streams to support implementation and maintenance of screening initiatives; and integrating screening efforts into existing mental health services must become priorities on local, state, and federal policy agendas.
Footnotes
Declaration of Conflicting Interests
The author(s) declared the following potential conflicts of interest with respect to the research, authorship, and/or publication of this article: R.W. Kamphaus wishes to disclose a potential conflict of interest in that he recieves a portion of royalties on net sales of the BESS & BASC-2.
Funding
The author(s) disclosed receipt of the following financial support for the research, authorship, and/or publication of this article: Advancing chidlren and teacher’s success through early screening and intervention through the Institute of Education Sceinces of the U.S. Department of Education. Grant#: R324B060005 to R.W. Kamphaus & C. DiStefano.