
Abstract
Although test anxiety (TA) has been shown to be prevalent among Australian university students, the 17-item German Test Anxiety Inventory (TAI-G) has only recently been shown to be a valid measure for use with Australian university students. However, contention exists within the literature as to whether the Lack of Confidence subscale is better conceptualized as a correlate of TA as opposed to a constituent factor because it has been found to have the weakest subscale intercorrelation. It has been suggested that this may be due to the positive item wording of this subscale, which is in contrast to wording of the other subscales. To test this, the Lack of Confidence subscale items were worded negatively for this study and previously established 30-item, 20-item, and 17-item models of the TAI-G were tested using confirmatory factor analysis (CFA) with 473 Australian university students. In line with expectations, the 17-item TAI-G provided the best fit to the data. Furthermore, in contrast to previous findings, there was no notable difference between models conceptualizing the reworded Lack of Confidence subscale as a correlate of TA and models incorporating it as a factor of TA. Moreover, the reworded Lack of Confidence subscale was found to have the strongest subscale intercorrelations. It was concluded that the 17-item TAI-G with the negatively worded Lack of Confidence subscale provided the most valid measure of TA, with semantically opposed items being detrimental to validity. Implications of these findings are discussed.
Keywords
University students face a multitude of challenges, both personal and institutional, which combine with individual differences to affect academic success. One factor that has consistently been shown to negatively affect academic performance has been test anxiety (TA; Hembree, 1988). TA can be described as phenomenological, physiological, and behavioral reactions in response to the potential for examination failure or underperformance (Zeidner, 1998). Anxiety over examinations has been found to increase over time and is prevalent in university populations (Knappe et al., 2011). It is therefore important to develop and validate measures designed to assess for the presence and intensity of TA in university student populations.
One contemporary measure for the assessment of TA is the German Test Anxiety Inventory (TAI-G). The TAI-G was originally developed by Hodapp, Laux and Spielberger (1982) and subsequently re-formulated (Hodapp, 1991) through administering 80 items to a mixed sample of 713 college and grammar students. The items referred to cognitive, emotional, and physiological indices of TA. From these items, principal component analysis identified the final 30-item, four-factor solution of the TAI-G, consisting of (a) Worry, cognitive aspects relating to fear of failure; (b) Emotionality, physiological responses characteristic of TA; (c) Interference, disruptive thoughts that interfere with on-task performance but unrelated to worries concerning failure; and (d) Lack of Confidence, the test takers’ belief in their ability to perform well in an exam. The TAI-G has been applied cross-culturally, demonstrating structural validity and the presence of four factors (Harpell & Andrews, 2012; Keith, Hodapp, Schermelleh-Engel, & Moosbrugger, 2003; Rohrmann, Bechtoldt, Schnell, & Hodapp, 2010; Sese, Palmer, & Perez-Pareja, 2010).
The 30-item TAI-G, however, has demonstrated poorer fit when compared with a shortened 17-item version developed by Hodapp and Benson (1997; Harpell & Andrews, 2012). The 30-item TAI-G also failed to demonstrate adequate fit in an Australian sample (Comparative Fit Index [CFI] = .85, root mean square error of approximation [RMSEA] = .08) with the 17-item TAI-G demonstrating superior fit over the original TAI-G (CFI = .94, RMSEA = .07; Mowbray, Jacobs, & Boyle, 2014). However, limitations to this study, which included just acceptable fit statistics, a restricted university sample, and relatively low participant numbers, resulted in questions over the generalizability of the findings. Moreover, as far as the authors are aware, this is the only study to explore the factor structure of the TAI-G in an Australian sample, indicating the need for further research.
In a similar attempt to develop a shortened version of the TAI-G, Hodapp, Rohrmann and Ringeisen (2011) developed a 20-item version called the Prüfungsangstfragebogen (PAF). The PAF attempted to improve on the psychometric properties of the TAI-G through retaining items based on face validity and consistently high subscale intercorrelations. However, the PAF has yet to be validated in an English-speaking sample, and also has still to be compared with the 17-item version of the TAI-G.
Despite these modifications, issues with the subscale structure appear to be evident in all three versions of the TAI-G. Specifically, issues with the Lack of Confidence subscale feature consistently in the literature (Hodapp & Benson, 1997; Keith et al., 2003; Mowbray et al., 2014). Ringeisen, Buchwald, and Hodapp (2010) conducted a cross-cultural validation of the TAI-G among students from multi-ethnic South African and German samples (n = 102 and n = 183 respectively). The outcomes of this study supported the structure of the TAI-G on the whole, but revealed non-significant intercorrelations between the Lack of Confidence subscale and the remaining three subscales for the South African Male subsample (r = .22-.33, p > .05). This result seems to support previous research that has identified Lack of Confidence and Self-Efficacy as comprising the factor of Self-Esteem (Hodapp & Benson, 1997; Keith et al., 2003). That is, Lack of Confidence was found to be a correlate of TA as opposed to a constituent factor. Keith et al. (2003) found that a model in which Lack of Confidence and Self-Efficacy comprised the separate factor Self-Esteem demonstrated superior fit (CFI = 1.00, RMSEA = .04) over the original four-factor TAI-G (CFI = .98, RMSEA = .06). Similarly, the Lack of Confidence subscale was found to have the weakest interscale correlations (r = .46-.52) and the strongest relationship with self-efficacy (r = .49) in relation to the other subscales when administered in an Australian sample (n = 224; Mowbray et al., 2014).
Although the above findings imply that Lack of Confidence may be a closely related correlate of TA, rather than a component of TA itself (Hodapp & Benson, 1997), it has been suggested that the pattern of associations demonstrated by the Lack of Confidence subscale may be a product of item wording (Keith et al., 2003; Mowbray et al., 2014; Ringeisen et al., 2010). That is, items in the Lack of Confidence subscale are positively oriented (e.g., “I think that I will succeed”), which is in contrast to the other subscales of the TAI-G, which are negatively oriented (e.g., “I worry what might go wrong”). Thus, lower intercorrelations between the Lack of Confidence subscale and the other TAI-G subscales could be the result of the difference in item orientation and simply reflect response tendencies. Moreover, the Self-Efficacy scales used in these studies contained positively oriented items, similar to the Lack of Confidence subscale. Therefore, response tendencies may have inflated the relationship between these two constructs, resulting in the Lack of Confidence subscale being conceived as related more to self-efficacy than TA.
Developing scales that consist of semantically opposed items is considered to serve a psychometric function. First, it is considered to protect against acquiescent response bias, that is, the tendency to agree with statements rather than to disagree (Cronbach, 1950; Nunnally, 1978). Moreover, some researchers maintain that the inclusion of semantically opposed items within the one scale helps to ensure that participants attend to the content of items, as opposed to developing a response set based on their overall feelings about the subject (Nunnally, 1978). In contrast to these arguments, evidence suggests semantically opposite items may actually be detrimental to the psychometric properties of a measure.
Semantically opposing items can introduce a response bias, whereby test takers may respond in a particular way depending on the orientation of the item, irrespective of the item content. This generates systematic variance in scores that is independent of the construct being measured, resulting in data confounded by a method effect (i.e., the way in which data were collected). The Rosenberg Self Esteem Scale (RSES), for example, is a self-esteem measure consisting of equal numbers of positively and negatively oriented items, with research also demonstrating the presence of two factors (Owens, 1994). Greenberger, Chen, Dmitrieva, and Farrugia (2003) constructed three separate versions of the RSES: the original RSES (positive and negative oriented items), a revised-negative version (negative oriented items only), and a revised-positive version (positive oriented items only). The researchers concluded the RSES was in fact unidimensional and the two-factor solution seemed to be an artifact of the mixed item orientation, with both revised versions of the RSES fitting neither model (single-factor or double-factor) significantly better than the other. Moreover, the orientation of the items may have affected the magnitude of correlations found between the RSES and a depression inventory used to establish convergent validity. The depression inventory, which contained negatively oriented items, correlated weakest with the positively oriented items of the revised RSES. This indicates how differences in item orientation may serve to affect correlations between related measures and subscales, in addition to altering factor structure (Greenberger et al., 2003).
In addition, it has been found that the use of items with opposing orientation can significantly reduce internal consistency (Schriesheim, Eisenbach, & Hill, 1991), with participants endorsing semantically opposing items differentially as a function of extraneous confounding factors, such as self-conscientiousness, fear of negative evaluation (DiStefano & Motl, 2006), and level of education (Melnick & Gable, 1990). Therefore, an overall potential loss of reliability and validity may be expected with the inclusion of semantically opposite items (Barnette, 2000).
The Current Study
Based on the above reviewed research, it appears likely that the semantically opposing items present in the Lack of Confidence scale of the TAI-G may introduce method effects. This may account for the mixed results relating to the Lack of Confidence subscale, with Lack of Confidence found to be more related to self-efficacy than TA as has been suggested by Hodapp and Benson (1997) and Keith et al. (2003). This study has two principal aims. First is to examine the influence of semantically opposing items by reverse wording the items of the Lack of Confidence subscale and investigating the impact on the TAI-G subscale correlations and factor structure. Second, this study sought to validate the results of previous research that had found the 17-item TAI-G to provide the best fit in an Australian university sample compared with the 20-item and 30-item TAI-G models (Mowbray et al., 2014)
It was predicted that the 17-item version of the TAI-G with the Lack of Confidence–Revised subscale would demonstrate a stable, four-factor structure and adequate fit to the data. The 30-item TAI-G and 20-item PAF were hypothesized to show a poorer fit of the sample data when compared with the 17-item TAI-G. It was hypothesized that higher interscale correlations would be observed for the Lack of Confidence–Revised subscale when compared with previous studies. Finally, it was predicted that the Lack of Confidence–Revised subscale would demonstrate a better fit when conceptualized as a component of TA, in contrast to previous studies (Hodapp & Benson, 1997; Keith et al., 2003), which found the original Lack of Confidence subscale to be better conceptualized as relating to Self-Efficacy under a second-order factor labeled Self-Esteem.
Method
Participants
A total of 473 university students participated in the current study. The sample consisted of 335 females (71%) and 138 males (29%), aged from 17 to 48 years (M = 20.7 years, SD = 2.6 years). The majority of respondents identified as Australian and/or a mixture of Australian and another ethnic identity (combined 80%), whereas the next largest ethnic grouping consisted of a range of East Asian ethnic identities (7%). The remaining participants identified as European (5%), South Asian (3%), American (1%), Middle Eastern (1%), and unspecified (3%). Participants on average had attended university for just more than 2 years (M = 2.4 years, SD = 1.4 years), with the majority reporting either high school diploma (67%) or a bachelor’s degree (28%) as their highest level of education obtained. The majority of the participants (95%) reported not having a major examination within 2 weeks of taking the questionnaire.
Measures
TAI-G
The TAI-G (Hodapp, 1996) is a self-report measure of TA, consisting of 30 items split into four subscales: Worry (10 items; e.g., “I worry about my results”), Emotionality (8 items; e.g., “I tremble with fear”), Interference (6 items; e.g., “I easily lose my train of thoughts”), and Lack of Confidence (6 items; e.g., “I think that I will succeed”). Participants rated each item on a 4-point Likert-type scale, ranging from 1 (almost never) to 4 (almost always). The Lack of Confidence subscale contains positively oriented items; however, for this study, the items were reworded negatively in concordance with items in the other three subscales. When coding items, care was taken not to simply add negation such as “not” or “no” in front of the item to generate a negatively coded item (e.g., “I am not confident about my performance”). This could result in the misreading of items, resulting in inaccurate responses and decreasing validity and reliability (Barnette, 2000; Spector, 1992). Changes in the wording of items were used to minimize this from occurring (e.g., “I am unconfident about my performance”). This subscale was renamed Lack of Confidence–Revised and replaced the original six-item Lack of Confidence subscale (see the appendix). This produced a version of the TAI-G consisting of the four subscales (Worry, Emotionality, Interference, and Lack of Confidence–Revised). The TAI-G has demonstrated good psychometric properties and Cronbach alpha values between .73 and .95 (Harpell & Andrews, 2012; Keith et al., 2003; Mowbray et al., 2014; Ringeisen et al., 2010; Sese et al., 2010).
General Self-Efficacy Scale Short Form (GSE-6)
The GSE-6 (Romppel et al., 2013) is based on the 10-item GSE developed by Schwarzer and Jerusalem (1995). The GSE-6 is designed to be a self-report measure of self-efficacy, consisting of 6 items that relate to belief in being able to overcome and cope with obstacles to reach a desired goal (e.g., “No matter what comes my way, I’m usually able to handle it”). Participants rated each item on a 4-point Likert-type scale, ranging from 1 (not at all true) to 4 (exactly true), with a final score derived from summing responses to each item and higher scores denoting greater self-efficacy. In line with previous studies (Keith et al., 2003; Mowbray et al., 2014), the instructions on this scale were adapted to read “In relation to how you feel toward your studies, please complete the following” to ensure self-efficacy in relation to examinations was measured. The GSE-6 has demonstrated good psychometric properties, with reliability Cronbach alpha values ranging from .79 to .88 (n = 1,460, Romppel et al., 2013). The structure of the GSE-6 was also supported by having significant relationships with expected correlates of self-efficacy (Romppel et al., 2013).
Procedure
Participants were administered the modified version of the TAI-G in addition to the GSE-6. Participants were also required to complete demographic information that included gender, ethnicity, and a question asking whether students were within 2 weeks of an upcoming important exam. The TAI-G was always administered first in an attempt to ensure responses on this measure were as accurate as possible (Galesic & Bosnjak, 2009). The measures were administered online with participation being anonymous. Entry into a prize draw was used as an incentive for participation.
Data Analysis
Preliminary Analysis
Table 1 presents descriptive statistics for the TAI-G. Reliability as measured by Cronbach’s alpha was high for all scales and subscales (> .70; Cronbach, 1950). Missing values totaled less than 1%, indicating that various methods for dealing with missing data would produce equivalent results (Tabachnick & Fidell, 2013). Maximum likelihood estimation method was applied because it provides accurate standard errors and parameter estimates, and is considered one of the best options for missing data management (Schlomer, Bauman, & Card, 2010).
Descriptive Statistics for the TAI-G.
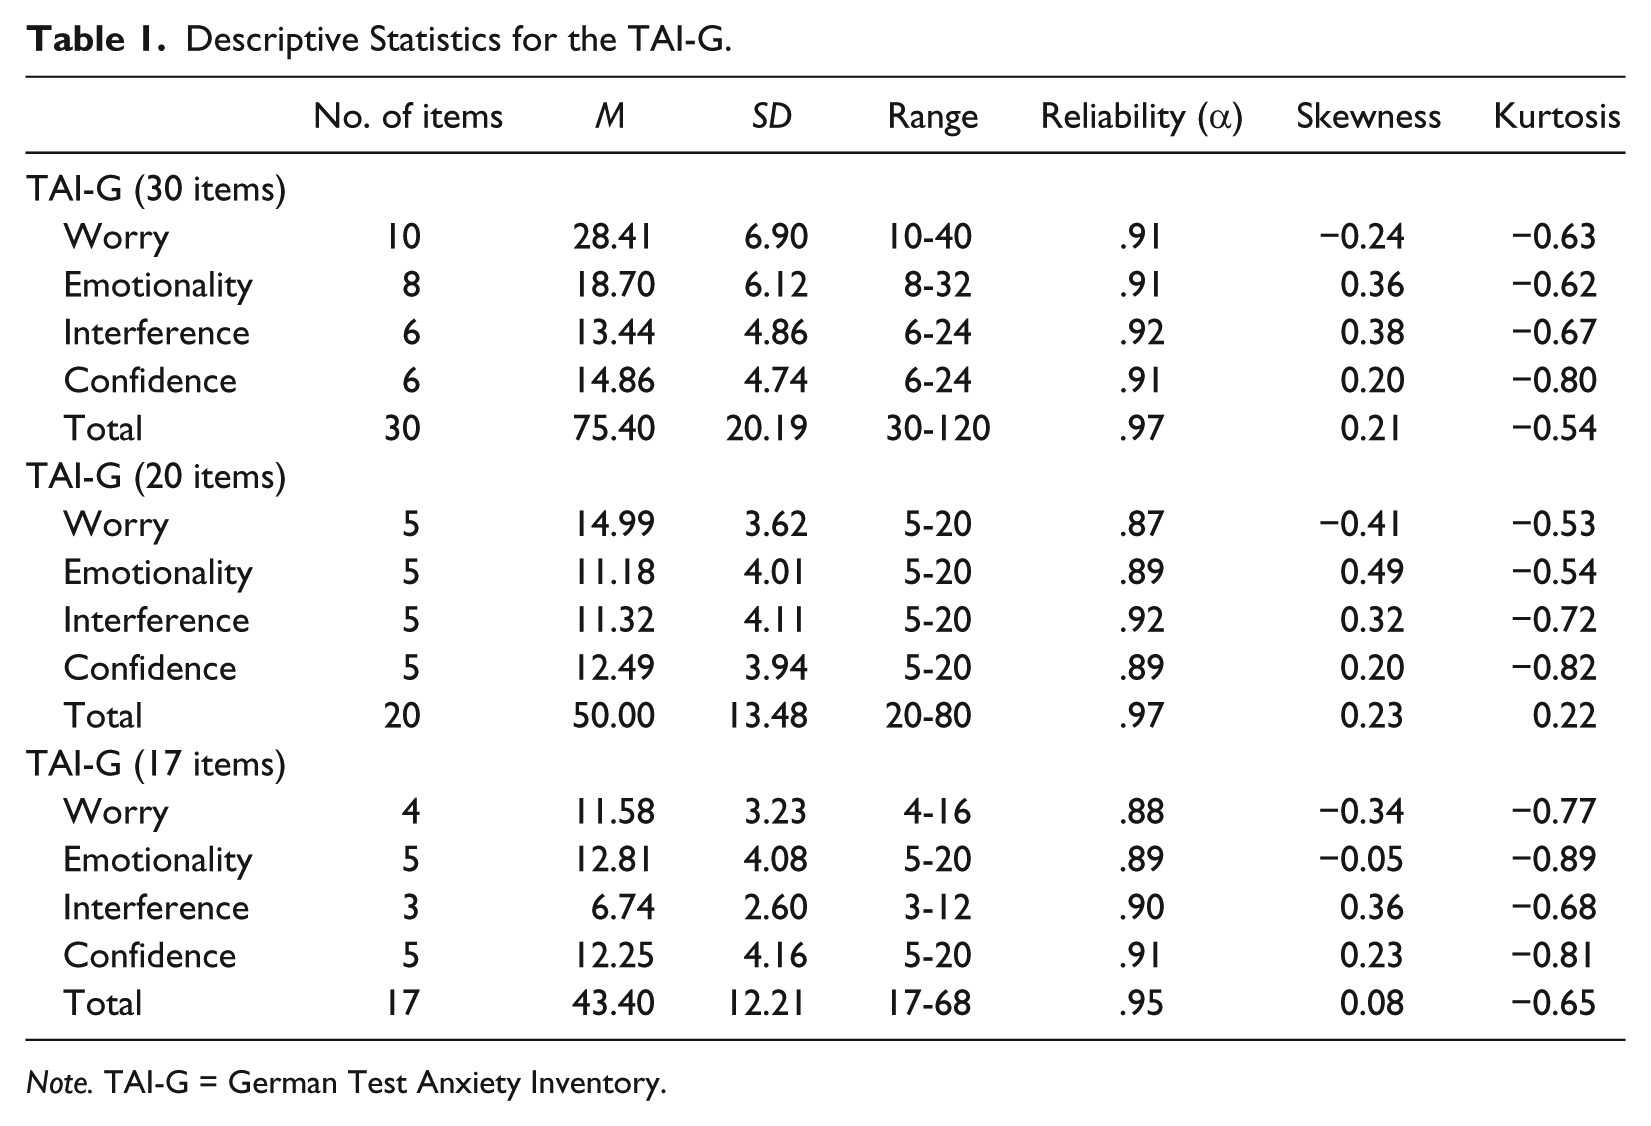
Note. TAI-G = German Test Anxiety Inventory.
Confirmatory Factor Analysis (CFA)
To test the hypotheses, five separate models were constructed and CFA conducted on each (see Table 2), with Models 1a and 1b being tested on the 30-item, 20-item, and 17-item TAI-G.
CFA Model Labels and Descriptions.
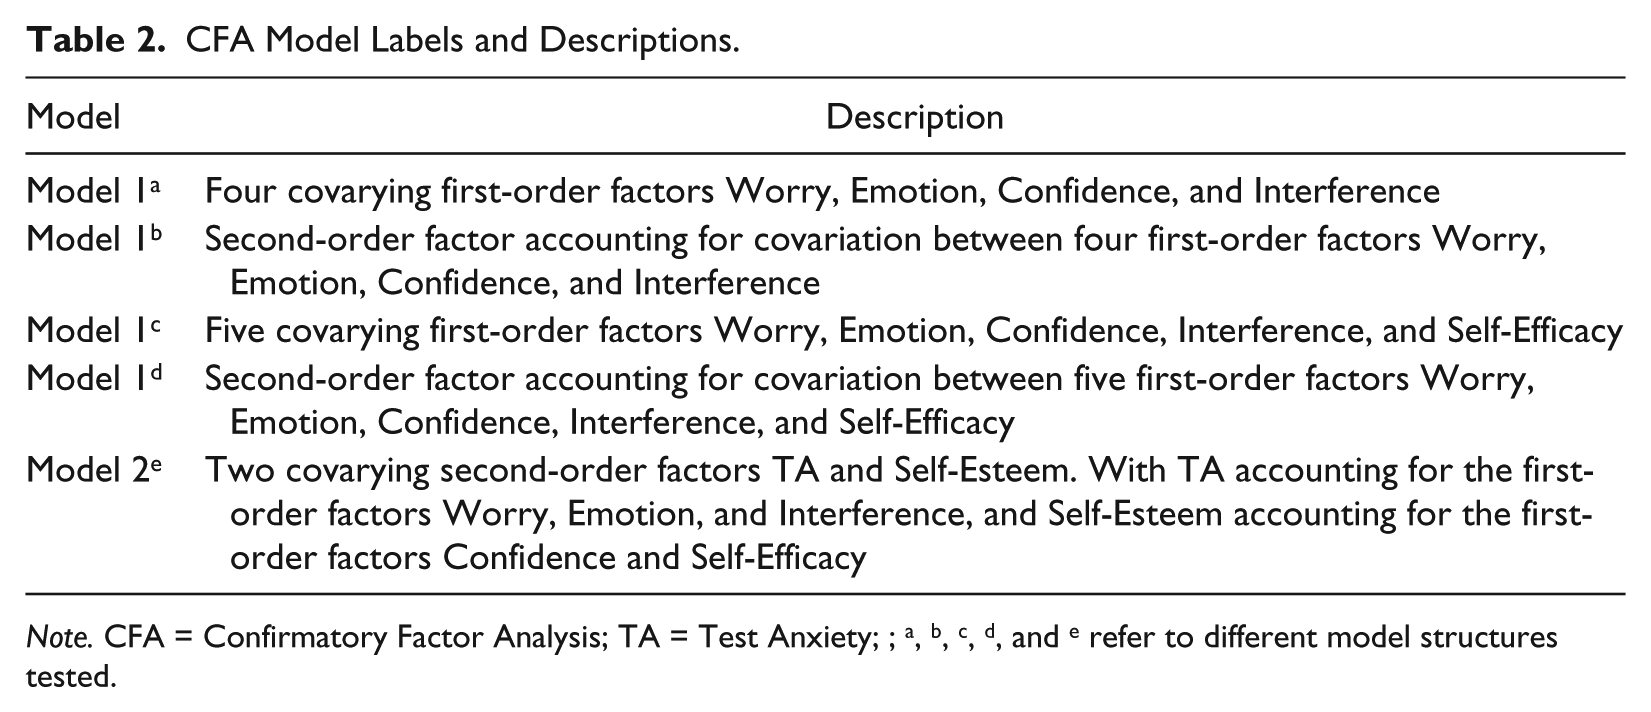
Note. CFA = Confirmatory Factor Analysis; TA = Test Anxiety; ; a, b, c, d, and e refer to different model structures tested.
CFA was conducted using maximum likelihood estimation with AMOS Version 21. Fit indices observed and cutoff values chosen were consistent with recommendations outlined by Hu and Bentler (1998, 1999) and with previous research (Mowbray et al., 2014). Results are presented in Table 3.
Overall Model Fit Indices.
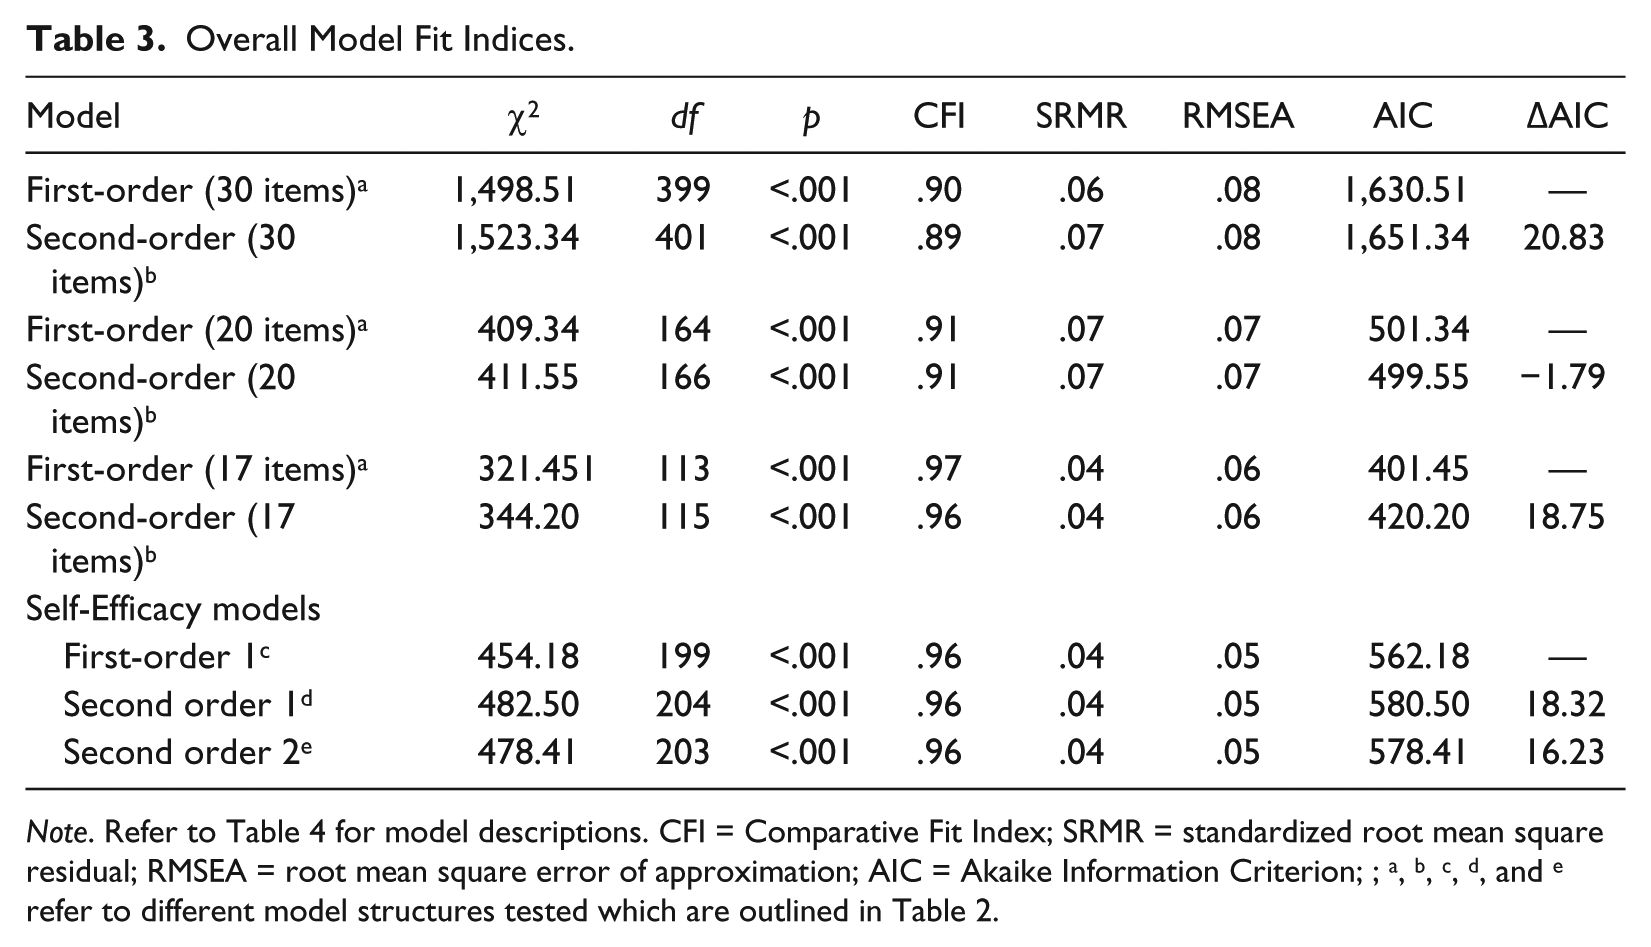
Note. Refer to Table 4 for model descriptions. CFI = Comparative Fit Index; SRMR = standardized root mean square residual; RMSEA = root mean square error of approximation; AIC = Akaike Information Criterion; ; a, b, c, d, and e refer to different model structures tested which are outlined in Table 2.
Inspection of chi-square indicated poor fit for all models. However, this was expected due to the stringency of this statistic, therefore justifying the inspection of alternative fit indices (Kline, 2010). The first- and second-order 30-item TAI-G models did not meet requirements for adequate model fit with regard to CFI and standardized root mean square residual (SRMR), and marginally met acceptable fit using the RMSEA. Similarly, neither of the 20-item TAI-G models met the requirements for adequate model fit. Observation of the standardized residual covariance matrix revealed Items 2, 6, 20, and 30 were mainly responsible for the unacceptable fit statistics evidenced by the 20-item and 30-item TAI-G. In contrast, both first- and second-order models for the 17-item TAI-G met criteria for good model fit across CFI, RMSEA, and SRMR statistics. With the exception of the 20-item TAI-G, the first-order models for both 30- and 17-item versions of the TAI-G demonstrated improved fit over second-order models as evidenced by increased Akaike Information Criterion (AIC) values (ΔAIC = 20.83 and ΔAIC = 18.75 respectively).
Self-Efficacy models were then tested using the 17-item TAI-G; however, when running CFA on Model 2e, a Heywood case was encountered. On closer inspection, Item 3 of the GSE (“It’s easy for me to stick to my aims and accomplish my goals”) showed comparably high standardized residual covariances, indicating that this item did not fit the model well. Deleting Item 3 removed the Heywood case confirming this item as the likely cause; however, this resulted in a five-item self-efficacy scale with an unconfirmed structure. As a precaution, CFA was conducted on GSE data obtained from a previous study (Mowbray et al., 2014) consisting of 224 Australian University students aged from 18 to 52 years (M = 21.3 years, SD = 4.6 years). Initially, CFA was conducted on the GSE-6, which produced acceptable fit statistics with the exclusion of RMSEA (CFI = .96, RMSEA = .110, SRMR = .46). Another CFA was conducted on deleting Item 3, which improved model fit, and reliability remained adequate (α =.76), but RMSEA was still unacceptable (CFI = .97, RMSEA = .096, SRMR = .344). However, these findings support the decision to remove Item 3 from the GSE-6, showing improved model fit.
All three models containing Self-Efficacy demonstrated similar fit statistics, which were within acceptable limits. The first-order Model 1c demonstrated better fit than both second-order Models 1d and 2e (ΔAIC = −.18.32 and ΔAIC = −.16.23 respectively). Second-order Model 2e was shown to have marginally improved model fit over second-order Model 1d (ΔAIC = −2.09). Despite the first-order model demonstrating better fit, relationships among factors were again lower (.45-.86, p < .001) than factors directly loading onto TA in second-order Model 1d (.59-.95, p < .001). Factor loadings for Model 1d were almost identical to those shown in Figure 1, and the Self-Efficacy factor (−.59) had the weakest loading among the five factors. In Model 2e, Self-Esteem was seen to covary very highly with TA (.95, p < .001), which seems to be mostly accounted for by the high loading of Confidence on both TA (Figure 1) and Self-Esteem (Figure 2).
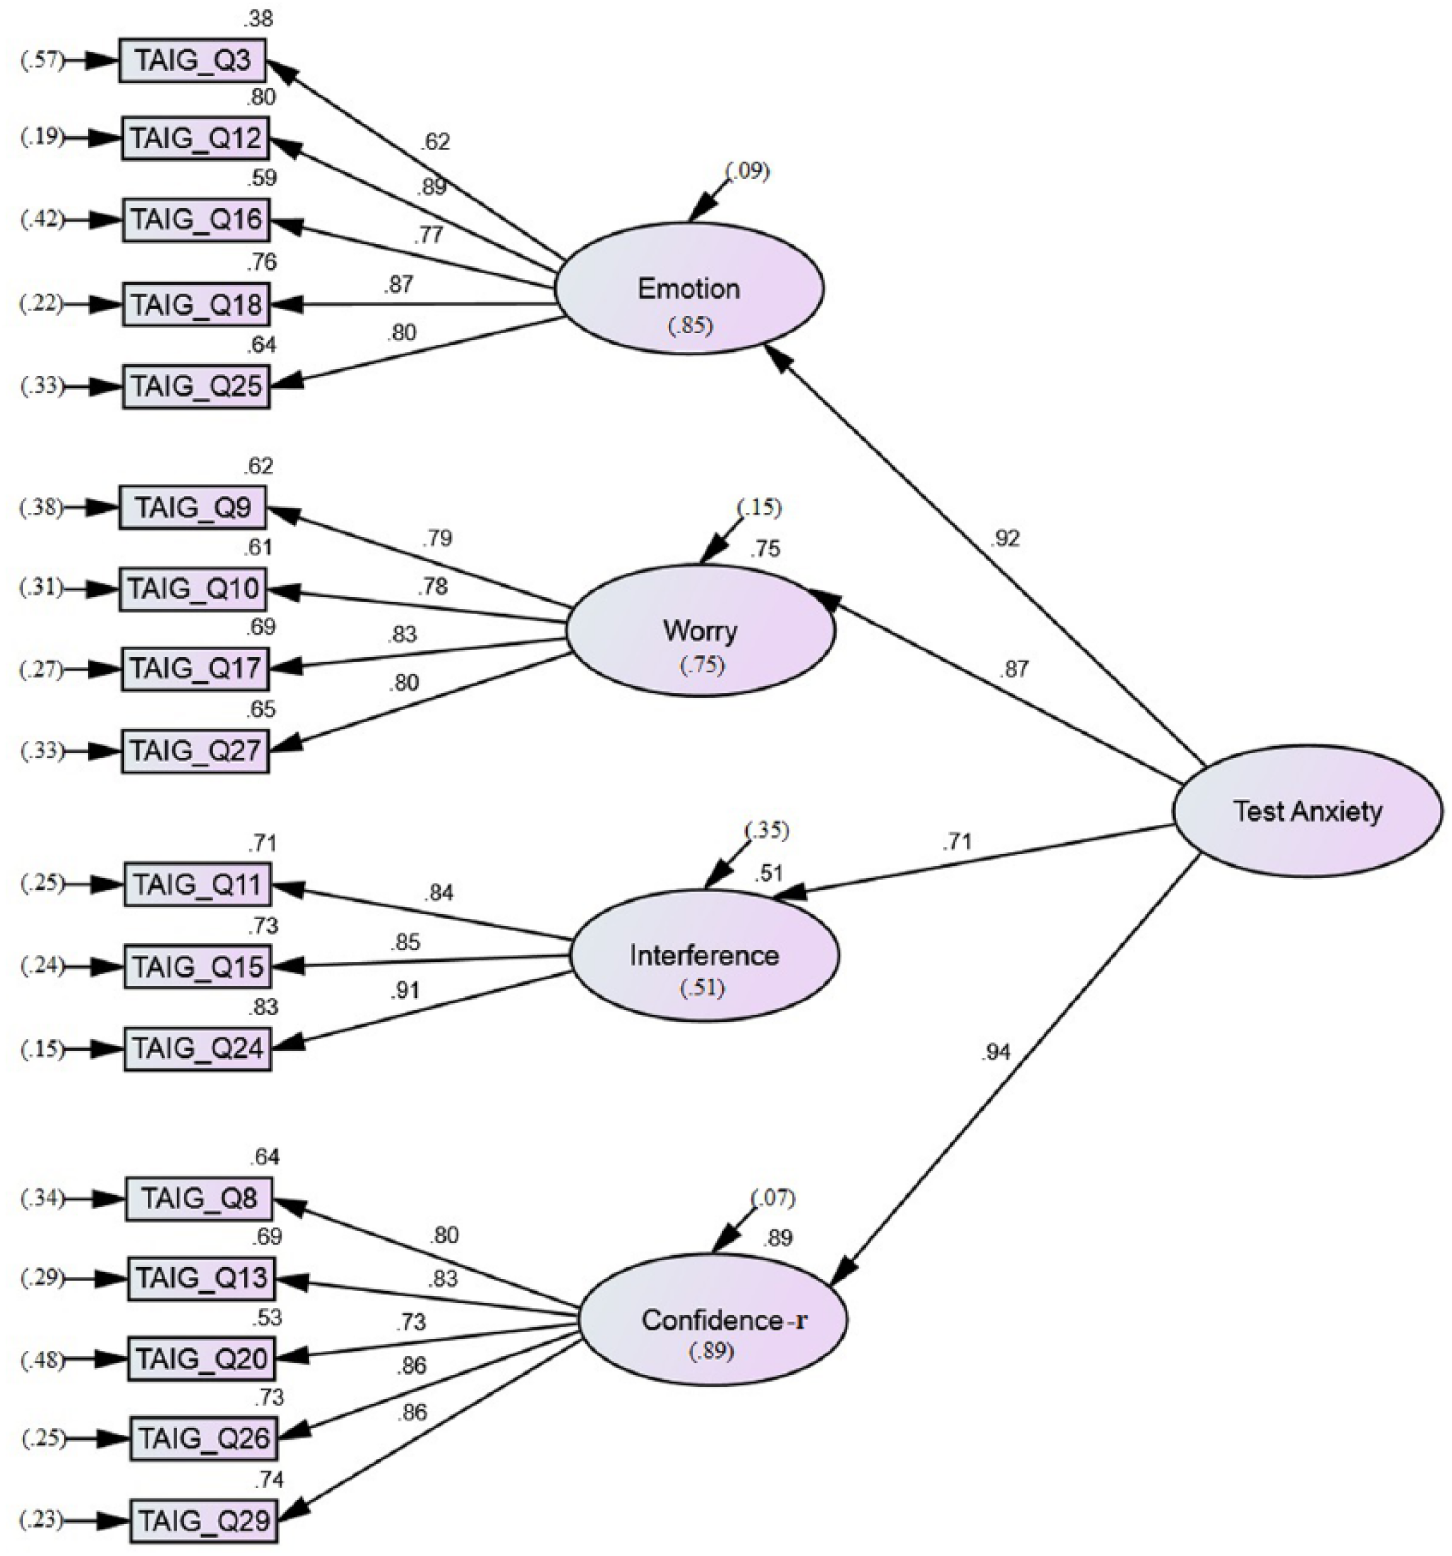
Standardized solution of the 17-item TAI-G confirmatory model consisting of the four primary factors (Emotion, Worry, Interference, and Confidence) and a second-order factor (Test Anxiety). Variances are given in parentheses, factor loadings located on the arrows, and squared factor loadings located to the top right of the variables and inside the factor ovals.
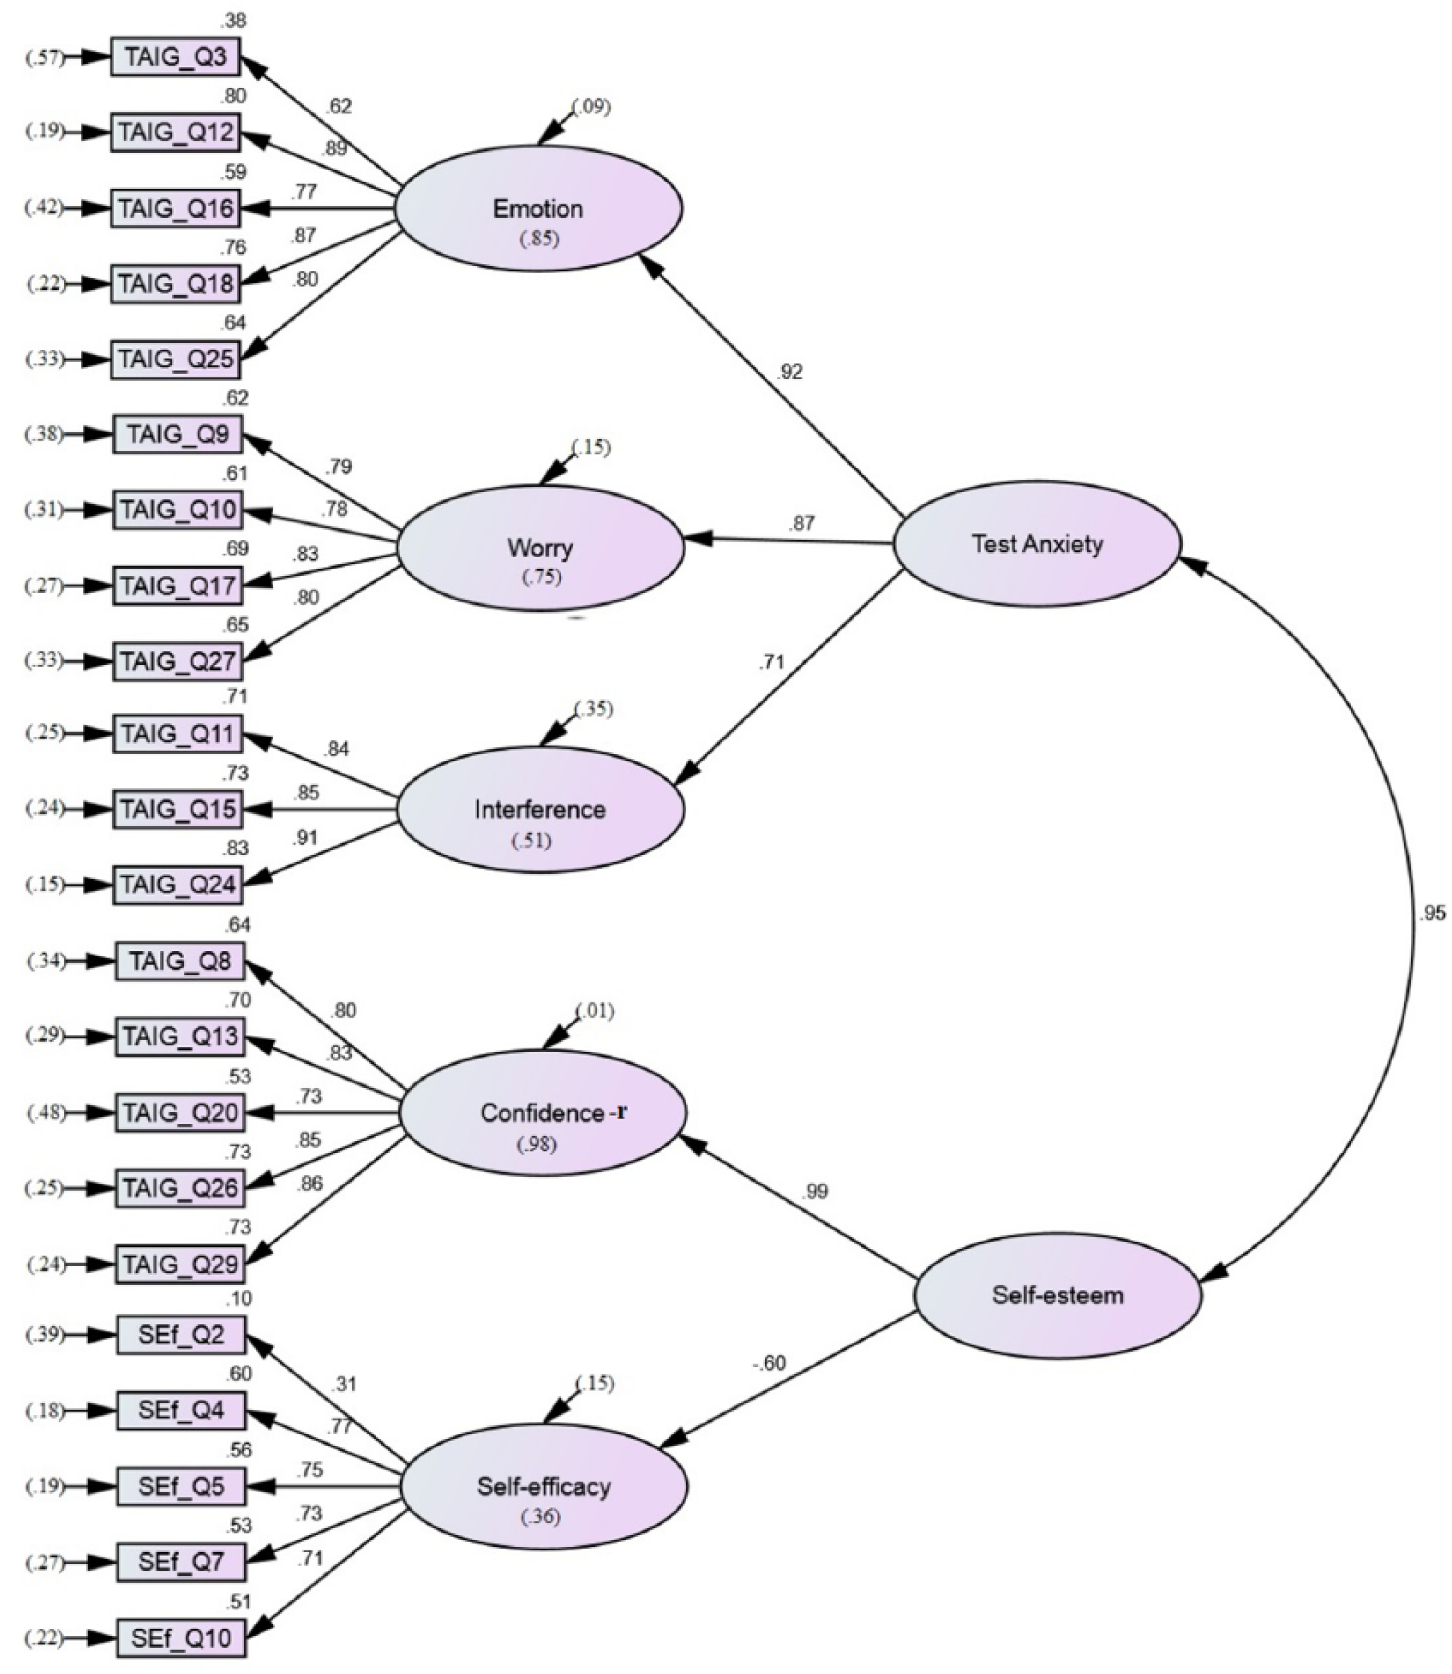
Standardized solution of the TAI-G factors Emotion, Worry, and Interference determined by the second-order factor TA and covarying with the second-order factor Self-Esteem. Self-Esteem being determined by Self-Efficacy and the TAI-G factor Confidence, negatively coded for the purposes of this study. Variances are given in parentheses, factor loadings located on the arrows, and squared factor loadings located to the top right of the variables and inside the factor ovals.
Correlational Data
Subscale intercorrelations for the 17-item TAI-G were observed, in addition to subscale correlations with the GSE data. Subscale correlations ranged from .48 to .75 (p < .01), with the Confidence subscale showing the strongest relationships and the Interference subscale the weakest. The relationships between the subscales of the TAI-G and the GSE were all significant (p < .01; see Table 4) and in the expected direction. The Lack of Confidence–Revised subscale demonstrated the strongest relationship with the GSE whereas Worry was observed to have the weakest.
Correlations of 17-Item TAI-G Subscales and GSE.
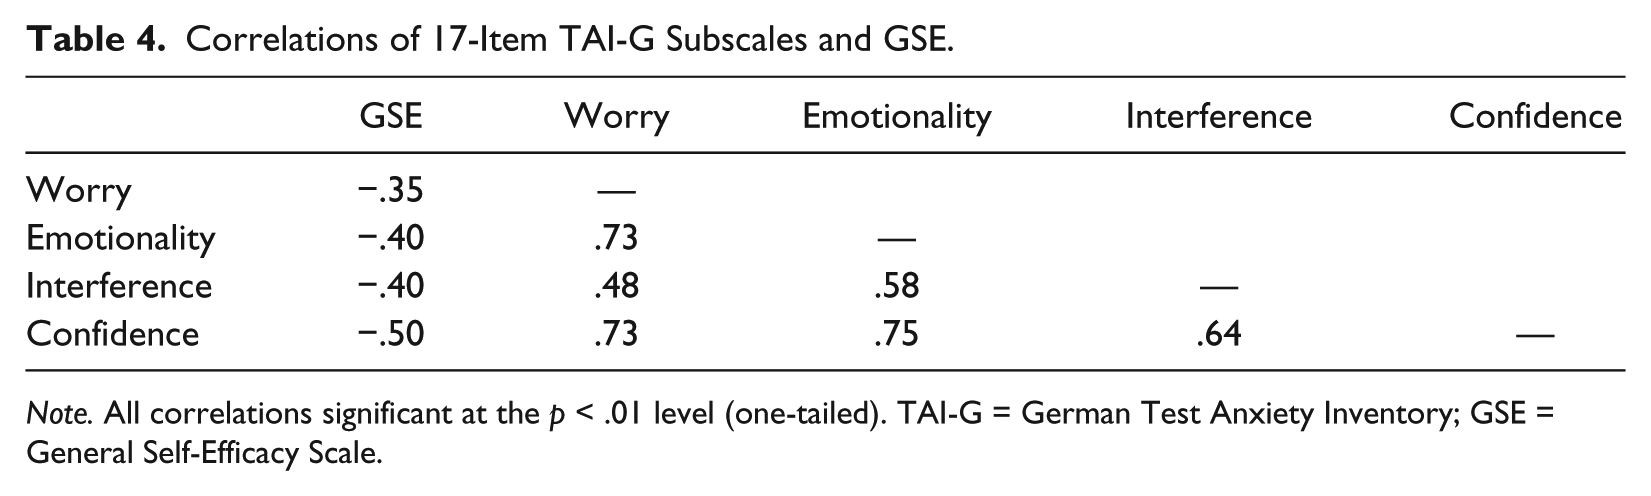
Note. All correlations significant at the p < .01 level (one-tailed). TAI-G = German Test Anxiety Inventory; GSE = General Self-Efficacy Scale.
Discussion
The current study set out to compare the validity and reliability of the 17-item, 20-item, and 30-item TAI-G models. In addition, the Lack of Confidence–Revised subscale was created, which contained items semantically consistent with the remaining subscales of the TAI-G, in contrast to the items of the original Lack of Confidence subscale. This was created to examine the impact of item orientation on subscale correlations and factor structure. Last, first- and second-order five-factor models were tested, which incorporated Self-Efficacy as the fifth factor. A second-order model was also examined, with Self-Esteem accounting for the first-order factors of Lack of Confidence–Revised and Self-Efficacy, whereas TA accounted for first-order factors Emotion, Worry, and Interference.
As hypothesized, the 17-item TAI-G demonstrated improved fit over the 30-item and 20-item TAI-G, a result consistent with previous research (Harpell & Andrews, 2012; Mowbray et al., 2014). This seemed to be due mainly to poor fit of Items 2 and 20 (found in the 20-item and 30-item TAI-G), and Items 6 and 30 (30-item TAI-G only). Interestingly, these same items were also found to be detrimental to model fit for the 30-item TAI-G in a previous study (Mowbray et al., 2014). Therefore, these items have been consistently shown to be problematic when measuring TA in an Australian university sample and thus justify exclusion.
The expectation that the 17-item TAI-G with the Lack of Confidence–Revised subscale would provide improved fit over models incorporating Self-Efficacy was neither supported nor disproven. Models involving Self-Efficacy demonstrated marginally improved fit in RMSEA but could be considered equally viable to the 17-item TAI-G model. This is in contrast to previous findings (Hodapp & Benson, 1997; Keith et al., 2003), which found models conceptualizing Self-Efficacy and Lack of Confidence as a component of Self-Esteem rather than TA demonstrated significantly improved fit over four-factor TAI-G models. Moreover, the Lack of Confidence–Revised subscale was observed to have improved interrelationships between the existing subscales of the TAI-G compared with previous findings (Keith et al., 2003; Mowbray et al., 2014; Ringeisen et al., 2010). Previous studies have shown Lack of Confidence to have one of the lowest interscale correlations, whereas this study found the negatively worded Lack of Confidence–Revised subscale to have the highest.
These outcomes highlight the detrimental impact semantically opposed item wording can have on the structural validity of psychological measures. Furthermore, results of the current study support the creation of multi-subscale self-report psychological measures that contain items that are all consistent in orientation, and that the inclusion of semantically opposing items within the one measure in an attempt to guard against acquiescence bias is not justified. The use of semantically opposing positive item wording in previous studies using the TAI-G may have resulted in method effects, whereby participant response style influenced the endorsement of positively worded items. For example, self-conscientiousness and fear of negative evaluation have been shown to be related to negative item endorsement (DiStefano & Motl, 2006), which are also related characteristics of TA (Zeidner, 1998). Therefore, by wording the Lack of Confidence subscale positively, it could be expected that these items may be endorsed differently by those higher in TA than the negatively coded scales, reducing interscale relationships and structural validity. Furthermore, the same item orientations between the Lack of Confidence and Self-Efficacy measures in previous studies (Hodapp & Benson, 1997; Keith et al., 2003) may have caused an upward relationship bias.
In contrast to previous findings, the decision to include a Self-Efficacy factor in TA measurement should be a theory-driven process as no significant differences were observed between the four-factor, 17-item model, and Self-Efficacy models. However, it should be recognized that Self-Efficacy had a notably weaker loading on TA when compared with the subscales of the TAI-G. The revised TAI-G provides a measure that offers greater validity and is more in alignment structurally with theory underlying the TAI-G due to the influence of item orientation becoming consistent among all four subscales. This may afford researchers and practitioners alike greater accuracy when providing assessment, intervention, and exploring the role of confidence in TA relationships.
Although this study has significantly contributed to the extant research investigating both the structural validity of the TAI-G specifically, and item orientation in self-report scales generally, the following study limitations require mention. Recruitment of an additional sample to complete the original Lack of Confidence subscale along with the additional measures would have allowed more direct comparisons with the TAI-G containing the Lack of Confidence–Revised subscale. Moreover, it is difficult to make accurate comparisons with previous studies regarding the models involving self-efficacy as different items were used to measure self-efficacy in each instance. For example, Hodapp and Benson (1997) used only four items of an older version of the GSE, and the items used were modified to relate more to academic self-efficacy. Similarly, Keith et al. (2003) used a different self-efficacy scale designed to specifically measure study related self-efficacy. Therefore, although the results show different outcomes to previous findings, they must be interpreted with caution as findings may be an artifact of the different self-efficacy measures used.
Future research may use designs that directly compare a positive and negative worded version of the TAI-G or similar measures, as research has indicated negatively worded items have poorer psychometric functionality when compared with positive worded items (Sliter & Zickar, 2014). Implications for practitioners include using caution when comparing subscales with semantically opposing items from the same measure due to variability in scores caused by method effects. These findings may also guide researchers considering incorporating semantically opposing items at the risk of reduced validity. Test developers must also consider whether including semantically opposing items are even necessary to guard against acquiescence bias in most assessment situations. In this particular case, test takers of the TAI-G can be expected to be willing participants, making the use of such methods largely impertinent and even harmful.
Despite these limitations, the 17-item TAI-G appears to be a valid and reliable measure of TA, with it being found to be superior to the other models tested. Moreover, semantically opposing items seem to be detrimental to psychometric properties. The re-coding of the Lack of Confidence subscale improved the structural validity and interscale relationships of the TAI-G when these items were orientated in the same direction as the remaining subscales. Consequently, it is suggested that future studies incorporate the revised negatively coded Confidence subscale when using the TAI-G. Finally, it is suggested that practitioners and researchers use caution when using semantically opposing items due to the potential loss of reliability and validity that can result.
Footnotes
Appendix
Declaration of Conflicting Interests
The author(s) declared no potential conflicts of interest with respect to the research, authorship, and/or publication of this article.
Funding
The author(s) received no financial support for the research, authorship, and/or publication of this article.