
Abstract
This study examined the psychometric properties of the Achievement Goal Questionnaire–Revised (AGQ-R) in a sample of Singapore secondary students (N = 1,171). Confirmatory factor analyses provided support for the AGQ-R in measuring the four achievements goals delineated in the 2 × 2 framework. Measurement invariance across ethnic groups was supported via multigroup analysis. Multidimensional Rasch analysis revealed that only one item on the instrument showed a slight misfit, and the distribution of items also matched reasonably well with students’ achievement goals levels, though there were some students on the upper end of the continuum whose positions were not well-covered. Examination of the 5-point rating scale showed that while the response categories demonstrated monotonicity, two of the lower categories were not clearly differentiated. These findings suggest that the AGQ-R has adequate psychometric properties for use with school-aged students in Singapore, but a rating scale with fewer categories should be considered.
Keywords
One of the most prominent and dominant motivational theories to explain the purpose behind individual’s achievement or competence-related behavior is the theory of achievement goals (Elliot, 1999; Maehr, 1984; Maehr & Zusho, 2009). Meece, Blumenfeld, and Hoyle (1988) defined students’ achievement goal orientations as a “set of behavioral intentions that determine how students approach and engage in learning activities” (p. 514). Traditionally, goal theorists have emphasized two primary dichotomous goal orientations which differ in terms of the referent used for the evaluation of competence (Elliott & Dweck, 1988; Nicholls, 1984): mastery goals that focus on developing absolute or intrapersonal competence via task mastery, and performance goals that focus on demonstrating normative competence via comparison with others (Elliot & Thrash, 2001). The more contemporary trichotomous (Elliot & Church, 1997) and 2 × 2 (Elliot & McGregor, 2001) models of achievement goals, which include a distinction between approach and avoidance forms of achievement motivation, also concern whether the energization and direction of achievement behavior are oriented toward the attainment of competence or the avoidance of incompetence (Thrash & Hurst, 2008). The 2 × 2 achievement goal framework (Elliot & McGregor, 2001) differentiated between approach and avoidance tendencies within both mastery and performance goals which yielded four distinct achievement goals that differ in terms of both definition and valence: mastery-approach goals (MAPG) that focus on achieving success via the development of task mastery and intrapersonal competence, performance-approach goals (PAPG) that focus on attaining success by demonstrating interpersonal competence (i.e., outperforming others), performance-avoidance goals (PAVG) that focus on avoiding the demonstration of interpersonal incompetence or being outperformed by others, and mastery-avoidance goals (MAVG) that focus on avoiding intrapersonal or task incompetence and failure.
Measurement of Achievement Goals in the 2 × 2 Framework
The Achievement Goal Questionnaire (AGQ; Elliot & McGregor, 2001) is a 12-item self-report instrument developed to assess the four achievement goals (four subscales) delineated in the 2 × 2 conceptual framework described above. The AGQ–Revised (AGQ-R) was later proposed by Elliot and Murayama (2008) to rectify various problems (concerning the correspondence of items to the conceptual foundation of the 2 × 2 framework) identified in the AGQ and other existing measures of achievement goals. Based on undergraduate students from a university in the United States, Elliot and Murayama utilized confirmatory factor analysis (CFA) to validate the factor structure of the AGQ-R. The purpose was to determine whether the 2 × 2 framework represents a better fit to the data than other dichotomous (Elliott & Dweck, 1988; Nicholls, 1984) and trichotomous (Elliot & Church, 1997) frameworks. Six alternative models were tested: (a) Trichotomous Model A, in which the mastery-approach and mastery-avoidance factors were combined into a single factor; (b) Trichotomous Model B, in which the performance-approach and performance-avoidance factors were combined into a single factor; (c) Trichotomous Model C, in which the mastery-avoidance and performance-avoidance factors were combined into a single factor; (d) Trichotomous Model D, in which the mastery-approach and performance-approach factors were combined into a single factor; (e) a mastery–performance model, in which the mastery-approach and mastery-avoidance factors were combined into a single factor, and the performance-approach and performance-avoidance factors were combined into another factor; and (f) an approach–avoidance model, in which the mastery-approach and performance-approach factors were combined into a single factor, and the mastery-avoidance and performance-avoidance factors were combined into another factor.
Elliot and Murayama’s (2008) CFA results revealed that the fit of the 2 × 2 model of achievement goals was superior to all six other alternative models tested. All AGQ-R items loaded strongly (ranging from .73 to .93) onto their respective factor, and the four subscales demonstrated high levels of internal consistency (Cronbach’s α ranged from .84 to .94). The positive and moderate inter-correlations detected between the four goals (ranged from .13 to .68) suggested that they represent empirically distinct constructs. Results also indicated that goals sharing a common definition appeared to be more strongly related than goals sharing a common valence. Other than in Western settings where it was developed, the validity of the AGQ-R has also been tested on university students in the Asian setting (C. Chen, 2015). Adopting the same validation procedure as Elliot and Murayama, C. Chen’s (2015) results have also shown that the 2 × 2 model structure provided better fit in their Chinese university student sample than the six alternative models. But unlike Elliot and Murayama which found stronger correlations between goals sharing a common definition, moderate inter-correlations (ranged from .47 to .65) were detected between all four achievement goals.
Although initially designed to assess undergraduate students’ goal orientations in the higher education setting, the AGQ-R has also been used with students in the primary and secondary school settings (e.g., Bernacki, Aleven, & Nokes-Malach, 2014; Carr & Marzouq, 2012). But despite its growing use in younger students, few studies actually exist which have properly investigated the applicability of the AGQ-R in these populations. One of the very few studies, if not the only one, is that of Hart, Mueller, Royal, and Jones (2013). Hart et al. evaluated the psychometric properties of the AGQ-R in African American high school students in the United States. Even though their CFA showed that the 2 × 2 model structure provided the best fit to the data in comparison with the six alternative models tested, still the fit of this model in both rural and urban student samples did not meet the criteria for an adequate model fit. Moreover, all four achievement goals were found to be very highly correlated with each other (e.g., mastery-approach and performance-approach: r = .89; performance-approach and performance-avoidance: r = .88). Thus, their results did not provide sufficient statistical support for the four-factor model on their high school samples.
Importance of Cross-Cultural Validation of Achievement Goal Measures
Very few empirical studies have investigated Singapore students’ achievement goals based on the 2 × 2 model framework. This limited body of research conducted in different educational contexts (e.g., physical education, project work) has shown that the four-factor model structure can be generalized to Singapore students (Liu, Wang, Tan, Ee, & Koh, 2009; Wang, Biddle, & Elliot, 2007). Findings from these studies have also consistently identified moderate and positive inter-correlations between the four achievement goals.
Unlike most countries, Singapore is a racially heterogeneous city-nation comprising three major ethnic groups (Chinese, Malay, and Indian). Although living in the same country, these three ethnic populations do come from markedly different cultural and linguistic backgrounds (Ooi, 2006). According to Murayama, Elliot, and Friedman (2012), past empirical studies (e.g., Maehr & Nicholls, 1980) have shown that competence-relevant words such as “success,” “failure,” and “learn” have different connotations in different countries, and cross-cultural differences in achievement goals “may emerge as a function of distinct worldviews promoted within each culture” (p. 201). Although English is the medium of instruction in Singapore schools, but if cultural differences can indeed lead to systematic differential responding to questionnaire items, then failing to consider cultural or ethnic variations in validation studies based on Singapore samples may well result in biased items and inaccurate scales. Thus, for any instrument to be validly used in the Singapore education setting, an empirical test of items and scale equivalence across ethnic groups should be conducted to ensure that the measures are comparable across groups. As far as we know, no prior studies have conducted such validation analysis of achievement goal measures in Singapore.
The Present Study
Review of existing work has revealed a paucity of research among Singapore school-aged students’ achievement goals based on the 2 × 2 model framework. This might be due to the lack of validation studies evaluating 2 × 2 achievement goal measures among Singapore students. The aim of the present study was to extend the current achievement goal validation literature by investigating the psychometric properties of the AGQ-R for use with Singapore secondary students. To validate the AGQ-R as a multidimensional measure of the four achievement goals (with four subscales) delineated in the 2 × 2 framework, we adopted the same validation strategy as Elliot and Murayama (2008) and conducted CFAs to evaluate the fit of the four-factor model in comparison with the six alternative models previously described. As results from past validation studies of the AGQ-R (C. Chen, 2015; Elliot & Murayama, 2008; Hart et al., 2013) have all provided strong support for the superiority of the four-factor model structure over the six alternative competing models, a similar finding was hypothesized for our Singapore student sample.
As discussed earlier, Singapore is a multi-ethnic country with a diverse cultural mix. The examination of ethnic group invariance in instrument validation is thus crucial to ensure that the measures are equivalent for our students of different ethnic backgrounds. Hence, a multigroup CFA was also conducted in this study to assess the invariance of the measurement model across the three main ethnic groups (Chinese, Malay, and Indian) comprising our sample. But given the lack of prior studies which have investigated this issue with achievement goal measures in Singapore students, this analysis was purely ancillary, and no hypothesis was made regarding the measurement invariance properties of the AGQ-R across the various ethnic groups.
Recently, more researchers have begun to apply item response theory (also known as modern test theory) methods to validate achievement goal measures (Hart et al., 2013; Muis, Winne, & Edwards, 2009; Pastor & RiCharde, 2003). Literature (e.g., Reise & Henson, 2003; Thomas, 2011) has indicated that item response theory approaches such as Rasch analysis which focus on the quality of items in measuring the underlying construct are valuable complements to classical test theory approaches (e.g., factor analysis and internal consistency analysis). The Rasch probabilistic model relates item difficulty to person ability by placing both items and persons on the same logit scale (Bond & Fox, 2007), thus making it possible to determine how well the items target the ability of the sample and whether they provide an adequate spread along the dimension of measurement. Rasch modeling also allows for the investigation of the functioning of the response scale categories and the unidimensionality of items within a scale, thereby offering more in-depth insights into the properties of the items and the scale that are not possible with classical test theory approaches (Wright & Mok, 2000). Hart et al.’s (2013) Rasch analyses of the AGQ-R with African American high school students, for example, have found that the lower end categories of the 5-point response scale were underutilized by their students. From their examination of the person and item distributions, they were able to determine that the low probability of endorsement for certain response categories was likely due to the fact that the 12 AGQ-R items were all rather easy for their students to endorse. In the present study, Rasch analysis was also used to examine how well the difficulty levels of the AGQ-R items match with our school-aged Singapore students’ abilities (i.e., achievement goals). The unidimensionality of the items within the achievement goal subscales and the functioning of the rating scale categories were also explored. On the basis of Hart et al.’s findings in their similarly aged sample, we hypothesized that the same psychometric concerns would be identified among our Singapore students.
Method
Sample
The sample consisted of 1,171 Secondary 3 students (582 boys and 589 girls) from 10 Singapore schools, with an average age of 15.38 years (SD = .42). Approximately 78.1% of the students were Chinese, 13.3% were Malay, 5% were Indian, and 3.6% were of other ethnicities.
Measure
The 12-item AGQ-R (Elliot & Murayama, 2008) was used to assess students’ MAPG, MAVG, PAPG, and PAVG in the general school setting. Each of these goals was measured by three items, with the following sample items (paraphrased) for MAPG (“It is my goal to learn as much as I am capable of learning”), MAVG (“It is my aim to avoid learning less than I am capable of learning”), PAPG (“It is my goal to outperform other students”), and PAVG (“It is my goal to avoid being outperformed by other students”). Students were asked to give a response to each item on a 5-point rating scale ranging from 0 (strongly disagree) to 4 (strongly agree).
Procedures
The measure was administered during regular class sessions coordinated with help from teachers. Students were briefed on the nature of the questionnaire, and confidentiality of responses was assured. Parental consent and student assent were obtained from all participants.
Results
CFA
A CFA with robust maximum likelihood (MLR) estimation was conducted using Mplus 7.3 (Muthén & Muthén, 2014) to examine the fit of the four-factor model structure of the AGQ-R in our Singapore student sample. CFAs of the six alternative competing model structures described in the introduction were also conducted, namely, the four trichotomous models A through D and the two dichotomous mastery–performance and approach–avoidance models. A combination of indices were used to assess how well the models fit the data, including the comparative fit index (CFI: >.90 acceptable fit, >.95 excellent fit; Bentler, 1990; Bentler & Bonett, 1980), the root mean square error of approximation (RMSEA; <.08 acceptable fit, <.05 excellent fit; Brown & Cudeck, 1992), the standardized root mean square residual (SRMR; <.08 acceptable fit, <.05 excellent fit; Bollen, 1989), the Akaike information criterion (AIC; Akaike, 1974), and the sample-size adjusted Bayesian information criterion (BIC; Sclove, 1987). The AIC and adjusted BIC indices are comparative measures of fit and are only meaningful when two or more models are compared. Models with smaller AIC and adjusted BIC have better fit.
As shown in Table 1, a comparison of fit indices suggested that the hypothesized 2 × 2 achievement goal model yielded the best fit among the seven models tested. CFAs based on our sample provided strong support for the hypothesized four-factor model of achievement goals, χ2(48) = 207.60, p < .001, CFI = .947, RMSEA = .053, SRMR = .055. As can be seen in Figure 1, all items loaded significantly onto their respective latent factor, with standardized factor loadings ranging from .42 to .85. The latent bivariate correlations between the four goal orientations ranged from .35 to .71, which suggested that the four achievement goals were fairly distinct. Similar to previous studies (e.g., C. Chen, 2015; Liu et al., 2009; Wang et al., 2007), positive and moderate inter-correlations were detected between all four goals.
Fit Statistics for the Hypothesized 2 × 2 Model and the Six Alternative Models.
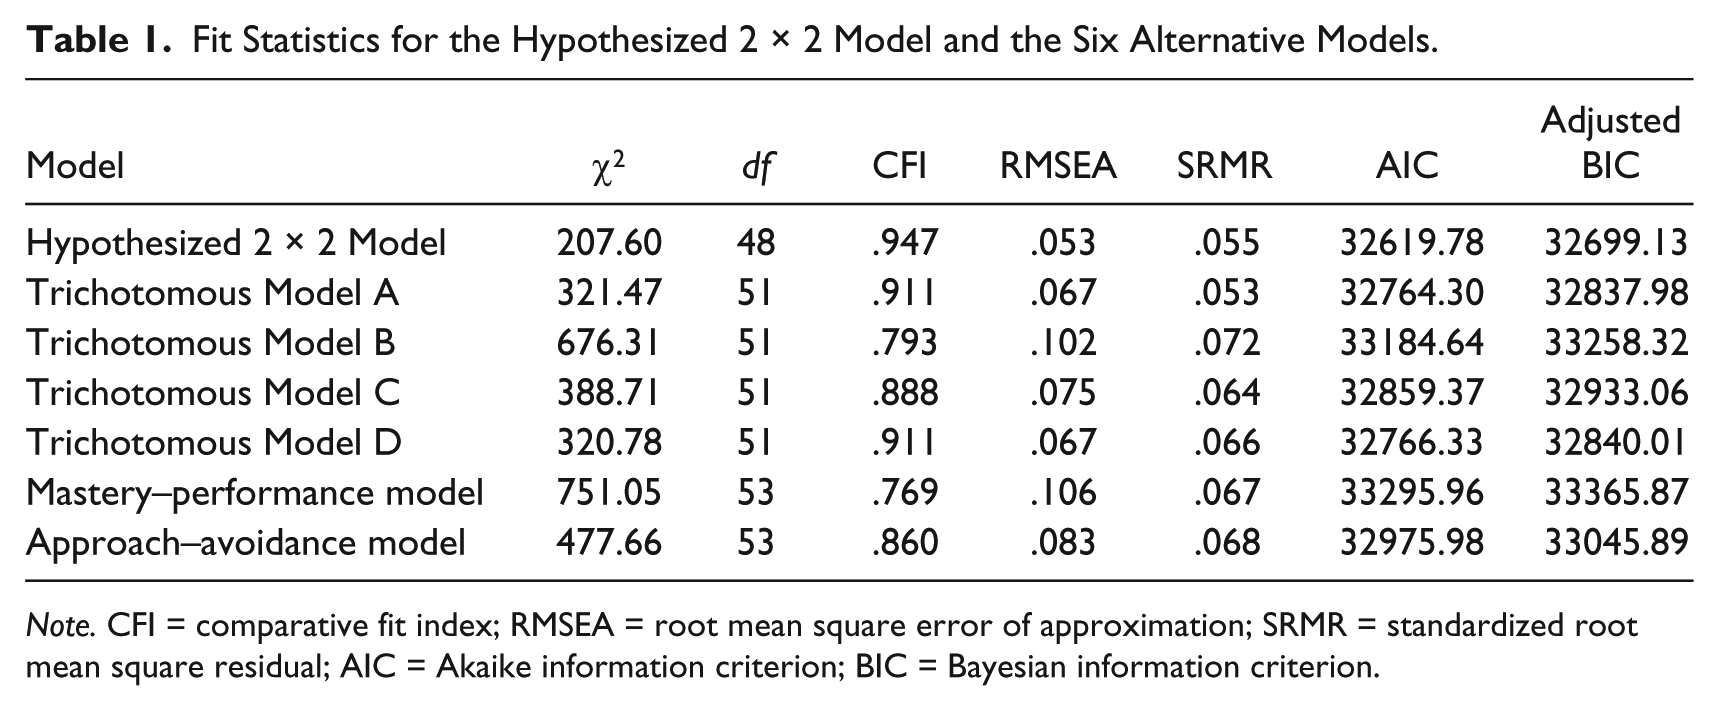
Note. CFI = comparative fit index; RMSEA = root mean square error of approximation; SRMR = standardized root mean square residual; AIC = Akaike information criterion; BIC = Bayesian information criterion.
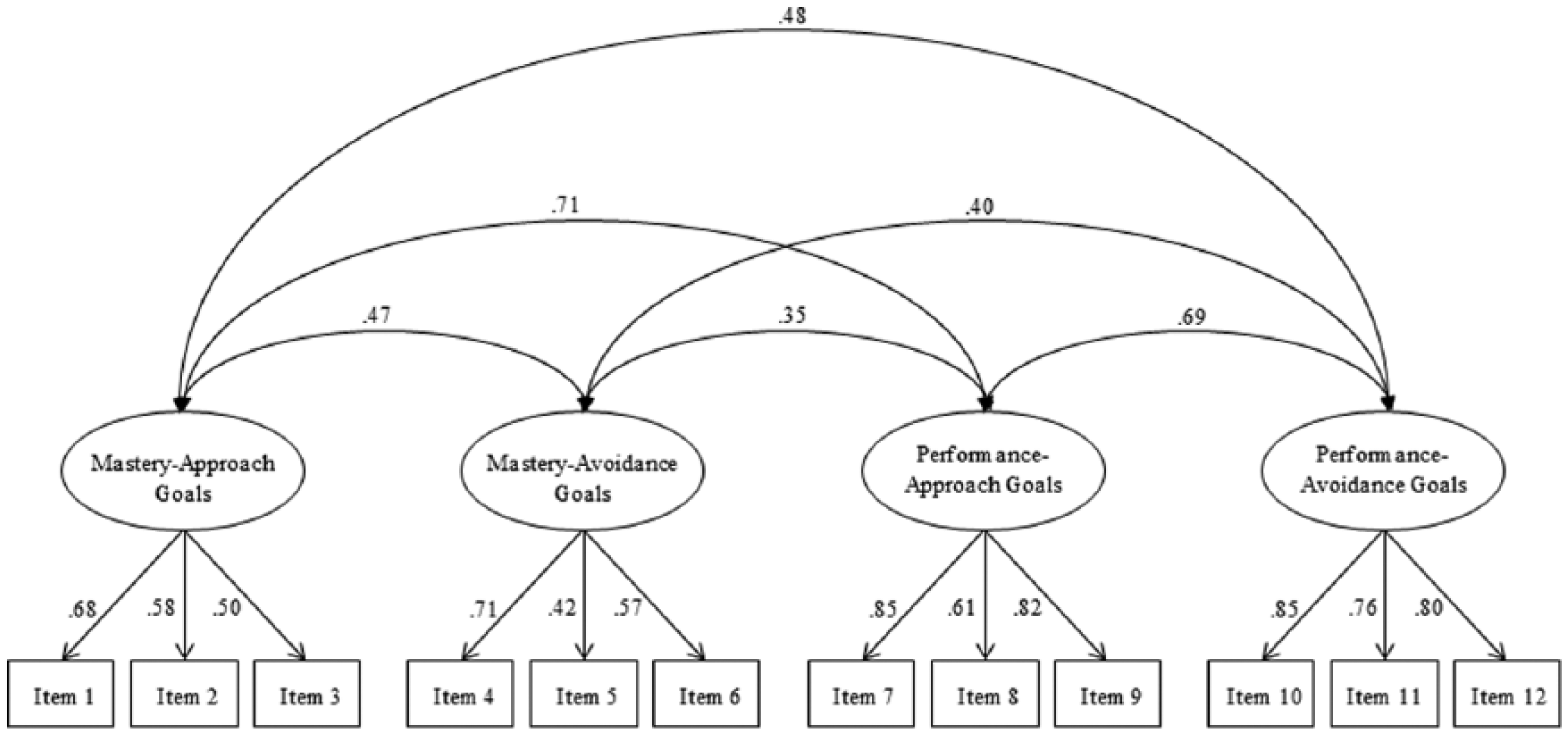
Confirmatory factor analysis of the 2 × 2 achievement goal model.
To assess the internal consistency reliability of the four-factor AGQ-R, the composite reliability estimate (ρ) was computed for each of the four subscales. Unlike Cronbach’s alpha which is often considered a lower bound estimate (underestimate) of reliability (Graham, 2006), the composite reliability computed based on the factor loadings estimated by CFA is generally acknowledged as a better measure of internal consistency (Bagozzi & Yi, 1988). Composite reliabilities range between 0 and 1 and values larger than .60 are typically regarded as acceptable (Bagozzi & Yi, 1988). For the four AGQ-R subscales, the composite reliabilities were .62 for MAPG, .60 for MAVG, .81 for PAPG, and .84 for PAVG. Although these results indicated acceptable reliabilities for the four subscales, it is important to note that the slightly lower reliability estimates detected for MAPG and MAVG might relate in part to the small number of items constituting each subscale.
Multigroup Measurement Invariance
Multigroup CFA was used to assess measurement invariance of the AGQ-R across the three major ethnic groups in the sample (Chinese, Malay, Indian). Configural invariance (invariant factor structure across groups), metric invariance (invariant factor loadings across groups), and scalar invariance (invariant factor loadings and intercepts across groups) were evaluated by the fitting of a series of nested models via imposing constraints on the model parameters. Although the chi-square difference test is conventionally used to compare between nested models, Bentler and Bonett (1980) have shown that the change in chi-square (Δχ2) is nearly always large and statistically significant for large sample size. Therefore, change in CFI (ΔCFI), change in RMSEA (ΔRMSEA), and change in SRMR (ΔSRMR) which are less sensitive to model complexity and sample size were also considered in addition to the chi-square difference test. 1 Following F. F. Chen’s (2007) recommendations, the following criteria were used to determine acceptable model fit: ΔCFI ≤ −.01, ΔRMSEA ≤ .015, and ΔSRMR ≤ .03 for test of metric invariance, and ΔCFI ≤ −.01, ΔRMSEA ≤ .015, and ΔSRMR ≤ .01 for test of scalar invariance.
As shown in Table 2, the configural invariance model (M1) appeared to provide an adequate fit to the data, χ2(144) = 383.88, p < .001, CFI = .931, RMSEA = .060, SRMR = .060. Next, a metric invariance model (M2) was fitted to the data. According to the chi-square difference test (M1 vs. M2), Δχ2 of 12.20 with Δdf = 16 was not statistically significant (p = .730). As ΔCFI, ΔRMSEA, and ΔSRMR were also within the recommended ranges, metric invariance across ethnic groups was supported. After establishing metric invariance, we then fitted a scalar invariance model (M3) to the data. Although the chi-square difference test (M2 vs. M3) showed that this model resulted in a statistically significant fit reduction (Δχ2 of 28.97 with Δdf = 16 has a p value of .024), but given that ΔCFI, ΔRMSEA, and ΔSRMR were all consistently small and were well within the recommended ranges, there were adequate statistical support for scalar invariance across ethnic groups.
Results of Measurement Invariance Tests Across Ethnic Groups.
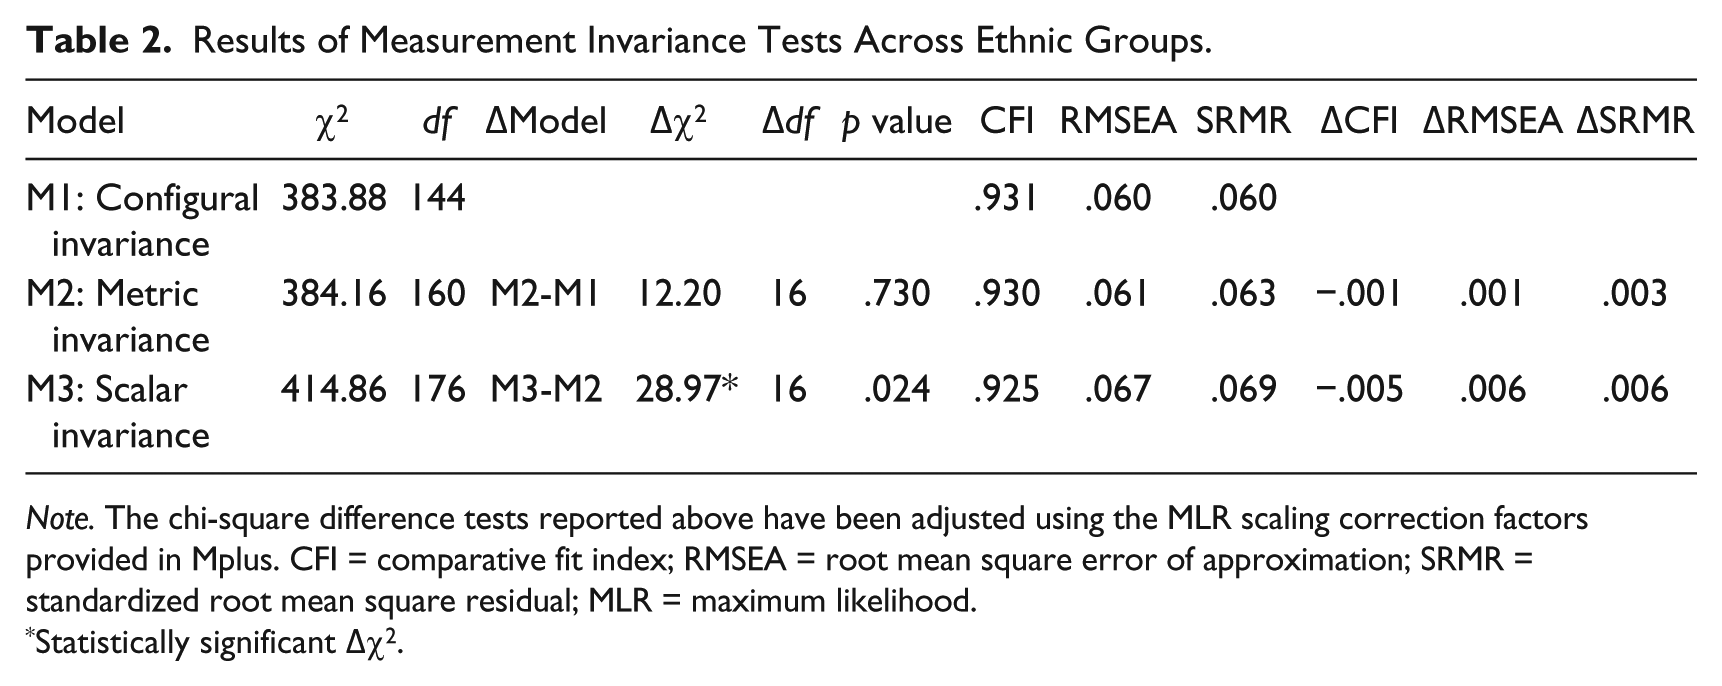
Note. The chi-square difference tests reported above have been adjusted using the MLR scaling correction factors provided in Mplus. CFI = comparative fit index; RMSEA = root mean square error of approximation; SRMR = standardized root mean square residual; MLR = maximum likelihood.
Statistically significant Δχ2.
Rasch Analysis
Unidimensionality
To examine the unidimensionality of the four individual AGQ-R subscales in measuring the four achievement goals, principal components analysis of Rasch residuals (Linacre, 1998) was conducted using Winsteps 3.80.1 (Linacre, 2013) to determine whether there exists another dimension in the residuals after the estimation of the primary measurement dimension. According to Linacre (2004), a scale is regarded as unidimensional if the primary Rasch dimension explains a substantial portion of the variance (>40%) and the first contrast has an eigenvalue less than or equal to 2. As shown in Table 3, analysis of the individual subscales revealed that all four subscales had >40% of the variance explained by the Rasch dimensions, and that all first contrasts had eigenvalues less than 2. This suggested that the four subscales can be regarded as unidimensional.
Results From Principal Components Analysis of Rasch Residuals.
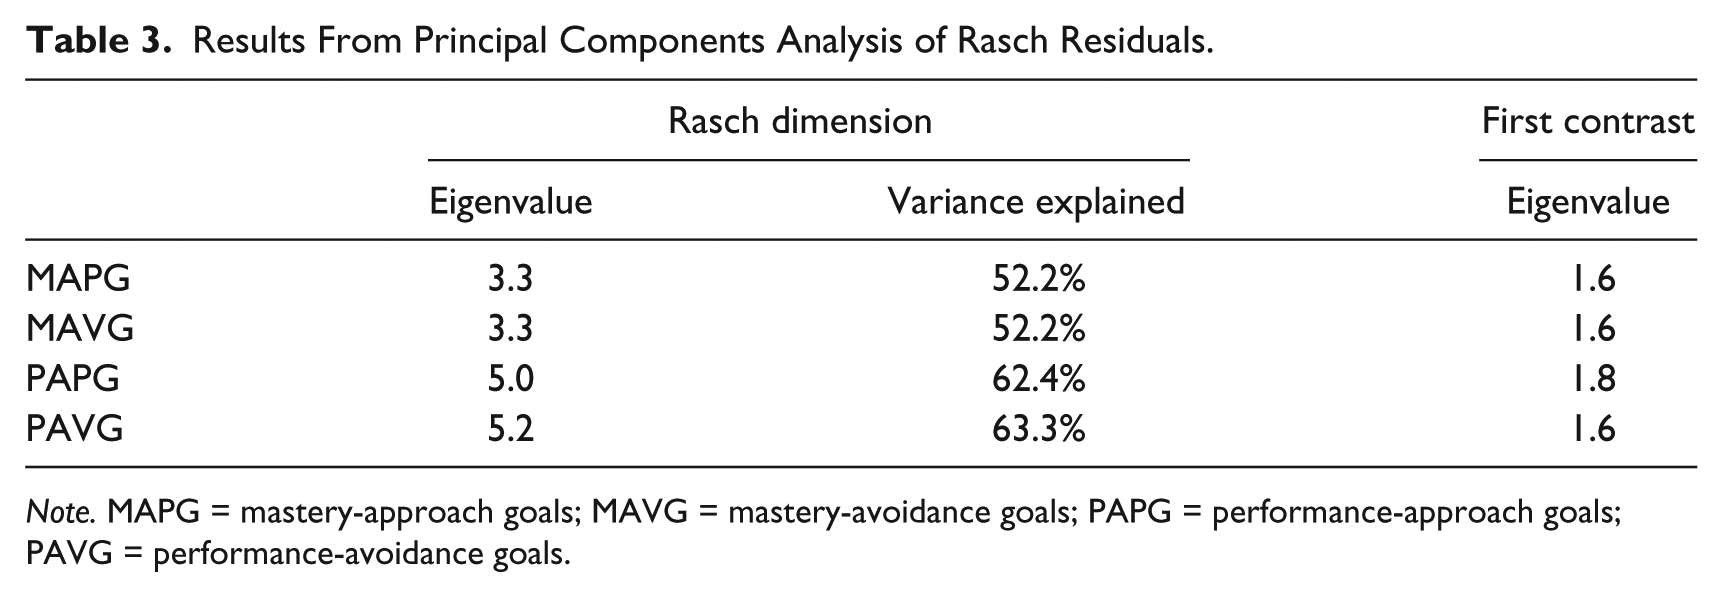
Note. MAPG = mastery-approach goals; MAVG = mastery-avoidance goals; PAPG = performance-approach goals; PAVG = performance-avoidance goals.
Rating scale category functioning
To examine the rating scale structure, Linacre (2002) suggested the following essential criteria: (a) each response category must have a frequency count of at least 10, (b) average measures by category must advance monotonically up the rating scale, (c) each response category should have outlier-sensitive mean square (outfit MNSQ) <2, (d) step calibrations (distance between ratings) must increase monotonically, and (e) advance in step difficulties between step calibrations must be at least 1 logits (for a five-category rating scale) but less than 5 logits. As shown in Table 4, although each response category had frequency count greater than 10, category 0 (strongly disagree) had an outfit MNSQ of 2.03, which is an indication of a slight misfit. While the average category measures and the step calibrations increased monotonically, the advance between Step Calibrations 1 and 2 was only a mere 0.43 logits, less than the acceptable level of 1 logits for a 5-category rating scale. As can be seen from the probability curves for the five categories (Figure 2), the Response Categories 1 and 2 were clearly not well differentiated. In such a situation, Linacre (2002) suggested that it would be desirable to examine the possibility of redefining or combining the response categories (Linacre, 2002).
Rating Scale Category Fit Statistics.
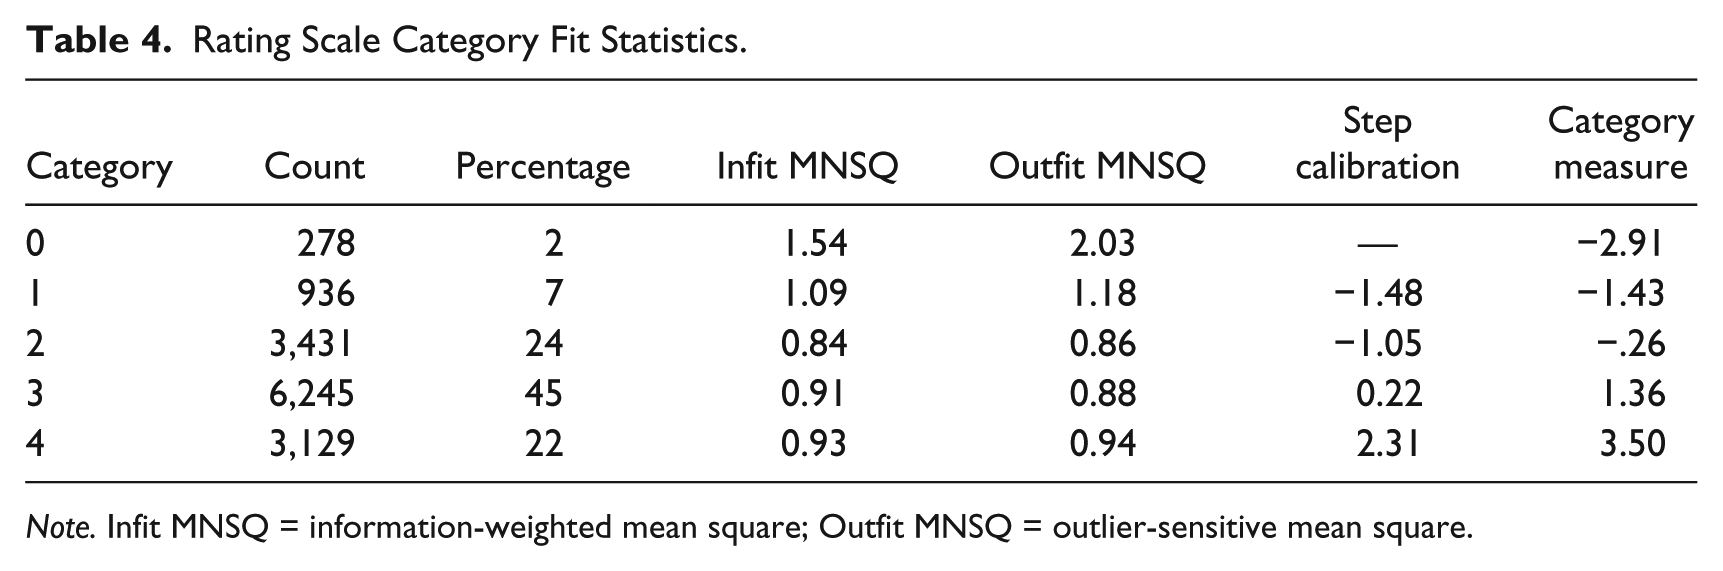
Note. Infit MNSQ = information-weighted mean square; Outfit MNSQ = outlier-sensitive mean square.
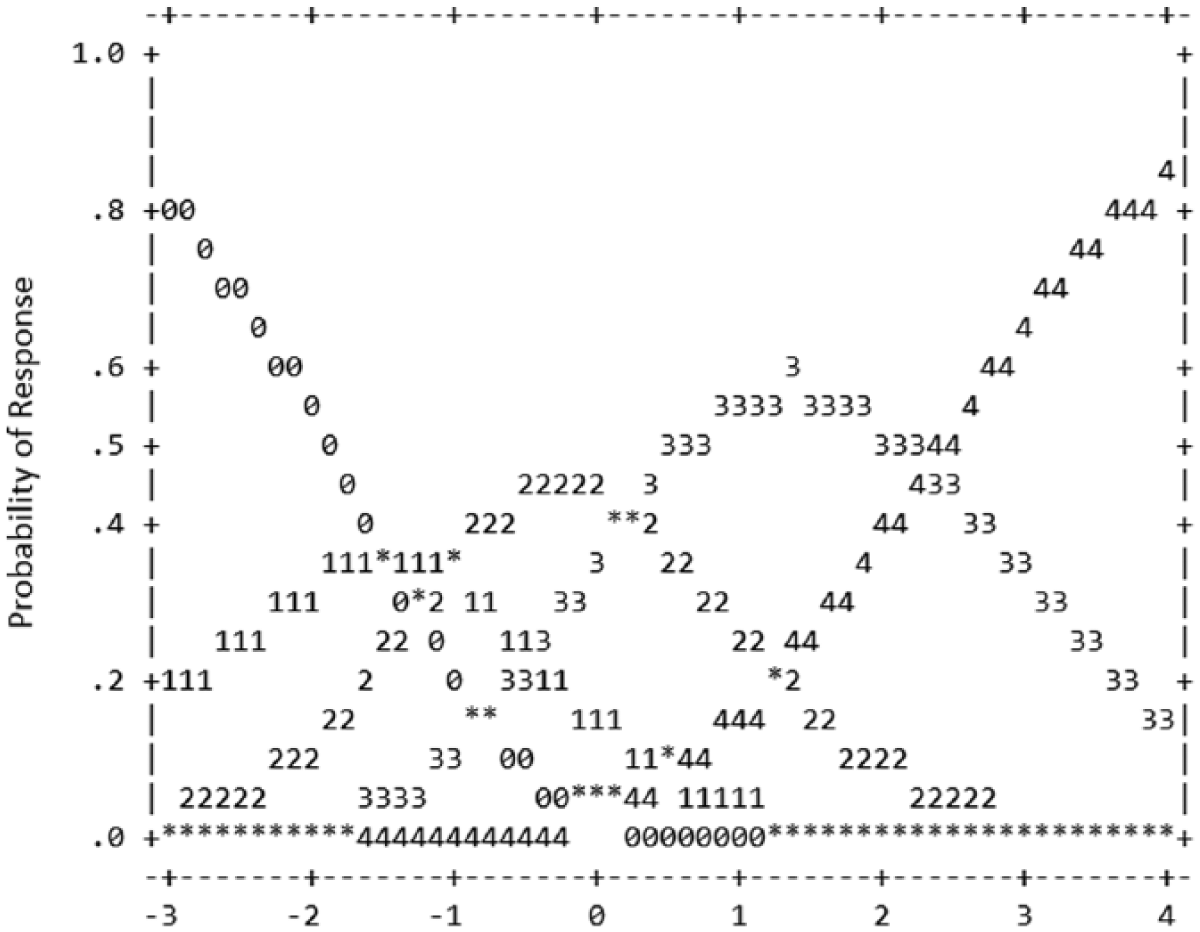
Probability curves for the 5-category rating scale.
Item fit
The 12-item AGQ-R was treated as a multidimensional measure comprising four unidimensional subscales, and a multidimensional Rasch rating scale model was fitted to the data using the ConQuest software (Wu, Adams, Wilson, & Haldane, 2007). The person separation reliability (the Rasch analogue to Cronbach’s alpha) for the four subscales were all acceptable (MAPG: .75; MAVG: .70; PAPG: .84; PAVG: .81). The item-separation reliability was .99 for MAPG and MAVG, .92 for PAPG, and .93 for PAVG, which also indicated sufficient spread of items. The information-weighted (infit) and outlier-sensitive (outfit) MNSQ statistics were used to examine the quality of the individual AGQ-R items in measuring the corresponding achievement goal construct. Compared with the unweighted outfit statistic which is more sensitive to outliers, the weighted infit statistic is more sensitive to inconsistencies in the non-extreme responses. Infit and outfit MNSQ statistics both range from zero to positive infinity, and a value of 1 is indicative of a perfect fit to the Rasch model. According to Wright and Linacre (1994), infit and outfit values between 0.6 and 1.4 are considered acceptable and reflect adequate model-data fit. As shown in Table 5, the infit MNSQ statistic for all 12 AGQ-R items lied within the acceptable 0.6 to 1.4 range. In terms of outfit MNSQ, one of the constituent items of the MAVG subscale (Item 6, which corresponds to AGQ-R Item 9 in Elliot & Murayama, 2008) had an outfit MNSQ of 1.43, which was just slightly outside the acceptable range. This is indicative of a slight mismatch between person ability and item difficulty for some extreme responses. Nevertheless, large outfit values are generally considered less problematic and of less concern than large infit values (Bond & Fox, 2007).
Item Estimates, Standard Errors, Infit MNSQ, and Outfit MNSQ.
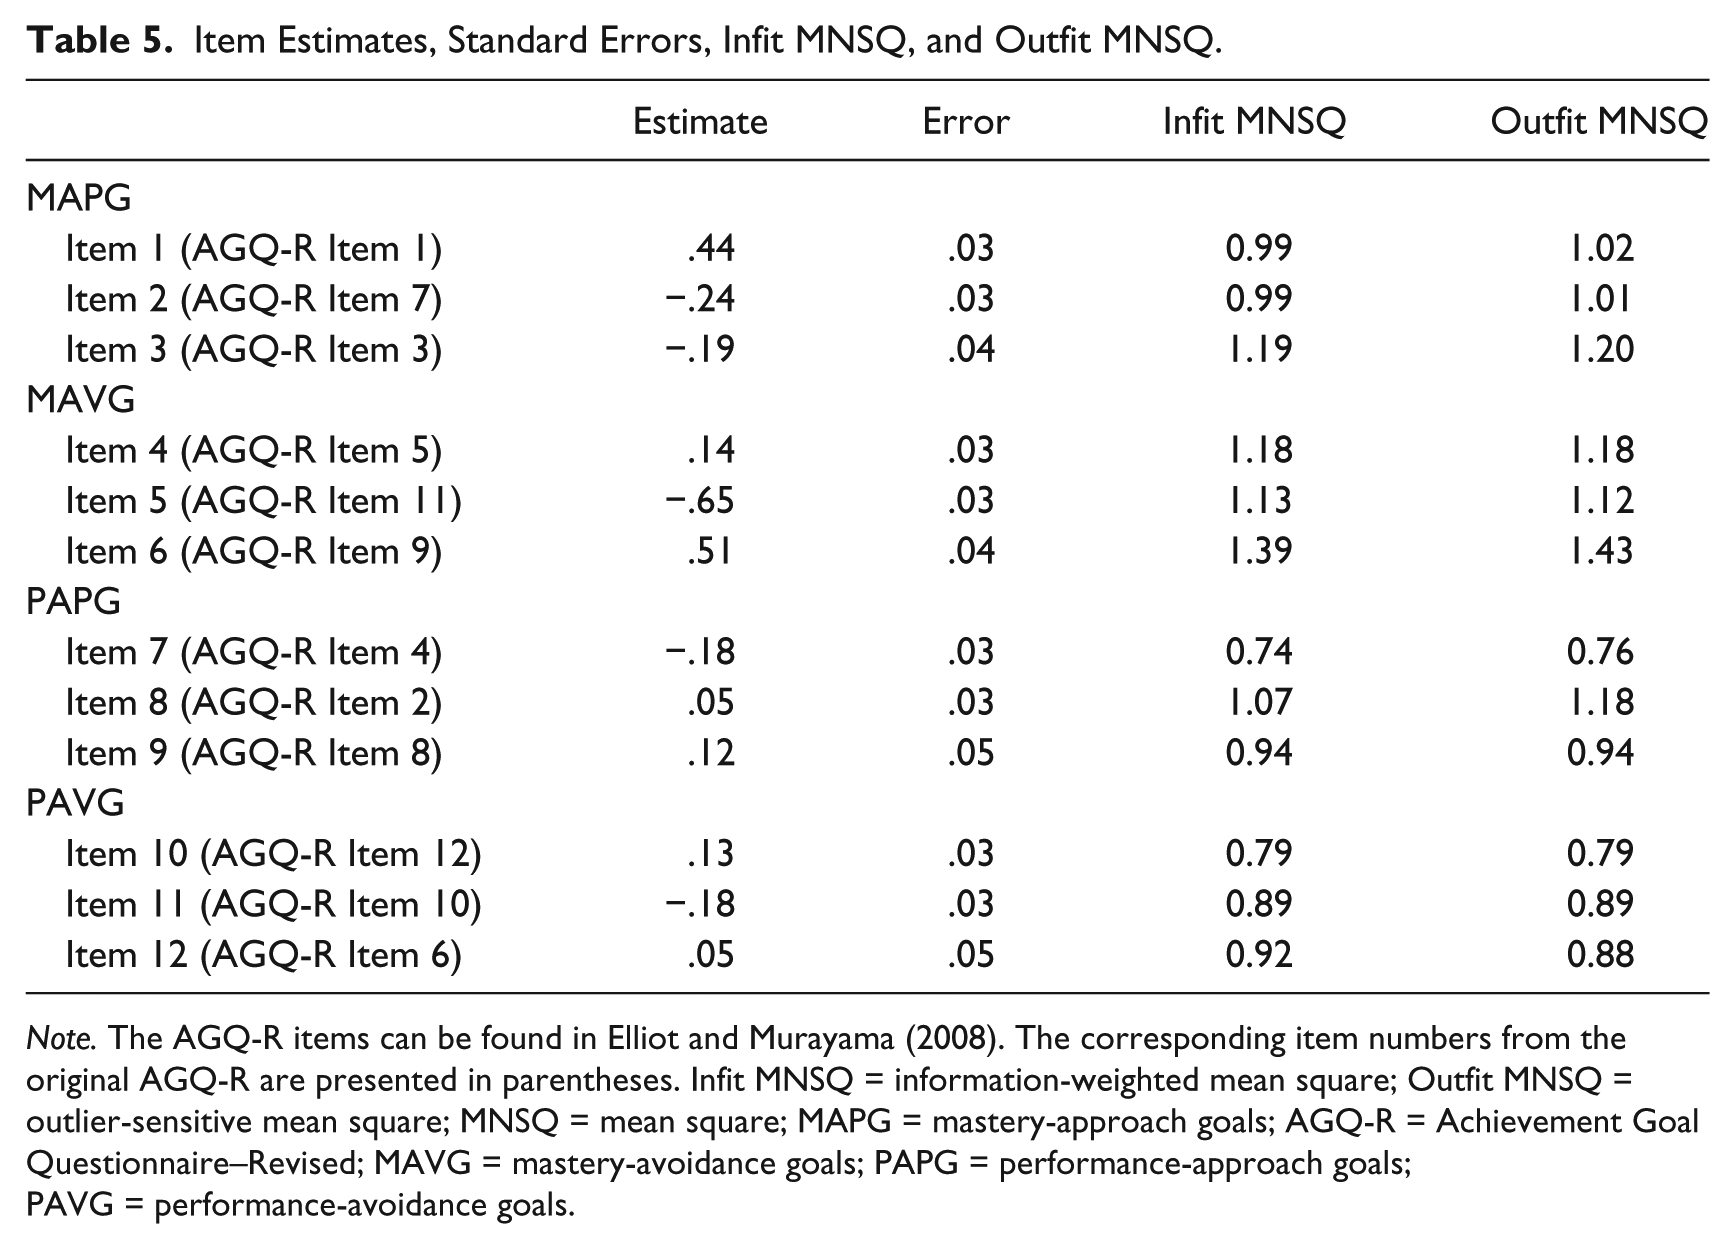
Note. The AGQ-R items can be found in Elliot and Murayama (2008). The corresponding item numbers from the original AGQ-R are presented in parentheses. Infit MNSQ = information-weighted mean square; Outfit MNSQ = outlier-sensitive mean square; MNSQ = mean square; MAPG = mastery-approach goals; AGQ-R = Achievement Goal Questionnaire–Revised; MAVG = mastery-avoidance goals; PAPG = performance-approach goals; PAVG = performance-avoidance goals.
Item and person distribution
The item-person map (Wright map) which displays person, item, and threshold estimates on the same scale is presented in Figure 3. Students’ measures in the four achievement goals dimensions are shown on the four continuums on the left side of the map, with each “x” representing 11.2 students. Students are placed on the map according to their achievement goals estimates from top to bottom (i.e., students placed at the top had the highest levels of achievement goals). The right side of the map shows the distribution of the items and item thresholds according to difficulty (i.e., the most difficult to endorse items and thresholds are placed at the top). As shown in Figure 3 and Table 5, the item difficulties ranged from −0.65 to 0.51 logits. The distribution of item difficulties showed an adequate range which matched reasonably well with students’ achievement goals levels, though there are some students on the upper end of the continuum whose positions were not assessed by any of the item response categories. Several items also had a first step threshold that did not coincide with students’ goal levels at the lower end of the continuum. As the mean of the item difficulty estimate is set at 0 logits, the mean person estimates (MAPG: 1.17 logits; MAVG: 0.92 logits; PAPG: 1.54 logits; PAVG: 2.00 logits) indicated that the questionnaire items were relatively easy to endorse for this sample of students. More items, especially for the PAPG and PAVG subscales, are thus needed at the upper end of the continuum for better construct coverage.
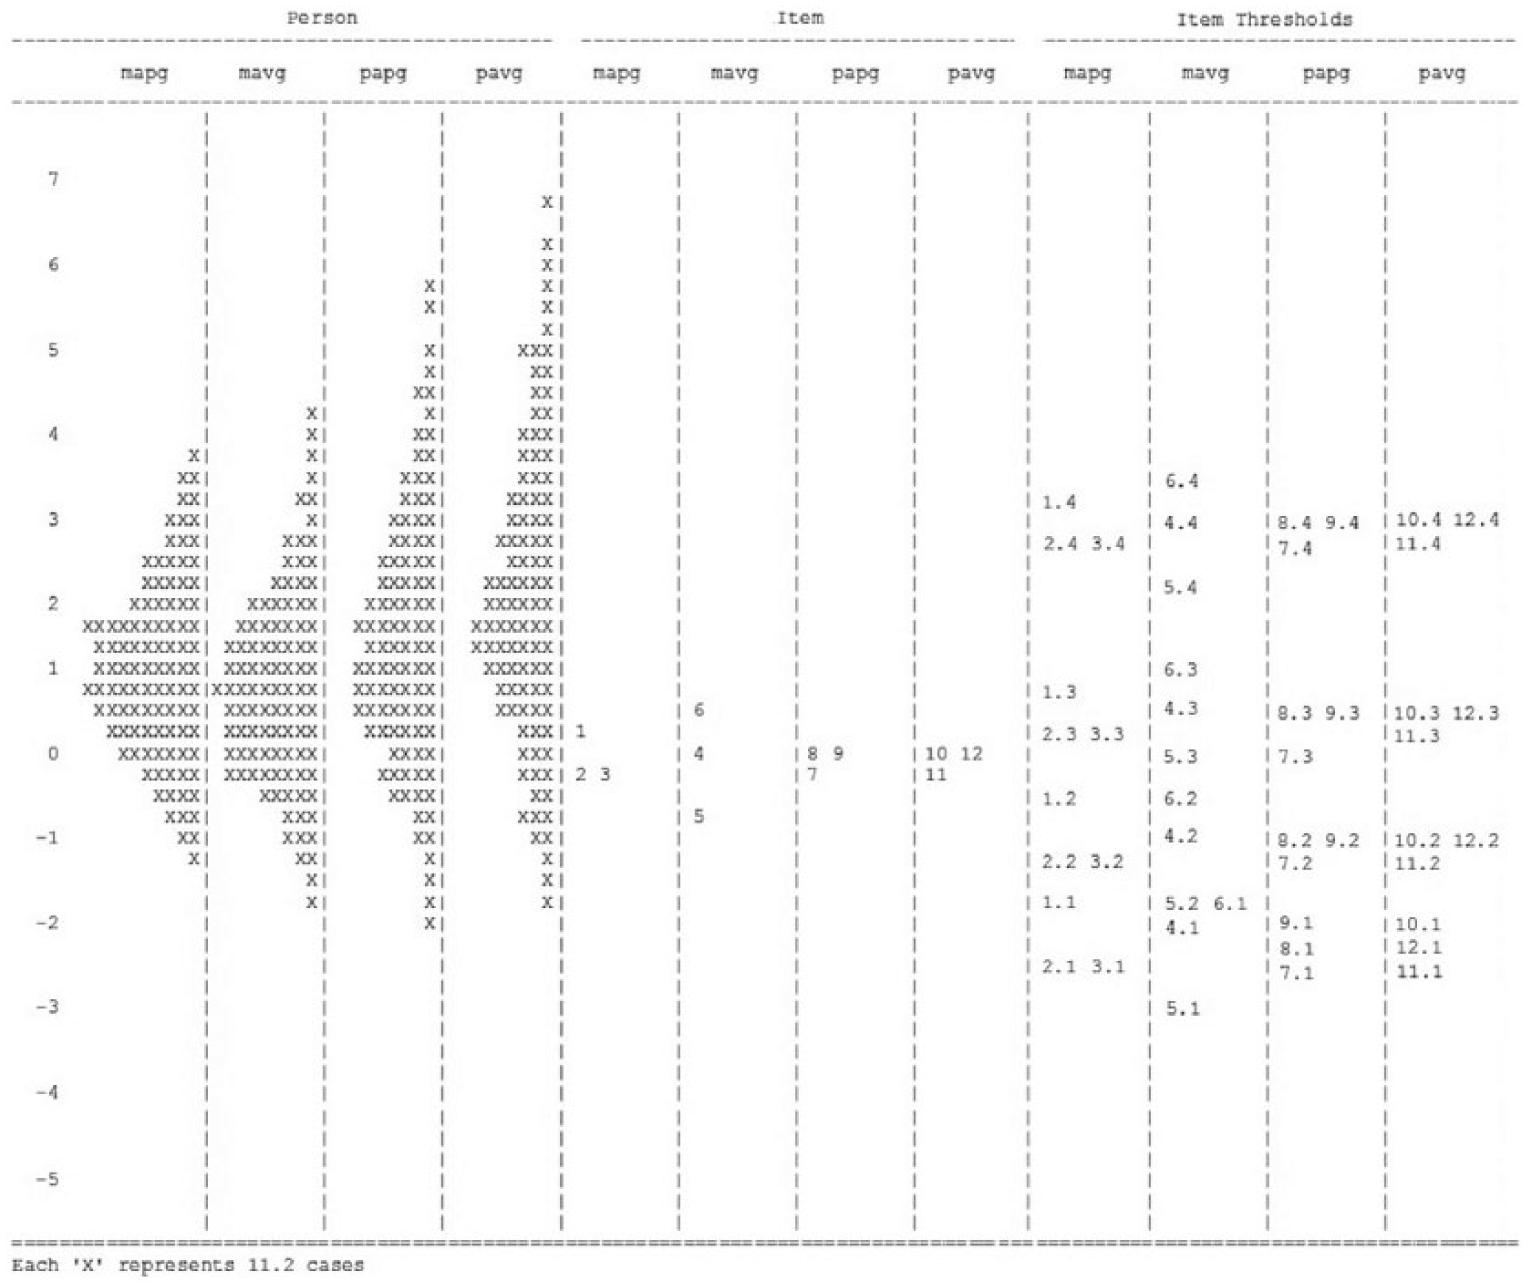
Item-person map for the 12-item AGQ-R.
Discussion
The AGQ-R (Elliot & Murayama, 2008) was originally developed to assess university students’ achievement goal orientations and was validated via factor analytic approaches based on samples from Western countries. This study explored the applicability of the AGQ-R with school-aged students in an Asian setting via a rigorous psychometric evaluation using a secondary student sample from Singapore. In contrast to Hart et al.’s (2013) study which found that the 2 × 2 achievement goal framework provided unsatisfactory fit to their two African American high school student samples from the United States, our CFAs revealed that the four-factor model provided good fit to our Singapore secondary student sample. None of the alternative dichotomous and trichotomous model frameworks tested had better fit than the four-factor model of achievement goals. The measurement invariance (scalar invariance) of the AGQ-R was also established across the three ethnic groups of Singapore students.
Our Rasch principal components analysis of residuals confirmed the unidimensionality of the four achievement goal subscales in the AGQ-R. The four subscales also demonstrated good measurement precision as denoted by adequate person- and item-separation reliabilities. Unlike Hart et al. (2013) whom detected disordered response category thresholds (i.e., the threshold estimates marking off successive categories were not in a monotonically increasing order), our analysis of the 5-point rating scale structure found that the response scale categories were used as intended (i.e., the categories advanced monotonically up the rating scale), though little differentiation was found between Response Categories 1 and 2 in step calibrations. This indicated that a response scale with fewer categories should be considered. In relation to item fit, all of the AGQ-R items showed acceptable infit MNSQ, and only one item from the MAVG subscale showed a slight misfit in terms of outfit MNSQ. Although the item difficulties showed a reasonable range and appeared to be well-targeted for this Singapore student sample, the higher end of the four achievement goal dimensions (especially the PAPG and PAVG dimensions) was not adequately covered by the items and item thresholds. This suggested that more items are required to match students’ achievement goal levels at the upper end of the continuum.
While this study has many notable strengths, there are also some limitations which must be noted. First, because the current study is based entirely on one grade of secondary students in Singapore, the results may not be generalizable to secondary students in other grades. Given that age differences in students’ endorsement of achievement goals have been shown in existing research (e.g., Kinlaw & Kurtz-Costes, 2007; Lee, Ning, & Goh, 2014), further studies are necessary to confirm the item properties, rating scale structure, and the dimensionality of the AGQ-R in more diverse student samples from different age groups. Second, although in the current literature, race, culture, and ethnicity are not well distinguished, it is obvious that individuals who share the same ethnicity do not necessarily share the same cultural background. Ning and Downing (2010), for instance, have detected cultural differences in motivation among students of the same ethnicity (Mainland Chinese and Hong Kong students). Therefore, it is uncertain whether the validation results presented in this study would generalize to Chinese, Malay, and Indian students in other countries.
With regard to the implications for practitioners, the validity of the 2 × 2 factorial structure of the AGQ-R was established in our sample of secondary students from Singapore, and our Rasch analysis also lent support to the AGQ-R items in measuring the four achievement goals. These findings thus provided further credence to the 2 × 2 conceptual model of achievement goals in which the two dimensions of competence (mastery and performance) can be explored alongside the two valence dimensions (approach and avoidance tendencies). Our results also offered empirical evidence for the use of the AGQ-R to measure these four goals among samples other than university students and in a non-Western setting. When it comes to the assessment of Singapore Secondary 3 students’ achievement goals using the AGQ-R, practitioners can be confident that the instrument has adequate invariance properties and that the measures are comparable across the three major ethnic groups of students.
Footnotes
Declaration of Conflicting Interests
The author(s) declared no potential conflicts of interest with respect to the research, authorship, and/or publication of this article.
Funding
The author(s) disclosed receipt of the following financial support for the research, authorship, and/or publication of this article: This work was supported by the Office of Education Research, National Institute of Education, Nanyang Technological University, Singapore.