






Abstract
This study examined recent technological developments in cognitive assessment and how these developments impact children’s test behavior. The study consisted of two groups: one tested with an iPad and another tested with the standard paper and pencil format of the Wechsler Intelligence Scale for Children (WISC-IV). Independent groups t tests examining the empirically based syndrome and broad scales on the Test Observation Form yielded no significant results. There did not appear to be differences in test behavior between the two groups. Overall, examiners can be more confident that whether they conduct intellectual testing via traditional paper and pencil or via iPad, children’s test behaviors do not appear to be negatively influenced by test format.
Assessing cognitive abilities requires examiners to carefully observe the performance of examinees under standardized conditions. Behavior observations during testing enable the examiner to better understand the manner in which examinees arrive at their answers, identify personal strengths and weaknesses, and judge the suitability of an examinee’s test-taking behaviors, in turn facilitating test interpretation (Oakland, Glutting, & Watkins, 2005). Developments in mobile technology have increased the availability of tools to use when working with students with disabilities (McNaughton & Light, 2013). In addition, the availability of technology for use during cognitive assessments has surged with many popular instruments available through an iPad-based platform. The present study investigated the extent to which differences in behavior exist for two groups of children: those tested with an iPad and those administered the paper and pencil format of Wechsler Intelligence Scale for Children (WISC-IV; Wechsler, 2003).
The Importance of Assessing Test Session Behaviors
Accurate observations are a valuable source of assessment data and can assist in formulating recommendations (Sattler, 2008). One advantage includes comparing demographically similar students under relatively similar conditions. Examiners can also consider the impact of specific situational factors that might influence children’s behavior in controlled settings but might not be present elsewhere. Examples include one-on-one interaction between an adult and child, response-contingent praise and encouragement, absence of peers, reduced distracting stimuli, unambiguous directions, and demonstration of task requirements (McConaughy, 2005).
It is particularly important to examine behavioral observations during cognitive testing, as intelligence tests require the examiner to strive to create conditions that allow examinees to display their best performance. Simultaneously, examiners need to remain attentive to various behaviors or external conditions that may impact an examinee’s functioning. Examinees who are not fully engaged in individually administered cognitive tests display unsuitable test behaviors, resulting in scores which underrepresent their ability (Oakland & Harris, 2009). A study by Oakland, Gulek, and Glutting (1996) suggests that as much as 20% of the variance in children’s IQ scores is associated with their test-taking behaviors. Glutting, Youngstrom, Oakland, and Watkins (1996) found that children age 6 to 16 years who displayed noncompliant test-taking behavior obtained Full Scale IQ (FSIQ) scores which were 7 to 10 points lower than those of children with compliant test-taking behavior. In another study, Heinonen, Aro, Ahonen, and Poikkeus (2011) investigated three subgroups of children with different levels of cooperation and attention. The subgroup with nonoptimal attention and cooperation showed decreased neurocognitive test performance toward the end of the assessment session. Overall, behaviors which are not conducive to displaying an examinee’s best performance may limit cognitive performance and test scores.
Despite the recognition of the importance of recording and analyzing test behaviors in research and practice, they have rarely been studied. Test observations are frequently collected in a nonstandardized fashion (e.g., notes jotted down on a test protocol while testing). Although a few formal scales have been created for measuring children’s test-taking behavior, most of them are no longer in use. They include the Stanford–Binet Observation Schedule (Terman & Merrill, 1960), Test Behavior Checklist (Aylward & MacGruder, 1986), Behavior and Attitude Checklist (Sattler, 1988), and the Kaufman WISC-III Integrated Interpretive System Checklist (Kaufman, Kaufman, Dougherty, & Tuttle, 1994). One recent formal scale is the Test Observation Form (TOF) published by McConaughy and Achenbach (2004). The TOF is a standardized form for rating observations of behavior, affect, and test-taking style for children, and is used during the administration of any individual cognitive ability or achievement test.
Moving Toward IQ Testing via iPad
IQ testing has recently begun to be accessible on iPads. NCS Pearson Inc. (Pearson) has recently modernized the format in which their published IQ tests are given. Q-interactive is a tablet-based technology system created by Pearson to assist professionals in administering and scoring certain tests. All of the assessment tools are consolidated in one online database. Presently, Apple iPads are the only devices available for testing with Q-interactive. Other tablets (e.g., Androids) are not compatible. With Q-interactive, the examiner and examinee use iPads wirelessly synched with each other so that the examiner can read administration instructions, time and capture responses, and view and control the examinee’s iPad. The examinee’s tablet displays visual stimuli and captures touch screen responses. According to Pearson, each test has undergone an equivalency study to evaluate whether scores generated via testing with Q-interactive are interchangeable with those generated via testing with standard paper and pencil versions (“Grounded in Solid Research,” 2016). A review of literature indicates that further studies have not been completed by individuals or organizations other than Pearson, likely because cognitive testing on an iPad is a fairly new phenomenon. Undeniably, the iPad has become appealing to students, educators, therapists, and parents due to its accessibility and versatility for students with various disabilities (Douglas, Wojcik, & Thompson, 2012). As a result, further research is needed not only on the equivalency of the test but on how the format of a test may affect an examinee’s behaviors.
Previous research on computer-based cognitive assessment found that limiting the effects of anxiety was difficult. Hedl, O’Neil, and Hansen (1973) administered the Slosson Intelligence Test (Slosson, 1963) paper and pencil version, followed by a computer-generated version. They found that examinees’ anxiety was higher when tested with the computer. Since the time this research was completed, computers have been more prolific in our society. However, this does not ameliorate the risk of generating internalizing or externalizing testing behavior when technology is introduced. Given the advanced technology available today, children may present as more attentive during a testing session on an iPad. Conversely, due to the consistent exposure of an iPad in the school or home environment, test format may not elicit any change in behavior. According to a survey completed by Pearson, 95 practitioners who have administered WISC-IV using Q-interactive reported high incidences in which Q-interactive either increased examinees’ engagement and attention or had no effect. Increased engagement appeared to be more frequent for children ages 5 to 9 than children ages 10 to 18 (Daniel, 2013). Clearly, as more options become available to practitioners, it is vital to investigate whether test format increases the likelihood of maladaptive behaviors which can affect cognitive test scores.
Test Behaviors of Children With Special Needs
It is particularly important to carefully consider the impact of test behavior on the cognitive scores of children with confirmed or potential educational disabilities. Professionals use tests and other assessment methods to acquire reliable and valid data to diagnose childhood disabilities (Hu & Oakland, 1991; Oakland, Mpofu, Grégoire, & Faulkner, 2007). For example, tests that measure cognitive abilities contribute to the assessment of a learning disability or other cognitive difficulties. Individual assessment is also useful in creating individualized interventions to meet each child’s unique learning needs due to disparate cognitive profiles (Fiorello, Hale, & Snyder, 2006). As tests can have a significant impact on an individual, including determining eligibility for special education services and planning instructional interventions, it seems important to observe how an individual reacts or behaves during a testing session. Both internalizing and externalizing behaviors are important to consider. In the absence of effective interventions for internalizing or externalizing disorders, children may struggle socially, behaviorally, and academically during their school years (Lane et al., 2012), and manifestations of either type of disorder during testing may adversely impact a child’s performance. For example, Salend (2011) reported that students with disabilities appear to be particularly vulnerable to internalizing behaviors such as test anxiety and experience such anxiety at higher rates than their peers. One study (Datta, 2014) found that students with vision and intellectual disabilities experience higher rates of physical and cognitive anxiety in a testing situation, suggesting they experience high cognitive distress and physical discomfort during assessment. In summary, specific behaviors not directly related to the construct of intelligence, such as, but not limited to, lack of attention, poor cooperation, poor motivation, anxiety, and avoidance introduce sources of variance that can adversely impact the validity of intelligence test scores (Konold, Glutting, Oakland, & O’Donnell, 1995; Maller, Konold, & Glutting, 1998; Oakland & Harris, 2009).
Present Study
At present, no research exists examining whether or not children suspected of or classified as having an educational disability differ significantly in their behavior when given an intelligence test on an iPad versus the paper and pencil format. This is the first study to utilize the TOF to measure patterns of behavior when children in school are tested with an iPad versus the standard format. It is important to systematically assess whether children’s behavior changes via test format as this can impact their overall performance. The aim of this study was to compare patterns of test session behavior as measured by the TOF in children referred for a special education evaluation. The overarching research question to be answered in this study was “Are there differences in test session behavior as measured by the TOF when children are administered the WISC-IV in a standard format versus iPad format?” Differences between both groups were compared using the TOF Total Problems Scale, empirically based broad scales, and empirically based syndrome scales. The following three hypotheses were made: Regardless of the method of test administration (i.e., iPad or a standard paper and pencil format), there will be no statistically significant difference in (1) the Total Problems Scale, (2) the empirically based broad scales of the TOF, and (3) the empirically based syndrome scales of the TOF.
Method
Participants
This study was conducted at three New York City elementary schools. See Table 1 for demographic information related to the school populations from which the sample for this study was drawn and Table 2 for demographic information related to participant groups. Participants included children referred for special education evaluations in Kindergarten through fifth grade. Ninety-three referred students were included and assigned to cognitive testing either with the traditional paper and pencil standard format or with an iPad. The sample was stratified based on age to ensure that an equal number of students of the same age were included in each group. In addition, only one school allowed for testing with an iPad as the required technology equipment was not available in two other schools. However, the three schools were fairly similar in terms of demographics (see Table 1), and a statistical comparison is reported in the “Results” section. In addition, the three schools are all from the same urban school district and are within less than a mile of each other serving the same community. Even though the different disability classifications presented by the students were fairly evenly represented in the two groups, more than half the sample included students with a speech–language impairment. All data were collected between September 2013 and January 2015. Of the 93 students, 53 were referred for a mandated 3-year reevaluation (26 of whom were in the iPad condition), 26 were referred for an initial evaluation (13 of whom were in the iPad condition), and 14 were referred for a requested reevaluation (nine of whom were in the iPad condition). Participants in this study included African American, Hispanic, and Caucasian students. All students who were referred for an evaluation and identified by the school district as English-language learner students were excluded from this study.
Total School Demographics.
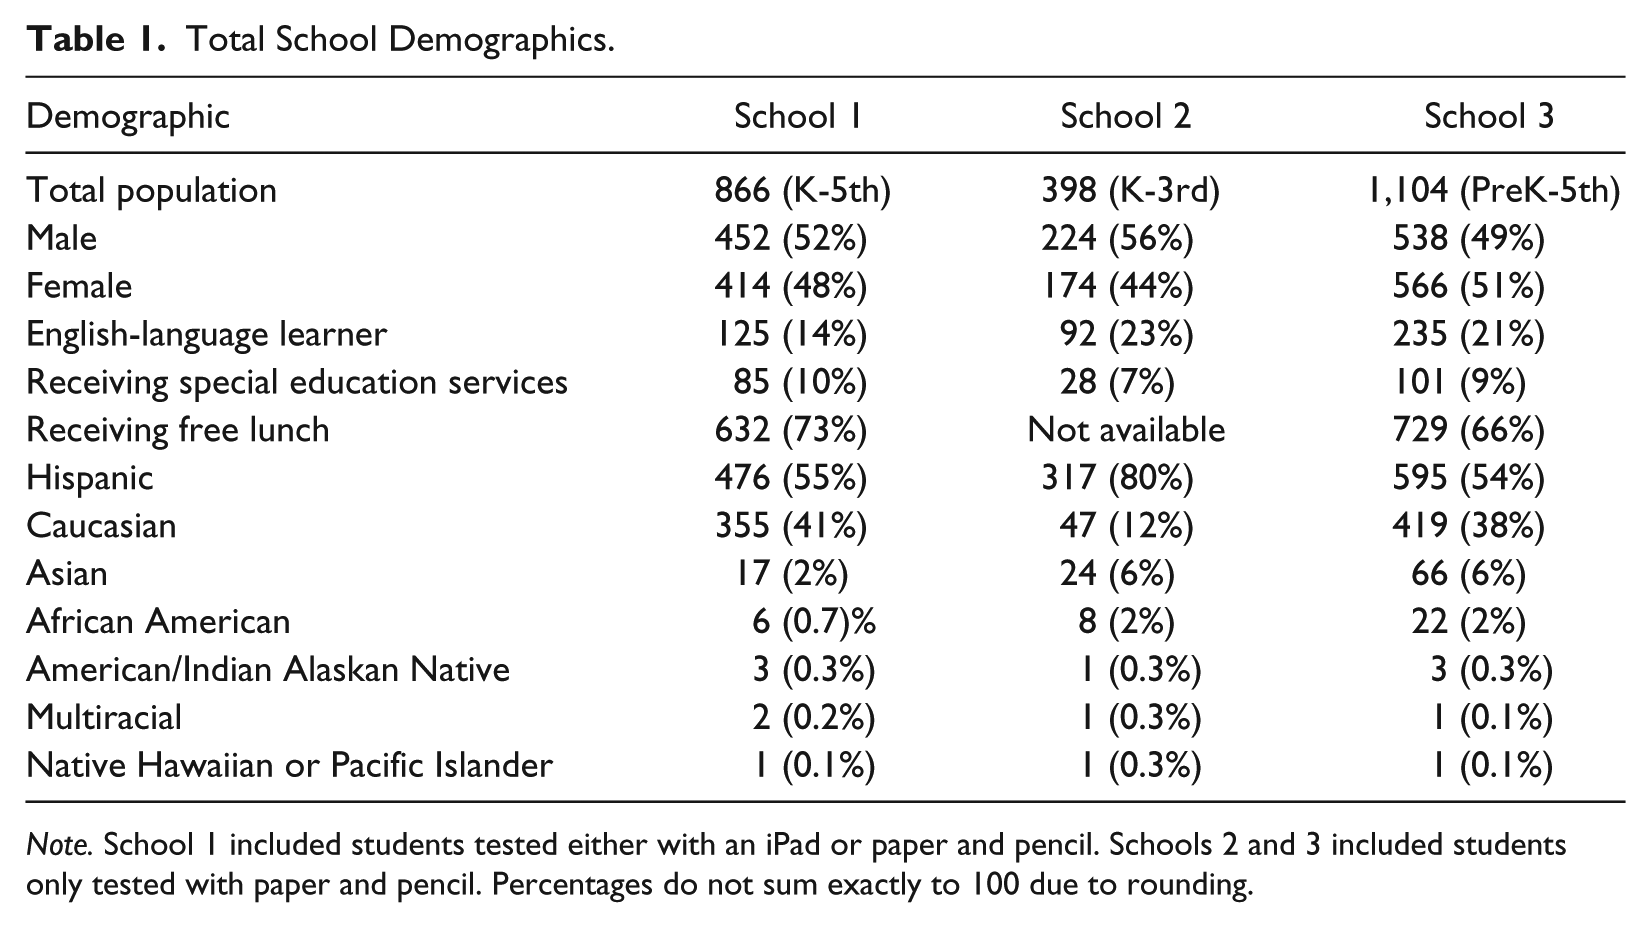
Note. School 1 included students tested either with an iPad or paper and pencil. Schools 2 and 3 included students only tested with paper and pencil. Percentages do not sum exactly to 100 due to rounding.
Frequency and Percentage Data for Demographic Variables Gender and Ethnicity and Mean Age for the Participants.
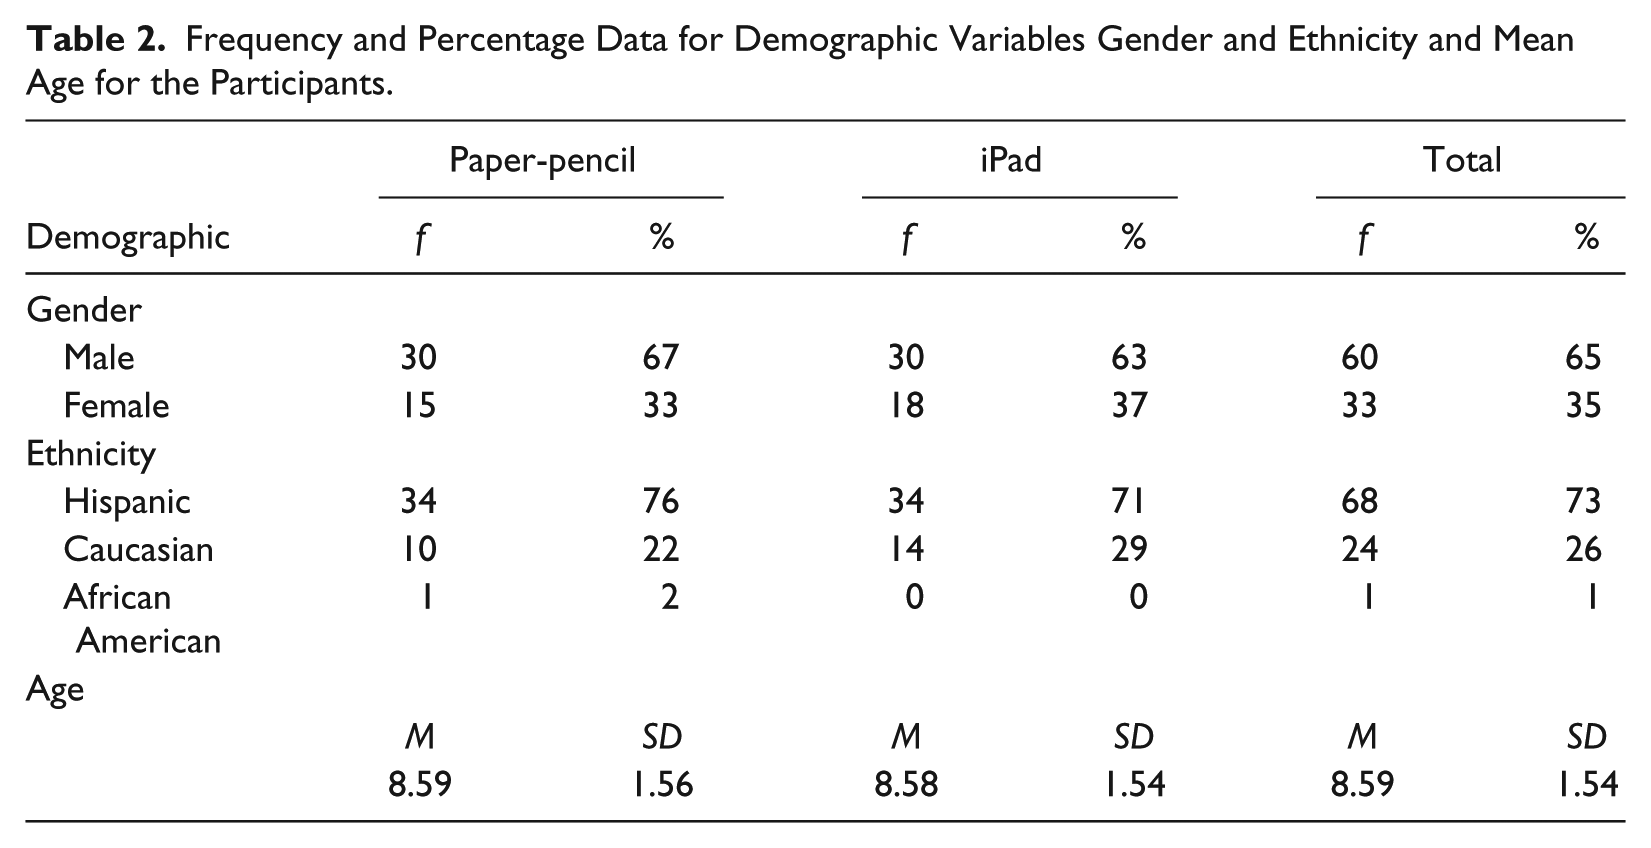
Evaluations were conducted as part of the regular academic process within the schools. It should be noted that the first author of this study was the examiner for all 93 cases. Consent for testing was given by each parent for students referred for a special education evaluation. Due to the nature of the data, no additional assent or consent was needed. In addition, information entered into a preexisting database was coded to protect the privacy of the students. This study was reviewed and approved by the Internal Review Board of a major university in the northeast.
Measures
The measures in this study included the WISC-IV and the TOF. The WISC-IV is an individually administered IQ test used with children ages 6 to 16. The WISC-IV contains 10 core subtests and five additional subtests. The WISC-IV is well normed, and there is evidence of good validity and reliability (Wechsler, 2003). Furthermore, the Wechsler tests, with their history of use in research and clinical domains, are the most commonly intelligence tests used with children (Kaufman, Raiford, & Coalson, 2016).
The TOF is part of the Achenbach System of Empirically Based Assessment (ASEBA) and is designed to be consistent with other ASEBA forms. The TOF can be used while administering any standardized individual cognitive or achievement test, and allows for rating of observations of behavior, affect, and test-taking style during testing sessions for children aged 2 to 18. The TOF has 125 items rated on a 4-point scale by either the examiner giving the test or by an observer once testing is completed. The TOF has five syndrome scales derived from factor analysis (Withdrawn/Depressed, Language/Thought Problems, Anxious, Oppositional, and Attention Problems), as well as the empirically based broad scales Internalizing (comprised from Withdrawn/Depressed and Language/Thought Problems), Externalizing (comprised from Oppositional and Attention Problems), and Total Problems. The titles of the syndrome scales represent the types of behaviors comprised by the scales. However, it should be noted that the Anxious scale appears to capture behaviors related to test anxiety (rather than more generalized anxiety) and is not part of either the Internalizing nor Externalizing scales (McConaughy & Achenbach, 2004). According to McConaughy and Achenbach (2004), the TOF has good test–retest reliability for the TOF scales, with alpha coefficients all greater than .80. Reliability was lowest for the Anxious scale which could reflect changes in children’s anxiety states specific to the test situation, in contrast to the more trait-like characteristics of the other scales. There is also evidence for content, construct, and criterion-related validity (McConaughy & Achenbach, 2004). The TOF profile provides total scores, T scores, and percentile scores for each scale. Scores in the borderline range indicate more problems than typically observed for the TOF normative samples, but they are not so high as to necessarily warrant concern. Scores in the clinical range warrant concern because they are more clearly deviant compared with normative samples. For the present study, differences in testing behavior were analyzed using TOF T scores.
Procedures
Cognitive testing was completed during school hours in one or two testing sessions within a maximum span of five school days between sessions. Participants were assigned to one of two different groups. In one elementary school, participants were nonrandomly assigned (stratified by age) to testing on an iPad or paper and pencil format. As this school allowed for testing in either condition, students were placed in either the iPad or the paper and pencil group depending upon how many students of the same age had already been tested in each group. The intent was to have an equal balance of age in both testing conditions. In two other elementary schools, students were tested with the paper and pencil standard format only as these schools did not have the technology equipment necessary to allow for testing on an iPad. All participants regardless of format were given 15 subtests from WISC-IV. After cognitive testing was completed, the examiner completed the TOF.
Regarding the primary study hypotheses, the independent variable was the test format used when testing each participant and the dependent variable was students’ behavior. As such, the appropriate statistical analysis for the three hypotheses was independent groups t tests.
An a priori power analysis was conducted to determine a minimum sample size needed to obtain Cohen’s recommended power of .80 (Cohen, 1992). Estimating a medium-sized effect between the two groups, power analysis indicates a total sample size of 52 will yield a statistical power of .80. The total sample size (N = 93) exceeded this minimum.
Results
Prior to testing the hypotheses, an independent groups t test was performed for age and chi-square analyses were performed to analyze gender, grade, ethnicity, and medical diagnosis to determine whether the groups (iPad vs. pencil and paper) were imbalanced on any of the pertinent variables. No significant differences were found. Identical analyses were performed to compare the samples drawn from the three schools to determine whether the three schools were imbalanced on any of the pertinent nuisance variables. Again, no significant differences were found among the three schools. After data were collected, analyses were also performed to compare students tested with the iPad with students tested with paper and pencil on the WISC-IV FSIQ scores. An independent groups t test was performed yielding results that were not statistically significant, t(91) = 0.649, p < .518, 95% confidence interval for the difference = [–3.585, 7.065], indicating that the groups were fairly equal on FSIQ scores. Therefore, the two groups do not appear to be significantly different from each other with respect to the most likely potential nuisance variables.
Table 3 presents the TOF syndrome and broad scale means, standard deviations, and differences between the paper and pencil and iPad groups. Subscales were tested individually because omnibus test assumptions were unlikely to be met and differences on the individual scales would be most relevant to practicing examiners. The mean Total Problems score for the paper and pencil administration (M = 55.84, SD = 6.64) and the iPad administration (M = 57.38, SD = 5.03) demonstrated no significant difference between the two groups, t(91) = −1.257, p < .21.
Test Observation Form Syndrome and Broad Scales Means, Standard Deviation, and Differences Between Paper and Pencil and iPad Group.
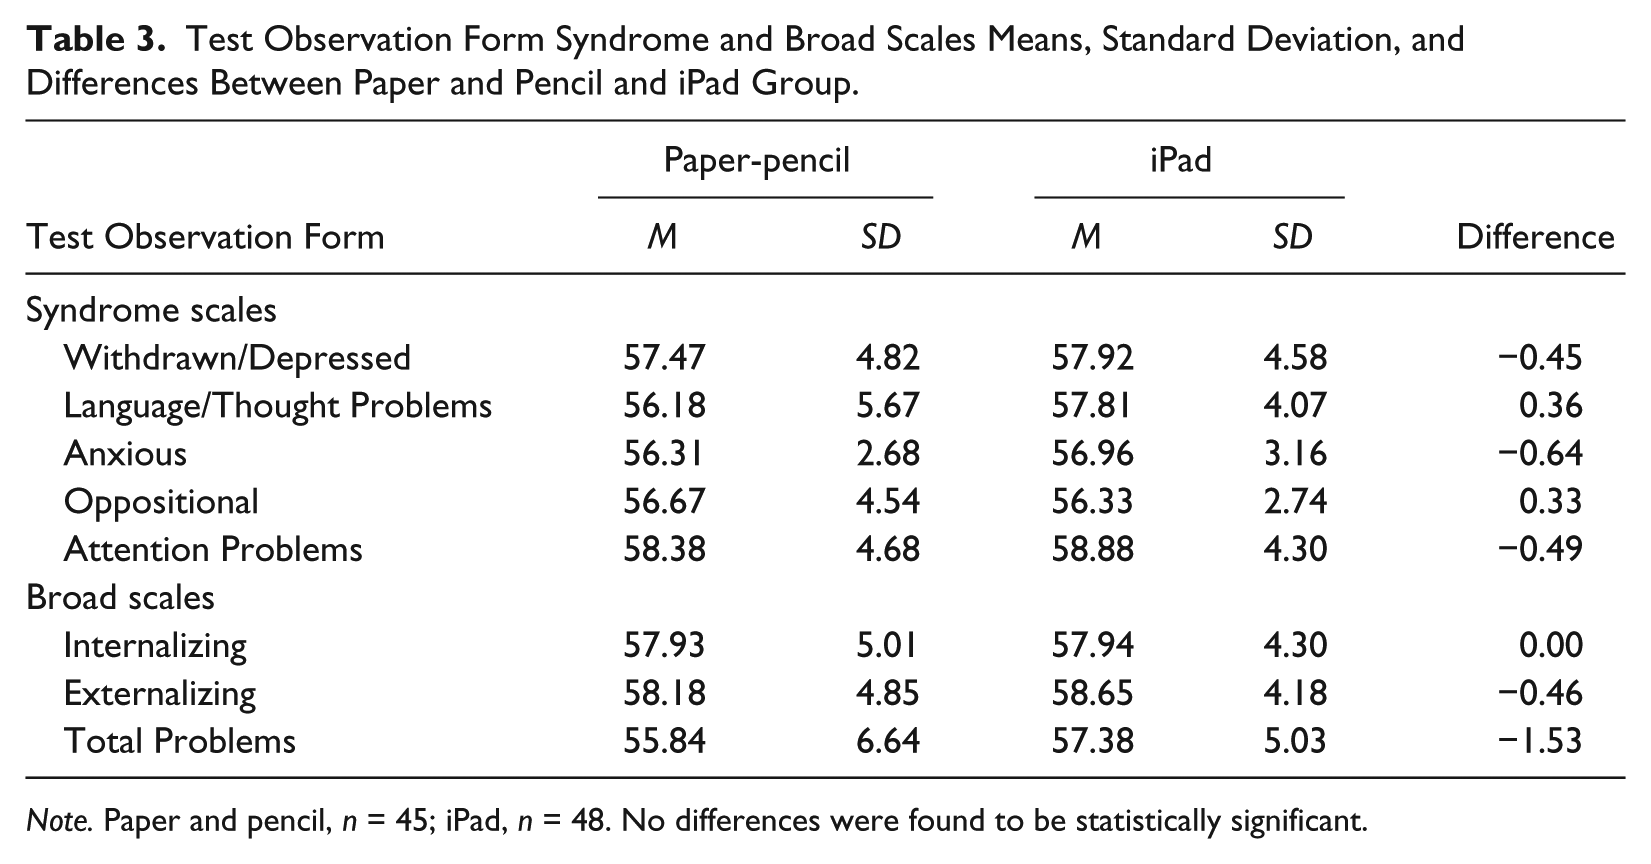
Note. Paper and pencil, n = 45; iPad, n = 48. No differences were found to be statistically significant.
Differences were small between groups on the broad Internalizing and Externalizing scales (−0.00 and −0.46, respectively) and not statistically significant, Internalizing, t(91) = −0.004, p < .99, and Externalizing, t(91) = −0.500, p < .62.
The differences between the mean T scores for the paper and pencil and iPad administration groups on the five syndrome scales were small (ranging from −0.64 to 0.36 points), and none reached a level of statistical significance: Withdrawn/Depressed, t(91) = −0.461, p < .65; Language/Thought, t(91) = 0.359, p < .72; Anxious, t(91) = −1.062, p < .29; Oppositional, t(91) = 0.432, p < .67; and Attention Problems, t(91) = −0.534, p < .60.
Discussion
This study examined whether children suspected of, or who qualified under special education law as having, an educational disability would differ significantly in their test-taking behavior when given an intelligence test on an iPad versus the traditional paper and pencil format. There was no statistically significant difference in the mean TOF Total Problems scale scores between the group of children tested with an iPad and the group tested with the paper and pencil format. This absence of a finding suggests that examiners can be confident that these two test formats did not increase the likelihood of global behavioral and emotional problems during a test session. One previous study (Neely, Rispoli, Camargo, Davis, & Boles, 2013) supports the finding that behavioral and emotional problems do not increase while using an iPad. They found that two students diagnosed with autism demonstrated lower levels of challenging behavior and higher levels of academic engagement when given academic instruction on an iPad. Miller, Krockover, and Doughty (2013) investigated the benefits of using traditional paper and pencil science notebooks versus using iPad science notebooks for students with moderate to severe intellectual disabilities. Their results indicated that students demonstrated higher motivation, engagement, and independence with the use of iPad electronic notebooks. Similarly, Ciampa (2014) found that the use of tablets during academic instruction for 10- to 12-year olds notably improved learning outcomes and promoted greater motivation for students to persist on tasks. Overall, recent studies are beginning to demonstrate that iPad use during instructional courses does not increase emotional or behavioral problems, and results of the present study suggest this finding may be generalizable to assessment activities.
The present study found that examiners can be more confident that they are not creating an environment which will increase internalizing behaviors due to test format if they are using an iPad. This can help alleviate concerns clinicians might have about triggering negative moods or emotional states by requiring children to use iPad technology. This finding is important because internalizing behaviors such as ineffective emotional regulation inhibit a child’s use of higher order cognitive processes such as working memory, attention, and planning which can affect classroom performance (Blair, 2002; Brunnekreef et al., 2007) as well as test performance. Few studies have examined relationships between cognitive performance and internalizing behavior problems in children. However, preliminary findings indicate a consistent but small correlation between cognitive performance and internalizing behaviors (Rapport, Denney, Chung, & Hustace, 2001).
The finding that externalizing behaviors measured in this study are not impacted by test format is important due to the potential impact overt behavior problems can have on test scores. Externalizing problems create significant difficulties in primary school and compromise students’ learning outcomes and adjustment in school (Metsäpelto et al., 2015). For example, a study by Metsäpelto and colleagues (2015) found that high externalizing problems present in both genders in Grades 1 and 2 were linked with low academic performance in Grades 3 and 4. Given this potential for behavioral difficulties to negatively impact both learning and test scores, it is important to consider their possible impact in the cognitive assessment setting. Based on the results of this study, examiners can be assured that the impact of externalizing behaviors would not be different using paper and pencil versus the iPad format for students referred for an evaluation for special education services. This is an important finding because clinicians may otherwise be legitimately concerned about potential behavioral problems generated by the introduction of novel testing materials into a well-established test like the WISC-IV.
The third hypothesis was supported because no statistically significant differences were found in any of the empirically based syndrome scales of the TOF between the group of students tested with an iPad and the group tested with the paper and pencil format. It was important to assess whether withdrawn/depressed behavior, language/thought problems, anxious behavior, oppositional behavior, or attention problems behaviors would be impacted by test format as previous studies have found that these types of behaviors can limit cognitive and/or academic performance (Boone et al., 1995; Lundervold, Heimann, & Manger, 2008). Examining targeted behaviors, in addition to overall composites, was important due to specific concerns examiners may have about using an iPad during IQ testing. For example, clinicians may be worried that children would be anxious about using technology incorrectly or engage in negative self-talk about their technological skills. Attention concerns were particularly important to rule out due to the possibility that children would become distracted by the presence of an iPad, which they may routinely use for play or entertainment. Introduction of a commonly preferred item (like an iPad) also introduces the possibility of oppositional or disruptive behavior. Despite these reasonable practical concerns, the results of the present study indicate that regardless of whether examiners incorporate intellectual testing via traditional paper and pencil or iPad, students’ test behaviors do not appear to differ negatively based on test format. This study lends support to Pearson’s assertion that the two test formats are equivalent.
Limitations
A potential concern of the present study is that the examiner was the only individual who completed the WISC-IV and the TOF with the students. It is possible that the data are influenced by expectancy bias due to the examiner collecting all of the data and being aware of the study’s hypotheses and the experimental condition of each child. Although this might present as a limitation, it also mirrored real-world practice within schools and other clinical environments, contributing to the study’s ecological validity. The examiner also had approximately a decade of experience completing cognitive assessments and observing children’s behavior during testing, but more than one observer blind to the research questions is recommended for future studies so that interobserver agreement can be calculated and reported.
Another limitation which mirrored real-world practice is that not all the schools had the technology necessary to completing testing on an iPad. Although attempts were made to include all schools with the technology required, budget and technology limitations for public schools are part of the reality educational institutions face. However, because there were no significant demographic differences between students in either research group, this does not represent a fatal study flaw. Furthermore, because some children (35 of the 93) tested with an iPad were being reevaluated, they had the opportunity to directly compare the iPad experience with any memory they might have had of the traditional paper and pencil format.
An additional limitation noted in this study is that the sample only included students between the ages of 6 and 11. The WISC-IV can also be utilized for students ages 12 to 16. Therefore, the results of this study cannot be generalized to students with disabilities between the ages of 12 and 16. It is also worth noting that more than half the sample were students with speech–language impairment; as such, the results of this study may be most applicable to assessing students with similar disabilities. Future studies may want to include a more diagnostically diverse sample of referred students, including students with clinical diagnoses. Future researchers can also expand on this study by examining whether test format specifically increases positive behaviors such as motivation and engagement, as the TOF only measures emotional and behavioral problems. Finally, to date, there are no independent studies that have a direct comparison of cognitive scores produced via paper and pencil versus iPad administration. It is possible that iPad administration could either improve performance by increasing interest and motivation, or limit performance by leading to distraction. Future researchers would do well to answer this question. However, it was not the focus of the present study.
Conclusions
The results from the present study have important implications for practitioners. Test format does not appear to significantly increase the likelihood of emotional or behavioral problems during testing for children suspected of or who qualify under special education law to be classified with a disability. The present study supports previous research that suggests iPads and other related devices are viable technological aids for this clinical population.
Footnotes
Declaration of Conflicting Interests
The author(s) declared no potential conflicts of interest with respect to the research, authorship, and/or publication of this article.
Funding
The author(s) received no financial support for the research, authorship, and/or publication of this article.