
Abstract
Given the importance of math in today’s society, it is critical that children who are at risk for math difficulty are identified early. We developed and validated a prekindergarten math subtest (i.e., CIRCLE Progress Monitoring [CPM] Math Subtest). This teacher-completed measure evaluates domains considered important for later math development. Evaluation of validity was undertaken in a longitudinal sample of 383 children (Mage = 4.9 years), and a follow-up sample of 3,691 children (Mage = 4.4 years). The measure demonstrated adequate psychometric properties, including strong internal consistency reliability (α = .94) and test–retest reliability (r = .78). Evaluation of concurrent and predictive validity demonstrated scores on the CPM Math Subtest were correlated with scores on other assessments at high levels (rs from .55–.65). Exploratory and confirmatory factor analyses revealed that the subtest conforms to a well-defined five-factor model that parallels areas considered to be important in the math literature.
Introduction
Despite the growing importance of STEM (Science, Technology, Engineering, Mathematics), rates of mathematics proficiency in the United States are low. Roughly 60% of students are not proficient in mathematics when they complete fourth grade (National Assessment for Educational Progress [NAEP], 2017). Added to the seriousness of this problem, children from high poverty backgrounds, including ethnic minorities, demonstrate rates of mathematics proficiency 2 to 4 times lower than that of their middle-class peers (Jordan et al., 2006, 2007; NAEP, 2017). This income-based disparity in math achievement is evident in preschool and does not close for many children from high poverty and minority backgrounds throughout formal schooling (Bodovski & Farkas, 2007; Jordan et al., 2007; Morgan et al., 2009). To close this achievement gap, efforts for improving math outcomes should begin in prekindergarten (pre-K), before children experience prolonged learning difficulties sometimes associated with onset of formal schooling (Duncan et al., 2007; Sophian, 2004). To support the early learning of mathematics, practitioners need reliable and valid universal screening and progress monitoring measures to inform instruction (Landry et al., 2009). This work describes the development of the CIRCLE Progress Monitoring System’s Math Subtest (CPM Math Subtest; Assel et al., 2008) and provides information on its reliability and validity.
Assessments of Mathematics
Norm-referenced assessments of mathematical knowledge are often used by clinicians that practice in school settings (e.g., educational diagnosticians and school psychologists) with elementary school age children and older students. For example, the Applied Problems subtest of the Woodcock–Johnson Tests of Academic Achievement-IV (Schrank et al., 2014) was designed and is used by educators, researchers, and clinicians (e.g., psychologists) and is described as providing good measures of academic achievement in the Mental Measurement Yearbook (e.g., Canivez, 2017; Madle, 2017). Similarly, the Test of Early Mathematics Ability–Third Edition (TEMA-3; Ginsburg & Baroody, 2003) was designed to evaluate a broad range of children’s early mathematics abilities. Reviews of the TEMA-3 have indicated that it is a strong tool and can identify children with learning differences. However, some reviewers have criticized the technical documentation that is included in TEMA-3 Manual (e.g., Monsaas, 2005).
In contrast, some less widely used measures have been developed by researchers who study children’s early math skills. For example, the Research-Based Early Math Assessment (Clements et al., 2008) and the Child Math Assessment (CMA; Starkey et al., 2004) were designed to evaluate a range of early math skills. Commercially available measures (e.g., Woodcock–Johnson (WJ) Tests of Achievement and TEMA-III) are expensive to administer, require a great deal of training to administer reliably, and are generally not considered appropriate for universal screening/progress monitoring (PM). In contrast, while measures designed by researchers do a good job of evaluating early math abilities, the measures are not commercially available.
Importance of Universal Screening and Progress Monitoring in Mathematics
Response to Intervention (RTI), or what some refer to as Multi-Tiered Systems of Support (MTSS), has long been seen as a way to help children who are struggling academically. RTI approaches can identify and help prevent learning differences, and there is a large body of research devoted to RTI approaches in the literacy areas (e.g., Fuchs & Fuchs, 2005; Haager et al., 2007). Methe and VanDerHeyden (2013) described the process of RTI in mathematics as beginning with universal screening. Areas to be assessed were described as those that have been taught in the regular education curriculum using measures that are brief and which evaluate common learning standards. The use of universal screening and progress monitoring measures in math have the potential to be able to identify class, grade, and schoolwide deficits; identify children for more intensive instruction; monitor if interventions are effective; and monitor the effectiveness of district interventions (Methe & VanDerHeyden, 2013). In order for RTI approaches to be effective, it is important that the universal screening and progress monitoring measures can be administered efficiently and accurately (Catts et al., 2015).
Universal Screening and Progress Monitoring Measures
The Individual Growth and Development Indicators (IGDIs; Missall & McConnell, 2004) is a widely used screener of early math skills. The IGDIs–Early Numeracy (IGDIs-EN; Hojnoski & Floyd, 2004, 2013) assesses oral counting, number naming, quantity comparison, and one-to-one correspondence. Although reasonably reliable, it has been demonstrated that IGDIs-EN evidences poor to moderate convergent validity with concurrently administered standardized math tests (Floyd et al., 2006). For example, the IGDIs-EN subtests (i.e., One-to-One Correspondence Counting Fluency, Oral Counting Fluency, Number Naming Fluency, and Quantitative Comparison Fluency) correlated with Bracken Basic Concepts Scale–Revised’s Quantitative scale at .31, .31, .29, and .46 respectively. Similar correlations ranging between .29 and .51 were found between the IGDIs-EN and the Woodcock–Johnson’s Applied Problems subtest (Floyd et al., 2006). The Early Arithmetic, Reading and Learning Indicators (i.e., EARLI; Lei et al., 2009) were designed to quickly evaluate early math competencies of children enrolled in preschool. EARLI subtests evaluate number naming skills, shape naming, and measurement constructs (taller, shorter, etc.). The authors reported that EARLI subtests were strongly correlated with the Applied Problems and Quantitative Concepts subtests of the Woodcock–Johnson (Lei et al., 2009). VanDerHeyden et al. (2006) developed a series of curriculum-based measures of early math skills which evaluated several mathematical dimensions in young children (e.g., counting objects, selecting numbers, naming numbers, counting, and visual discrimination). VanDerHeyden et al. (2006) reported that the counting objects task and visual discrimination tasks were correlated at moderate levels with scores on the TEMA-2 (r = .49 and .50 respectively). In addition, the authors reported alternate form reliability correlations ranging from .71 to .88 on individual tasks (VanDerHeyden et al., 2006). Finally, the Preschool Early Numeracy Scales (Purpura & Lonigan, 2015) include 12 assessments that evaluate a broad range of mathematical content (e.g., counting, cardinality, subitizing, number order, story problems, and number combinations). The individual tasks were moderately to strongly correlated with WJ subtests (e.g., rs ranged between .35 and .66). Although promising, some of these measures evaluate limited math content domains (e.g., IGDIs and EARLI). Others utilized small samples to determine psychometric properties (e.g., Lei et al., 2009; VanDerHeyden et al., 2006). Therefore, development of a broad-based math subtest that could evaluate the early math skills of preschool students was deemed to be important.
CPM System
As education stakeholders seek ways to increase student outcomes in early childhood settings, efforts to provide ongoing professional development (PD), research-based curricula, and ongoing progress monitoring that guides instruction have become central to quality improvement efforts (e.g., Buysse et al., 2013; Landry et al., 2009). The CPM System (Landry et al., 2014) was developed as part of efforts to improve early childhood educational programs in Texas. The suite of PD supports include use of a state approved early childhood curriculum, ongoing PD activities (e.g., preservice trainings, coaching, mentoring, and online coaching), access to an online collection of linked small-group activities, and progress monitoring assessments (see Landry et al., 2006, 2009) for a more detailed description of the PD approaches used in these studies. The PM assessment aggregates results of student evaluations, and classrooms of students are divided into ability-level groupings. Teachers are provided with a range of activities for children in the low-performing group and children who exceed expectations are provided with extension activities. This initial version of the CPM System evaluated letter knowledge, vocabulary, and phonological awareness.
The initial version of the CPM System was tested as part of a multisite evaluation of PD and approaches for monitoring children’s learning (Landry et al., 2009). In this project, teachers utilizing the online PD program and the online assessment system made greater gains in instructional practices and better quality teaching than control teachers (effect size [ES] = 0.79–1.49). For example, teachers using the online PD and online assessment were observed in their classrooms to provide higher quality instruction in phonological awareness, engaged in more writing activities with students, and had better developed lesson plans. In addition, teachers provided with technology-based feedback relevant for guiding instruction had students who demonstrated greater achievement on standardized tests of vocabulary and letter knowledge (ES = 0.15–0.44). In this example, technology-based feedback included online administration of the universal screening/progress monitoring assessments using a personal digital assistant which grouped children into levels. This made it easy for teachers to provide Tier II activities to children who were struggling as the system provided both the grouping and suggestions for appropriate Tier II activities from a large activity collection. As the CPM System began to be used throughout more classrooms, educators began to ask for mathematics to be included.
Rationale for Selection of Math Subtest Domains
In determining areas to assess within the CPM Math Subtest, a review of math assessments, math curricula, and national standards (National Council of Teachers of Mathematics [NCTM], 2000; Common Core State Standards; CCSS) and state guidelines (i.e., Texas Pre-Kindergarten Guidelines, 2015) was undertaken. By the end of pre-K, children are expected to have an integrated core of knowledge that enables them to understand quantitative activities related to Number and Counting, Arithmetic Operations, Geometry and Spatial Reasoning, and Measurement (Clements et al., 2013; Geary, 2007; National Mathematics Advisory Panel [NMAP], 2008; National Research Council [NRC], 2009; Spelke et al., 2010). It is hypothesized that these skills provide a foundation for the acquisition of formal mathematical knowledge acquired during later school years (Geary, 2007).
Number and counting
Children’s understanding of number and counting provides the foundation for the development of arithmetic and strongly predicts subsequent math achievement (Bailey et al., 2018; Geary, 2007; NMAP, 2008; Siegler & Robinson, 1982). For example, Geary et al. (2018) demonstrated that children who understand cardinality at age 4 had a better understanding of the number system at the beginning of Grade 1. Number and counting comprised competencies, including the ability to make judgments about numbers and their magnitudes (e.g., 4 is closer to 3 than 6), and understanding the concepts underlying counting (ordinality, cardinality, etc.; see Gelman & Gallistel, 1978). The evaluation of counting and number skills in pre-K is therefore an important component of any assessment instrument designed to evaluate early academic readiness of preschool-aged children.
Arithmetic operations
The NCTM standards for pre-K through Grade 2 and Common Core Standards (CCSS) for K Mathematics stress the importance of operations and early algebraic reasoning. Research has demonstrated that pre-K aged children have the ability to compute sums using informal math strategies (e.g., Huttenlocher et al., 1994; Starkey, 1992). Children’s ability to successfully solve arithmetic operation problems during preschool is dependent upon whether the problems contain small numbers (e.g., 2+1, 3–1) and whether or not the context is meaningful (Carpenter et al., 1982; Kilpatrick et al., 2001; Sophian et al., 1995; Starkey, 1992; Starkey & Gelman, 1982). It is therefore important to assess basic understanding of addition (or more) and subtraction (or less) in a pre-K math subtest.
Geometry and spatial reasoning
Geometry is a component of mathematical learning that serves as a critical foundation for algebraic reasoning (NMAP, 2008). Subsequently, the CCSS (i.e., National Governors Association Center for Best Practices, 2010), NCTM, and state pre-K standards enumerate standards related to geometric knowledge and reasoning. This emphasis of achievement related to geometry at young ages underscores the importance of this mathematical domain. In the absence of sufficient geometric knowledge and problem-solving ability, a student may be ill equipped for technical or advanced careers that require STEM activities (Giofrè et al., 2014; Zhang et al., 2012). Geometry and spatial reasoning comprised of several competencies, including an implicit understanding of Euclidean properties for shape and spatial relations (such as length, angle, and distance), and recognizing, labeling, and learning about the attributes of shapes. Geometry and spatial reasoning skills also provide a foundation for the development of higher level math knowledge, including abstract reasoning and proof construction (Geary, 2007). It is therefore important that pre-K math subtests include items that assess early geometric understanding, which are needed for developing formal mathematical knowledge.
Table 1 provides an overview of early mathematics skill areas considered important by the State Pre-K Guidelines, NCTM, and CCSS as well as content areas assessed in the CPM Math Subtest. The measure provides coverage of many of the domains considered to be important. However, the CPM Math Subtest does not evaluate measurement or patterning activities. Our goal was to create a scalable, reliable measure that could be easily administered by teachers. Upon communication with teachers and instructional specialists, the team was advised that measurement and patterning activities should be done with manipulatives at this age. The developers recognized that they lacked the ability to produce and distribute manipulatives that would allow the informal measurement and patterning activities to be conducted reliably and accurately by teachers.
Comparison of Standards Reviewed and Domains Evaluated in the CPM Math Subtest.
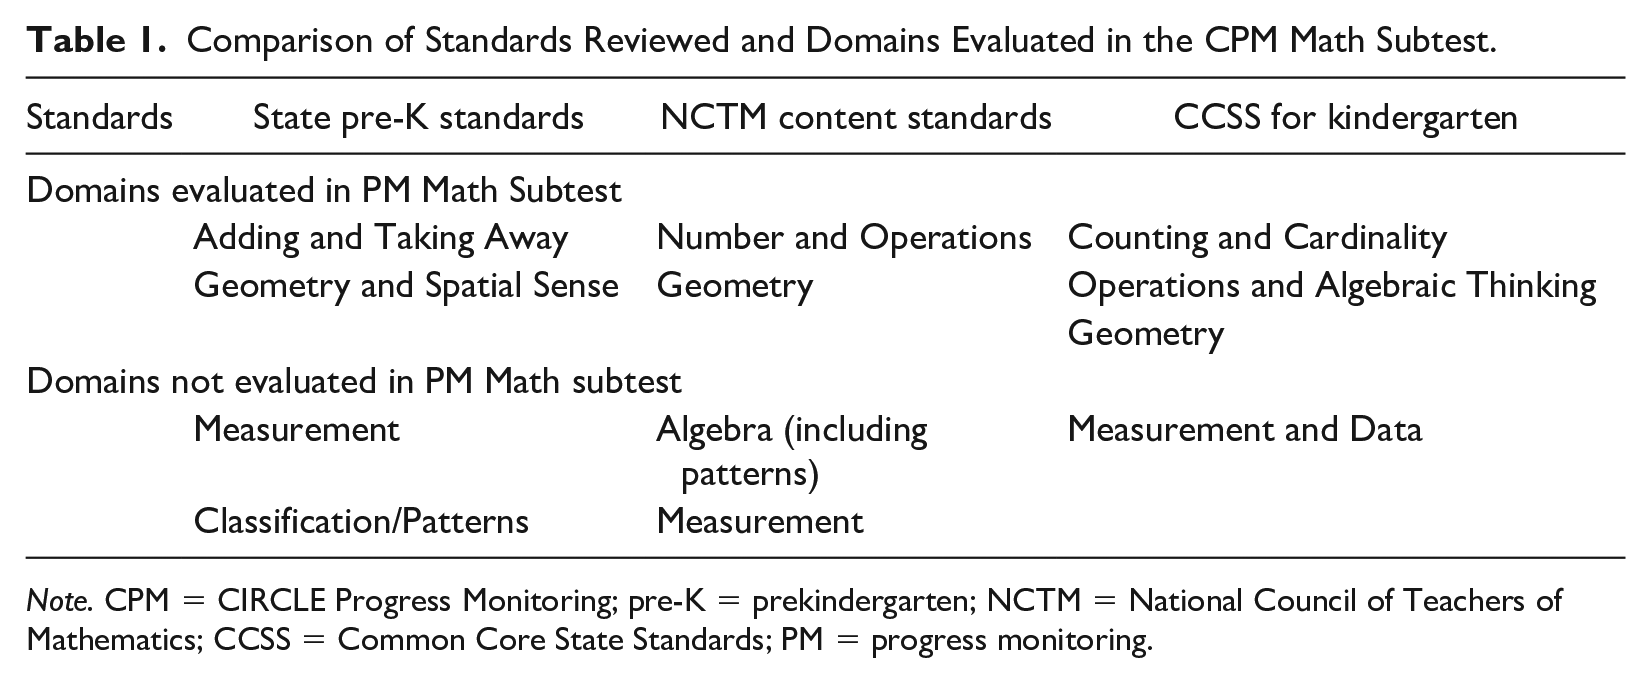
Note. CPM = CIRCLE Progress Monitoring; pre-K = prekindergarten; NCTM = National Council of Teachers of Mathematics; CCSS = Common Core State Standards; PM = progress monitoring.
Given that one of the goals of the project was to develop a short, valid, and reliable subtest that could predict children’s math skills in elementary school, it was recognized that not all content areas considered to be important in State pre-K standards, NCTM Content Standards, and CCSS could be evaluated. Therefore, it was hoped that content areas that could be evaluated easily (e.g.,. number, counting, geometry, and operations) would provide a reasonable estimation of broader early math skills. In addition, it was recognized that structural equation modeling (Hu & Bentler, 1999) had the potential of being able to provide support to describe the interrelations among constructs and indicate whether or not the content assessed in the CPM Math subtest coalesced into a broader second-order factor (i.e., early math skills). Therefore, careful evaluation of the structural relations among CPM Subtest items should be considered.
Research Questions
The new CPM math subtest was developed to assess early childhood mathematics, defined as individual skill differences in three important mathematics areas: numbers and counting, arithmetic operations, and geometry and spatial reasoning (CCSS, NCTM, Texas Essential Knowledge and Skills [TEKS]). The purpose of this study is to describe the new CPM Math subtest, and evaluate initial psychometric evidence for a new measure. Our research questions focus on the validity and reliability of the new measure. Specifically, (a) what is the dimensionality of the new subtest? We anticipate that the subtest will be multidimensional with factors corresponding to the important mathematical areas. This will provide initial evidence of construct validity. (b) To what extent does the subtest demonstrate internal consistency and test–retest reliability? We expect high levels of internal consistency and test–retest reliability. (c) To what extent does the subtest demonstrate concurrent, predictive, and divergent validity in terms of relations with other standardized, norm-referenced math measures? We anticipate that the new CPM Math subtest will be more highly correlated with concurrent and later mathematics assessments than with assessments of other constructs.
Method
Participants
We enrolled participants from two separate, nonoverlapping samples to evaluate the psychometric properties of the CPM Math Subtest. For both samples, we evaluated the factor structure and reliability of the new CPM Math Subtest. The first sample also includes evaluation of concurrent and predictive relations of the CPM Math Subtest with other well-validated, standardized assessment measures of math, language, and literacy.
Initial validation sample (Sample 1)
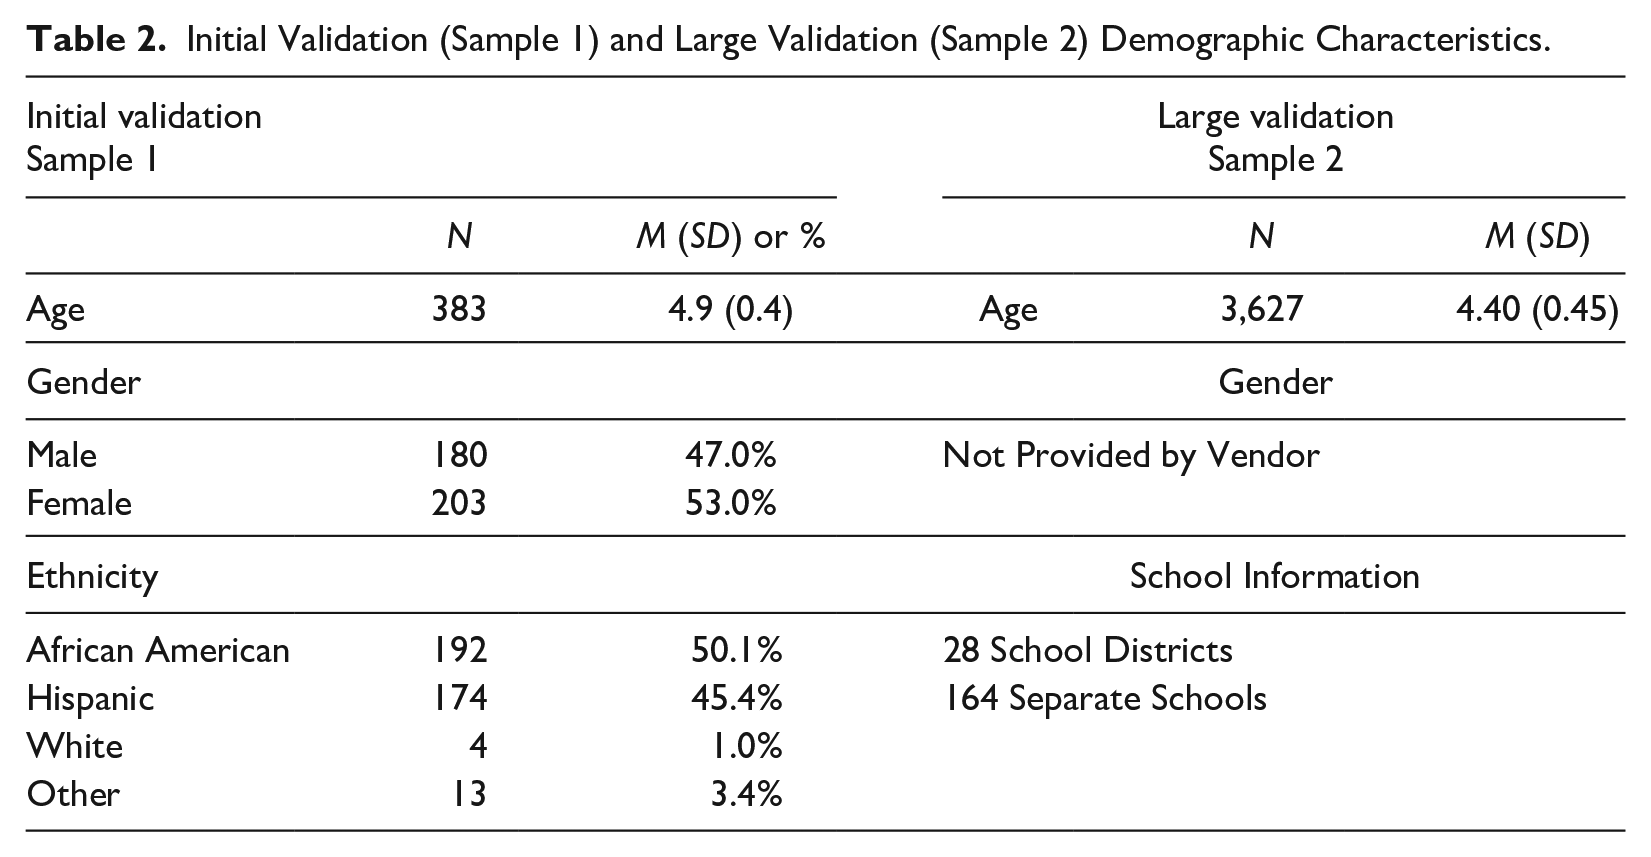
Initial validation work occurred within a larger curriculum evaluation study (for details, see Lonigan et al., 2015). We recruited participants (n = 383; Mage = 4.88 years, SD = 0.39) within Head Start centers and public preschool centers in a large metropolitan area. Full sample demographic information about Sample 1 is included in Table 2. This sample was 50.1% African American, 45.4% Hispanic, 1.0% Caucasian, and 3.4% other ethnicities. Children were assessed on the CPM Math Subtest during the middle of pre-K year. Children were followed longitudinally (end of pre-K, middle of kindergarten, and middle of first grade).
Initial Validation (Sample 1) and Large Validation (Sample 2) Demographic Characteristics.
Procedure Sample 1
The first author of the CPM Math Subtest was responsible for training research staff to complete assessments in the initial validation sample (Sample 1). Measures utilized in the validity study were all completed by research assistants. Training included didactic presentations, practice administrations, and certification procedures. Certification scripts were developed to ensure that assessors could administer items as written, follow basal and ceiling rules when required, and administer follow-up prompts and cues as specified in the directions for each measure. The measures included in the validity study were completed in a quiet location on school campuses (e.g., library, workroom, therapy room).
Missingness Sample 1
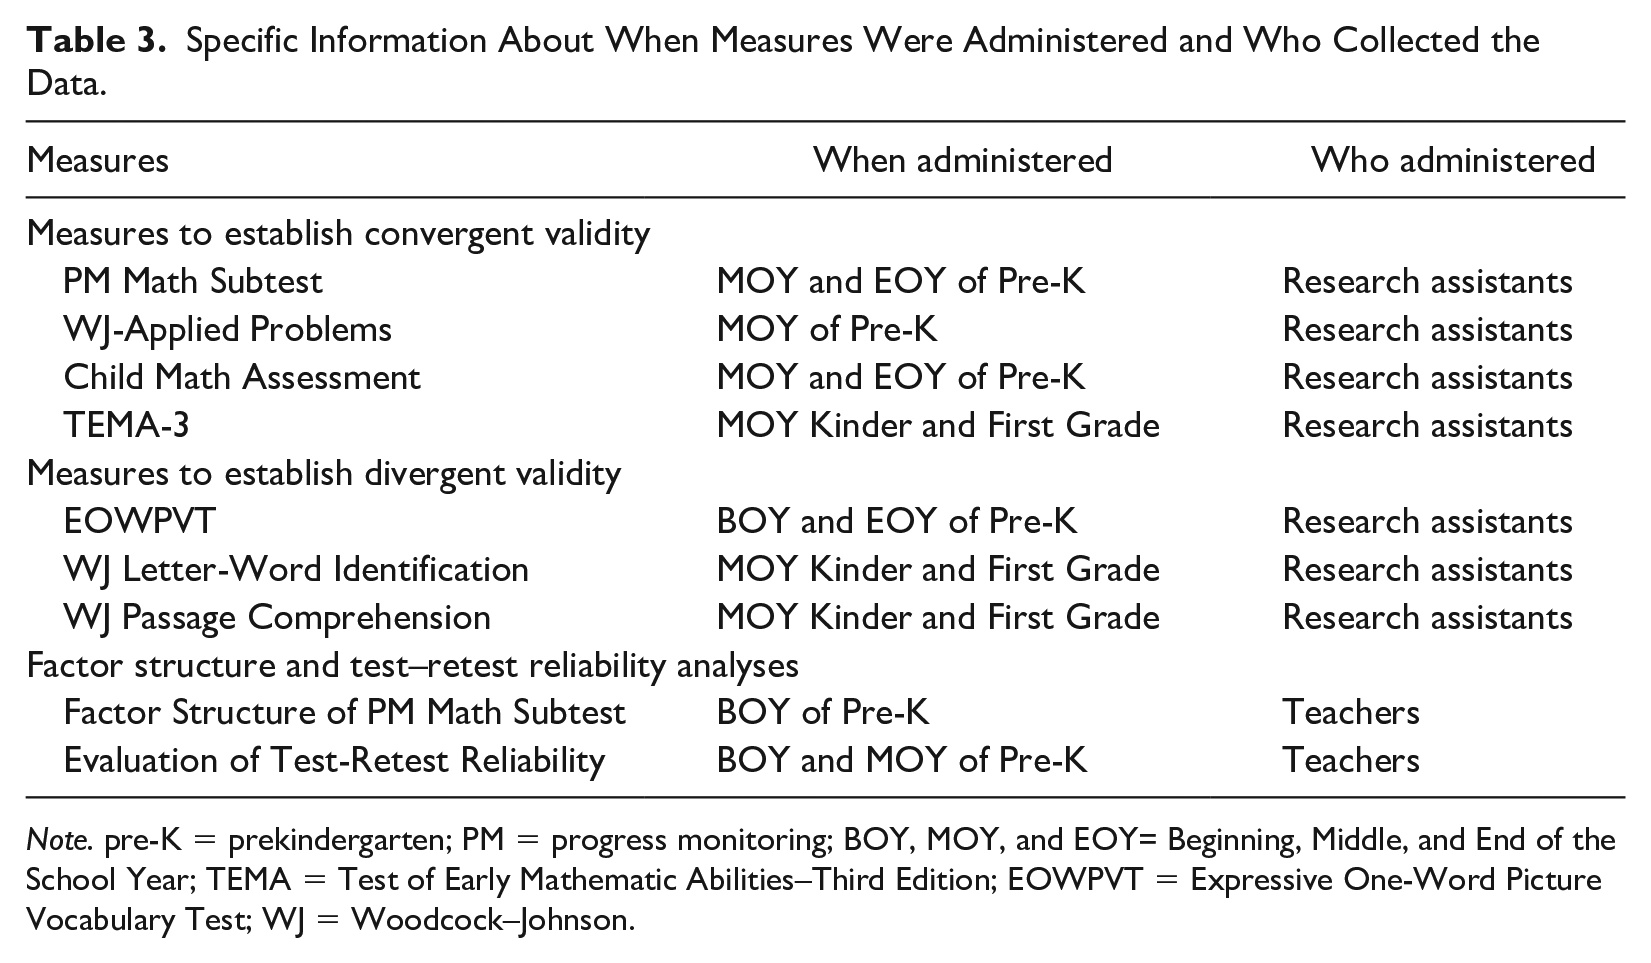
The sample here is a subsample from the larger curriculum study consisting of all children who were assessed via the new CPM Math Subtest (i.e., n = 383; this represents 91% of the original sample). Along with the CPM Math subtest, children concurrently were assessed with the CMA (three missing or ~1% missing due to absence or illness; measures are described in detail below), and the Woodcock–Johnson Applied Problems subtests (WJ-AP; no missing). At the end of pre-K, children were reassessed via the CMA (four missing or ~1% missing) and via the Expressive One-Word Picture Vocabulary Test–Third Edition (EOWPVT-III; three missing or ~1%). During the middle of kindergarten, 288 children (~25% lost to attrition) were assessed via the Test of Early Mathematics (TEMA-3) to evaluate predictive validity and the Woodcock–Johnson Letter Word Identification (WJ-ID) and Passage Comprehension (WJ-PC) subtests to evaluate divergent validity. Finally, during the middle of first grade, 246 children (~36% total missing) were reassessed via the TEMA, WJ-ID, and WJ-PC. Missingness was handled via full information maximum likelihood techniques during factor analysis. When factors were correlated with individual standardized measures (Sample 1), missing cases were listwise deleted.
Large validation sample (Sample 2)
The CPM Math Subtest was introduced as a pilot subtest within the larger State progress monitoring system (for overview of the statewide program, see Landry et al., 2012). In this second sample, 3,691 children (Mage = 4.40, SD = 0.45) across 28 school districts (164 schools) completed the CPM Math Subtest on the state’s online assessment system platform. At this time, the state contracted with a private vendor who was responsible for the online implementation of the measure and the collection of the data. At the time, only age was collected; no other demographic variables were included. Children were assessed on the CPM Math Subtest at the beginning, middle, and end of the year. Beginning of the year results are reported here, and middle of the year was used to calculate test–retest reliability.
Procedure Sample 2
By design, the CPM Math Subtest was designed to be administered by teachers and utilized procedures similar to assessments being used in a large statewide PD effort. All procedures required to complete the CPM Math Subtest are included on the device (i.e., laptop, desktop, or large tablet). Training for teachers was provided across the state in the summer prior to implementation. Finally, an online User Guide was developed as a training tool for teachers. Teachers completed the CPM Math Subtest used in analyses to evaluate the factor structure and test–retest reliability of the measure (i.e., with Sample 2). Teachers typically complete universal screening/progress monitoring measures in their classrooms. However, information about where teachers completed the CPM Math subtest was not collected systematically. Table 3 provides the reader with specific information about when each measure was completed by sample (e.g., middle of the pre-K year) and who collected the data (i.e., research assistants or teachers).
Specific Information About When Measures Were Administered and Who Collected the Data.
Note. pre-K = prekindergarten; PM = progress monitoring; BOY, MOY, and EOY= Beginning, Middle, and End of the School Year; TEMA = Test of Early Mathematic Abilities–Third Edition; EOWPVT = Expressive One-Word Picture Vocabulary Test; WJ = Woodcock–Johnson.
Missingness Sample 2
Within Sample 2, all but 10 children had complete data. Missing data appeared to be related to discontinuation of testing (only a part of the test was administered, n = 8), or that the first question (rote counting) was left blank.
Math Subtest Development
Following an extensive review of Texas Education Agency prekindergarten guidelines and national standards (i.e., NCTM and CCCSS), the research team developed an initial pool of 27 items. Given a goal of a scalable, easy-to-administer items and electronic administration, we avoided the use of manipulatives that are common in early math assessments. Feedback on items was obtained from researchers with expertise in early childhood and math, instructional coaches working on pre-K projects, and pre-K classroom teachers. Approximately 25 teachers were given access to a paper-and-pencil version of the measure in the year prior to the launch of the electronic administration application. Teacher impressions were quite positive (e.g., short, easy-to-administer, well linked to state prekindergarten guidelines, children enjoyed tasks). Therefore, use of the paper-and-pencil version in the validation study (i.e., Validation Sample 1) proceeded within the confines of the Lonigan et al. (2015) study. However, after validation work was completed, we developed an electronically administered version for the later sample (i.e., Validation Sample 2).
Item content
All items are administered during each administration. This avoided complicated basal and ceiling rules for teacher administration/scoring. The subtest includes a rote counting item, five shape naming items, seven number naming items, six shape discrimination items (e.g., point to all of the triangles in an array of different shapes), five counting set items, and three simple word problems (i.e., two subtraction and one addition problem), totaling 27 items. It can be completed in approximately 4 to 6 min. See Table 4 for description of item content.
Description of CPM Math Screener Item Content and Percent Correct.
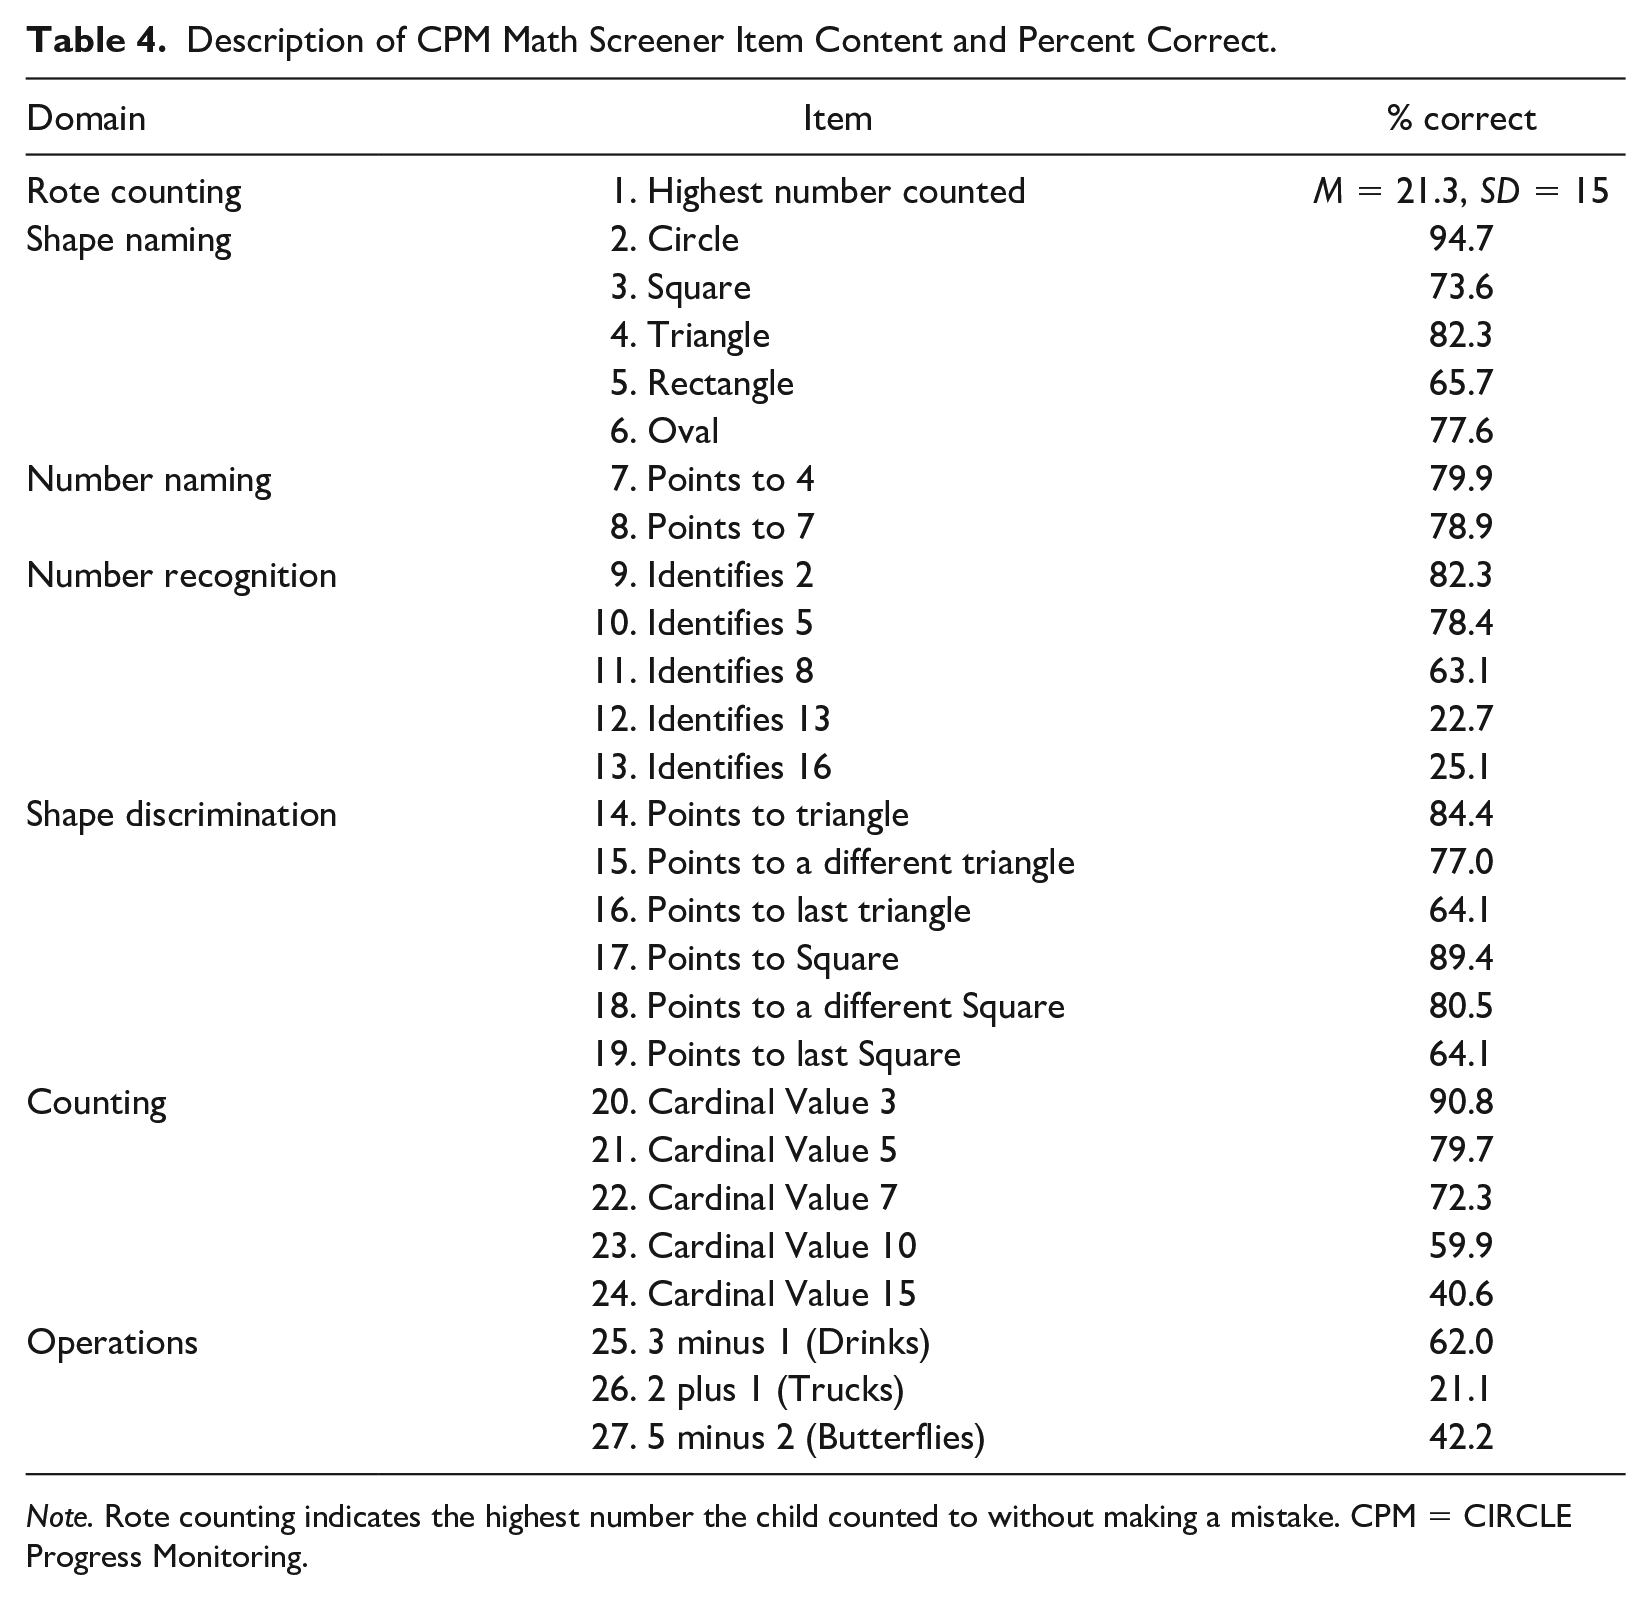
Note. Rote counting indicates the highest number the child counted to without making a mistake. CPM = CIRCLE Progress Monitoring.
Measures to Establish Convergent, Predictive, and Divergent Validity
Measures to establish convergent and predictive validity
The Applied Problems subtest of the Woodcock-Johnson-III Normative Update (WJ-AP; McGrew et al., 2007) was used to measure children’s abilities to count small sets and to solve simple addition and subtraction problems with the support of pictures. The measure has good psychometric properties for children at this age. For instance, test–retest reliability for children between the ages of 2 and 7 is reported to be strong (i.e., .90). Validity for the WJ-AP subtest is demonstrated by scores being strongly correlated with other measures of children’s math abilities. For instance, Mather and Gregg (2001) reported scores from the WJ-AP subtest and the Numerical Operations subtests of the Wechsler Individual Abilities Test were correlated at a high level (r = .63).
The CMA (Starkey et al., 2004) was used to measure mathematical knowledge at the beginning and end of the prekindergarten intervention year and at the 1-year kindergarten follow-up. The CMA comprised 16 tasks (with multiple problems per task) that assess informal mathematical knowledge in the areas of number, arithmetic, space and geometry, measurement, and patterns. Reliability (Cronbach’s α; N = 100) of the CMA for pre-K children in the fall and spring is .84 and .86, respectively.
The TEMA-3 (Ginsburg & Baroody, 2003) was used as another measure to establish validity. The TEMA-3 is a norm-referenced, reliable, and valid test of early mathematical ability that can be used for children between 4 years and 4 years 11 months (Ginsburg & Baroody, 2003). Internal consistency values for 4- to 6-year-olds range from .93 to .95. Test–retest (2-week) reliability is .88 to .93. Bliss (2006) reported that correlations between the TEMA-3 and other tests ranged from .54 (Basic Concepts subtest of the Key Math R and .91 for the Math Quotient of the Young Children’s Achievement Test). Bliss (2006) concluded that the TEMA-3 had moderate to strong correlations with other measures purporting to measure early math skills in children.
Measures to establish divergent validity
The EOWPVT-III (Gardner, 2003) was used to evaluate children’s academic language skills in the project. Test–retest reliabilities over a 20-day interval are .88 and .89 for 2- to 4-year-olds and 4- to 7-year-olds, respectively. A number of studies show concurrent correlations ranging from .64 to .87 with other language measures and from .67 to .90 with other specific measures of vocabulary.
The Letter-Word Identification and Passage Comprehension subtests from the Woodcock–Johnson-III Normative Update (WJ-III; McGrew et al., 2007) were used as measures to establish divergent validity. Test–retest reliability for the Letter-Word Identification and Passage Comprehension subtests was reported to be relatively strong (r = .96 and .75, respectively). The publisher of the Woodcock–Johnson Tests of Academic Achievement-III reports that the measure was designed based upon principles inherent in Cattell–Horn–Carroll theory (CHC). However, the authors also describe their efforts to ensure content validity based upon the fact that the WJ-III was aligned with core curricular areas and domains specified in federal legislation (Schrank et al., 2001). Additional evidence of criterion-related validity for WJ-III subtests is cited by the authors (Schrank et al., 2001) by a demonstration of strong correlations between composite scores of the WJ and other measures evaluating similar constructs. For example, the Basic Reading and Reading Comprehension clusters of the Woodcock–Johnson (which include the Letter-Word Identification and Passage Comprehension subtests) are highly correlated with other measures evaluating similar constructs. Schrank et al. (2001) reported that the Basic Reading and Reading Comprehension cluster scores are correlated at high levels with similar clusters from the Kaufman Test of Educational Achievement (r = .67 and .62) and the Wechsler Individual Achievement Test (r = .63 and .68).
Online platform
Following the initial work with a paper-and-pencil format, we developed an online administration platform (www.cliengage.org). The CPM measures are unique in that they are (a) freely available to school districts and charter schools in Texas; (b) delivered through a technology platform that provides multiple reports, including suggested student groupings and recommended leveled, small-group activities; (c) comprehensive in assessing student learning across academic domains; and (d) are widely used (e.g., 240,000 children completed measures during the 2017–2018 academic year). Importantly, past work in the literacy domain (Landry et al., 2009) demonstrated that these types of progress monitoring measures and using data to guide instructional practices led to better child outcomes. Currently, we are seeking funding to evaluate the effectiveness of these PD supports in mathematics instruction.
Results
Analytic Strategy
To evaluate the reliability and validity of the measure, several different types of analyses were employed. To investigate evidence of construct validity and select the final set of items, we used factor analysis. In both samples, exploratory factor analysis (EFA) was used to evaluate how items empirically clustered. Findings from the EFA were then tested via confirmatory factor analysis. Once factor structure was confirmed across samples, we ensured that all items loaded above .40 indicating that the items indexed the latent factor well (Tabachnick et al., 2007). Factor scores(s) were created for the CPM Math Subtest. Reliability and validity were examined based on five key criteria: construct validity based on replication of latent factor structure (both samples), internal consistency of all items (both samples), predictive, concurrent, and divergent validity were also examined (Sample 1).
Preanalysis Data Inspection
Individual item percent correct ranged from 21% of children responded correctly to −95% of children responded correctly, indicating a good range from difficult to easy items. The average item correlation was .39. As can be seen in Table 5, correlations ranged from .22 to .67, and support factorability of the data (Tabachnick et al., 2007).
Descriptive Statistics and Correlations Between CPM Math Screener and Child Outcome Measures (Sample 1).
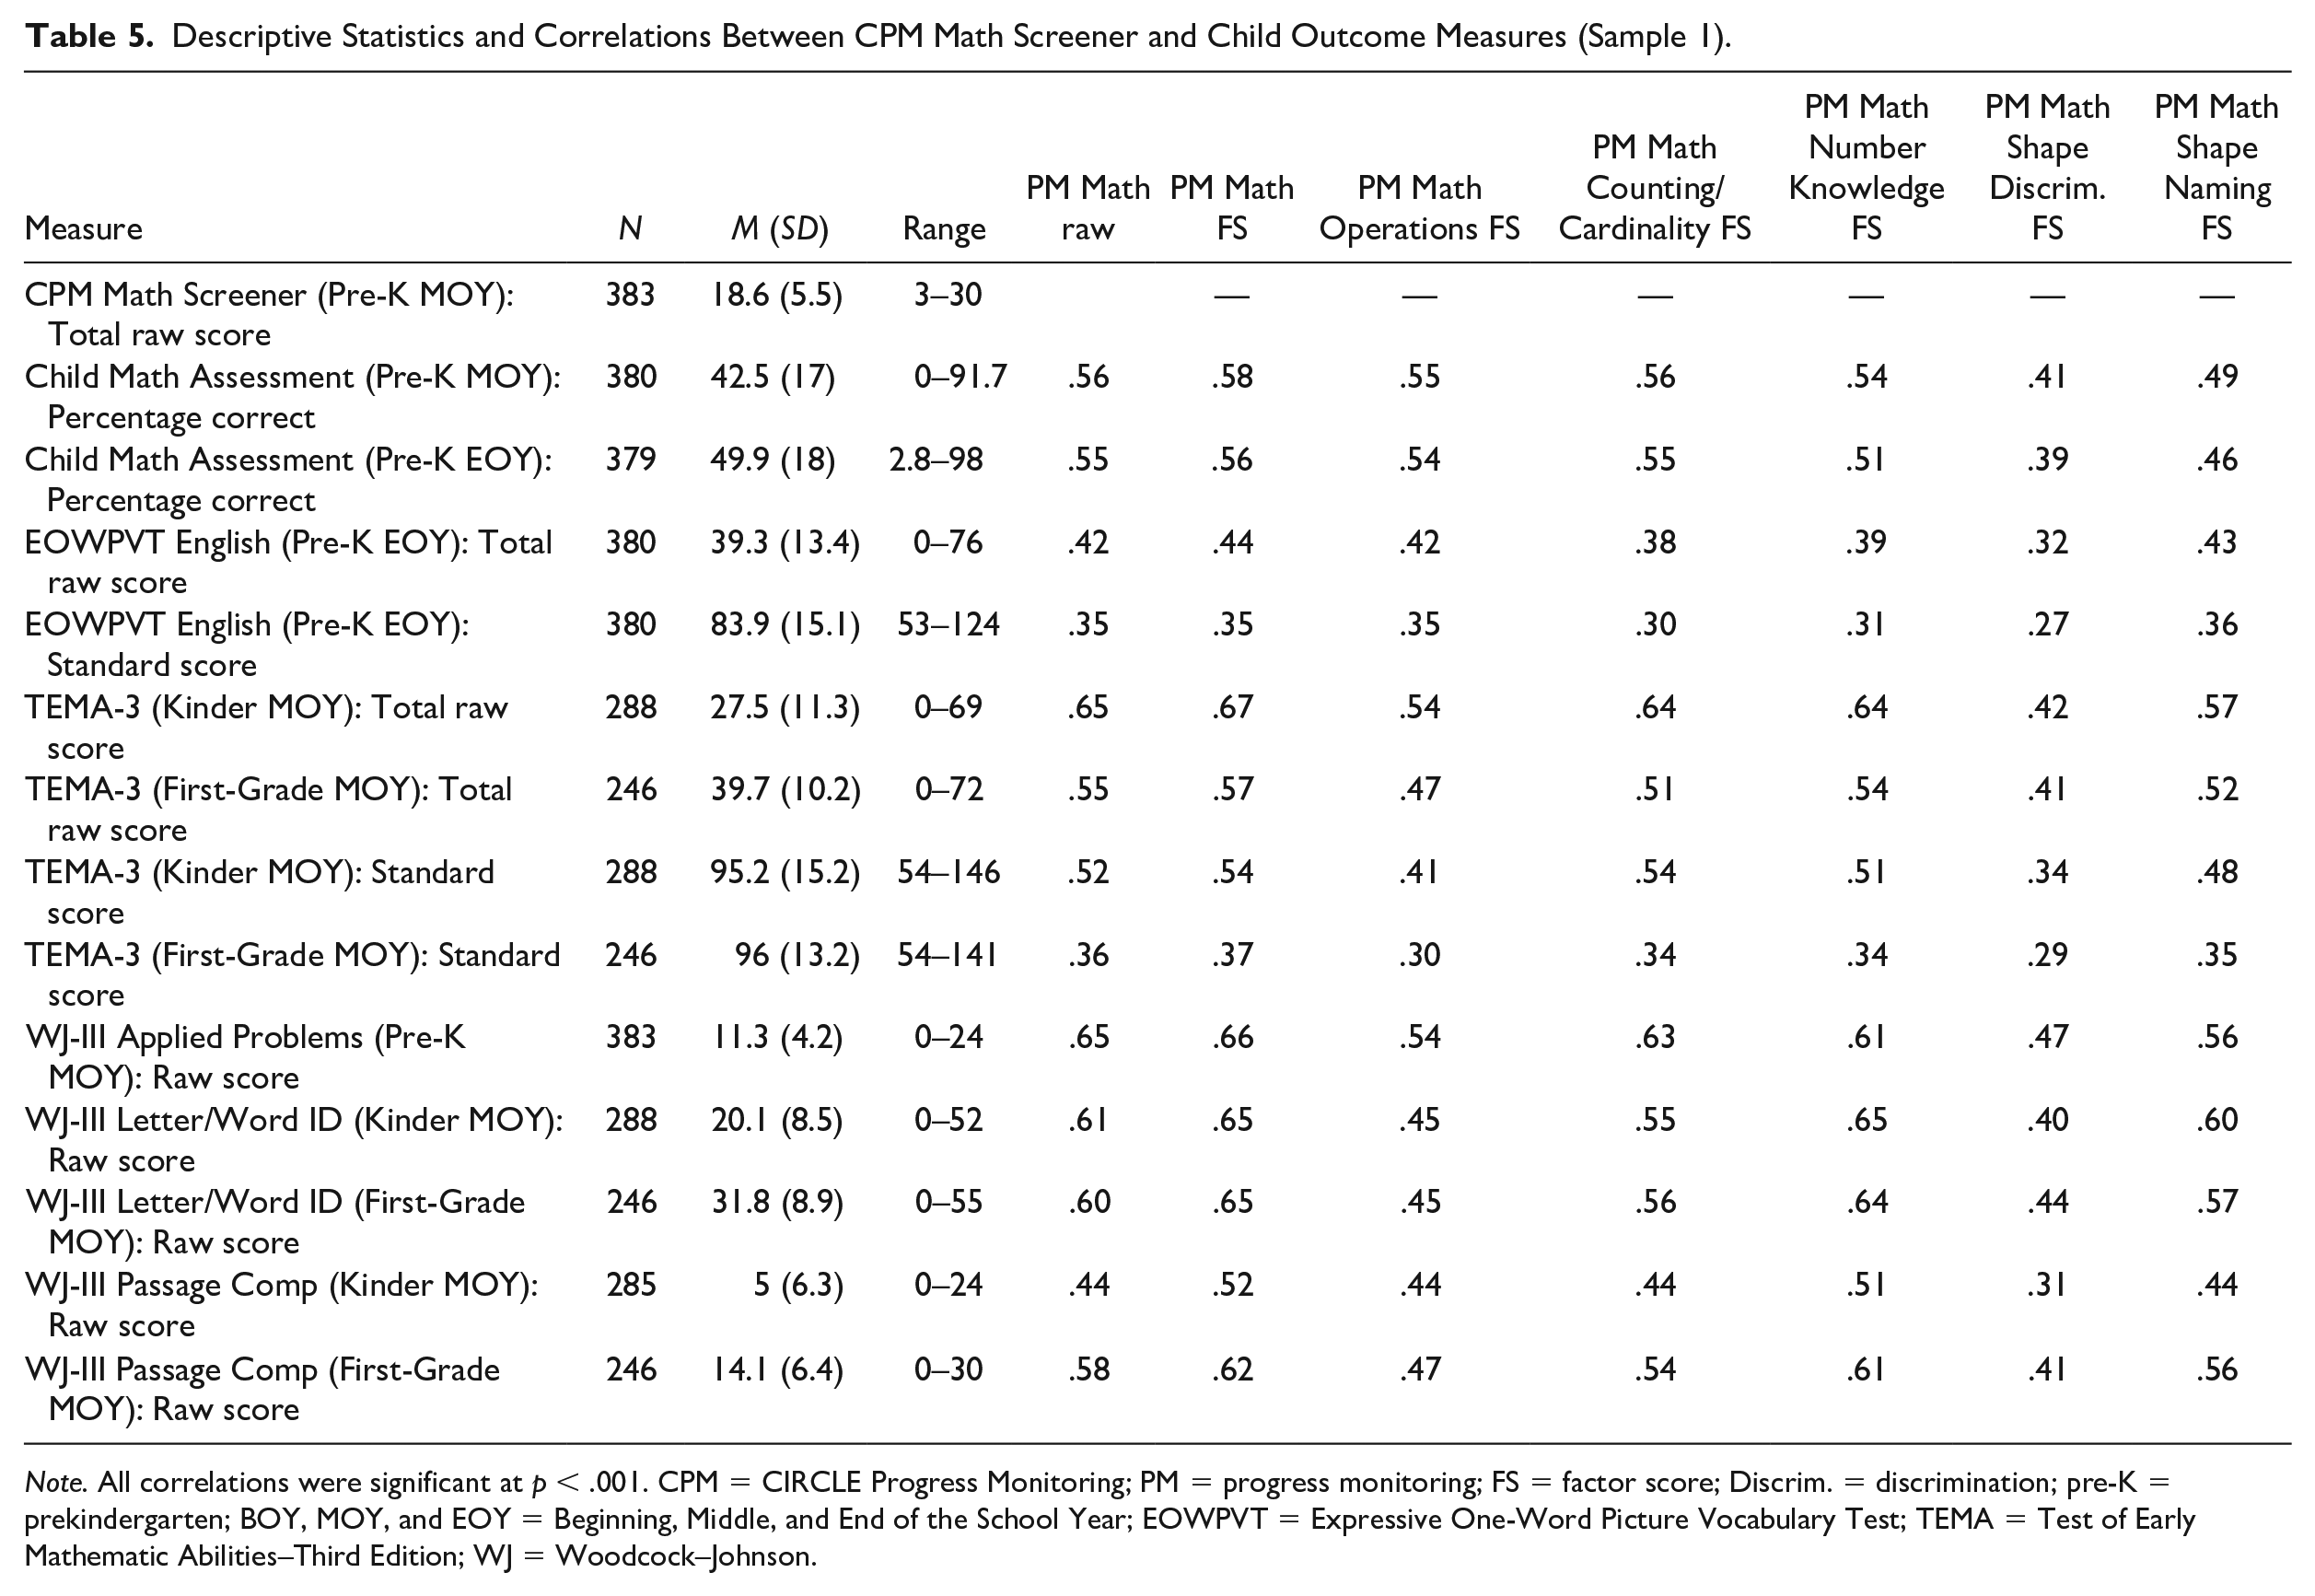
Note. All correlations were significant at p < .001. CPM = CIRCLE Progress Monitoring; PM = progress monitoring; FS = factor score; Discrim. = discrimination; pre-K = prekindergarten; BOY, MOY, and EOY = Beginning, Middle, and End of the School Year; EOWPVT = Expressive One-Word Picture Vocabulary Test; TEMA = Test of Early Mathematic Abilities–Third Edition; WJ = Woodcock–Johnson.
Dimensionality and Reliability of the Items
We first performed EFA of the 27 categorical items (i.e., correct vs. incorrect) that had been collected for Sample 1. We conducted the analyses within Mplus (version 7.2; Muthén & Muthén, 1998–2012) using means- and variance-adjusted weighted least squares estimation. Examination of the eigenvalues revealed a single dominant factor (eigenvalues = 11.5, 2.7, 2.0, 1.6, 1.6, 1.1, 1.0, .9, . . .; ratio of first to second eigenvalue = 4.3), but six factors had eigenvalues greater than 1.0, thus providing meaningful variance (Tabachnick et al., 2007). Examination of global fit indices indicated that the one-factor model did not characterize the data well (confirmatory factor index [CFI] = .86, root mean square error approximation [RMSEA] = .08) nor did the two-factor model (CFI = .91, RMSEA = .07), given that CFIs greater than .95 and RMSEAs less than .05 are generally considered indicative of excellent fitting models (Hu & Bentler, 1999). Evaluation of different loadings across the three-, four-, and five-factor solutions indicated some evidence of a five math subdomain (Shape Naming, Shape Discrimination, Number Knowledge, Counting, and Operations) solution. This solution is similar to the three theoretical domains included by the test developers based on NCTM, CCSS, and TEKS standards but with aspects of geometry and spatial relations, and number and counting broken into separate factors. Each factor included three to seven items that dominantly loaded on a single factor with loadings between 0.40 and 1.05, indicating the variables indexed the factors well (Comrey & Lee, 1992), and factor correlations were moderate but significant (rs = .20–.45).
At this point, we examined a confirmatory factor analysis model based on the five subdomains that formed the assessment (with no cross loadings). This model fit the data well (CFI = .97, RMSEA = .04). Factor loadings for the five factors ranged from 0.55 to 0.97, and interfactor correlations ranged from .37 between Shape Discrimination and Operations to .70 between Shape Naming and Number Knowledge, all significant at ps < .01. Given the moderate to high correlations between the factors, we decided to examine a second-order, “Math” factor indexed by the five subdomains (Chen et al., 2005). The factor loadings of the five factors were all moderate to high (0.61–0.90); the fit for this model was equivalent to the correlated factors model (CFI = .97, RMSEA = .04). The second-order factor structure also fits well with the theoretical structure of math espoused by leading organizations (e.g., NCTM, 2000). See Figure 1 for the final model estimates. All individual items loaded above .40; thus, no items were dropped. Cronbach’s alpha reliability of all the retained 27 items was .88, indicating good internal consistency of items.
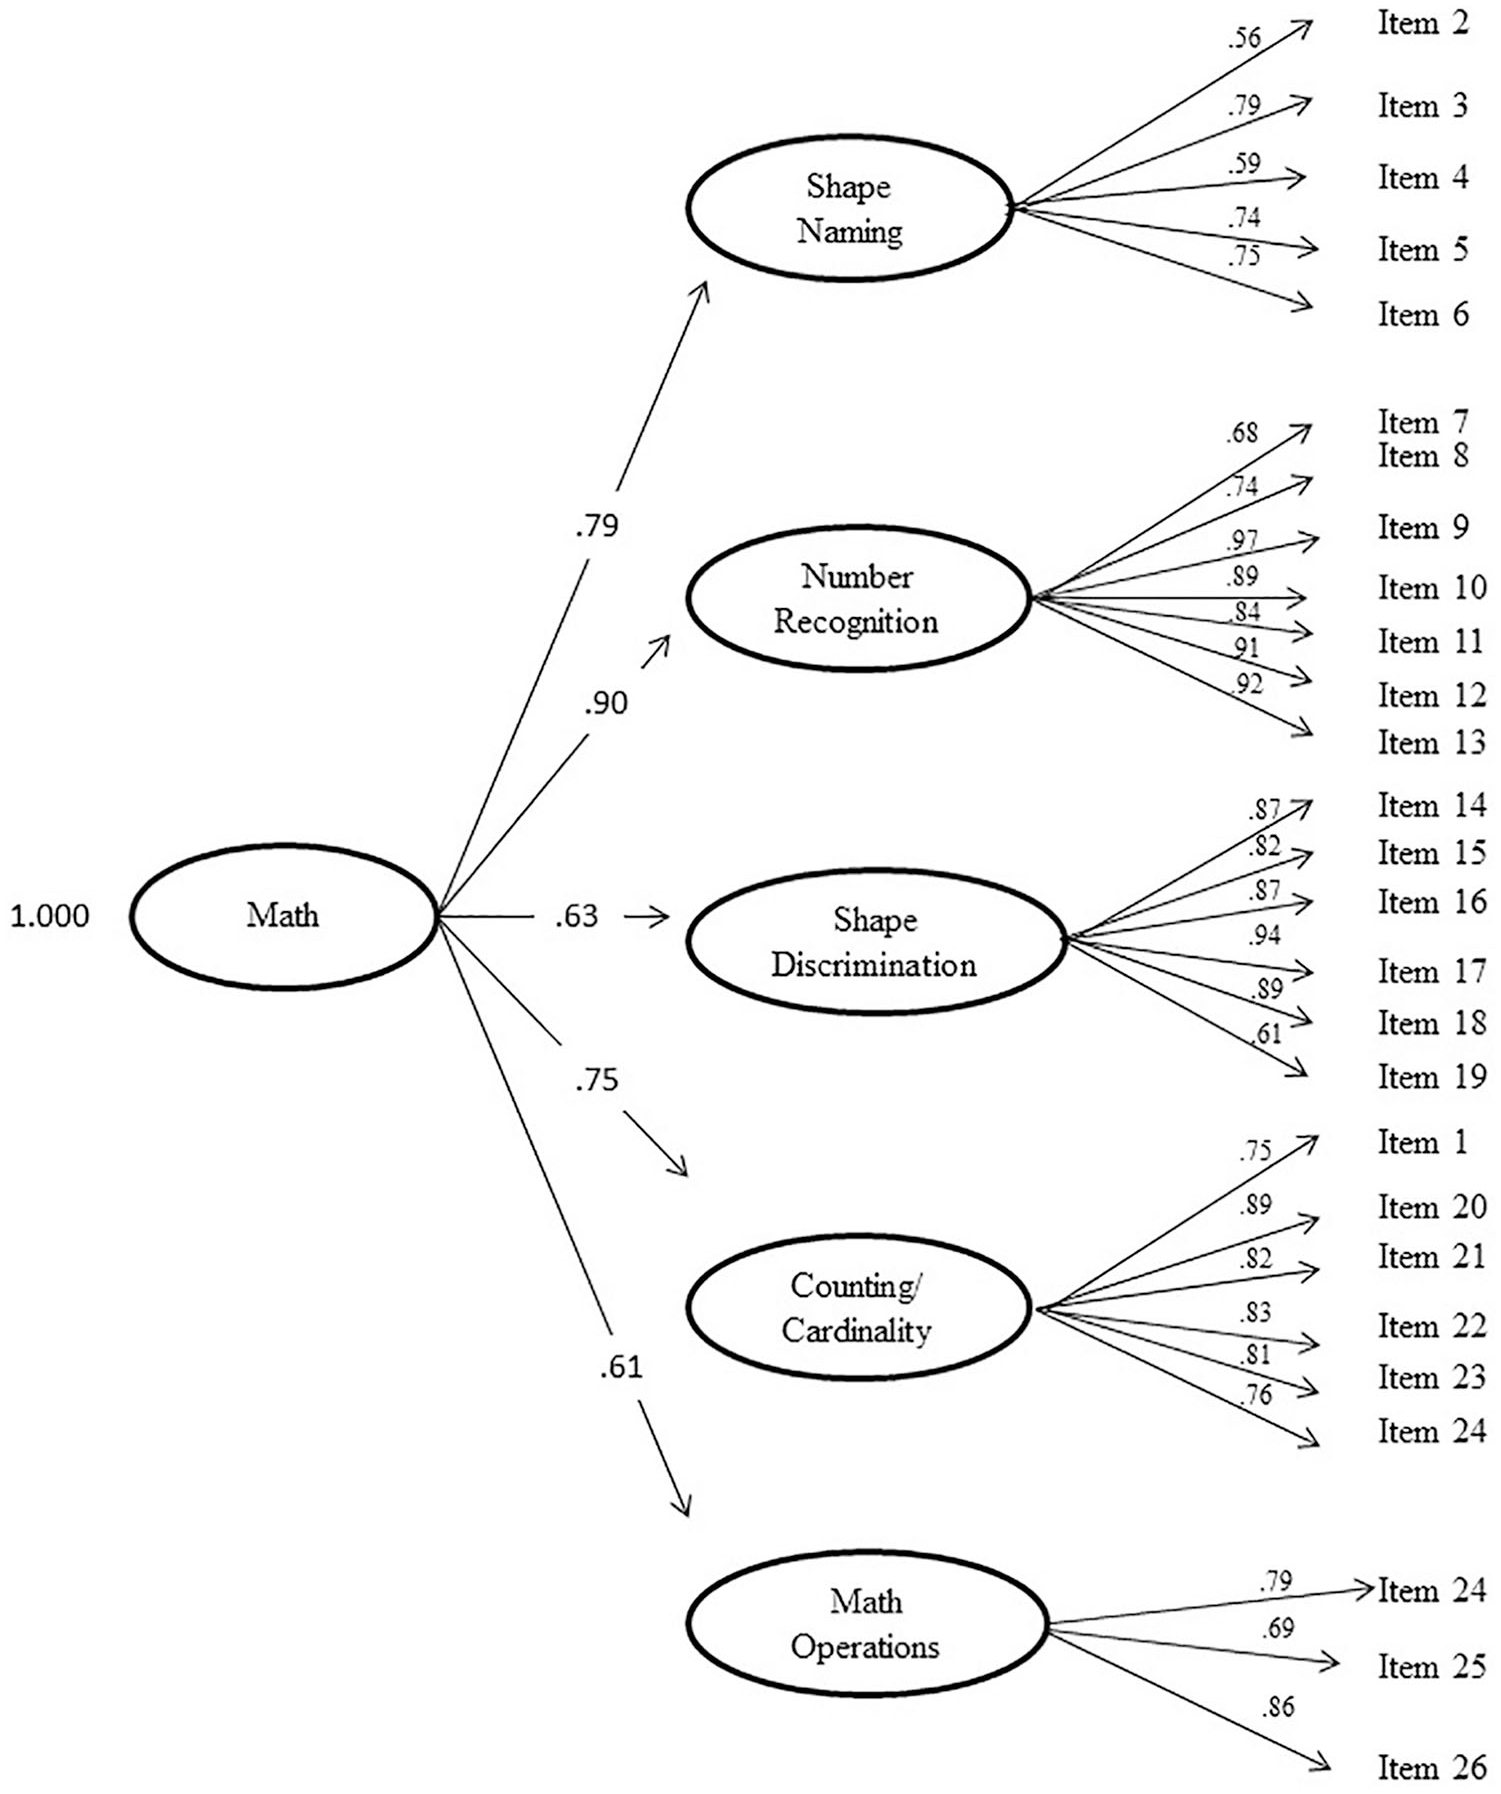
Final factor structure of the CPM Math Screener including subdomains.
Cross-Validation of Factor Structure and Reliability With Sample 2
Item means and correlations were similar, although means tended to be lower in Sample 2 versus Sample 1. The EFA indicated a similar pattern of results with Sample 2 as compared with the Original Sample 1. Eigenvalues indicated one dominant factor and up to five factors that contributed meaningful variance (13.66, 2.45, 1.79, 1.32, 1.04). The five-factor solution fit well (RMSEA = .05, CFI = .99) and had the same factor structure. We thus continued on to the CFA model with five correlated factors and no cross loadings. Model fit was good (RMSEA = .05, CFI = .98). Standardized loadings ranged from 0.71 to 0.93, and all factors were correlated with correlations between .54 and .74, ps < .01. The factor loadings of the five factors were all high (0.71–0.87), and the fit for this model was equivalent to the correlated factors model (RMSEA = .04, CFI = .98). Based on these findings, we conclude that the CPM Math Subtest items show consistent factor loadings across multiple samples, and that the factor structure overall remains remarkably consistent. Cronbach’s alpha in Sample 2 was .94 for all 27 items, indicating excellent internal consistency. Test–retest reliability between the beginning of year raw score and middle of year raw score was .78, indicating good consistency across timepoints.
Concurrent, Predictive, and Divergent Validity
Concurrent and predictive validity were established with the Original Sample 1. Means and standard deviations for the math (convergent) as well as language and literacy (divergent) outcome measures are listed by time point collected in Table 5. Table 5 also includes correlations between the CPM Math subtest and the raw scores, and factor scores. All correlations were significant at p < .001. Scores on the CPM Math Subtest (collected at midyear pre-K) were moderately correlated with CMA math scores at the same wave (r = .56, p < .001) and at Wave 3 (r = .55, < .001). It was also correlated highly with the Woodcock–Johnson Applied Problems subtest (r = .65, p < .001) at mid-year, and the TEMA-3 in kindergarten (r = .65, p < .001). It was moderately correlated with the TEMA-3 in first grade (r = .55, p < .001). Based on these findings, we conclude that scores from the CPM Math Subtest have good concurrent and predictive validity across a 2-year span. CPM Math Subtest scores were also correlated with scores from the Expressive One-Word Picture Vocabulary Test (r = .42, p < .001) at the end of pre-K, the Woodcock–Johnson Letter-Word Identification subtest (decoding, r = .61, p < .001), and the Woodcock–Johnson Passage Comprehension task (r = .44, p < .001), both administered in kindergarten. Although scores from the Letter-Word Identification subtest were highly correlated with scores from the CPM Math Subtest, the scores from the other two language and literacy outcome measures were only moderately correlated with scores from CPM Math Subtest when compared with the math outcome measures. This pattern provides evidence of divergent validity.
Discussion
Given the fact that 60% of fourth-grade students in America are not proficient in math (NAEP, 2017), development of efficient, valid, and reliable pre-K progress monitoring measure that has the potential to inform instruction is critically important to enhance student outcomes (Landry et al., 2009). In addition, screening assessments should only be used when the available instruments are able to provide evidence of predictive validity (NRC, 2009). The CPM Math Subtest appears to meet these criteria and has been used in large-scale PD projects for several years. This work provides strong evidence that the Math Subtest is reliable, valid, and conforms to a predictable factor structure.
When evaluating information provided by authors about the validity of similar measures, a strong case can be made that the CPM Math Subtest compares favorably with other assessments evaluating early math skills. For instance, correlations between the IGDIs-Early Numeracy subscales (Hojnoski & Floyd, 2004, 2013) and the Bracken Basic Concepts Scale–Revised’s Quantitative scale range from .29 to .51. Similarly, VanDerHeyden et al. (2006) reported that their counting objects task and visual discrimination tasks were correlated at moderate levels with scores on the TEMA-2 (r = .49 and .50, respectively). Finally, the Preschool Early Numeracy Scales (Purpura & Lonigan, 2015) correlated with WJ subtests at levels between .35 and .66. In contrast, scores from the CPM Math Subtest were correlated with the Applied Problems subtest at moderately high levels at the same time point (i.e., r = .61 and .71) and the CMA at midyear (i.e., .67 and .51). In addition, the CPM Math subtest provides very strong evidence of predictive validity as scores on the CPM Math Subtest are strongly correlated with scores from the TEMA-3 at kindergarten (r = .77 and .52) and even first grade (r = .58 and .57). While the CPM Math Subtest certainly compares favorably with other measures in terms of concurrent and predictive validity, it assesses important math skills efficiently and cost effectively. This has led to widespread adoption across a large state.
The measure is widely used with more than 240,000 children completing the CPM Math Subtest during the 2017–2018 academic year. In addition, results from the CPM Math Subtest are linked to classroom activities that teachers can use with children who are struggling. The ability to link assessment results to classroom activities appears to meet criteria set forth by the NRC’s (2009) policy paper which states that effective assessment should be horizontally linked with the curriculum and aligned with early learning and development standards. The measure is available within an online system (www.cliengage.org) that automatically suggests activities for children who are struggling. In total, the online system includes 75 math activities that teachers can choose to use in their classrooms. While future studies are needed to determine whether teachers use and children benefit from universal screening/progress monitoring and linked activities, this CPM Math subtest provides a base from which children can be identified to determine whether they might benefit from participation in Tier II instructional approaches. In addition, the CPM Math subtest can provide teachers, district administrators, and state legislators with information surrounding the effectiveness of Tier I math instruction in prekindergarten across several domains considered to be important by their inclusion in state pre-K guidelines, NCTM content standards, and CCSS.
While the CPM Math Subtest does not attempt to measure all domains considered to be important in the State Pre-K guidelines, NCTM Content Standards, or CCSS, it is certainly not unidimensional in terms of the content it evaluates. In addition, it places a heavier emphasis on number and counting activities (i.e., one rote counting item, seven number naming or recognition items, and five counting/cardinal value items) which is likely to be more predictive of later child mathematical skills (Bailey et al., 2018; Geary, 2007; NMAP, 2008; Siegler & Robinson, 1982). Although it is recognized that there are some omissions (e.g., patterning and measurement), these decisions were made due to efforts to make the CPM Math Subtest easy-to-administer at large scale for teachers. Currently, teachers can administer the measure in approximately 5 min.
Limitations
The CPM Math Subtest has been criticized by some educators for not including hands-on manipulatives which are often used by young children during counting exercises and when solving addition and subtraction problems. The measure is also limited to some extent due to the fact that funds were not available to evaluate the normative characteristics of the subtest in a nationally representative sample of children. In addition, a limitation of this work surrounds the fact that initial validation work was completed on the paper-and-pencil version of the measure (vs. the electronically scored version used in the analyses evaluating the factor structure of the measure). This decision was made due to the time and cost involved having the measure developed on an online platform. An additional limitation surrounds the fact that complete demographic information is not included in the samples used to conduct the EFA and CFA. It is also recognized that evaluation of young children’s early academic skills is challenging. In addition to needing to develop measures that are reliable and valid, it is important that tasks are enjoyable and engaging for children and teachers. It is hoped that the CPM Math Subtest succeeds in these objectives. Future goals include developing a vertically aligned math subtest through the second grade so that teachers can see growth over a longer time period than the pre-K year. In addition, there is a need to conduct additional cross-validation studies, evaluate the performance of children across time, and evaluate the impact of teachers who use the CPM Math Subtest results and linked activities as a part of a Tier II instruction.
Conclusion
In sum, the CPM Math Subtest conforms to a well-defined five-factor model that parallels many of the areas considered to be important in the math literature and state pre-K guidelines (e.g., NCTM, 2000). In addition, scores from the measure are internally consistent, and validity has been established with scores being strongly correlated with other measures evaluating math skills. The freely available CPM Math Subtest provides teachers with an easy-to-administer assessment that has the potential to support classroom instruction.
Footnotes
Acknowledgements
The authors would like to thank Dr. Paul R. Swank for his initial validation work on the measure.
Author Contributions
M.A.A., J.J.M., S.H.L., M.F., T.Z., A.C., and H.H. were responsible for writing the article. M.A.A. and S.H.L. developed the measure. J.M.W., J.J.M., and V.B. provided statistical expertise and wrote the “Results” section.
Declaration of Conflicting Interests
The author(s) declared no potential conflicts of interest with respect to the research, authorship, and/or publication of this article.
Funding
The author(s) disclosed receipt of the following financial support for the research, authorship, and/or publication of this article: This study was supported by a grant from the National Institute of Child Health and Development (P01HD048497) and the Texas Education Agency.