
Abstract
Although life satisfaction has been associated with maladjustment and adverse experiences among adolescents, few validated measures of life satisfaction have been evaluated for use with diverse populations. The Brief Multidimensional Students’ Life Satisfaction Scale (BMSLSS) is a promising measure that has been validated in samples of White and Black adolescents. This study used an item response theory approach to evaluate its psychometric properties in a diverse rural sample of early adolescents and its concurrent associations with other measures of youth adjustment. Support was found for partial invariance across sex and racial and ethnic identities. Scores on the BMSLSS were also correlated with measures of youth adjustment. However, the strength of these correlations differed for adolescents of different racial and ethnic identities. Findings suggest that the BMSLSS is a psychometrically sound measure for assessing life satisfaction in diverse samples of adolescents and highlights the importance of assessing invariance across racial and ethnic groups.
Keywords
Evaluation of the Brief Multidimensional Students’ Life Satisfaction Scale in a Diverse Sample of Rural Early Adolescents
Life satisfaction is defined as an individual’s subjective appraisal of quality of life based on a global evaluation of how a person perceives the achievement of personal aspirations (Diener et al., 1999). The increasing focus on life satisfaction as an important factor in the study of adolescent mental health can be attributed to the increasing use of the dual factor model of mental health to provide a more comprehensive understanding of adolescent functioning. According to this model, both positive subjective well-being and symptoms of psychopathology are critical for understanding mental health (Antaramian et al., 2010). Positive well-being during adolescence has been associated with adaptive outcomes that include higher school performance, decreased problem behaviors, and coping with neighborhood stress (for a review see Valois, R. F. et al., 2020).
Lower life satisfaction during adolescence is associated with a wide range of both psychological and social problems including anxiety, depression, and isolation (Gilman et al., 2000). Among middle school-aged adolescents, low life satisfaction has been associated with carrying a weapon and physically fighting (Valois, R. F. et al., 2006), cyber aggression and victimization (Moore et al., 2012), peer victimization, and perceived teacher unfairness (Gini et al., 2018). Among high school adolescents, low life satisfaction has been associated with maladaptive behaviors such as physical fighting (Valois, R. F. et al., 2001), substance use (Zullig et al., 2001), peer victimization due to race (Kerr et al., 2010), and attempted suicide (Valois, R. F. et al., 2004). In contrast, high life satisfaction is related to better attitudes toward teachers, more effective intrapersonal functioning, and absence of clinical levels of internalizing (anxiety, stress, and depression) and externalizing (aggression, conduct challenges, and hyperactivity) symptoms among adolescents (Gilman & Huebner, 2006). Life satisfaction has also been found to moderate the effects of stressful life events on the development of subsequent externalizing behavior problems in middle and high school adolescents (Suldo & Huebner, 2004).
Despite potential advantages of including measures of life satisfaction in research on youth mental health, few measures have been developed and tested to examine life satisfaction among youth. One reliable measure of adolescent life satisfaction is the Multidimensional Students’ Life Satisfaction Scale (MSLSS; Huebner & Gilman, 2002). The MSLSS assesses life satisfaction across five specific domains (i.e., family, school, friends, self, and living environment) in children and adolescents aged 8–18 years. Prior studies have demonstrated that the MSLSS has good reliability and validity based on correlations with other measures of youth well-being (see Huebner & Gilman, 2002 for a review). However, the MSLSS has 40 items, which can create considerable participant burden if used with other measures. Consequently, a shorter 5-item version, the Brief Multidimensional Students’ Life Satisfaction Scale (BMSLSS), was created to assess youth life satisfaction. The BMSLSS has five items, each of which assesses satisfaction on one of the five domains represented on the MSLSS, and an optional item to assess overall life satisfaction (Seligson et al., 2003). This provides an assessment of both context-related life satisfaction and an overall, general sense of life satisfaction (Zappulla et al., 2013). Confirmatory factor analysis of the BMSLSS with a sample of adolescents from the United States has supported its one-factor structure (Funk et al., 2006). Scores on the BMSLSS have also demonstrated good internal consistency for middle school students (Seligson et al., 2003), and convergent validity based on associations with other self-report measures of life satisfaction, such as the MSLSS (Funk et al., 2006) and the Students’ Life Satisfaction Scale (Huebner et al., 2006). Prior studies have also found support for its construct validity based on moderate correlations with the Positive and Negative Affect Schedule for Children (Funk et al., 2006; Huebner et al., 2006).
Despite its importance, there has been surprisingly little research investigating the extent to which adolescents’ life satisfaction differs across race, ethnicity, and sex. Valois, R. F. et al. (2019) found that scores on the BMSLSS had good internal structure and consistency in a sample of Black adolescents (ages 13–18 years), but they were not able to test for invariance across race because the sample was limited to Black adolescents. An international study of the BMSLSS concluded that the scores had good psychometric properties across samples of adolescents and emerging adults from 23 countries (Abubakar et al., 2016), but found that the structure of the scale differed across samples from different countries. However, the authors did not include early adolescents, test for differences across sex, or take into account diversity within countries. Studies have also found sex and race differences in life satisfaction. For example, Huebner et al. (2006) found that White adolescents had higher levels of life satisfaction compared with Black adolescents in a high school sample. In another sample of high school adolescents, Gilman et al. (2000) found that female students reported higher levels of satisfaction with friends compared with male students, and Black adolescents reported higher levels of satisfaction in the family, self, and total domains compared with White adolescents. These findings suggest that there may be differences between adolescents of different race, ethnicity, and sex in both the structure and levels of life satisfaction, and in associations between life satisfaction and adjustment. However, few studies have examined differences in life satisfaction across ethnicity (i.e., Latinx vs. non-Latinx), or focused on life satisfaction during early adolescence, a time of rapid social-emotional development.
The Current Study
The purpose of this study was to evaluate the structure of the BMSLSS in a large sample of middle school students in rural Florida, comprised of Latinx, Black, and non-Hispanic White youth. This enabled us to evaluate measurement invariance across sex and groups that differed in race and ethnicity. There has been increasing recognition of the need to establish measurement invariance, or the degree to which measurement properties are consistent across individuals and contexts (Bowen & Masa, 2015). We hypothesized that a model in which all items of the BMSLSS loaded on a single factor of overall life satisfaction would fit the data well, and that the factor structure of the BMSLSS would not differ across sex or race and ethnicity. Prior analyses of the BMSLSS have treated item responses as interval-level data (e.g., Abubakar et al., 2016; Funk et al., 2006; Seligson et al., 2003; Valois, R. F. et al., 2019). This is a strong assumption given the subjective nature of the anchor points on the 7-point rating scale. We examined the structure of the BMSLSS using item-response theory, which treats items as ordered categorical variables.
We also evaluated the construct validity of the BMSLSS based on its correlations with measures of witnessing violence, victimization, health-risk behaviors, and negative life events, and the consistency of these relations across sex and race and ethnicity. Based on prior findings, we hypothesized that, compared with male adolescents, female adolescents would report higher satisfaction with friends, but would report similar levels of satisfaction in other domains and in total life satisfaction. We did not, however, expect sex differences in associations between life satisfaction and adjustment. Our analyses of differences across race and ethnicity were exploratory based on inconsistent findings in the few prior studies that examined differences between White and Black adolescents, and the absence of previous studies that have examined differences between adolescents from different ethnic backgrounds.
Methods
Setting and Participants
This study was based on analyses of pretest data from two cohorts of sixth grade students (N = 3338) collected in a study that evaluated a school-based violence prevention program in nine middle schools in five rural counties in Florida (Farrell et al., 2003). The majority of students at all schools (i.e., over 60%) were eligible for the federal free or reduced-price school lunch program. Many had parents who were migrant workers (i.e., 29%) and many lived in homes where English was not the primary language (i.e., 32%). All students in non-special education classrooms were eligible to participate. Based on students’ self-report, 50% of the overall sample was female, 51% were non-Hispanic White (49% female), 15% were Black (50% female), 22% were Latinx (52% female), 4% were American Indian (41% female), 1% were Asian American (51% female), and 6% endorsed “Other” (49% female).
Procedure
The evaluation study used passive consent whereby parents were informed of the study and given the option to have their child opt out. Surveys were administered to all students in non-special education classrooms during homeroom in the Fall of 1998 and 1999. Students were told that their answers would be kept confidential and were instructed to turn in blank booklets if they chose not to participate. All survey booklets were screened and 0.3% were excluded because their response pattern met criteria suggesting random responding (Farrell, A. D. et al., 1991).
Measures
Brief Multidimensional Student’s Life Satisfaction Scale
The BMSLSS (Huebner et al., 2006) has five items that assess satisfaction within specific domains: family life, friendships, school experience, myself, and where I live (i.e., environment). It also includes a rating of overall life satisfaction, which was not included in our analysis of the measure’s structure. Participants rated their satisfaction in each domain on a 7-point scale: 1 = Terrible, 2 = Unhappy, 3 = Mostly dissatisfied, 4 = Mixed (about equally satisfied and dissatisfied), 5 = Mostly satisfied, 6 = Pleased, and 7 = Delighted. A prior study concluded that scores on the BMSLSS had good reliability and were associated with youth violent behaviors (Valois, R. F. et al., 2001).
Exposure to violence
Violence exposure was assessed using the Children’s Report of Exposure to Violence (CREV, Cooley et al., 1995). The CREV has three subscales that represent witnessing violence against a stranger, witnessing violence against a familiar person, and experiencing victimization. Participants reported the frequency of violent acts they have either witnessed or experienced in their lifetime on a 4-point scale (1 = Never, to 4 = Many times). Previous studies of the CREV have reported good test–retest reliability, internal consistency, and construct validity (Cooley et al., 1995). Cronbach’s alphas in the current study were α = .75 for witnessing violence against a stranger, α = .69 for witnessing violence against someone the participant knew, and α = .53 for victimization.
Frequency of problem behavior
Adolescents’ frequency of engaging in problem behaviors was assessed by the Problem Behavior Frequency Scale (PBFS; Farrell, A. D. et al., 2000). The Physical Aggression scale includes seven items (alpha = .82) assessing the frequency of engaging in physical aggression. The 7-item Delinquent Behavior scale (alpha = .77) assesses the frequency of non-violent delinquent behavior. The six-item Drug Use Scale (alpha = .87) assesses the frequency of using specific drugs (e.g., cigarettes, beer, wine, marijuana). Participants rated the frequency of engaging in each behavior in the past 30 days on a 6-point scale (1 = Never to 6 = 20 times or more). Farrell, A. D. et al. (2000) found support for the factor structure of the PBFS and construct validity based on its pattern of correlations with measures of related constructs.
Other stressful life events
These were assessed by the Interpersonal Problem Situation Inventory for Urban Adolescents (IPSUA; Farrell, A. D. et al., 1998). The IPSUA has three scales that assess adolescents’ experiences encountering stressful interpersonal situations including a 5-item Environmental Stressors scale, a 4-item Unfair Situations scale, and a 5-item Peer Provocations scale. Participants rated their frequency of experiencing each situation in the past year on a 5-point frequency scale ranging from 1 = Never to 5 = Almost every day. Farrell, A. D. et al. (1998) found support for the structure of the measure and validity based on correlations with related constructs.
We included the 4-item Peer Pressure for Drug Use scale (alpha = .76) as an additional measure of stressful events. Participants rated their frequency of experiencing specific acts of peer pressure in the past 30 days using the same 6-point scale as the PBFS. Farrell, A. D. et al. (1992) found support for this scale as a more proximal measure of peer influences than peer models of drug use.
Demographic variables
Participants reported their sex (boy or girl) and selected racial or ethnic categories that best identified them: African American or Black; Hispanic or Latino; White, Caucasian, or European American; Asian American; American Indian or Native American; or Other.
Analysis
Analyses were conducted using Mplus version 8 (Muthén & Muthén, 2017). All models were estimated using the full information maximum likelihood (FIML) estimation method to address missing data. FIML uses all available data to estimate parameters. We used confirmatory factor analysis to examine the structure of the BMSLSS. We treated responses to the items as ordered categorical variables using weighted least squares mean- and variance-adjusted estimators (WLSMV). This is comparable to a graded item response theory model (Embretson & Reise, 2000). Parameters within this model include factor loadings, which represent item discrimination or how strongly a specific item is related to the underlying factor, and thresholds, which represent the level of the underlying factor at which individuals have a probability of .50 or higher of endorsing a higher category on the rating scale (e.g., moving from a rating of Mixed [about equally satisfied and dissatisfied] to a rating of Mostly satisfied, Pleased, or Delighted). Model fit was evaluated following recommendations by Hu and Bentler (1999). Comparative fit index (CFI) and Tucker–Lewis Index (TLI) values above .95, and root mean square error of approximation (RMSEA) values less than .05 indicate good fit. The first model we evaluated was the one-factor model of life satisfaction for the entire sample (Model 1).
We used multiple group analyses to evaluate measurement invariance across sex and racial/ethnic identity. Analyses of racial and ethnic differences were limited to Latinx, non-Hispanic Black, and non-Hispanic White, which had adequate sample sizes to support multiple group analysis. We followed the approach recommended by Bowen and Masa (2015), which involves comparing (a) a configural invariance model that specified the same one-factor structure across groups, but that allowed all parameter estimates to differ (Model 2 for sex, Model 6 for race); (b) a metric invariance model that constrained factor loadings to the same values across groups (Model 3 for sex, Model 7 for race); and (c) a scalar or strong invariance model that constrained loadings and item thresholds to the same values across groups (Model 4 for sex, Model 8 for race). This approach is considered best practice for evaluating invariance when items are treated as ordered categorical, and Pendergast et al. (2017) noted that invariance of intercepts can be assumed if invariance of thresholds is supported. We compared the fit of competing models based on the difference test provided by Mplus (see Asparouhov & Muthén, 2006), and model fit indices. Given the large sample size, we followed the Cheung and Rensvold (2002) recommendation such that more constrained models were not rejected unless they decreased fit based on the CFI (ΔCFI) by at least .01. Additional post-hoc models were evaluated as needed to examine invariance across sex and race using modification indices.
Finally, we compared correlations of life satisfaction with measures of exposure to violence and problem behavior across sex and racial/ethnic identity. A Wald test was used to identify differences in the strengths of associations across sex and across race/ethnicity. Significant Wald tests were followed-up with pairwise comparisons.
Results
Descriptive Analyses
Percentage of Participants Endorsing Each Category Indicating Their Satisfaction with Specific Domains.
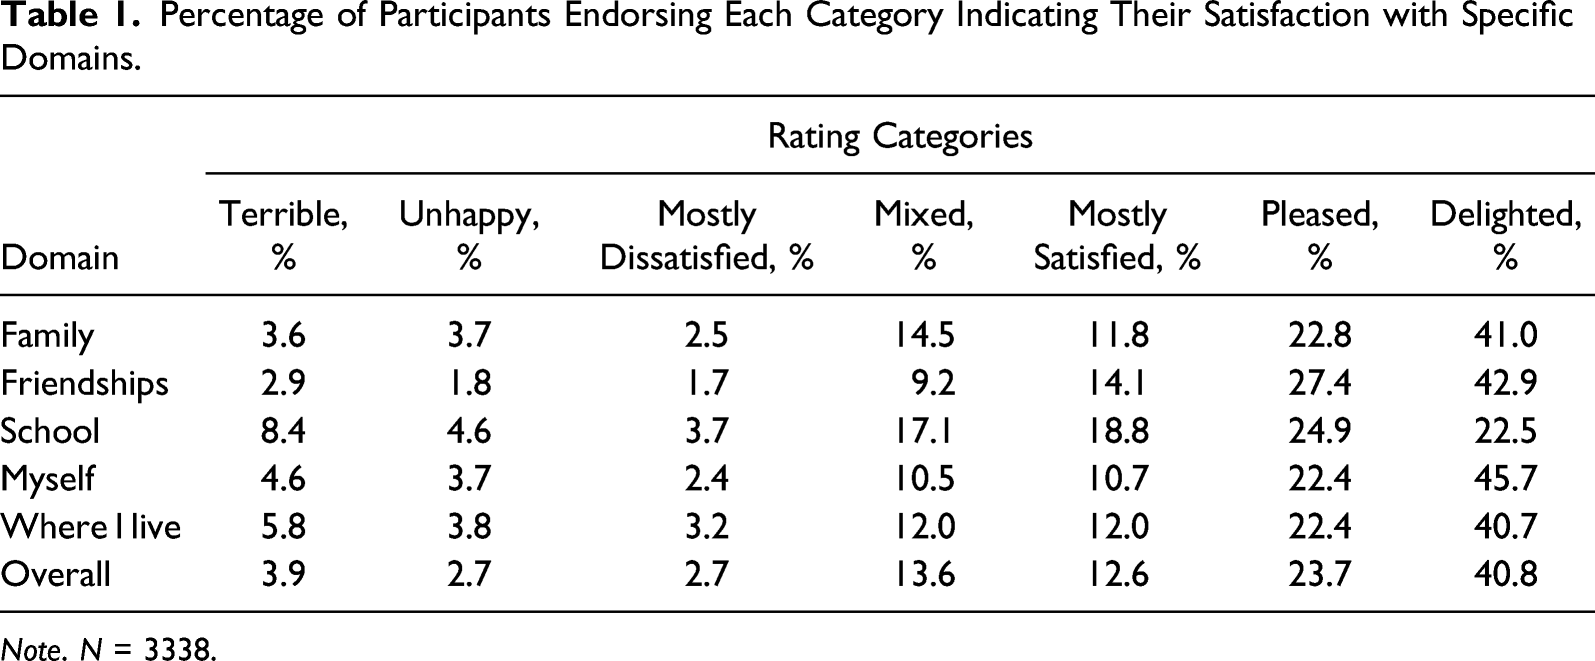
Note. N = 3338.
Means, Standard Deviations, Standardized Loadings, and Standard Errors for the Full Sample Model.
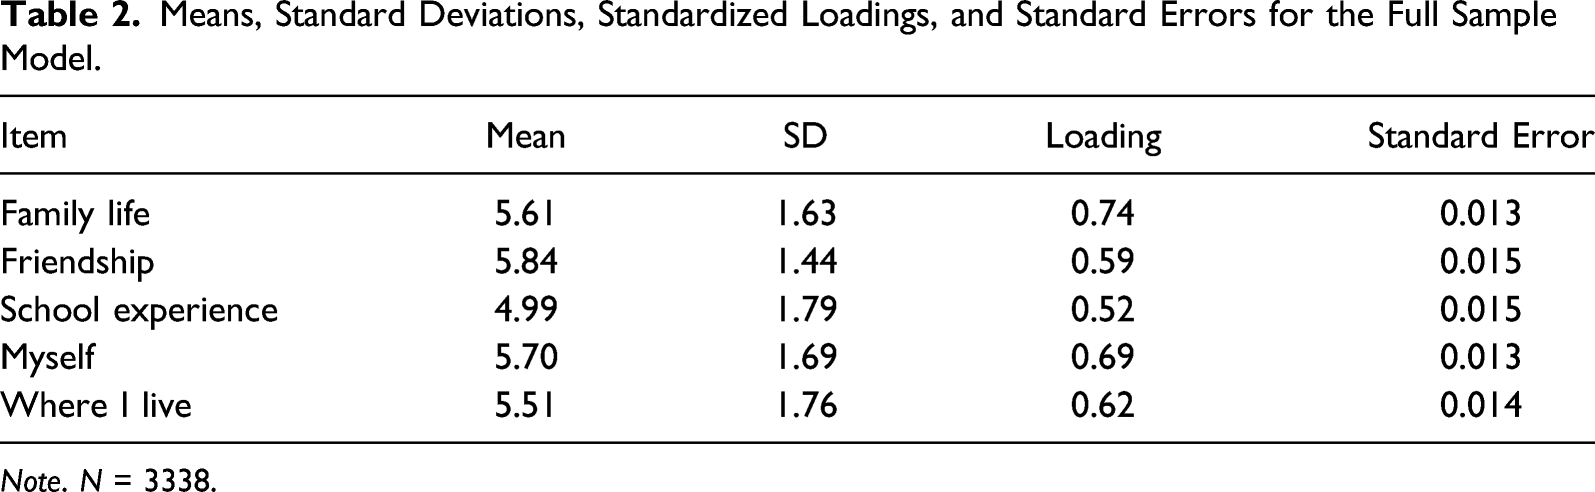
Note. N = 3338.
Structure of the Brief Multidimensional Students’ Life Satisfaction Scale
Confirmatory Factor Analysis Model Fit and Tests of Measurement Invariance.
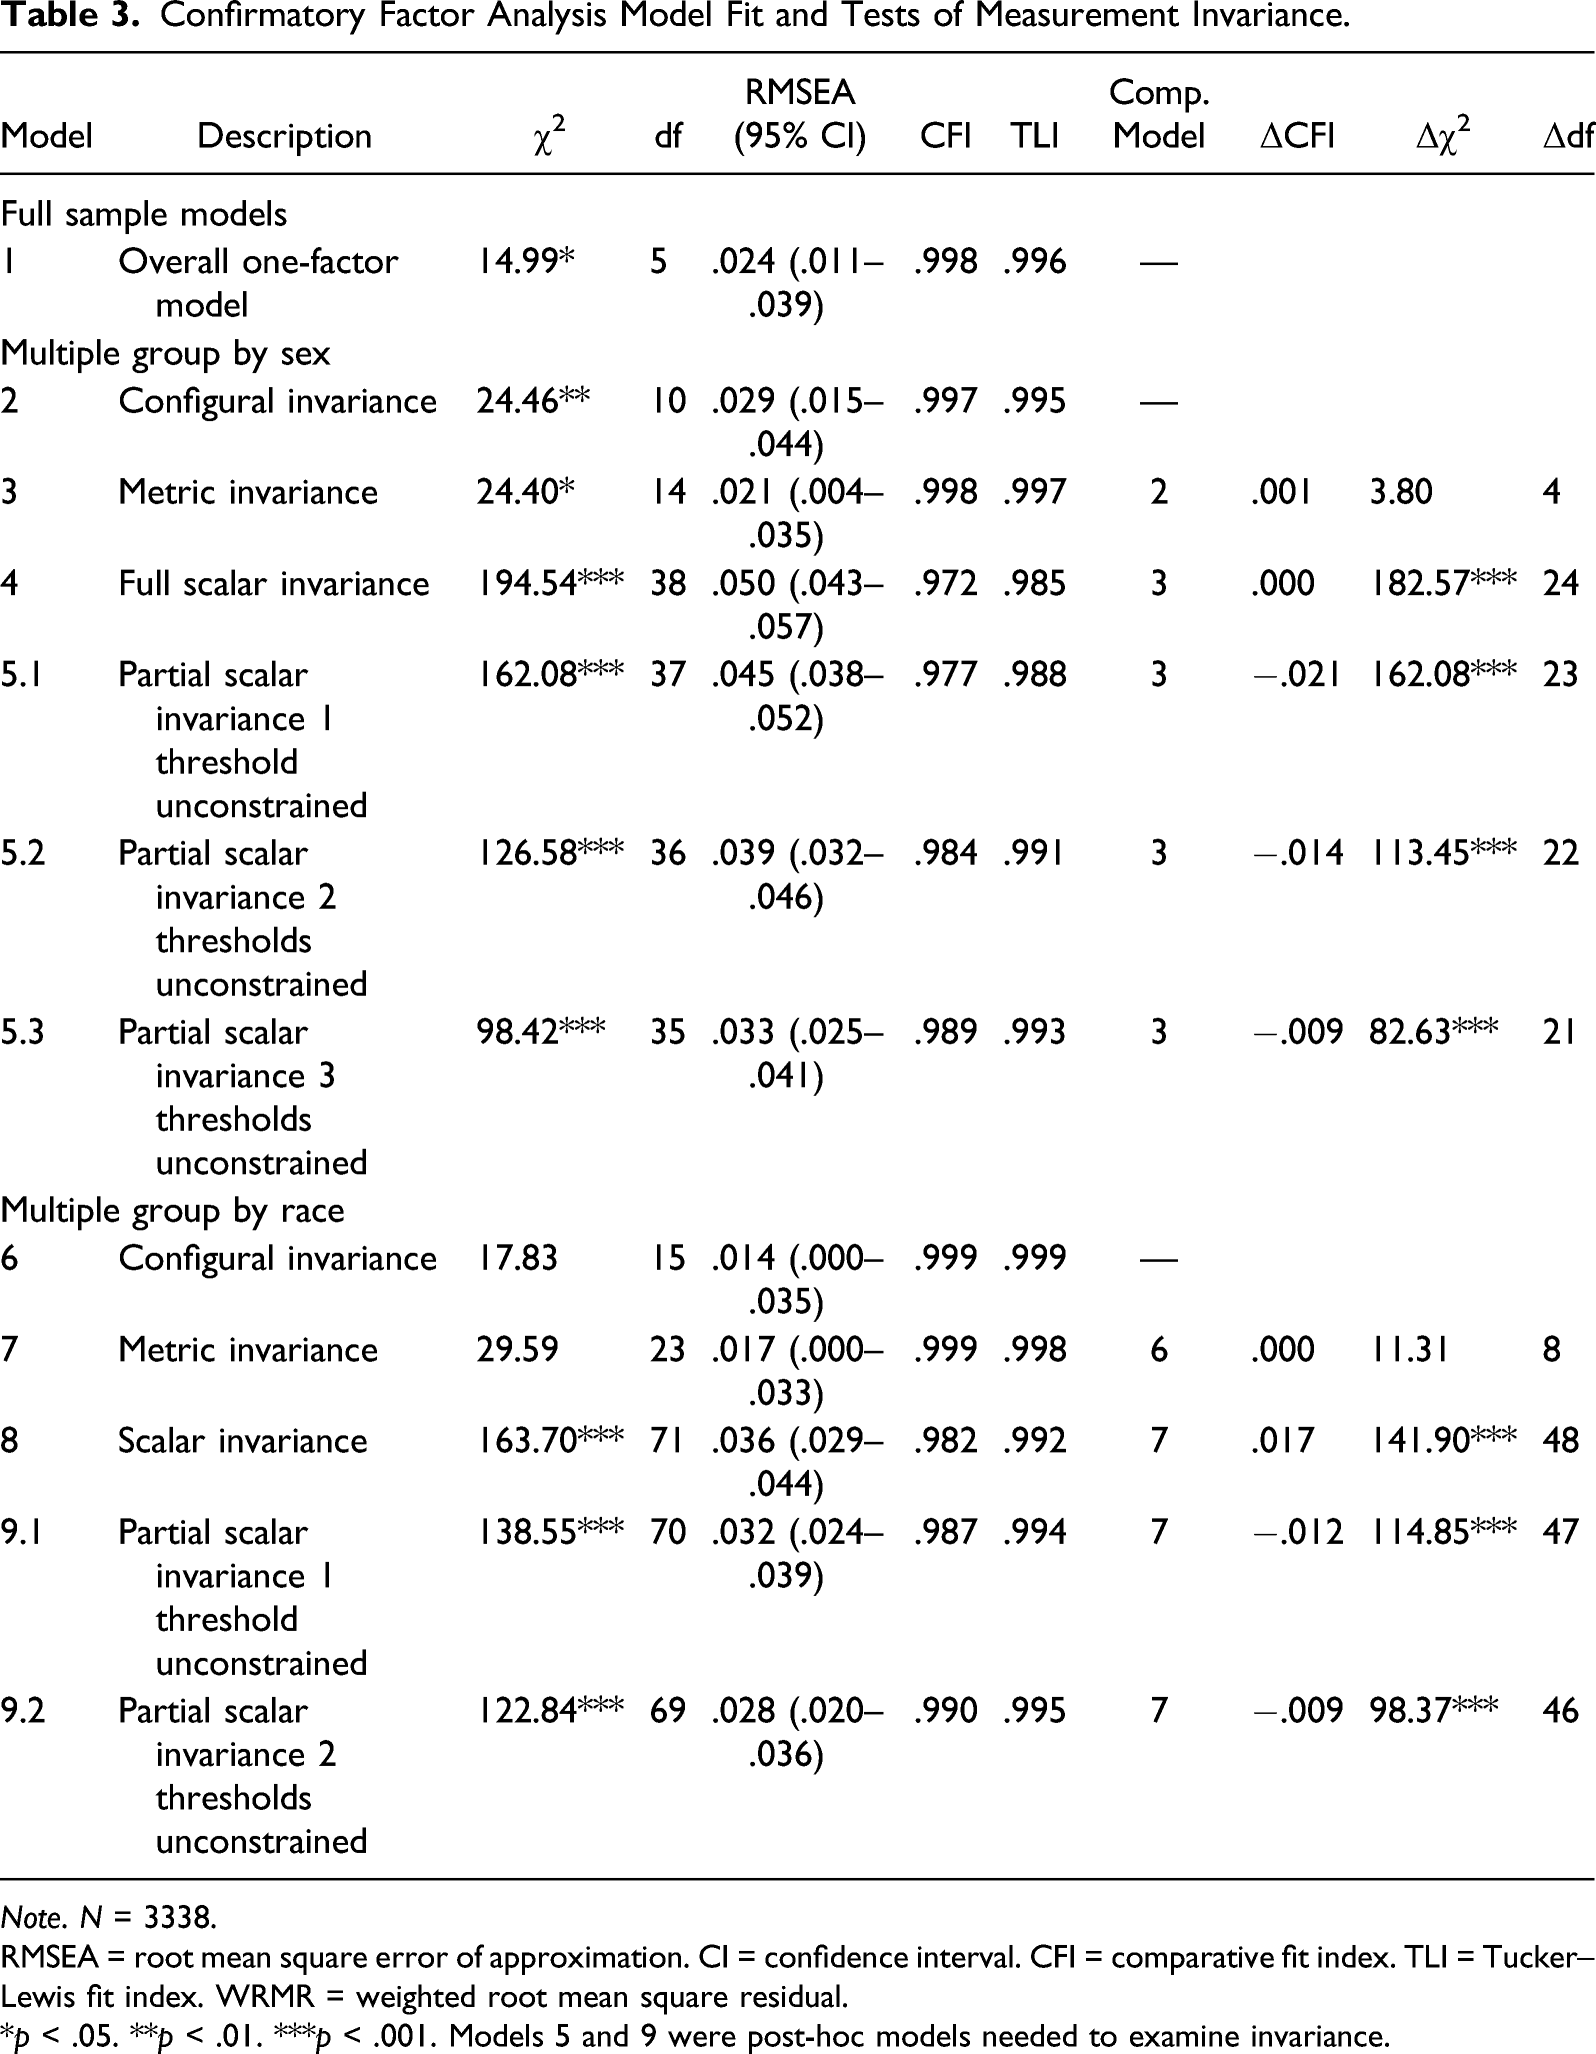
Note. N = 3338.
RMSEA = root mean square error of approximation. CI = confidence interval. CFI = comparative fit index. TLI = Tucker–Lewis fit index. WRMR = weighted root mean square residual.
*p < .05. **p < .01. ***p < .001. Models 5 and 9 were post-hoc models needed to examine invariance.
Measurement invariance across sex
The configural invariance model, which assumed a single factor for male and female adolescents but allowed thresholds and loadings to differ, fit the data well (RMSEA = .029, CFI = .997, TLI = .995; see Model 2 in Table 3). Imposing metric invariance by constraining all loadings to the same values across sex (Model 3) also fit the data well and did not result in a significant decrease in fit. Imposing scalar invariance by constraining the loadings and thresholds to the same values across sex (Model 4) fit the data well but resulted in a significant decrease in fit compared with the metric invariance model (p < .001, ΔCFI >.01).
We used the sequential approach recommended by Bowen and Masa (2015), which involved identifying the threshold that most contributes to misfit, evaluating the fit of a partial scalar invariance model that freed that parameter, and repeating this process on the resulting model until we obtained a well-fitting model that had a fit close to that of the metric invariance model (see Models 5.1 to 5.3 in Table 3). This process led to a partial scalar invariance model that freed three parameters. Although the metric model fit significantly better based on the chi-square difference test (χ2 (21) = 82.63, p < .001), the partial scalar invariance model had an excellent fit (RMSEA = .033, CFI = .989, TLI = .993), and the decrease in the CFI relative to configural and metric invariance models was less than .01. The three parameters that differed by sex indicated that among adolescents at the same overall level of Life Satisfaction, female adolescents were less likely than male adolescents to describe their level of satisfaction with their school experience as pleased (thresholds = .286 and .212, respectively) or delighted (thresholds = .250 and .201, respectively), or to describe their level of satisfaction with friendships as delighted (thresholds = .477 and .382, respectively). These three thresholds represent 10% of the threshold parameters, which falls within Dimitrov’s (2010) guideline that considers scalar invariance supported in models that free less than 20% of the threshold parameters. Within this model, there was no significant sex difference in means of Life Satisfaction (d = .11, p = .095).
Measurement invariance across race and ethnicity
A one-factor model specifying configural invariance across race and ethnicity fit the data well (RMSEA = .014, CFI = .999, TLI = .999; see Model 6 in Table 3). Imposing metric invariance did not significantly decrease the fit (χ2 (8) = 11.31, p = .185, ΔCFI <.01). The scalar invariance model fit the data well, but significantly decreased the fit compared with the metric invariance model (χ2 (48) = 141.90, p < .001, ΔCFI = .017). A sequential analysis to identify parameters that led to misfit suggested a partial scalar invariance model that freed two of the 30 threshold parameters (i.e., 7%) for students who identified as Black. The resulting partial scalar invariance model (Model 9.2 in Table 3) fit the data very well and decreased the CFI by only .009 compared with the configural and metric invariance models. The two parameters that differed by race/ethnicity indicated that among students with the same level of Life Satisfaction, Black students were more likely to rate their satisfaction with themselves as delighted (thresholds = −.155 for Black students and .134 for others), but were less likely to rate their satisfaction with where they live as delighted (thresholds = .528 for Black students and .195 for others). Within this model, the mean of Life Satisfaction for non-Hispanic Black students was slightly lower than for non-Hispanic White students (d = −.15, p = .028), but there were no significant differences between Latinx students and either non-Hispanic White students (d = .00, p = .923) or Black students (d = −.15, p = .05).
Reliability
In contrast to classic test theory, which represents reliability (internal consistency) by a single coefficient (e.g., Cronbach’s alpha), the item response theory approach acknowledges that reliability may differ at different levels of the construct. Figure 1 plots reliability as a function of different levels of the latent variable representing Life Satisfaction for groups that differ by sex or by race and ethnicity. This indicates that the BMSLSS scores have high reliability (i.e., >.80) for all groups at levels of Life Satisfaction ranging from 2 SDs below the mean to 0.8 SDs above the mean. The BMSLSS scores show a similar level of reliability for male and female adolescents with coefficients of .70 or higher for scores within 2.0 SDs of the mean, and .80 or higher for scores up to 1.7 SDs above the mean for female adolescents, and up to 1.4 SDs above the mean for male adolescents. Although reliabilities were high across the three racial/ethnic groups with values .80 or higher up to 0.8 SDs above the mean, reliabilities decreased more for non-Hispanic Black and Latinx adolescents. Nonetheless reliability remained .70 or higher for all groups for scores as high as 1.6 SDs above the mean. Reliability based on item information curves of the Brief Multidimensional Students’ Life Satisfaction Scale across different levels of Life Satisfaction by sex and race/ethnicity.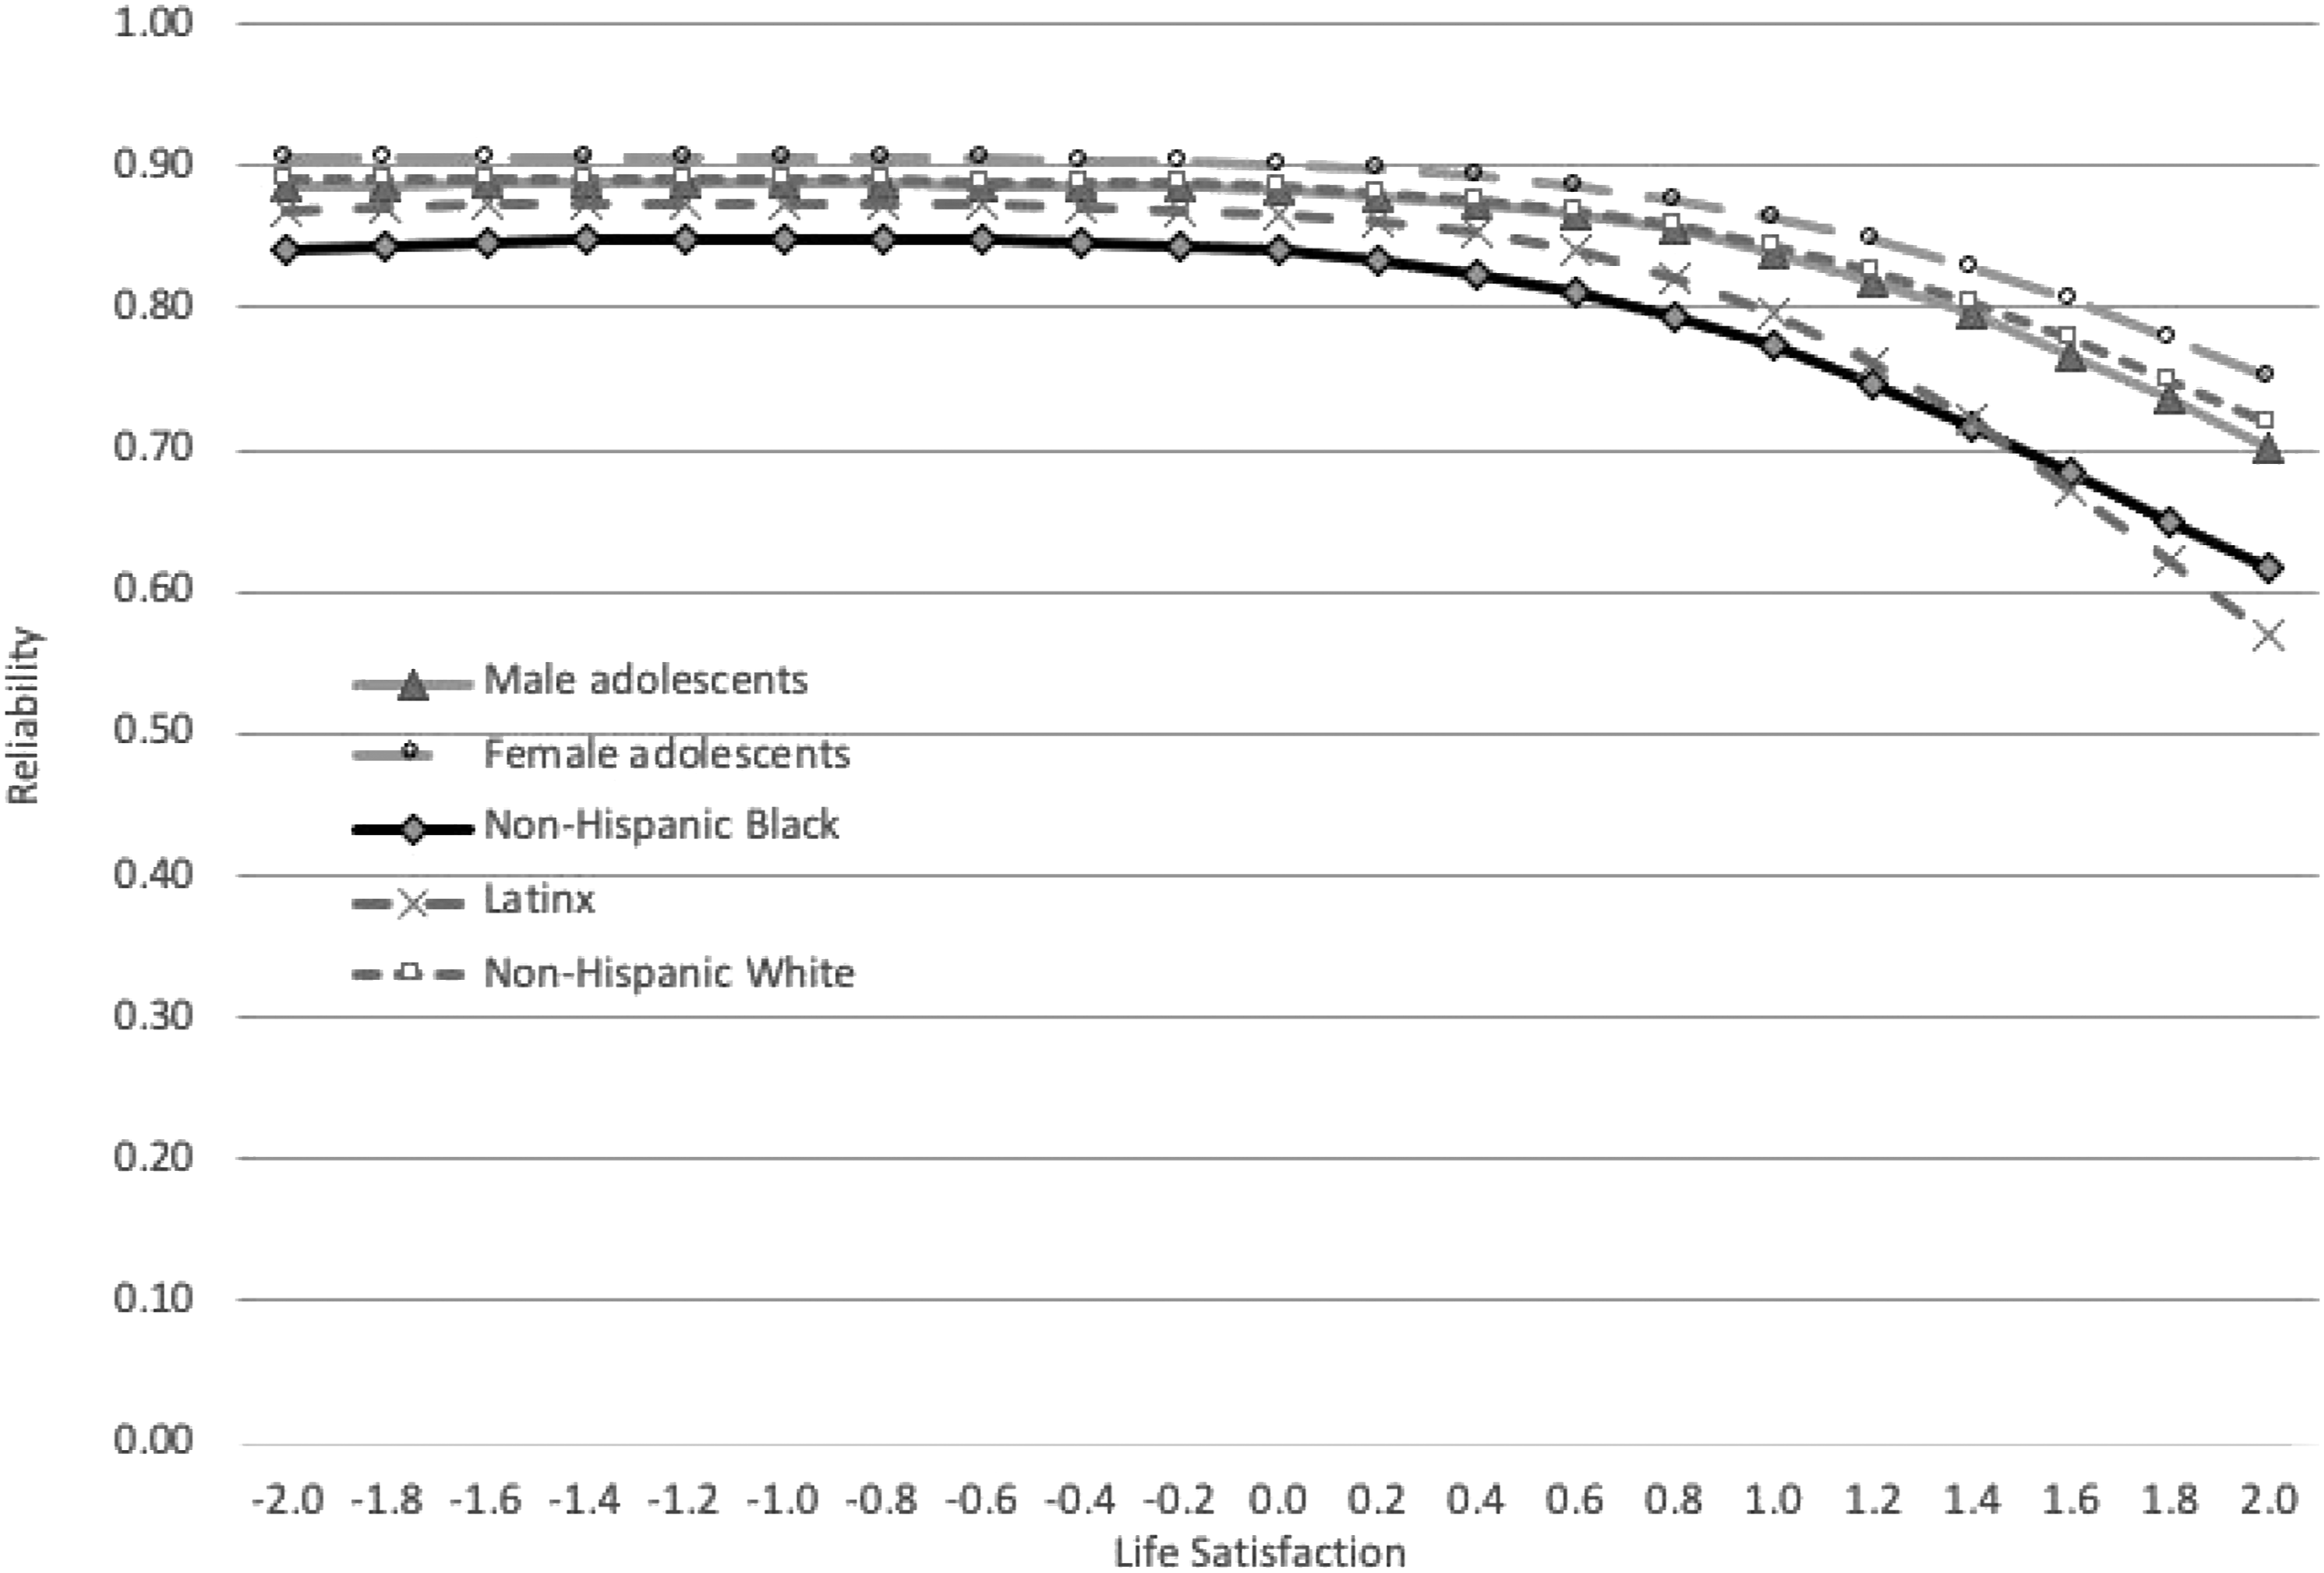
Relations with Adjustment
Correlations Between Life Satisfaction Latent Variable, Scored Variable, and Global Rating with Frequency of Problem Behaviors and Environmental Stressors.
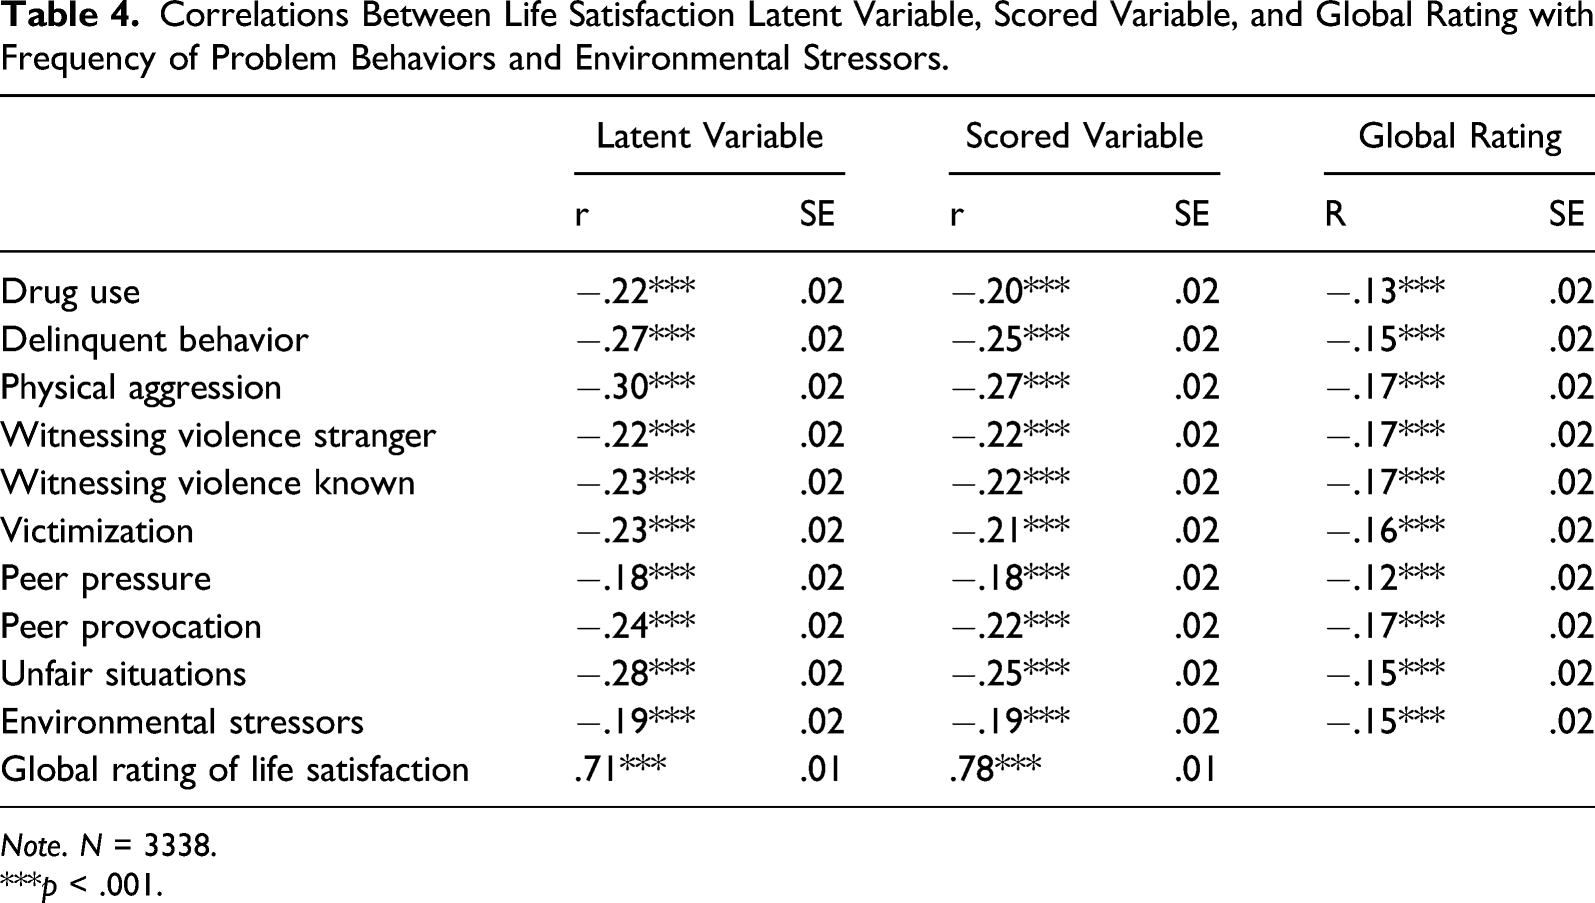
Note. N = 3338.
***p < .001.
Comparison of Correlations Between Life Satisfaction and Covariates Across Race
Results of a Wald test indicated that there were significant race/ethnicity differences in correlations between the Life Satisfaction factor and covariates (χ2 (20) = 70.34, p < .001). Pairwise comparisons revealed stronger negative correlations for Latinx adolescents than for non-Hispanic Black or White adolescents between Life Satisfaction and witnessing violence against a stranger (r = −.31, −.16, and −.13, respectively) and witnessing violence against someone they knew (r = −.30, −.15, and −.17, respectively). There was also a significantly stronger negative correlation between Life Satisfaction and the frequency of drug use for Latinx adolescents compared with non-Hispanic Black adolescents (r = −.28 and −.16, respectively). Finally, there was a significantly stronger negative correlation between Life Satisfaction and peer provocation for non-Hispanic White adolescents than for Latinx adolescents (r = −.26 and −.13, respectively). It should be noted, that although there were some differences in the strength of these correlations, all were significant at p < .01 in all three groups.
Comparison of Correlations Between Life Satisfaction and Covariates Across Sex
Results of a Wald test indicated that there were no significant differences between male and female adolescents in the correlations between Life Satisfaction and the covariates (χ2 (10) = 16.45, p = .145).
Discussion
Prior studies have shown the importance of assessing life satisfaction during adolescence. Adolescents’ life satisfaction has been associated with mental illness, adverse life experiences, and health-risk behaviors. However, there are few well-established measures of adolescent life satisfaction. Prior studies have demonstrated that BMSLSS scores have good psychometric properties, but the scale has primarily been used to assess White youth and older adolescents. The purpose of this study was to evaluate the structure of the BMSLSS in a rural racially and ethnically diverse sample of early adolescents. We also examined measurement invariance across sex, race, and ethnicity. Finally, we investigated associations between life satisfaction and youth adjustment, and examined differences across sex, race, and ethnicity. The present study supported a one-factor model of life satisfaction using the BMSLSS. This is consistent with several prior studies (e.g., Seligson et al., 2003; Zappulla et al., 2013), and extends their findings by revealing its structure for rural early adolescents. Although, the majority of the sample reported high satisfaction in most areas, 23% reported dissatisfaction with their school experience, and 6%–13% reported dissatisfaction in other domains.
Most previous studies evaluating the BMSLSS have not examined measurement invariance across sex (e.g., Funk et al., 2006; Seligson et al., 2003). Our analysis indicated that female adolescents saw less difference between the anchor points at the upper end of the scale for three items compared with male adolescents, but there were no significant sex differences in their overall level of life satisfaction. This contradicts findings by Gilman et al. (2000) who found that female adolescents reported higher satisfaction with friends compared with male adolescents. However, because the sample in the current study was younger, this difference in findings could reflect differences in social-emotional development.
We also found support for partial scalar invariance across race/ethnicity. Black students at the same level of life satisfaction on the latent factor as other students were more likely to rate their satisfaction with themselves as delighted or higher, but less likely to rate their satisfaction with where they live as delighted or higher. This suggests that adolescents from different racial and ethnic groups may differ in their subjective view on the meaning of different levels of life satisfaction in specific domains and underscores the importance of assessing invariance on subjective measures prior to examining group differences. Black students reported significantly slightly lower mean levels of life satisfaction than non-Hispanic White students. This is consistent with Huebner et al. (2004), but differs from Gilman et al. (2000) who found higher levels of satisfaction with family, self, and total life satisfaction among Black compared with White adolescents. This could again reflect differences between middle school and high school students. We also found that Latinx students did not differ from non-Hispanic White students or from Black students in total life satisfaction. Though there has been little research comparing Latinx and non-Hispanic students, this finding is surprising given that Latinx youth typically report higher levels of adverse experiences that might be associated with lower life satisfaction.
Support was found for the construct validity of BMSLSS scores based on their correlations with measures of related constructs, including involvement in problem behaviors and exposure to violence and life stressors. These findings are consistent with numerous prior studies that have found significant associations between scores on the BMSLSS and mental health and adverse experiences (e.g., Seligson et al., 2003). These relations were consistent across sex. There were, however, some differences across race/ethnicity. Life satisfaction had a stronger negative correlation with witnessing violence and drug use among Latinx adolescents. There was also a stronger negative correlation between life satisfaction and peer provocation for non-Hispanic White adolescents than for Latinx adolescents. This suggests that adverse experiences such as violence exposure and peer conflict may differ in their impact on life satisfaction for youth from different racial and ethnic backgrounds. Because few prior studies have investigated these associations, more work is needed to examine differences in associations between life satisfaction and youth adjustment across sex and race and ethnicity.
Limitations
The current study had several limitations that warrant discussion. Although the cross-sectional design was appropriate for the primary aim of the current study, which was examining the psychometric properties of the BMSLSS among a diverse sample of rural adolescents, it prevents making strong conclusions regarding the directionality of associations between life satisfaction and youth adjustment. We were also not able to examine differences across racial and ethnic groups that were not well represented in the sample. Future studies are needed to evaluate the structure of the BMSLSS across a wider range of racial and ethnic identities, and across other groups that differ in sexual orientation or gender identity. Because the sample was drawn from a rural area of Florida, a population that has been understudied in previous research, the findings might not generalize to youth from other contexts. Because the data reported in this study were collected over 20 years ago it is possible that the findings might not generalize to present-day youth. However, there is no evidence that life satisfaction as a construct has changed over the past two decades. Moreover, the BMSLSS is used frequently in current research, which underscores the importance of establishing its psychometric properties among a wide range of youth.
Future Research
Future studies should investigate the structure of the BMSLSS across a wider range of youth identities, such as gender identity, sexual orientation, ability status, etc. Given the push to recognize and represent a wider range of identities in research, there is a need to identify and use measures that are appropriate for people of different identities. Moreover, further research is needed to investigate the extent to which life satisfaction is associated with youth mental health and well-being. As suggested by Huebner et al. (2006), investigating child and adolescent perceived life satisfaction can generate a more comprehensive evaluation of their mental health and offers a more sophisticated approach to the design, implementation, and evaluation of interventions for life satisfaction improvement. Accordingly, future studies of youth mental health, such as treatment or intervention studies, should consider adding brief measures of life satisfaction such as the BMSLSS as a measure of well-being, rather than relying solely on the absence of mental illness.
Conclusions
Overall, results from the current study provided evidence for sound psychometric properties of the BMSLSS. Although reliability was slightly lower in some groups, its reliability was excellent across a broad range of scores. Analysis of the factor structure of the BMSLSS, tests of measurement invariance across sex and race/ethnicity, reliability, and correlations with related constructs provide strong support for the BMSLSS and its use with a variety of adolescent populations.
Supplemental Material
sj-pdf-1-jpa-10.1177_07342829211049684 – Supplemental Material for Evaluation of the Brief Multidimensional Students’ Life Satisfaction Scale in a Diverse Sample of Rural Early Adolescents
Supplemental Material, sj-pdf-1-jpa-10.1177_07342829211049684 for Evaluation of the Brief Multidimensional Students’ Life Satisfaction Scale in a Diverse Sample of Rural Early Adolescents by Sarah K. Pittman, Robert F. Valois and Albert D. Farrell in Journal of Psychoeducational Assessment
Footnotes
Author’s Note
The research and interpretations reported are the sole responsibility of the authors and are not necessarily endorsed by the DOE or represent the views, opinions, or policies of the DOE or their staff.
Declaration of Conflicting Interests
The author(s) declared no potential conflicts of interest with respect to the research, authorship, and/or publication of this article.
Funding
The author(s) disclosed receipt of the following financial support for the research, authorship, and/or publication of this article: This work was supported by Grant #S 18-4F70-100 from the U.S. Department of Education.
Supplementary Material
Supplementary material for this article is available online.
References
Supplementary Material
Please find the following supplemental material available below.
For Open Access articles published under a Creative Commons License, all supplemental material carries the same license as the article it is associated with.
For non-Open Access articles published, all supplemental material carries a non-exclusive license, and permission requests for re-use of supplemental material or any part of supplemental material shall be sent directly to the copyright owner as specified in the copyright notice associated with the article.