
Abstract
The Woodcock-Johnson V (WJ V; McGrew, Mather, LaForte, et al., 2025) represents the most significant evolution in comprehensive cognitive assessment since the battery was introduced nearly 50 years ago. This article provides an overview of the WJ V Tests of Cognitive Abilities and Virtual Test Library, highlighting key revisions from the WJ IV and examining psychometric properties and interpretive options. The WJ V assessment system comprises 60 co-normed tests across cognitive, achievement, and language domains, making it the most comprehensive assessment battery currently available. Major innovations include a fully digital platform, contemporary post-pandemic norms, enhanced theoretical alignment with current Cattell-Horn-Carroll (CHC) theories, and expanded diagnostic capabilities through the new Virtual Test Library. The WJ V Tests of Cognitive Abilities contains 20 tests organized into 17 clusters, including three general intelligence measures, seven CHC broad ability clusters, and six narrow ability/clinical clusters. Significant structural changes include the creation of a new Retrieval Fluency (Gr) broad ability cluster, the removal of Auditory Processing (Ga) from the General Intellectual Ability (GIA) cluster, substantial revisions to the GIA composition, and the relocation of specialized tests to the Virtual Test Library, which incorporates 15 specialized tests, enabling the targeted evaluation of phonological awareness, rapid automatized naming, and memory functions critical for the identification of dyslexia. Extensive validity evidence supporting the battery’s structure was obtained through a sophisticated three-stage framework employing multiple analytical methods, including exploratory factor analysis, multidimensional scaling, cluster analysis, and psychometric network analysis. Clinical validity studies demonstrate the battery’s effectiveness in differentiating various neurodevelopmental conditions. The WJ V’s four-level interpretive framework emphasizes criterion-referenced proficiency measures alongside traditional norm-referenced scores, providing educationally relevant information for intervention planning. This comprehensive assessment system offers practitioners unprecedented flexibility for hypothesis-driven evaluation while maintaining the psychometric rigor essential for high-stakes educational and diagnostic decisions, positioning it as a transformative tool for evidence-based assessment practices in the digital age.
Keywords
Introduction
The Woodcock-Johnson V (WJ V; McGrew, Mather, LaForte, et al., 2025) is the fifth generation of a comprehensive assessment system that has evolved over nearly 50 years since its original publication in the late 1970s, specifically the Woodcock-Johnson Psycho-Educational Battery (WJ; Woodcock & Johnson, 1977). Like its predecessors, the WJ V embraces innovation instead of tradition, following Dr. Richard Woodcock’s philosophy of incorporating advances from cognitive theory, research, and psychometrics into each new edition. The WJ V’s structural framework is built upon elements from Carroll’s and Horn’s theoretical approaches (e.g., Carroll, 1993; Horn, 1998; Horn & Noll, 1997), as well as the latest iteration of the Cattell-Horn-Carroll (CHC) taxonomy, as described by Schneider and McGrew in 2018 (see Laforte et al., 2025; McGrew, 2023, for comprehensive discussions of CHC theories). The evolution of test content exhibits remarkable strategic, empirically driven adaptations, including modifying and renaming existing tests, adding new tests, and dropping tests “when accumulated validity evidence and user feedback have not justified their continued use” (LaForte et al., 2025, p. 14). The new WJ V contains 60 co-normed tests, most of which are supported by 30–50 years of validity evidence, as documented in technical manuals and peer-reviewed research (LaForte et al., 2025).
The WJ V has a two-battery structure: the WJ V Tests of Cognitive Abilities (WJ V COG; McGrew, Mather, & LaForte, 2025) and the WJ V Tests of Achievement (WJ V ACH; Mather et al., 2025a). A new addition is the WJ V Virtual Test Library (WJ V VTL; Mather et al., 2025b), which contains tests that can be used independently or combined with tests from the primary batteries to provide additional assessment options for evaluating CHC broad and narrow abilities. The complete WJ V measures 10 broad CHC abilities as outlined by Schneider and McGrew (2018): Comprehension-Knowledge (Gc), Fluid Reasoning (Gf), Visual Processing (Gv), Auditory Processing (Ga), Long-term Storage (also called Learning Efficiency; Gl), Retrieval Fluency (Gr), Auditory Working Memory Capacity (Gwm), Cognitive Processing Speed (Gs), Reading and Writing (Grw), and Quantitative Knowledge (Gq).
The WJ V is almost entirely digital, representing the most significant technological shift from its predecessors. Only tests that require written responses are in paper format, such as the Spelling, Calculation, and Sentence Writing Fluency tests from the WJ V ACH. The testing process requires a laptop and iPad instead of the traditional easels and record forms (i.e., paper and pencil format). Practitioners can access the WJ V tests through Riverside Score®. This online platform enables users to set up examinee profiles, customize a battery of tests or select a preconfigured group of tests (known as test sets), connect their iPad via a web browser, and conduct assessments with automatic scoring. The digital format enables innovative testing possibilities. For example, the technology supports new types of test tasks and response methods, which broaden the range of content and abilities that the WJ V can assess (see LaForte, this issue). The WJ V Technical Manual (LaForte et al., 2025) provides detailed information about how the digital platform was designed and developed, as well as how test content was adapted for this new format.
This article presents the most salient revision goals of the WJ V, followed by an overview of the WJ V COG and WJ V VTL. Differences between the WJ IV and WJ V are also highlighted. Next, the psychometric properties of the WJ V are discussed, and a summary of interpretive options is provided. The article concludes with a brief discussion of the practice implications of the WJ V.
Revision Goals
The revision goals for the WJ V were ambitious and largely achieved. The primary goal was to develop a comprehensive set of co-normed tests assessing cognitive, language/linguistic, and academic abilities. The WJ V has Standard and Extended sets of cognitive and achievement tests, along with an accompanying VTL that contains tests of phonological processing, rapid automatized naming, and memory. In comparison to the WJ IV, the number of cognitive tests increased by two, the number of achievement tests increased by eight, and 15 tests comprise the VTL, resulting in a comprehensive set of 60 co-normed tests that surpasses all other standalone batteries currently available.
Other revision goals for the WJ V included creating a battery of tests that could be used flexibly, allowing for comparisons within and across cognitive, language/linguistic, and achievement domains. Examples of how these goals were accomplished are provided in a later discussion of interpretive options for the WJ V. Another goal was for the WJ V COG to reflect current CHC theory, which was achieved through a comprehensive, meticulously designed, three-stage structural validity procedure (see Figure 6-6, p. 237, for a map of the structural validity stages, Laforte et al., 2025). This process resulted in the final CHC organizational structure of the WJ V and is thoroughly articulated in Chapter 6 of the technical manual (LaForte et al., 2025, pp. 236–277) and summarized in the validity section of this article. The cognitive and VTL tests are described next.
WJ V COG Tests
WJ V COG Test Numbers and Names, Abbreviations, and Descriptions
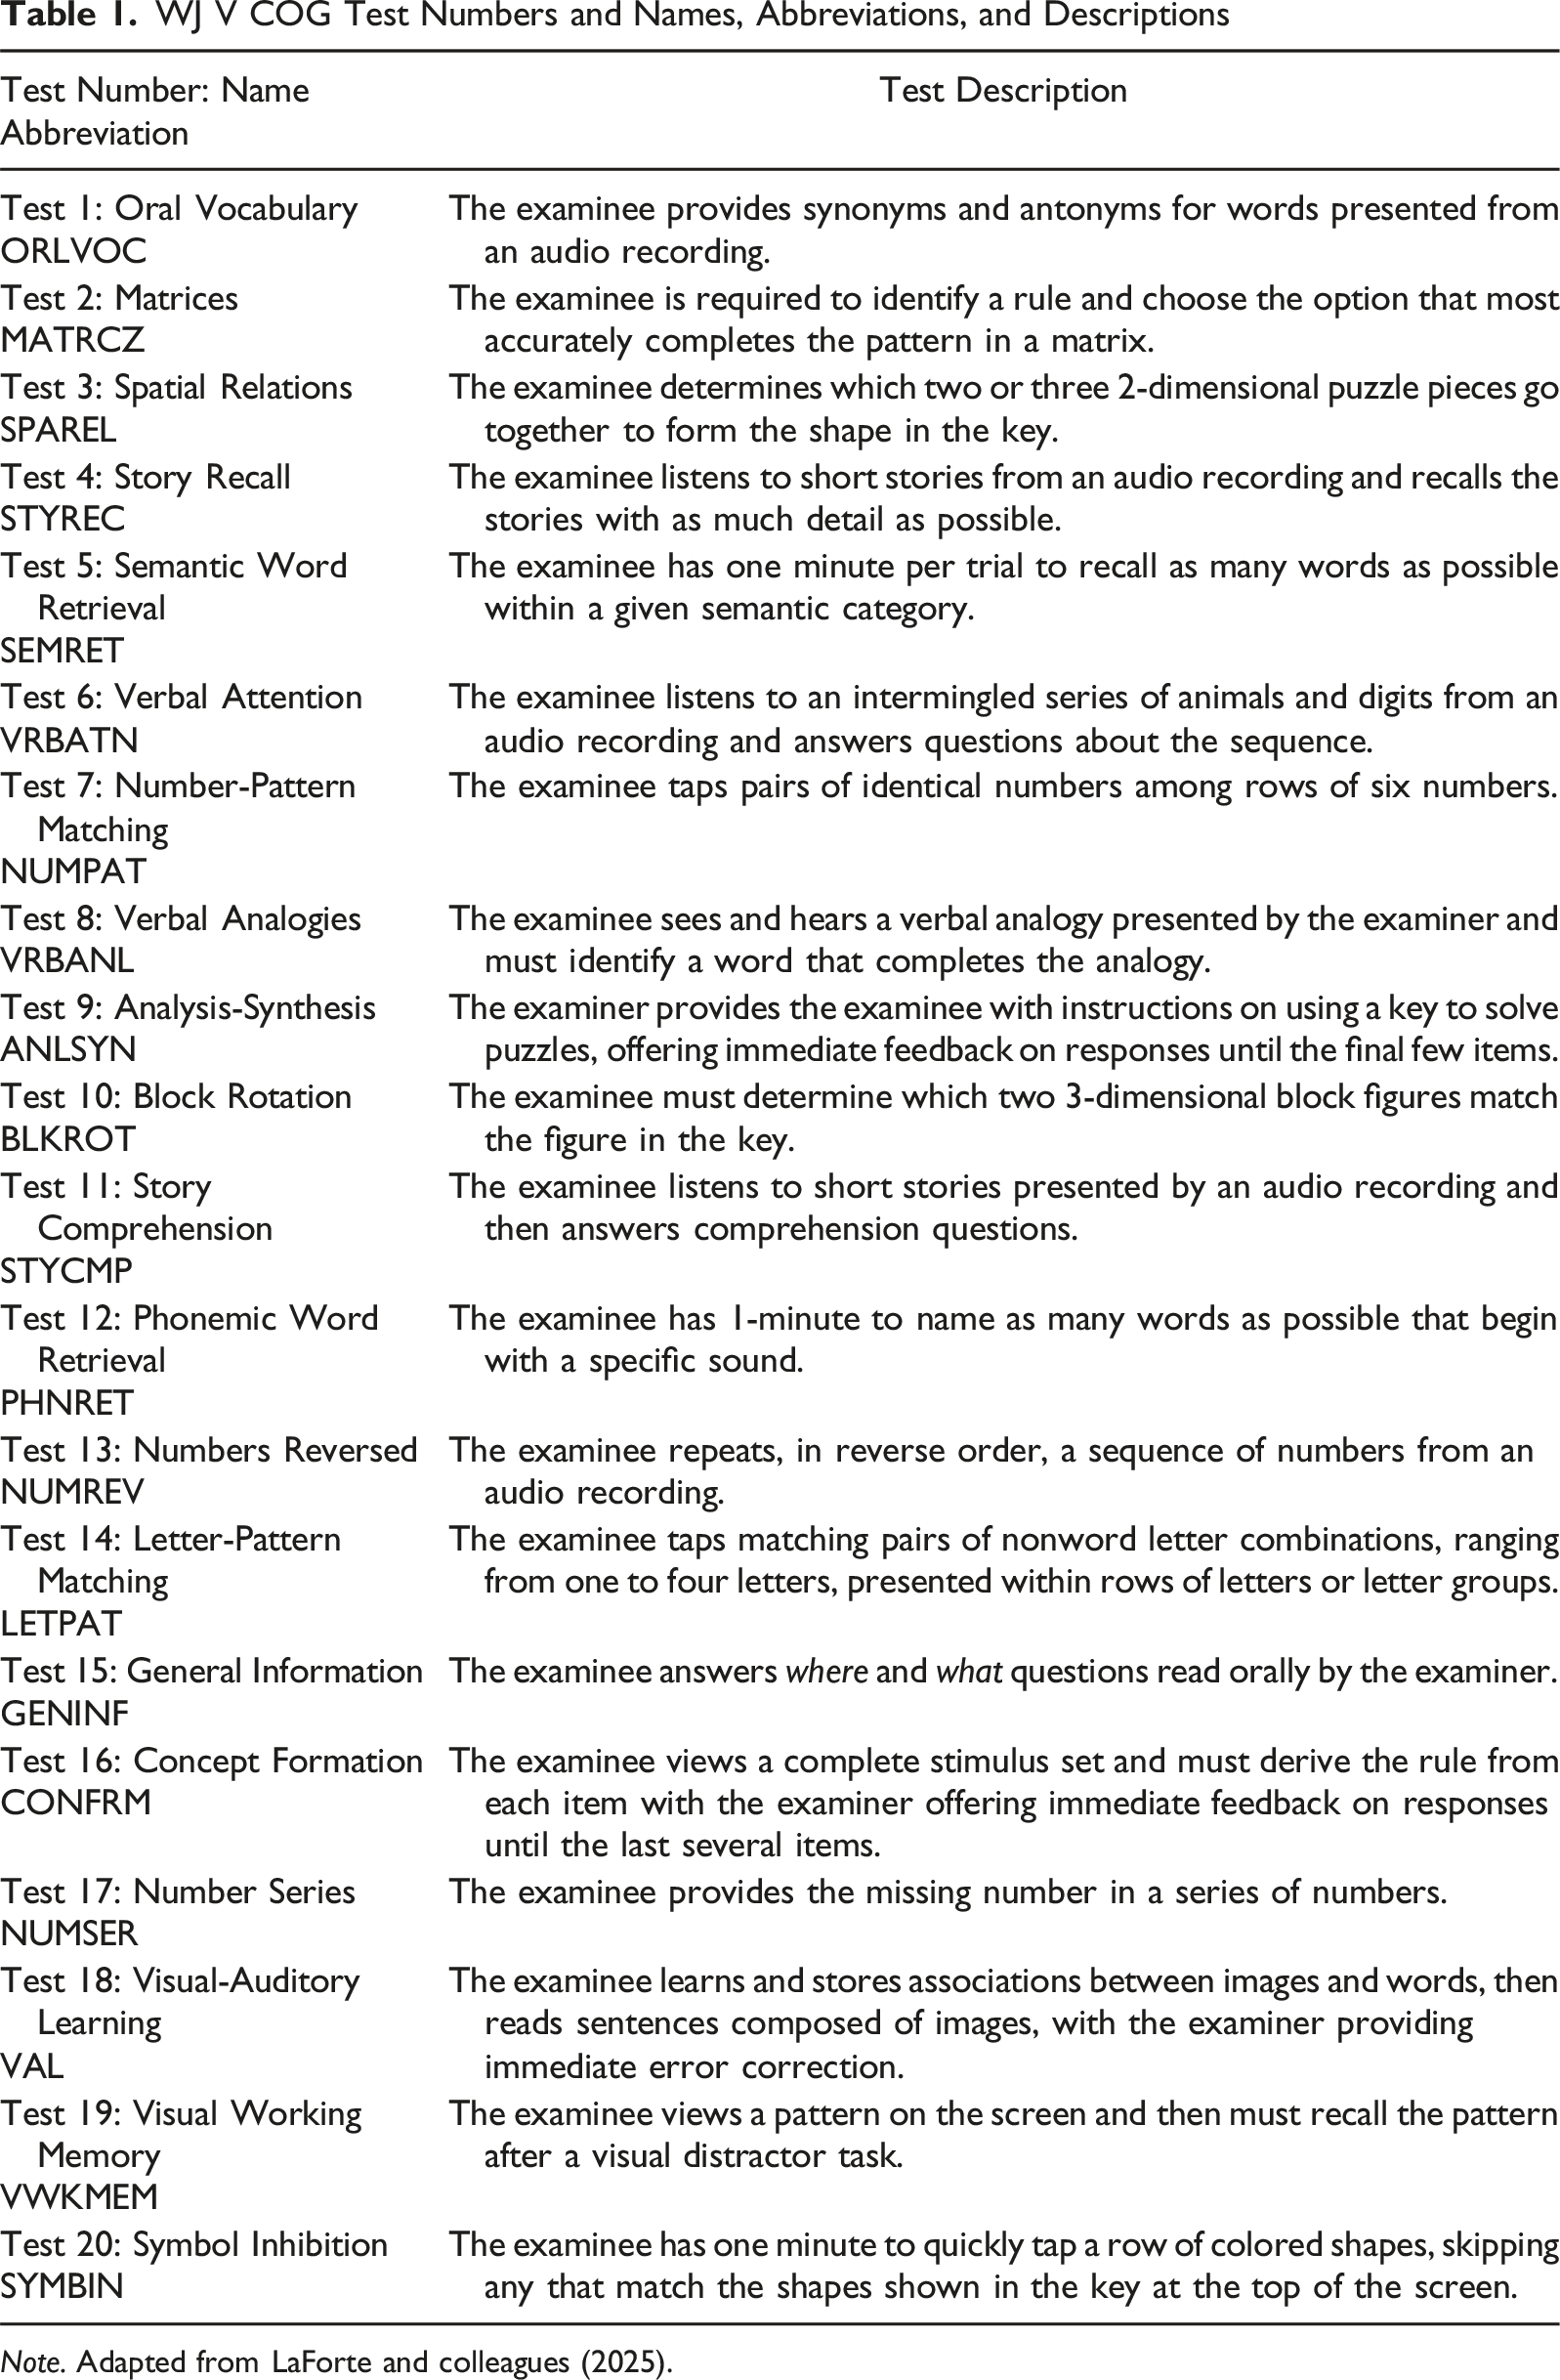
Note. Adapted from LaForte and colleagues (2025).
WJ V VTL Test Names, Abbreviations, and Descriptions
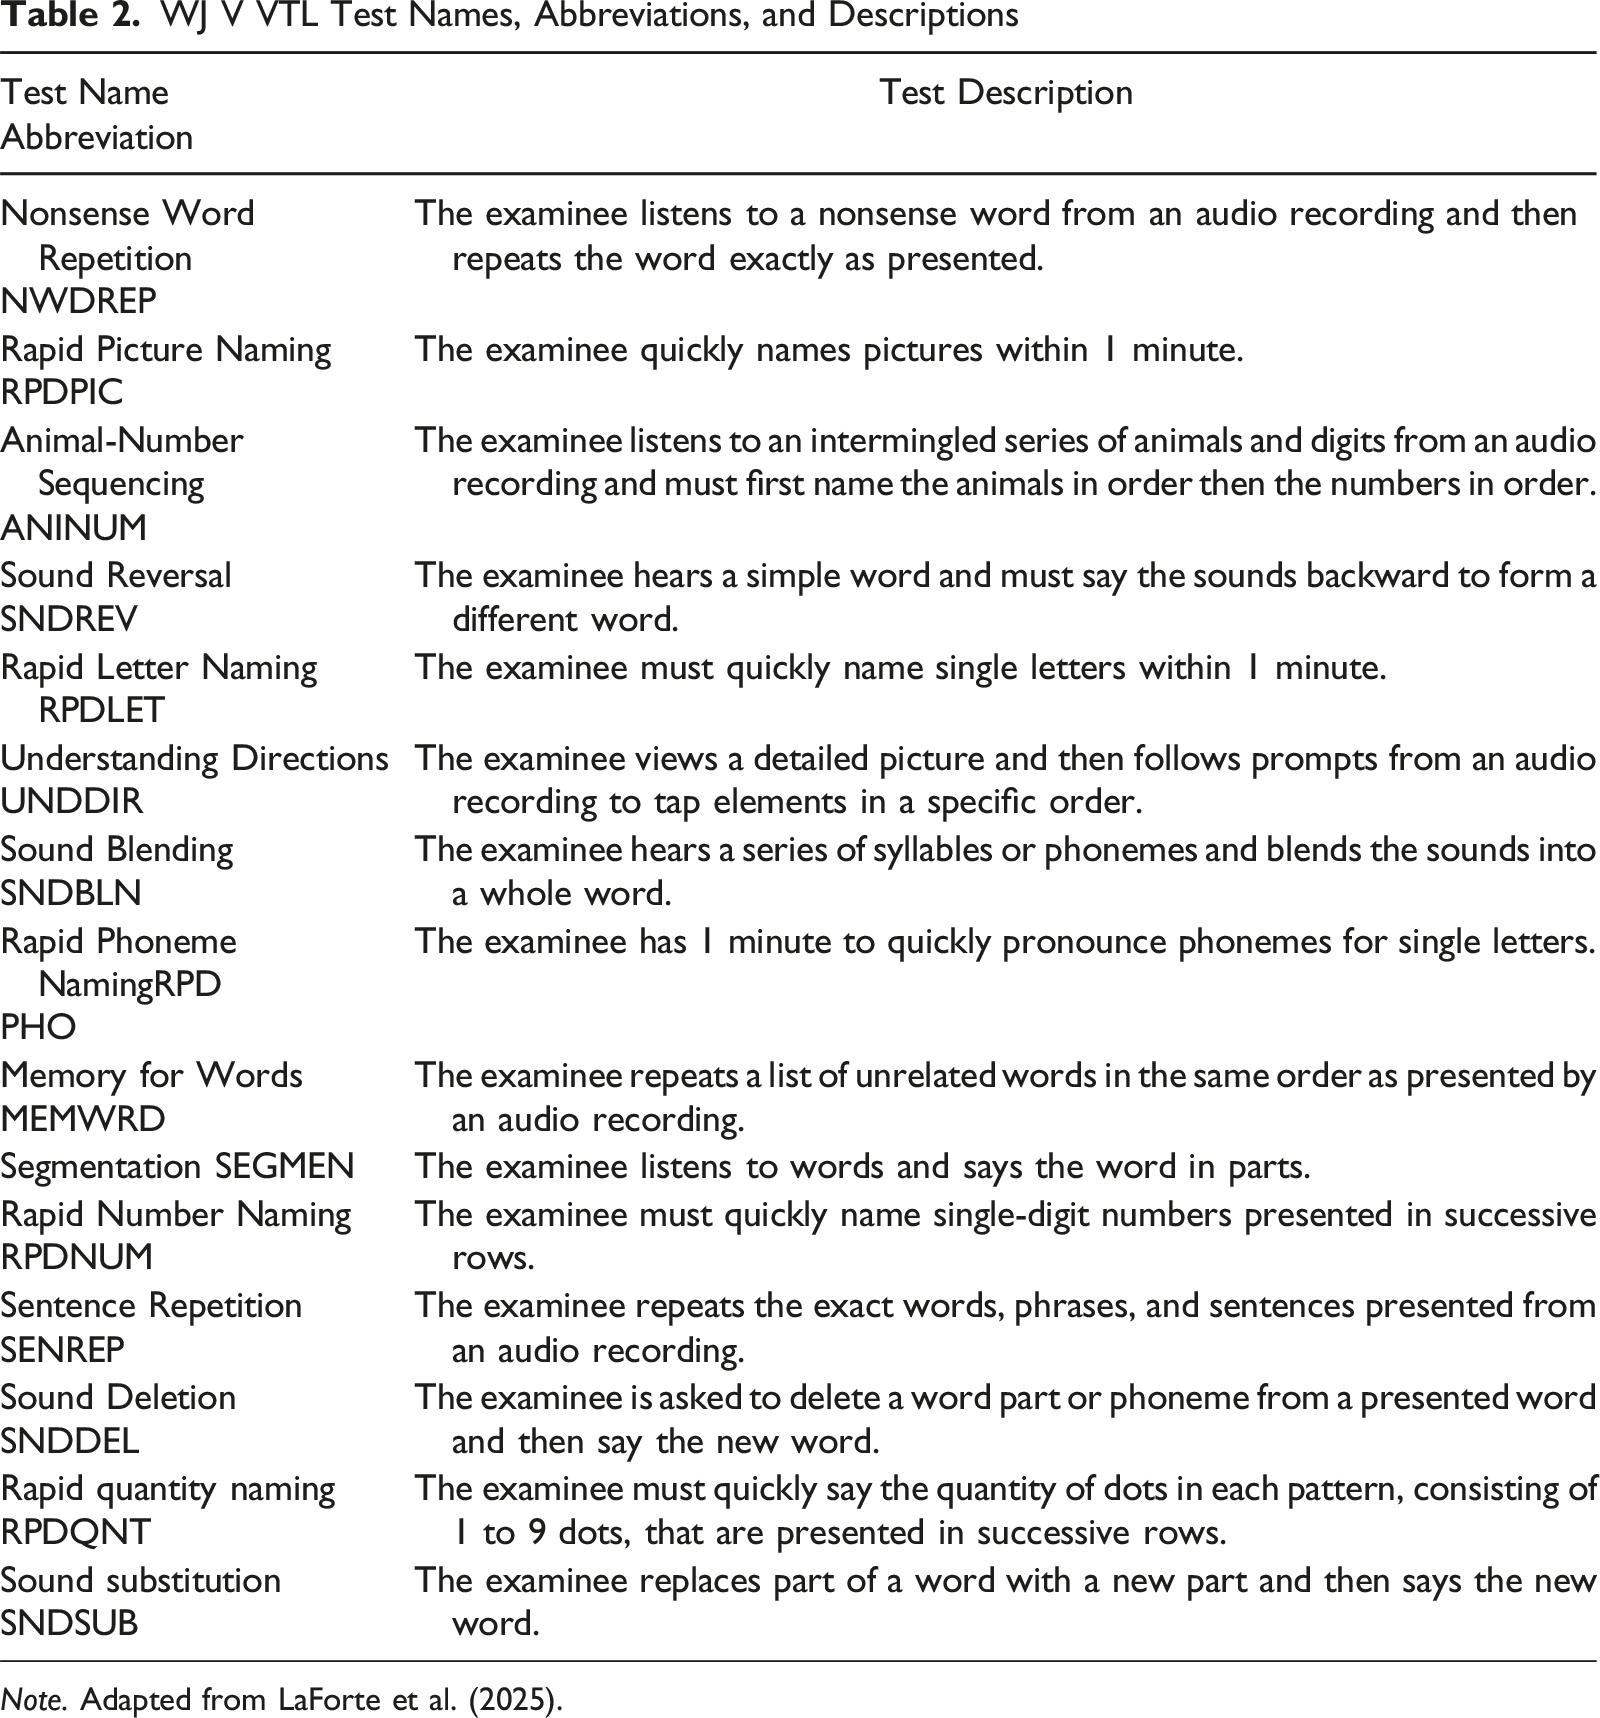
Note. Adapted from LaForte et al. (2025).
The WJ V authors articulated the specific reasons for five new cognitive tests. First, the Matrices test—a traditional figural inductive reasoning task—was added to strengthen the measurement of Fluid Reasoning (Gf). Like Concept Formation, Matrices measures Induction (I), but the language load of its test directions is far less (Cormier et al., 2011; Laforte et al., 2025, p. 52), which will be welcomed by practitioners who assess English learners. Second, the addition of the Visual Working Memory test expanded the assessment of working memory to include visual components. Third, the Symbol Inhibition test, a measure of processing speed, involves the executive functions of updating and inhibiting, making it distinct from other processing speed tests. Symbol Inhibition was a digital replacement for the WJ IV Pair Cancellation test (see LaForte, this issue, for more information on the development and validation of this test). Fourth, Semantic Word Retrieval and Phonemic Word Retrieval were added to provide an adequate assessment of Retrieval Fluency (Gr), and Story Comprehension was added to replace Visual-Auditory Learning, thereby strengthening the measurement of Long-Term Storage (Gl).
WJ V COG Clusters
WJ V COG Cluster Types, Names, and Tests Included in the Cluster
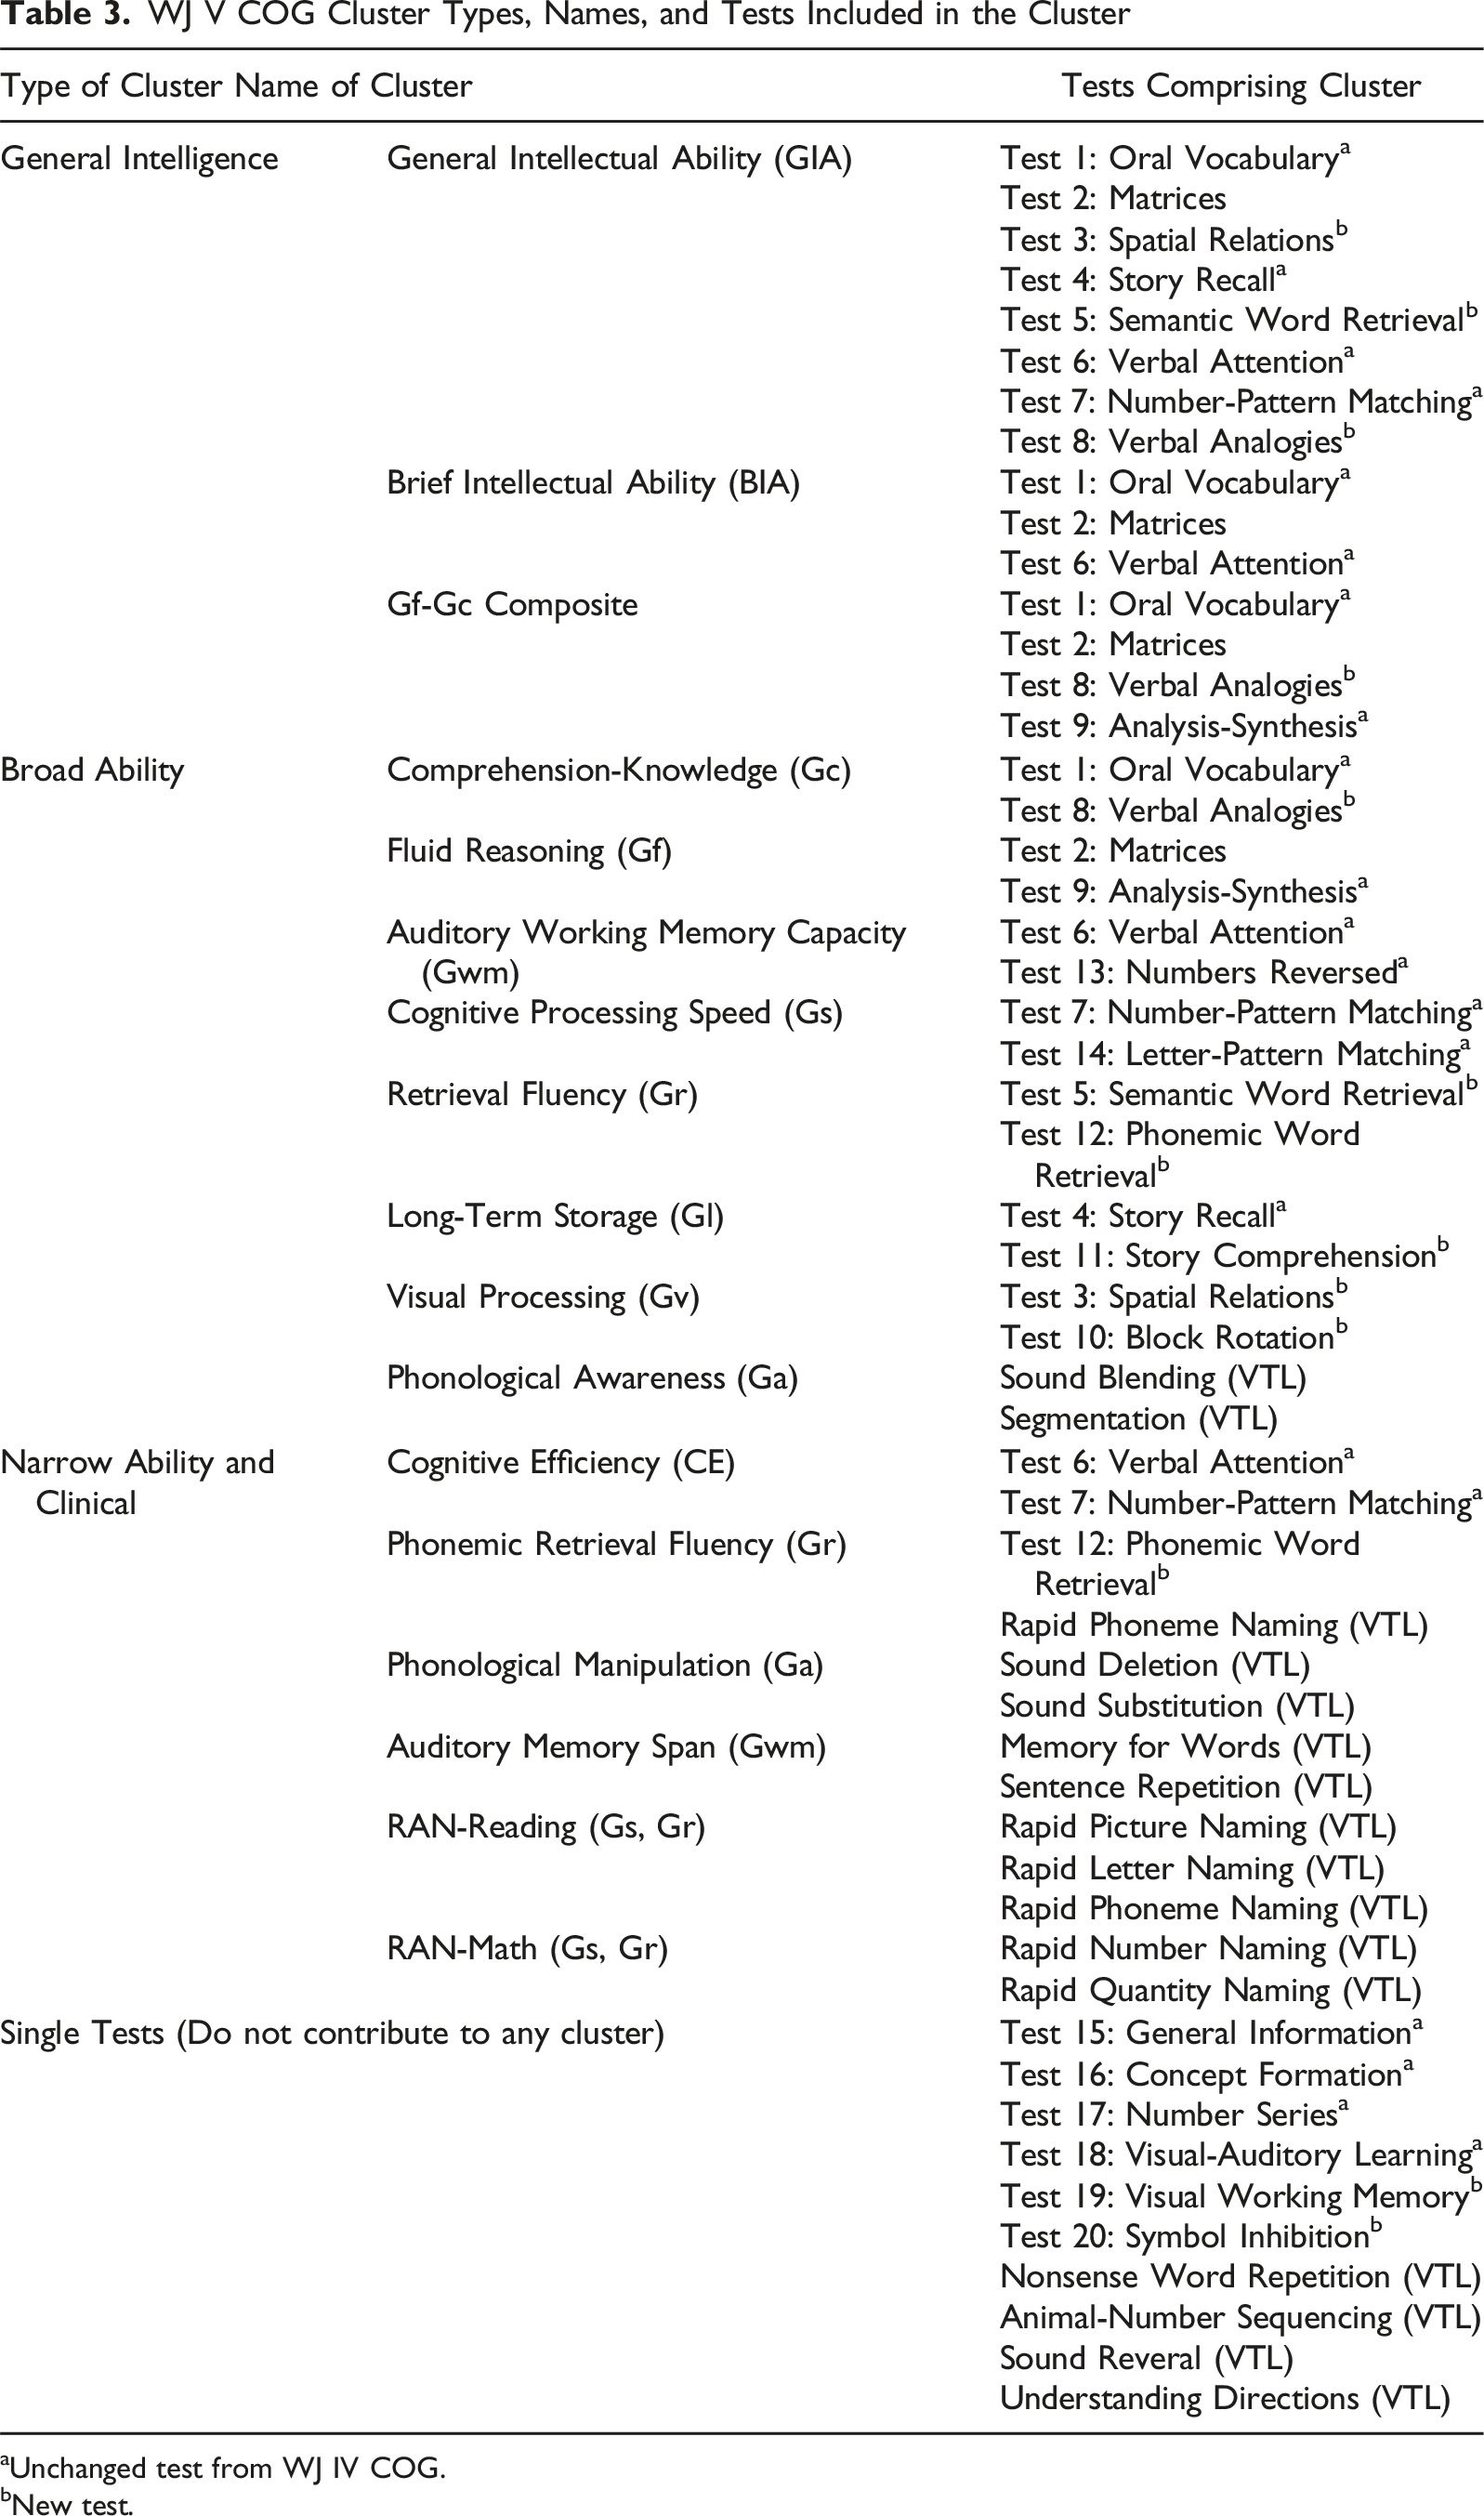
aUnchanged test from WJ IV COG.
bNew test.
Brief Definitions of Eight CHC Broad Abilities
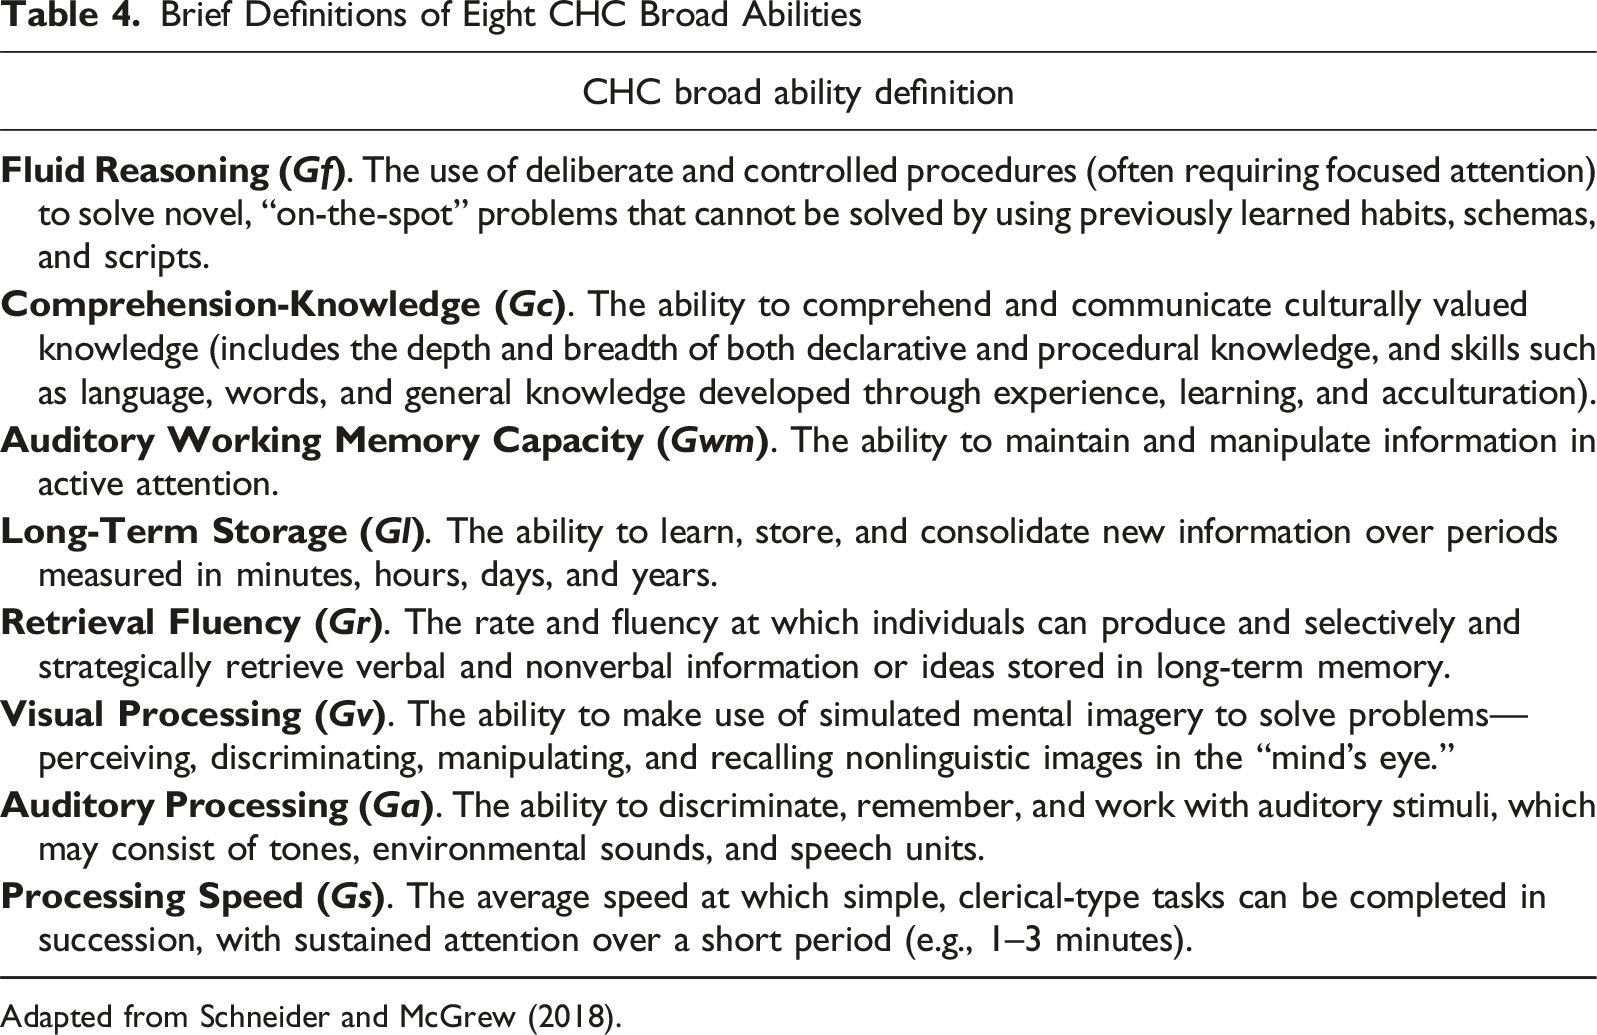
Adapted from Schneider and McGrew (2018).
General Intelligence Clusters
A Comparison of the Composition of WJ IV and WJ V General Intellectual Ability (GIA)
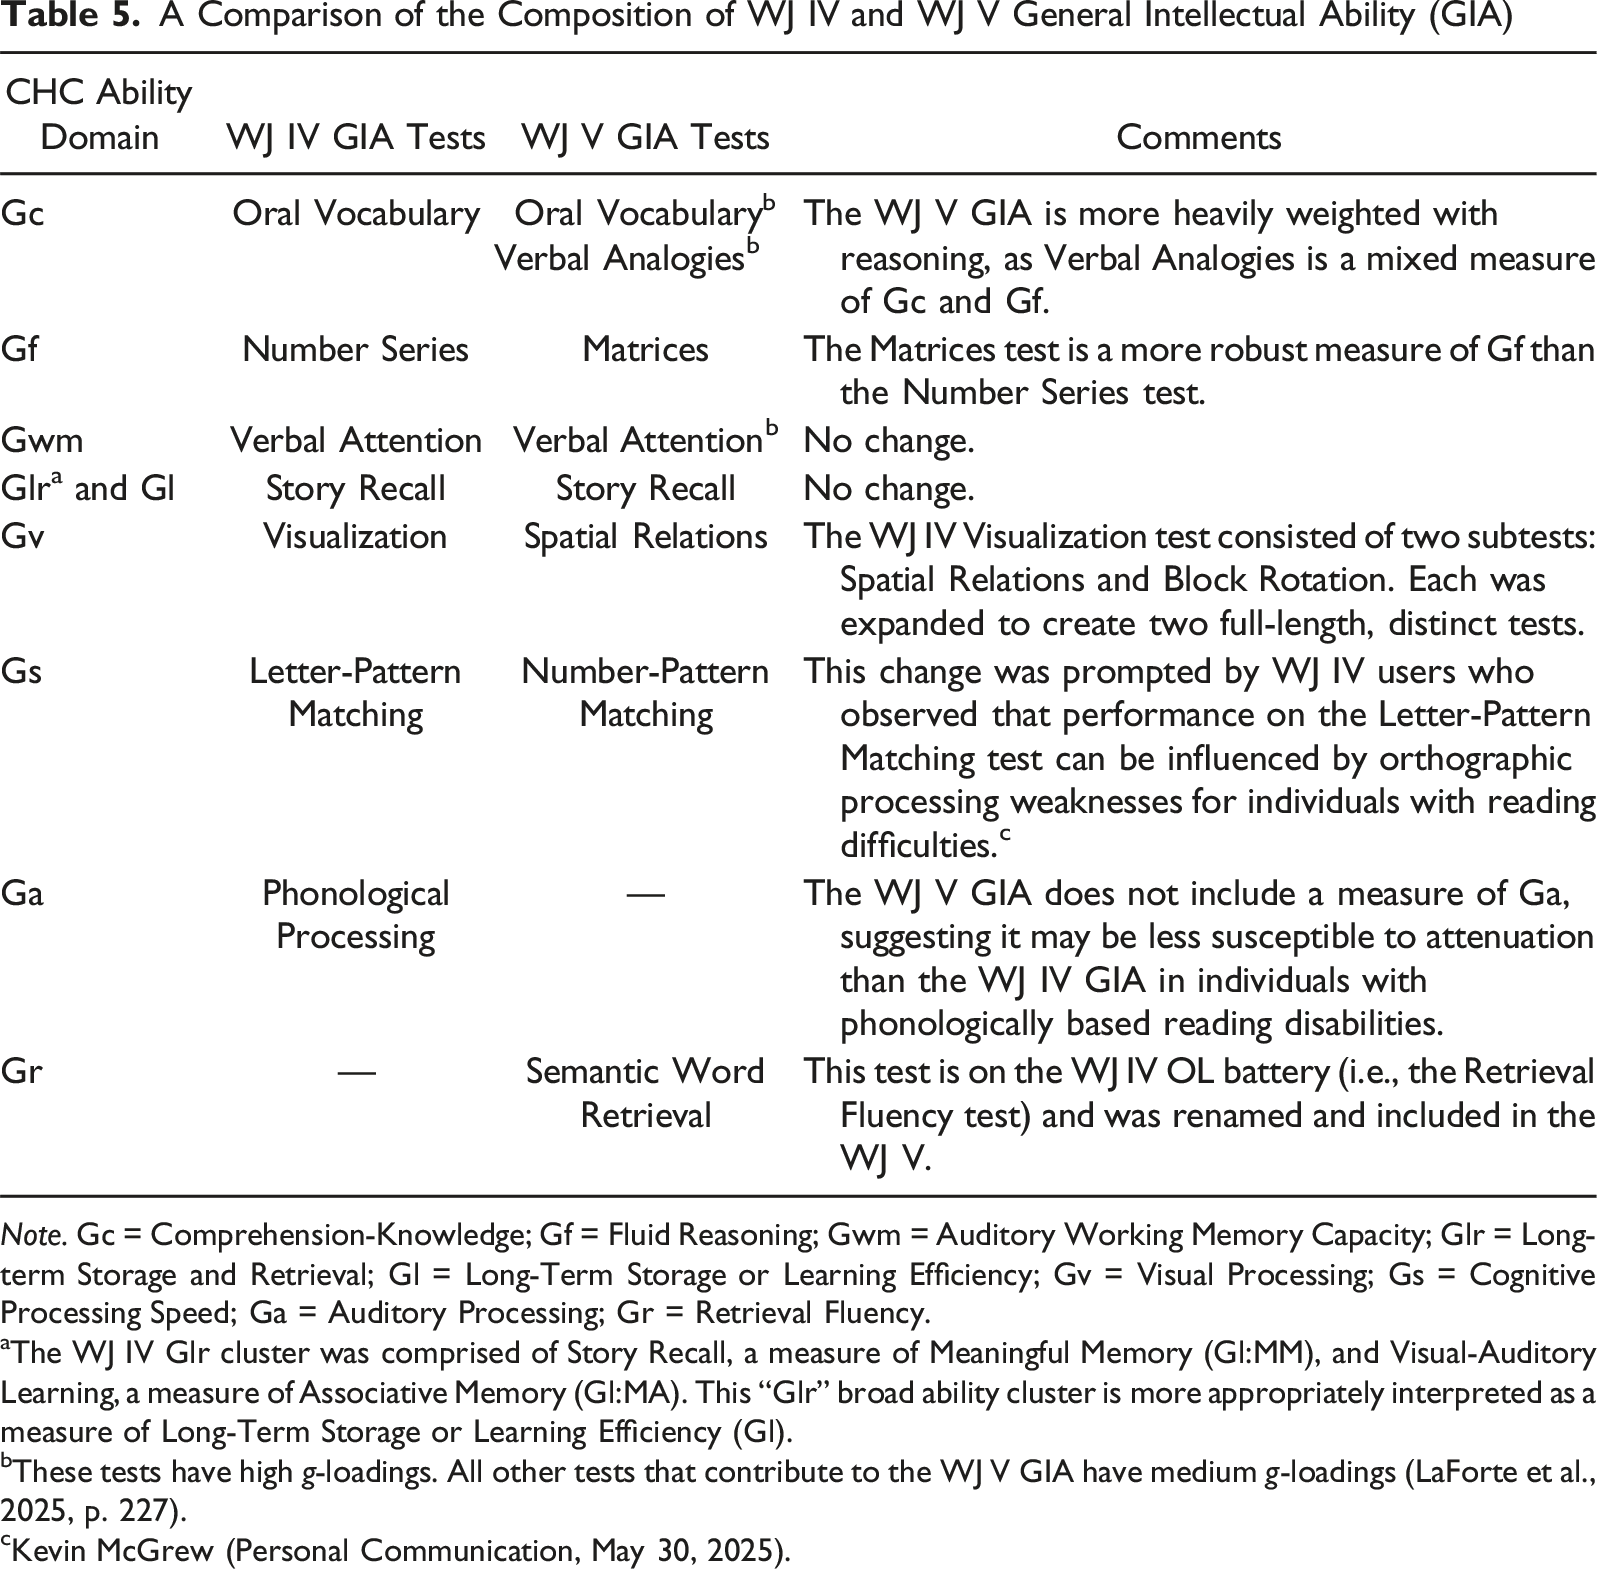
Note. Gc = Comprehension-Knowledge; Gf = Fluid Reasoning; Gwm = Auditory Working Memory Capacity; Glr = Long-term Storage and Retrieval; Gl = Long-Term Storage or Learning Efficiency; Gv = Visual Processing; Gs = Cognitive Processing Speed; Ga = Auditory Processing; Gr = Retrieval Fluency.
aThe WJ IV Glr cluster was comprised of Story Recall, a measure of Meaningful Memory (Gl:MM), and Visual-Auditory Learning, a measure of Associative Memory (Gl:MA). This “Glr” broad ability cluster is more appropriately interpreted as a measure of Long-Term Storage or Learning Efficiency (Gl).
bThese tests have high g-loadings. All other tests that contribute to the WJ V GIA have medium g-loadings (LaForte et al., 2025, p. 227).
cKevin McGrew (Personal Communication, May 30, 2025).
The changes regarding the WJ V GIA have implications for test users, two of which are noteworthy. First, practitioners should not expect an individual’s WJ IV and WJ V GIAs to be approximately the same. Individuals with above-average math skills may have a higher WJ IV GIA than the WJ V GIA due to an exceptionally high score on the Number Series test. Individuals with poor phonological processing may have a lower WJ IV GIA as compared to the WJ V GIA due to the attenuating effect of an exceptionally low score on the Phonological Processing test. Second, the WJ V GIA has slightly lower correlations with achievement than the WJ IV GIA. This is likely due to the reduction in shared content between cognitive and achievement tests (e.g., Number Series and math achievement tests, Phonological Processing and basic reading and writing skills tests). A well-designed and thoughtful series of simulation studies conducted by the WJ V authors supports this contention (see LaForte et al., 2025, Table 6–17, pp. 309–310).
The BIA, a three-test cluster, may be used for time-limited assessments, as well as for screening and reevaluation purposes. As a proxy for g, the BIA should be interpreted with caution, given its minimal breadth of component abilities (see Breit et al., this issue). The WJ IV and WJ V BIAs have two tests in common, Oral Vocabulary and Verbal Attention. The WJ IV Number Series test was replaced with Matrices as the third test comprising the WJ V BIA. The Gf-Gc Composite, which comprises tests with robust g-loadings (LaForte et al., 2025, Table 6.3, p. 226), is useful for identifying individuals who are intellectually gifted and intellectually disabled (Dumont et al., 2016; Floyd et al., 2016; Pfeiffer & Yarnell, 2016). The Gf-Gc Composite is also useful when the GIA does not provide the best description of intellectual ability for individuals suspected of having a specific learning disability due to domain-specific cognitive weaknesses, memory deficits, or difficulties processing information quickly and efficiently (Flanagan, 2025; Flanagan & Alfonso, 2017; McDonough & Flanagan, 2016; Schrank et al., 2015).
Broad Ability Clusters
Table 3 shows that 14 of the 20 WJ V cognitive tests contribute to seven distinct CHC cognitive clusters (Gc, Gf, Gwm, Gs, Gr, Gl, and Gv). The CHC broad ability clusters have many purposes. They are helpful for in-depth diagnostic assessments designed to identify neurodevelopmental disorders, such as specific learning disabilities (SLD) and attention-deficit/hyperactivity disorder (ADHD) (e.g., Decker et al., 2017; Flanagan, 2025; Harvey, 2012; Hoelzle et al., 2023; Miller et al., 2016). They are also helpful in examining the cognitive consequences of brain damage and brain disease (Sweet et al., 2019). Furthermore, research shows that performance on tests of Gl, Gf, Gs, and Gwm differentiates depression and dementia in older adults (Mazur-Mosiewicz et al., 2011). Similarly, adolescents with depression score lower on tests of Gl, Gwm, and Gs (Basnet et al., 2015; see also Kriesche et al., 2023). The broad ability clusters are also used to identify an individual’s unique pattern of strengths and weaknesses, aiding in diagnostic decision making, instructional planning, and the selection of targeted interventions, accommodations, and support strategies (e.g., Flanagan et al., 2024; Mather & Wendling, 2024; Schrank & Wendling, 2015; Woodcock et al., 2014).
A Comparison of Relations Between Cognitive Abilities and Reading Subskills in the WJ V Standardization Sample and Independent Samples of Individuals with Reading Disabilities and Dyslexia
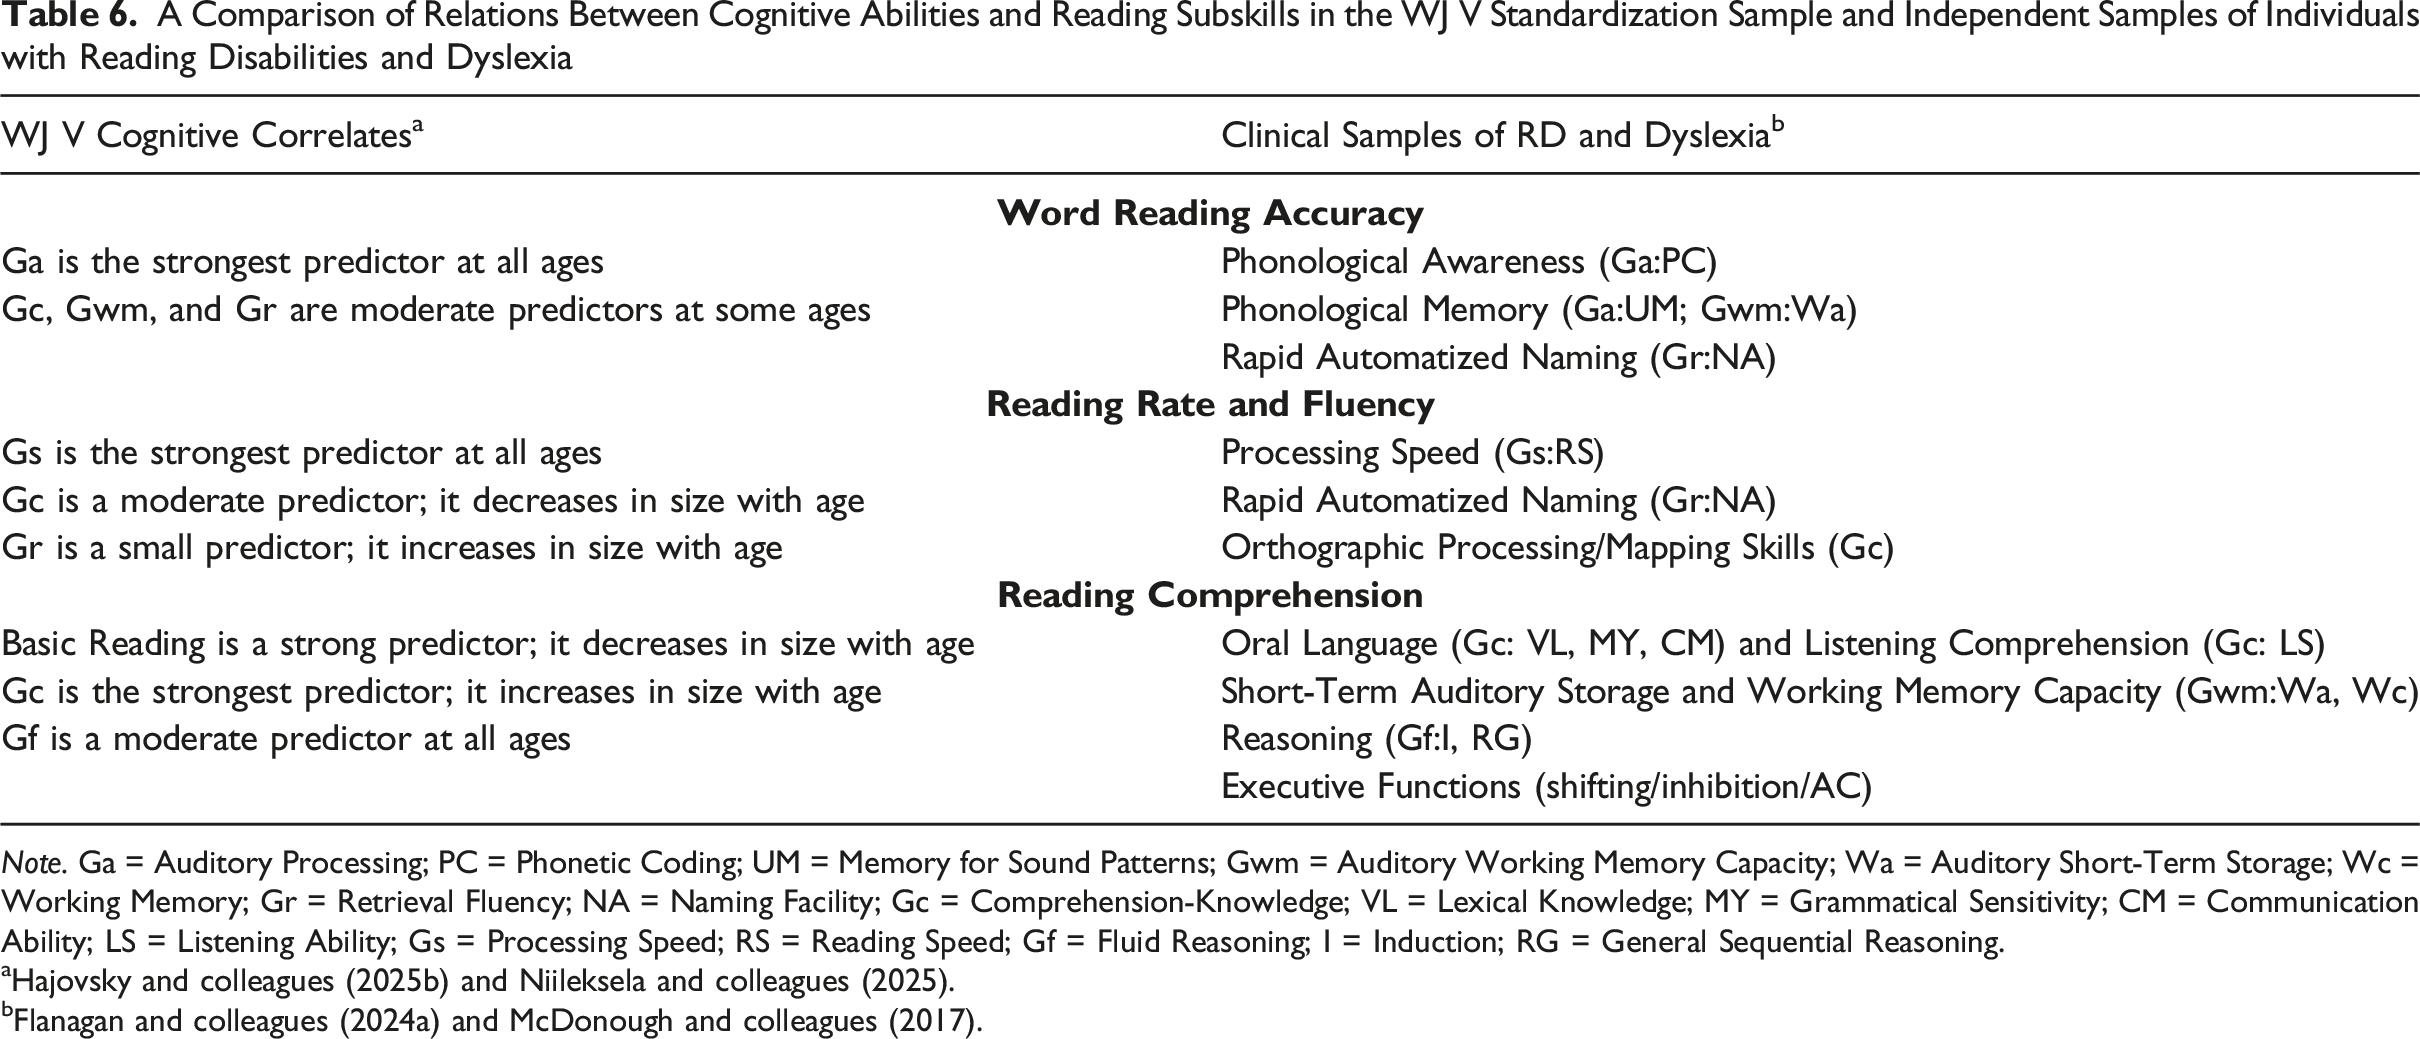
Note. Ga = Auditory Processing; PC = Phonetic Coding; UM = Memory for Sound Patterns; Gwm = Auditory Working Memory Capacity; Wa = Auditory Short-Term Storage; Wc = Working Memory; Gr = Retrieval Fluency; NA = Naming Facility; Gc = Comprehension-Knowledge; VL = Lexical Knowledge; MY = Grammatical Sensitivity; CM = Communication Ability; LS = Listening Ability; Gs = Processing Speed; RS = Reading Speed; Gf = Fluid Reasoning; I = Induction; RG = General Sequential Reasoning.
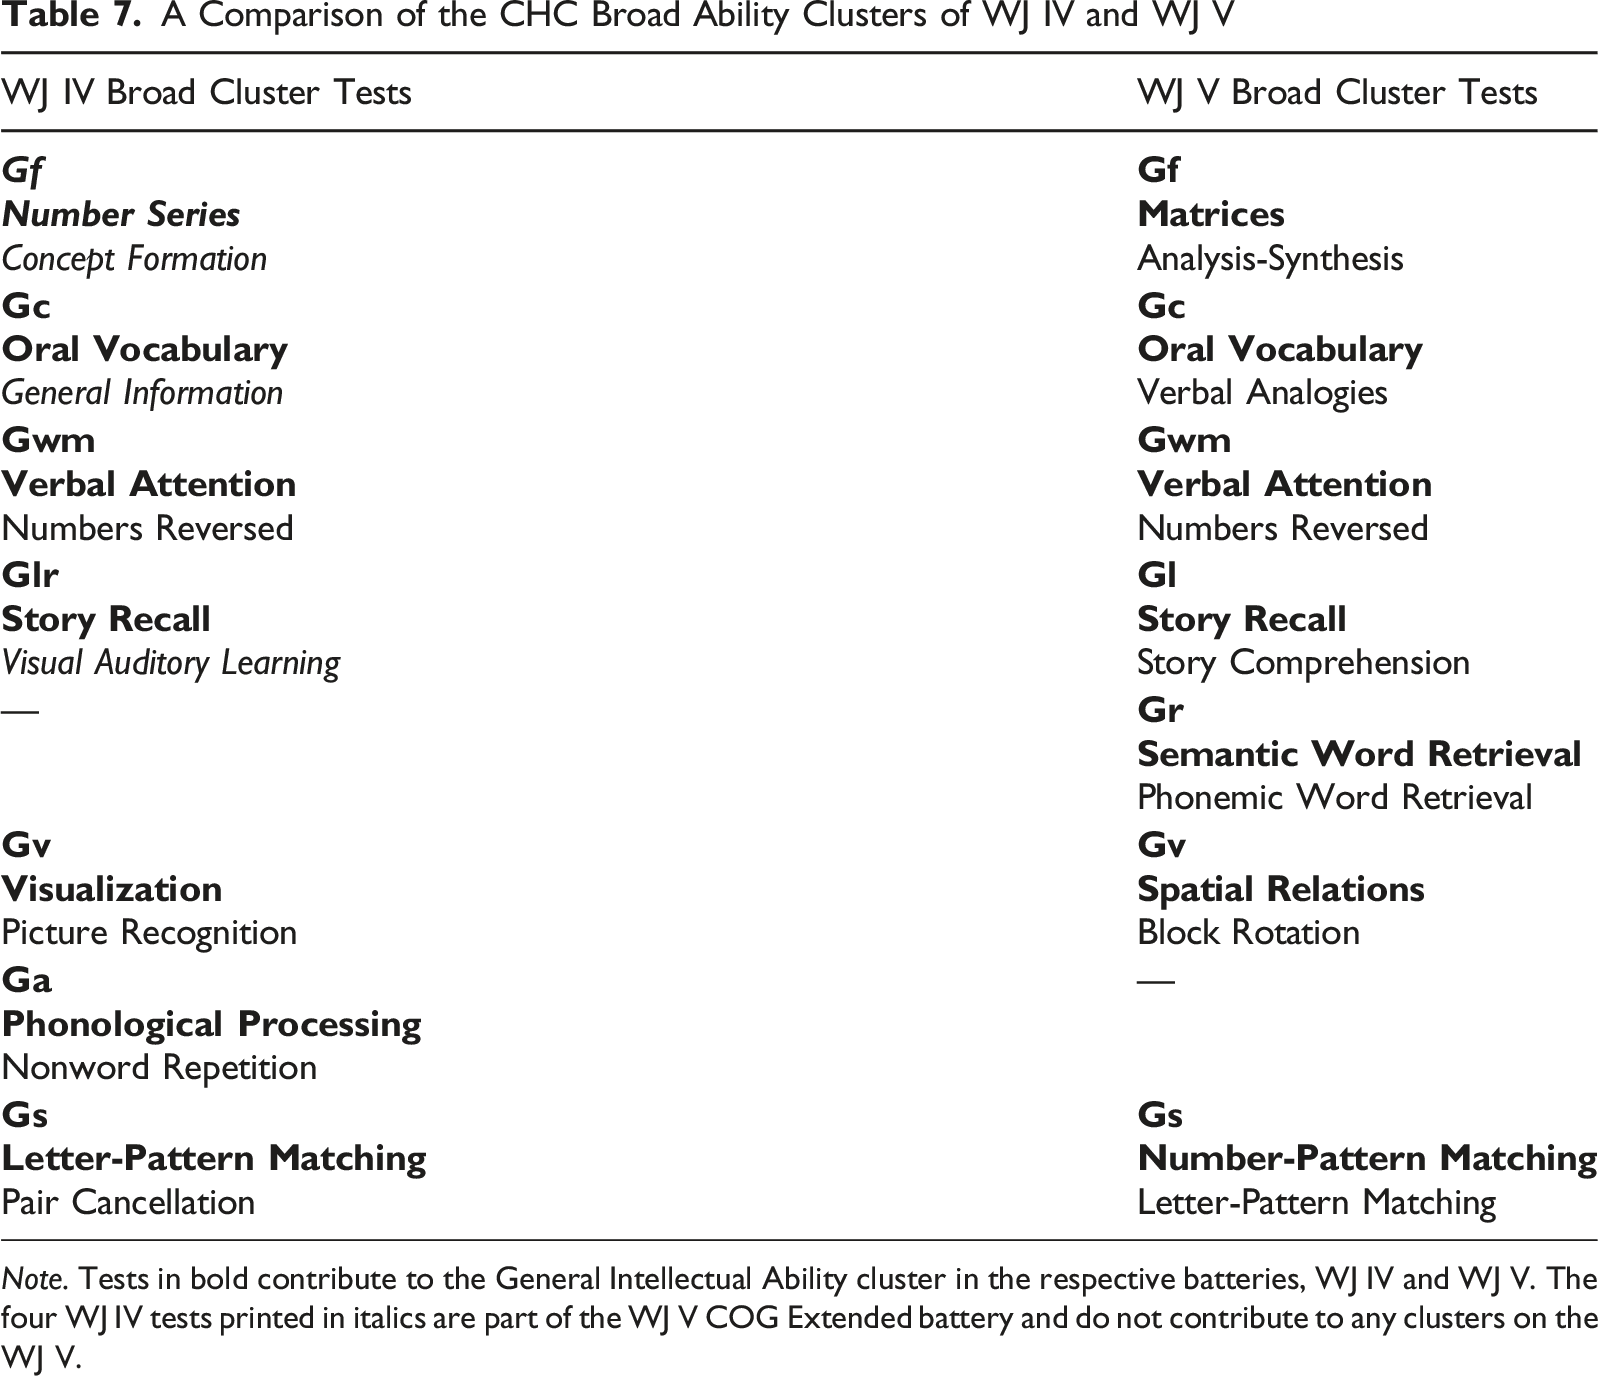
Table 7 provides a comparison of the tests that comprise the CHC broad ability clusters on the WJ IV and WJ V cognitive batteries. Except for Gwm and Gs, the composition of all the broad ability clusters changed. The most salient changes are listed below. • The Gf cluster was made more robust by introducing the Matrices test, a measure of the narrow Gf ability of Induction (I). Matrices replaced Concept Formation, also a test of I, but with a lower receptive language demand. Analysis-Synthesis is a measure of the narrow Gf ability of General Sequential Reasoning (RG). Interestingly, the Gf tests comprising the Gf cluster have medium psychometric g-loadings. A large body of research predicts that these tests would have high g-loadings (Gustafsson, 1984). However, LaForte et al. (2025) reported that, similar to their findings, more recent analyses (e.g., Gignac, 2015) demonstrate that Gf tests like the Raven’s Progressive Matrices are not among the highest g-loaded tests. See Laforte and colleagues (2025, p. 228) for details. • The General Information test is not included on the Gc composite, as it appeared to measure the narrow Gc ability of Lexical Knowledge (VL) to a greater extent than General Information (K0) (Schneider, 2016). Empirical research supports this hypothesis (e.g., McGrew et al., 2023). Its replacement, Verbal Analogies
2
, is a blend of Gc (VL) and Gf, specifically the narrow Gf ability of Induction (I). • The Gwm cluster was renamed Auditory Working Memory Capacity, and its composition remained the same. The Gwm tests, Verbal Attention and Numbers Reversed, measure the narrow Gwm ability of Working Memory Capacity (Wc)
3
. • The Long-Term Storage and Retrieval (Glr) cluster from the WJ IV was separated into two clusters, Long-Term Storage (Gl)
4
and Retrieval Fluency (Gr), reflecting advances in CHC theories (McGrew, 2023; Schneider & McGrew, 2018). The Visual-Auditory Learning
5
test was replaced with the Story Comprehension test—the only test on the WJ V to be listed as part of the WJ V COG and WJ V ACH batteries. Both tests comprising the Gl cluster measure the narrow Gl ability of Meaningful Memory (MM), although the cognitive demands of these tests differ (see Table 1). On the WJ V ACH battery, Story Comprehension and Oral Comprehension provide an “operational indicator” of Listening Comprehension (LaForte et al., 2025, p. 40). • The Gr composite is new to the WJ V COG. Semantic Word Retrieval measures the narrow Gr ability of Ideational Fluency (FI). This test was initially called Retrieval Fluency and was part of the WJ III and WJ IV OL batteries. Phonemic Word Retrieval measures the narrow Gr ability of Word Fluency (FW). The Gr cluster on the WJ V is supported by psychometric network analysis (McGrew et al., 2023) and other analyses reported in the WJ V technical manual. • The Gv cluster is comprised of two strong measures of the narrow Gv ability of Visualization (Vz), Spatial Relations and Block Rotation. On the WJ IV COG, these tests were subtests that made up the Visualization test. Each is now a full-length, independent test. Picture Recognition from the WJ IV is not included on the WJ V because it was found to be a weak indicator of Gv and psychometric g. Additional reasons for not including this test are provided by the authors (LaForte et al., 2025, p. 36). • The Ga cluster is not included on the WJ V COG but is included on the VTL, thus removing Ga from the GIA. Table 3 shows that a Ga cluster can be calculated with two tests from the VTL, Sound Blending and Segmentation. • The tests that make up the Gs cluster remained the same, although the order changed. As such, Number-Pattern Matching contributes to the GIA cluster, rather than Letter-Pattern Matching. These tests measure Perceptual Speed (P). • The Gwm tests, Verbal Attention and Numbers Reversed, measure the narrow Gwm ability of Working Memory Capacity (Wc)
6
. A Comparison of the CHC Broad Ability Clusters of WJ IV and WJ V Note. Tests in bold contribute to the General Intellectual Ability cluster in the respective batteries, WJ IV and WJ V. The four WJ IV tests printed in italics are part of the WJ V COG Extended battery and do not contribute to any clusters on the WJ V.
It is worth noting that numerous studies have argued that general intelligence test scores should be the primary or exclusive focus when interpreting cognitive assessments (e.g., Canivez, 2017; Dombrowski et al., 2018; McGill et al., 2018). This conclusion is based primarily on bifactor and Schmid-Leiman (BF/SL) statistical approaches, which have been criticized for methodological problems and a lack of a theoretical foundation (Decker et al., 2020; Murray & Johnson, 2013; Schmank et al., 2021). Drawing from their BF/SL research, the Canivez/Dombrowski research team supports psychometric g-theory and believes interpretation should focus on general intelligence (g) rather than broad cognitive abilities. However, the level of interpretation that is most appropriate varies depending on the statistical methods employed, and this “g-focused” research group frequently disregards studies that support interpreting CHC broad abilities (see McGrew et al., 2023, for a detailed discussion).
The Canivez/Dombrowski research team demonstrates bias through heavy self-citation, while disregarding contrary evidence from groups such as the Keith-Reynolds researchers, who endorse multifactorial intelligence theories (e.g., Caemmerer et al., 2020; Keith & Reynolds, 2018; Reynolds et al., 2013). This one-sided citation approach allows them to advocate for a g-only interpretation without sufficient empirical support (McGrew et al., 2023). As Meehl (1992) observed, statistical methods do not inherently produce truth. The BF/SL models lack grounding in intelligence and cognitive theory. Ironically, while this group acknowledges that their bifactor models have computational issues, they continue to use these problematic models to argue against the interpretation of CHC broad ability clusters.
Extensive validation evidence supports distinct CHC abilities beyond statistical factor analysis alone, encompassing developmental trajectories, connections to academic performance, brain-based findings, and genetic studies (e.g., Haier & Jung, 2018; Horn & Knoll, 1997; LaForte et al., 2025). Understanding g and broad abilities necessitates knowledge from disciplines outside psychometrics and school psychology, especially neuroscience and cognitive science (McGrew et al., 2023).
The general intelligence factor (g) arises from positive correlations between cognitive test scores, representing positive manifold or psychometric g (Van der Maas et al., 2006). Although g shows robust predictive power, what it represents remains uncertain. It is plausible that g might result from the test measures themselves, making it a formative rather than a causative factor. From this viewpoint, the abilities beneath g (broad and narrow abilities) become more crucial for understanding cognition (see Kovacs & Conway, 2016).
Contemporary brain network theories provide more convincing explanations for g than BF/SL research. Process Overlap Theory (POT; Kovacs & Conway, 2016) proposes that general executive processes in frontal and parietal brain regions generate positive manifold by overlapping with specialized cognitive processes. Differences in these executive processes can limit cognitive performance. Parietal Frontal Integration Theory (P-FIT; Haier & Jung, 2018) provides an alternative brain-centered explanation. These theories account for psychometric g while rejecting the idea of a single general factor of intelligence, or psychological g.
The WJ V technical manual provides ample empirical support for the structure of the WJ V through various methodologies, yielding similar findings. According to the WJ V authors, “The application of multiple structural analysis methods on the same data limits the risk of a single statistical method (viz., factor analysis) obscuring conclusions, missing nuances in the data, or limiting the discovery of new findings” (LaForte et al., 2025, p. 257). The network of validity evidence for the CHC broad abilities supports the interpretation of the WJ V CHC broad ability clusters. The bold claims of the Canivez/Dombrowski research team that broad ability score interpretation lacks empirical support need to be tempered. The emergence of a strong general factor is dependent on the methods used to analyze the data (see Decker et al., 2020; Horn & Blankson, 2012).
Narrow Ability and Clinical Clusters
Table 3 shows there are six CHC narrow ability and clinical clusters. The Cognitive Efficiency (CE) cluster is comprised of one Gwm and one Gs test, which are the cognitive domains that represent the “parameters of cognitive information processing efficiency” (LaForte et al., 2025, p. 54; see also McGrew, 2023; Schneider & McGrew, 2018). This cluster reflects an individual’s ability to hold and manipulate information, control and sustain attention, and execute tasks quickly and accurately, which is important for understanding and diagnosing attention problems, learning disabilities, and other neurological impairments (Mather & Wendling, 2024; Schrank et al., 2014). The Phonemic Retrieval Fluency cluster is comprised of the Phonemic Word Retrieval test from the COG battery, a measure of the narrow Word Fluency (FW) ability, and Rapid Phoneme Naming, a new test to the WJ V, housed in the VTL. This test requires the examinee to pronounce phonemes for single letters quickly, a task that best fits within the broad ability domain of Gr. The authors provide preliminary empirical support for the Phonemic Retrieval Fluency cluster in Chapter 6 of the technical manual (LaForte et al., 2025). Additionally, because the Rapid Phoneme Naming test does not align well with any existing narrow Gr abilities, the authors provide support for a potential new narrow ability, called Phoneme Retrieval Fluency (FP; Laforte et al., 2025, p. 250). Additional validation evidence by independent researchers may pave the way for FP to join other Gr narrow abilities in the next iteration of the CHC taxonomy.
Four narrow ability and clinical clusters are derived from tests in the VTL. The Phonological Manipulation cluster comprised of the Sound Deletion and Sound Substitution tests, measures the narrow phonetic coding (PC) ability. These two tests were subtests of the WJ IV Sound Awareness test and were extended to full-length tests on the WJ V. This cluster, along with the Phonemic Retrieval Fluency cluster, is likely to play a prominent role in evaluating individuals suspected of having a reading disability or dyslexia. Another cluster that will be important in dyslexia evaluations is the RAN-Reading cluster, comprised of the Rapid Picture Naming, Rapid Letter Naming, and Rapid Phoneme Naming tests. Rapid automatized naming (RAN) tests like these have long been used in dyslexia evaluations because they have been found to differentiate dyslexic children from typical readers (see, for example, Denckla & Rudel, 1976). Furthermore, phonological and RAN processes explain unique variance in different types of reading (Wolf & Bowers, 1999). A meta-analysis of 60 years of research found that knowledge of letters and sounds, along with phonological awareness and rapid naming in kindergarten, best predicted reading skills in 1st and 2nd grade (Schatschneider et al., 2004). Two additional rapid naming tests from the VTL, Rapid Number Naming and Rapid Quantity Naming, comprise the RAN-Math cluster. Research shows that number-specific RAN predicted arithmetic fluency best (e.g., Kirby et al., 2003).
The WJ V authors’ separation of RAN tests into reading and math clusters suggests that a general RAN factor may obscure specific cognitive difficulties. Research shows that, in general, alphanumeric RAN (letters and numbers) correlates more strongly with reading performance, while nonalphanumeric RAN (colors and objects) better predicts math fluency (e.g., Norton & Wolf, 2012). Typically, colors and objects are not processed serially, making their naming less automatic and less similar to reading. Thus, even though a general RAN factor exists, research indicates that targeted RAN tasks differentially predict early reading and math performance, helping to identify children at risk for learning difficulties (Hornung et al., 2017). As such, separating RAN tasks into separate clusters, as the WJ V authors did, is helpful in clinical contexts. Empirical support for separating the RAN tests into separate RAN-reading and RAN-math clusters is found in the WJ V technical manual. For example, developmental growth curves for each cluster show that they “diverge from one another in early rate of growth and approximate age of plateau” (LaForte et al., 2025, p. 233). Concurrent validity studies show patterns of convergent and discriminant validity that also support the contention that the RAN-reading and RAN-math clusters are not redundant (Laforte et al., 2025, pp. 306–307).
Standardization Characteristics and Psychometric Properties of the WJ V
The authors and development team of the WJ V followed the recommendations outlined in the Standards for Educational and Psychological Testing (American Educational Research Association et al., 2014), the Guidelines for Technology-Based Assessment (International Test Commission & Association of Test Publishers, 2022), and the technical standards for web accessibility as specified in the Web Content Accessibility Guidelines 2.2 (W3C World Wide Web Consortium, 2023). According to LaForte and colleagues (2025), since its first edition, the Woodcock-Johnson tests have been developed according to the Rasch model (Rasch, 1960, 1980), which is used in educational and psychological testing to ensure that test scores are meaningful and comparable via an equal-interval scale. It enables the transformation of raw test scores into a scale where the difficulty of test items and the ability of test-takers are measured on the same continuum. The model assumes that the likelihood of a person answering an item correctly is determined by the difference between the person’s ability and the item’s difficulty. This approach allows for more fair comparisons between different tests and groups, as it provides a consistent measure of ability that is not influenced by the specific items or people involved (Bond & Fox, 2015). In collaboration with his colleagues (e.g., Woodcock & Dahl, 1971), Richard Woodcock created the W scale after observing limitations associated with using the logit-score Rasch-scaled tests. The W scale transforms the Rasch scale into positive integer values centered around 500, making it easier for educators to understand. The W scores were instrumental in developing the WJ Relative Proficiency Index (RPI), which aids practitioners in interpreting assessment outcomes (pp. 72–73). The RPI is discussed in greater detail later in this article.
Norming Studies
The criteria for the standardization sample in psychological testing, as articulated in the Standards for Educational and Psychological Testing (AERA, 2014), include representative sampling, adequate sample size, random selection processes, detailed reporting of demographic characteristics, and thorough analyses to ensure test fairness and equity. These criteria are fundamental for developing and using reliable and valid psychological assessments. LaForte and colleagues (2025) describe the development process of the WJ V, which included four norming studies conducted from February 2022 to January 2024, involving 8,209 cases. These were sourced through a marketing firm and Riverside Insights examiners. Multiple Matrix Sampling (MMS) was employed to manage the extensive WJ V battery, enabling each participant to complete approximately one-third of the tests. The norming studies aimed to develop WJ V norms, including calibration, alternate form, and test-retest (CAR) cases, as well as concurrent and clinical validity cases.
Norming Sample
The WJ V norming study targeted 6,000 participants across 24 age groups, from ages 3 to 80 years and above, with 250 participants per group. The sampling aligned with the 2017 U.S. Census Bureau’s national population projections (U.S. Census Bureau, 2017), taking into account ethnicity, race, and education. Data collection between February 2022 and August 2023 involved 5,837 individuals, comprising 562 children aged 3 to 5 years who were not enrolled in K–12 education, 3,106 students aged 4 to 19 years enrolled in K–12, and 2,169 individuals aged 17 years and older who were no longer in high school. Although some age groups fell slightly short of the target of 250 examinees, the average number of cases per age group, ranging from 3 to 79 years, was 245. The lower number of participants (190) in the 80+ age group was anticipated due to challenges in recruiting older adults, particularly amid health concerns post-pandemic. To ensure the WJ V norms accurately represented the demographic distributions in the U.S. population, weights were applied to adjust for underrepresented groups, ensuring representativeness (LaForte et al., 2025, pp. 129, 157–170).
Calibration/Alternate Form/Test-Retest (CAR) Study
The Calibration and Alternate-Form Reliability (CAR) studies conducted for the WJ V aimed to ensure the equivalence of alternate test forms, involving 1,430 participants, to assess the reliability of second forms across the Cognitive, Achievement, and Virtual Test Library batteries (LaForte et al., 2025, pp. 132–133). These studies evaluated 27 tests: 5 in the Cognitive battery, 17 in the Achievement battery, and 5 in the Virtual Test Library. High alternate-form reliability coefficients were observed, typically above 0.8 for ages 4 to 19, indicating consistent rank-ordering of scores between forms (LaForte et al., 2025, p. 202). For adults, most coefficients remained above 0.8, with exceptions like Symbol Inhibition, Word Reading Fluency, and Oral Reading showing coefficients in the 0.7's, and Passage Comprehension, Written Language Samples, and Paragraph Reading Comprehension in the 0.6's (LaForte et al., 2025, p. 202).
Test-retest reliability was similarly high for the WJ V Semantic Word Retrieval, Phonemic Word Retrieval, and Letter Writing Fluency tests, with coefficients above 0.9 for younger participants and above 0.8 for adults (LaForte et al., 2025, p. 202). Content equivalence was ensured by calibrating items to the standard W scale, with curriculum experts consulting on tests like Letter-Word Identification, Calculation, and Spelling to verify comparable item types.
The CAR studies also examined the impact of prior exposure to specific WJ V tests, noting minimal effects for most tests. However, the Rapid Automated Naming tests, such as Rapid Letter Naming and Rapid Quantity Naming, showed small to moderate practice effects, particularly in adults. Rapid Phoneme Naming exhibited moderate effects for children and adults, suggesting slight advantages from recent exposure (LaForte et al., 2025, p. 202). Overall, the CAR studies validate the reliability and equivalence of WJ V’s alternate forms, with caution advised for interpreting scores from speeded tests due to potential practice effects.
Norms Construction
The WJ V norms were established using bootstrap resampling, a technique first applied in the Woodcock-Johnson III Normative Update (Woodcock et al., 2007). Bootstrap resampling involves repeatedly sampling from the data to evaluate variability and improve the reliability of results, akin to taking multiple samples from a dataset to observe potential changes. This approach allows for more accurate measures of examinee abilities than conventional methods typically seen in other standardized tests. Additionally, LaForte and colleagues (2025) report that scores from ability tests such as the WJ V often exhibit non-normal characteristics, with average scores clustering closely together and extreme scores displaying varied patterns. The WJ V addresses this by using two half-normal distributions for each age group, which allows for different variability estimates on either side of the score spectrum (pp. 172–173).
Additionally, the WJ V norms utilize piecewise linear modeling to capture any nonlinear relationships in the data effectively. This modeling technique breaks complex relationships into simpler linear segments, using “hinge functions” to adjust the model based on specific data points. These functions are added to enhance the model until further improvements are minimal. This approach provides a more accurate initial approximation for the norms tables and prediction equations, ensuring they reflect the observed data patterns (pp. 174–175).
Test and Cluster Norms
A Reference W (REF W) is a normative score calculated for each test according to the normative-median score for each age/grade interval. These scores allow for the creation of developmental growth curves for the respective age and grade groupings. They are foundational for determining age and grade equivalent scores, the RPI, and instructional range features in the WJ V. Furthermore, consideration of the standard deviations (SDs) of the REF W scores provides the basis for calculating other norm-referenced metrics, such as standard scores and percentile ranks. LaForte and colleagues (2025) detail the steps for establishing age- and grade-based norms for tests, clusters, and comparison base rate procedures in Chapter 4 of the technical manual (pp. 175–188).
Reliability
According to LaForte and colleagues (2025) and AERA (2014), reliability in testing refers to the precision and consistency of test scores. This is critical for psychological and educational assessments to ensure accurate and dependable results. Understanding a test’s reliability is necessary for users to make informed decisions based on the outcomes. Item Response Theory (IRT), particularly the Rasch model used in the WJ V, builds upon Classical Test Theory (CTT) concepts, such as reliability and measurement error reliability. Indexes such as internal consistency, test-retest, and alternate-form coefficients are used to estimate reliability. Internal consistency evaluates how well test items measure the same construct consistently (Cronbach, 1951). LaForte and colleagues (2025) state that test reliability for the WJ V tests and clusters was set at 0.80. They add that using the Standard Error of Measurement (SEM), which indicates the precision of a score, reflecting how accurately a true score can be estimated (AERA et al., 2014), aids in interpreting scores by providing a confidence band, showing the range within which the true score might fall based on an associated confidence level (e.g., 90%, 95%).
Median Internal Consistency Reliability Coefficients for the WJ V COG Clusters with Corresponding Age Range in Years
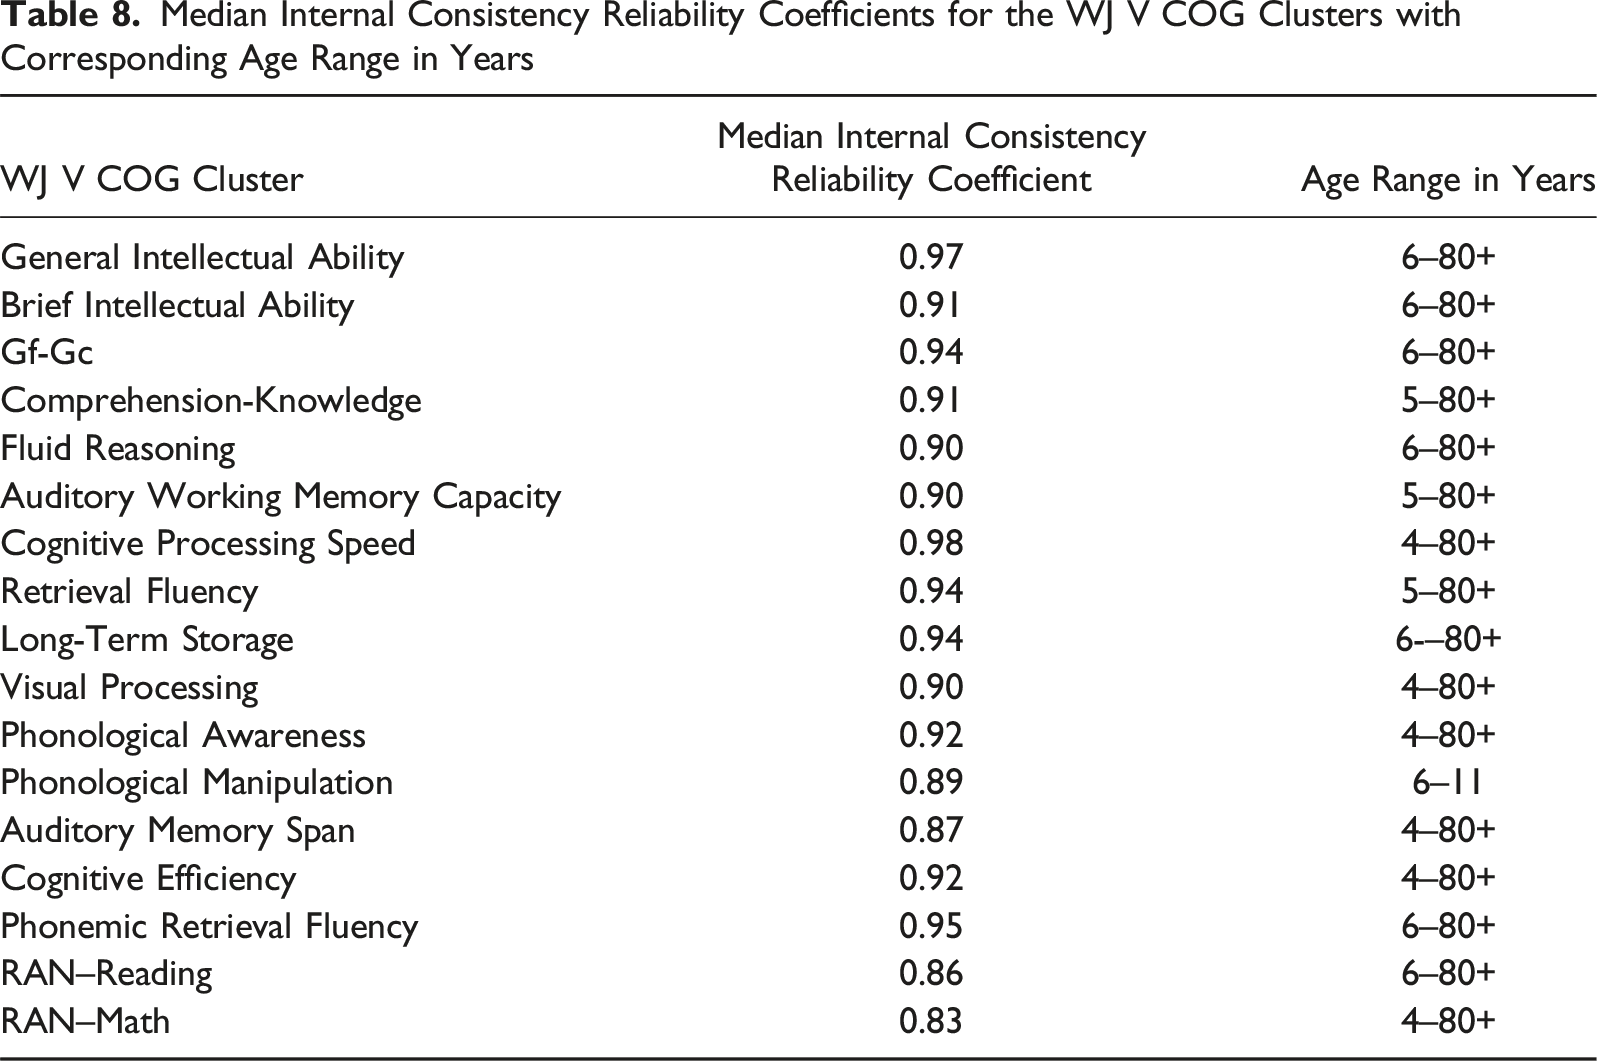
According to Laforte and colleagues (2025), the WJ V offers 27 alternate test forms, known as Form B, to provide backup options in cases where test administration is compromised or follow-up testing is needed. These forms aim to ensure that both versions measure the duplicate content with similar means and variances, rank examinees similarly, and maintain equivalent difficulty ranges. The reliability of these forms was assessed through alternate-form and test-retest reliability coefficients, derived from a CAR study involving 1,430 participants. Most alternate-form reliability coefficients for ages 4 to 19 were above 0.8, with many exceeding 0.9. For adults, most coefficients were also above 0.8, although some tests, such as Symbol Inhibition and Oral Reading, had slightly lower reliability in the 0.7 range. Test-retest reliability for tests with identical forms, such as the Semantic Word Retrieval test, showed coefficients above 0.9 for younger examinees and above 0.8 for adults. The study also evaluated the equivalence in measurement range and precision between the two forms. Both forms were designed to have comparable measurement floors and ceilings, ensuring no disadvantage based on which form is administered. Precision across score ranges was similar for both forms, as indicated by comparable Conditional Standard Errors of Measurement (CSEMs) (pp. 199–210).
The impact of prior exposure, or practice effects, was also taken into consideration. Most tests showed negligible differences in scores between the first and second administrations, except for some rapid automatized naming tests, which exhibited small to moderate effect sizes (LaForte et al., 2025, pp. 210–211). This suggests that while prior exposure might benefit examinees in these cases, the overall impact on scores from using alternate forms is minimal. However, if administered within a day of the first test, caution is advised when interpreting scores from rapid phoneme naming tests. Further research is recommended to explore the effects of varying retest intervals on speeded tests.
A Summary of Validity Evidence for the WJ V
The validity evidence for the WJ V is structured according to AERA (2014). The validity chapter in the WJ V technical manual is unparalleled in its breadth and depth of methods used and analyses performed, supporting the content and structural validity of the battery, as well as its relations to other variables. Space limitations preclude a detailed account of validity evidence for the WJ V. Consequently, only a summary of the validity evidence is provided.
Content Validity
Content validity is demonstrated by aligning the WJ V tests with CHC theories, ensuring each broad CHC ability is measured by at least two narrow ability tests. LaForte and colleagues’ (2025) classifications were based on a review of previous versions of the WJ and their intimate knowledge of the WJ V tests, informed by detailed psychometric analyses they conducted. Independent CHC expert classifications were based on a blind review of only written descriptions (without test names) of the WJ V tests (see Flanagan et al., 2025b for details). LaForte et al. (2025) reported 98% total agreement at the broad ability level and 93% total agreement at the narrow ability level (p. 218). There was complete disagreement on only one test, the Visual-Auditory Learning test. This task has a history of being a test of Associative Memory (MA) in the Gl domain. However, recent and extensive analyses conducted by the WJ V authors indicated that the Visual-Auditory Learning test is a mixed measure of Gv and Gf. Other classification differences were related to methodological differences (e.g., different approaches to working memory classifications, new findings about RAN tests, and the introduction of new narrow abilities). Overall, high agreement rates provide strong evidence of validity for the WJ V test classifications. Also, cognitive tests showed better agreement than achievement tests, likely due to the factorial complexity of achievement tests. The WJ V authors highlighted areas where further research could improve classification precision, for example, structural analysis research at the narrow ability level (LaForte et al., p. 218).
Structural Validity
The WJ V authors described a sophisticated three-stage structural validity analysis framework to evaluate how well the WJ V test relationships conform to CHC theory. At Stage 1, the WJ V norming sample was divided into six age groups (4–5, 6–9, 10–14, 15–19, 20–49, 50– 80+ years). Each age group was randomly split into two samples: one for model development (Sample A) and one for cross-validation (Sample B). The authors used “quick norm” W-Difference scores as proxies for standard scores during initial analysis because the final norms tables had not been developed (LaForte et al., 2025, p. 238). At Stage 2, four exploratory methods were applied: Multidimensional Scaling (MDS), which provides visual mapping of test relationships; Cluster Analysis (CA), which groups tests by similarity; Principle Axis Factor Analysis (PAF), which was applied to two test sets to avoid multicollinearity; and Psychometric Network Analysis (PNA), a newer statistical method for understanding how cognitive tests relate to each other, providing an alternative to traditional factor analysis. Specifically, unlike factor analysis, PNA views correlations as emerging from direct interactions between tests, without necessarily requiring a common underlying cause (Borsboom et al., 2021; see Laforte et al., 2025, 251–257). These analyses resulted in strong evidence for 10 broad cognitive abilities (Gc, Gf, Gv, Ga, Gl, Gr, Gwm, Gs, Grw, and Gq).
Cluster Analysis
CA links the most highly correlated WJ V tests into initial groupings, which then combine with other groups or individual tests to form progressively larger clusters. This hierarchical structure is visualized through tree dendogram diagrams (Jacoby & Ciuk, 2018), culminating in a single all-encompassing group. The Ward’s cluster analysis of the initial target age group (10 to 14 years) revealed meaningful groupings that align with broad CHC abilities, including Ga, Gl, Gr, Gv, Gq, Gf, Gc, and Gs. Additionally, the analysis identified potential narrow CHC subgroups within Gwm and Grw. Within the Gwm domain, the analysis distinguished between tests requiring complex attentional control (Gwm-Wc) and those requiring simpler memory span or short-term auditory storage (Gwm-Wa). For Grw abilities, a meaningful separation emerged between tests measuring basic reading skills (Grw-skills) and those requiring application through connected discourse (Grw-app).
Multidimensional Scaling (MDS)
Like CA, MDS is an exploratory analysis that aims to identify the underlying structure in datasets by examining relationships between variables. MDS is inherently more qualitative than factor analysis, as it can visually depict test relationships, providing an essential layer of evidence for the validity of the WJ V by clarifying test content and processing domains. The WJ V authors applied Guttman’s Radex two-dimensional MDS procedure to correlation data from all 60 WJ V tests across six age groups (4–5, 6–9, 10–14, 15–19, 20–49, and 50–80+). LaForte et al. (2025) used the detailed results from the 10- to 14-year-old age group as their primary model. Their results revealed six distinct groupings or content facets: (1) the Verbal (V) facet includes mainly Gc and Gl tests, which require access to semantic knowledge; (2) the Auditory (A) facet includes Ga tests and tests of the Gwm narrow ability of Auditory Short-Term Storage (Wa); (3) the Figural-Visual (FV) facet includes Gv, Gf, and the Gwm narrow ability of Visual Short-Term Storage (Wv); (4) the Quantitate-Numeric (QN) facet includes tests of the Gq narrow ability of Math Achievement (A3) and the Gf narrow ability of Quantitative Reasoning (RQ); (5) the Reading-Writing (RW) facet includes nine reading and writing tests from the WJ V ACH battery; and (6) the Speed-Fluency (SF) facet consists of Processing Speed (Gs) tests from the WJ V COG and ACH batteries, Retrieval Fluency (Gr) tests from WJ V COG and VTL, and Gs/Gr tests that are classified as Naming Facility (NA)—a narrow Gr ability. 7
In general, the CA and MDS methods validated each other’s findings. That is, when CA identified certain groupings of cognitive abilities, MDS provided spatial confirmation by showing those same abilities positioned close together in dimensional space. The findings from these analyses provide empirical support for interpreting tests as measuring similar content domains, moving beyond professional judgment based on task characteristics and task demands. Empirical CHC and content classifications of tests provide a dual lens for understanding test performance.
Exploratory Principal Axis Factor Analysis (PAF)
The WJ V authors utilized the open-source JASP (Version 0.17.2.1) exploratory factor analysis module with oblique oblimin rotation (JASP Team, 2022) to examine both Set A and Set B test collections. Consistent with cluster analysis and multidimensional scaling results, the Set A analyses identified nine broad CHC factors, including Gc, Gs, Gs/Gr-NA, Gwm-Wa, Gwm-Wc, Wa, Gv, Gr, Gl, and Gf. However, the Ga factor did not emerge as distinct, being defined by only two Ga tests: Sound Reversal (.63) and Segmentation (.34), with Number Series (.45) loading interpreted as a chance finding. An interesting discovery was the Gr-FP factor, characterized by the pairing of Rapid Phoneme Naming (fluency in retrieving and pronouncing phonemes from graphemes) and Sound Blending (hearing and blending phonemes). Both tests require efficient phoneme processing and retrieval, representing a combination not currently recognized in the CHC taxonomy (Schneider & McGrew, 2018).
Three tests demonstrated notably high uniqueness values, indicating substantial variance not explained by identified factors. Symbol Inhibition showed the least shared variance (.61) with other WJ V tests, followed by Rapid Picture Naming (.59) and Oral Language Samples (.55). These patterns were consistent across analytical methods, with Symbol Inhibition being the last to join the Gs grouping in cluster analysis, Rapid Phoneme Naming showing spatial distance in multidimensional scaling results, and Oral Language Samples not fitting clearly into any multidimensional scaling grouping (LaForte et al., 2025).
The Set B factor analysis identified four clear broad factors: Grw, Gc, Gq, and Gs. Tests with the highest uniqueness included Oral Language Samples (.62), Reading Recall (.57), and Sentence Writing Fluency (.57). The uniqueness of Reading Recall likely stems from its shared measurement methodology and Meaningful Memory (Gl:MM) construct variance with Story Recall. The uniqueness of Sentence Writing Fluency was evident in its spatial separation from other speed tests in multidimensional scaling and its late grouping with Rapid Picture Naming in cluster analysis results (LaForte et al., 2025).
Psychometric Network Analysis (PNA), Exploratory Graph Analysis (EGA)
The WJ V authors included PNA-EGA as a special supplementary approach within their comprehensive exploratory structural analyses (Laforte et al., 2025, p. 240). Recently, PNA methods and network-based cognitive ability models, including process overlap theory (POT) and dynamic mutualism, have emerged as alternatives to traditional factor-analytic approaches for identifying dimensional structures in cognitive and achievement variables (Laforte et al., p. 251; see McGrew, 2023; McGrew et al., 2023). The WJ V Technical Manual (Laforte et al.) appears to be the first to include PNA-EGA.
In PNA, individual tests are represented as nodes within a multidimensional visual graphic network (see Figure 1 for an illustration). In Figure 1, the nodes (circles) are labeled with narrow ability codes, representing what each test measures. Connections between nodes, depicted as lines in Figure 1, are called edges and represent statistical estimates (partial correlation coefficients) of the strength of nondirectional relationships between test pairs. Thicker edges indicate stronger associations. For example, in Figure 1, the lines connecting the RG, RQ, and I nodes are thicker than the lines connecting these nodes to all other nodes, indicating a strong association between these Gf nodes. Significant pairwise partial correlations estimate node relations conditionally, with variance from all other tests statistically removed to ensure edge weights remain independent of other test relationships (Hevey, 2018). Illustrative psychometric network analysis showing hypothetical relationships between cognitive Tests. Note: Wc = Working Memory; Wa = Auditory Short-term Storage; Wv = Visual Short-Term Storage; AC = Attentional Control; K0 = General Information; VL = Vocabulary; CM = Communication Abilities; MY = Grammatical Sensitivity; RG = General Sequential Reasoning; RQ = Quantitative Reasoning; I = Induction; NA = Naming Facility; Pc = Perceptual Speed Compare; Ps = Perceptual Speed Search. Claude (Anthropic). (2025, June 19). Cognitive abilities network analysis visualization [Interactive data visualization]. Generated in response to the user's request for psychometric network analysis of four cognitive domains. Crystallized Knowledge/Gc (red), Fluid Reasoning/Gf (orange), Working Memory/Gwm (green), and Processing Speed/Gs (purple). Thicker edges indicate stronger partial correlations.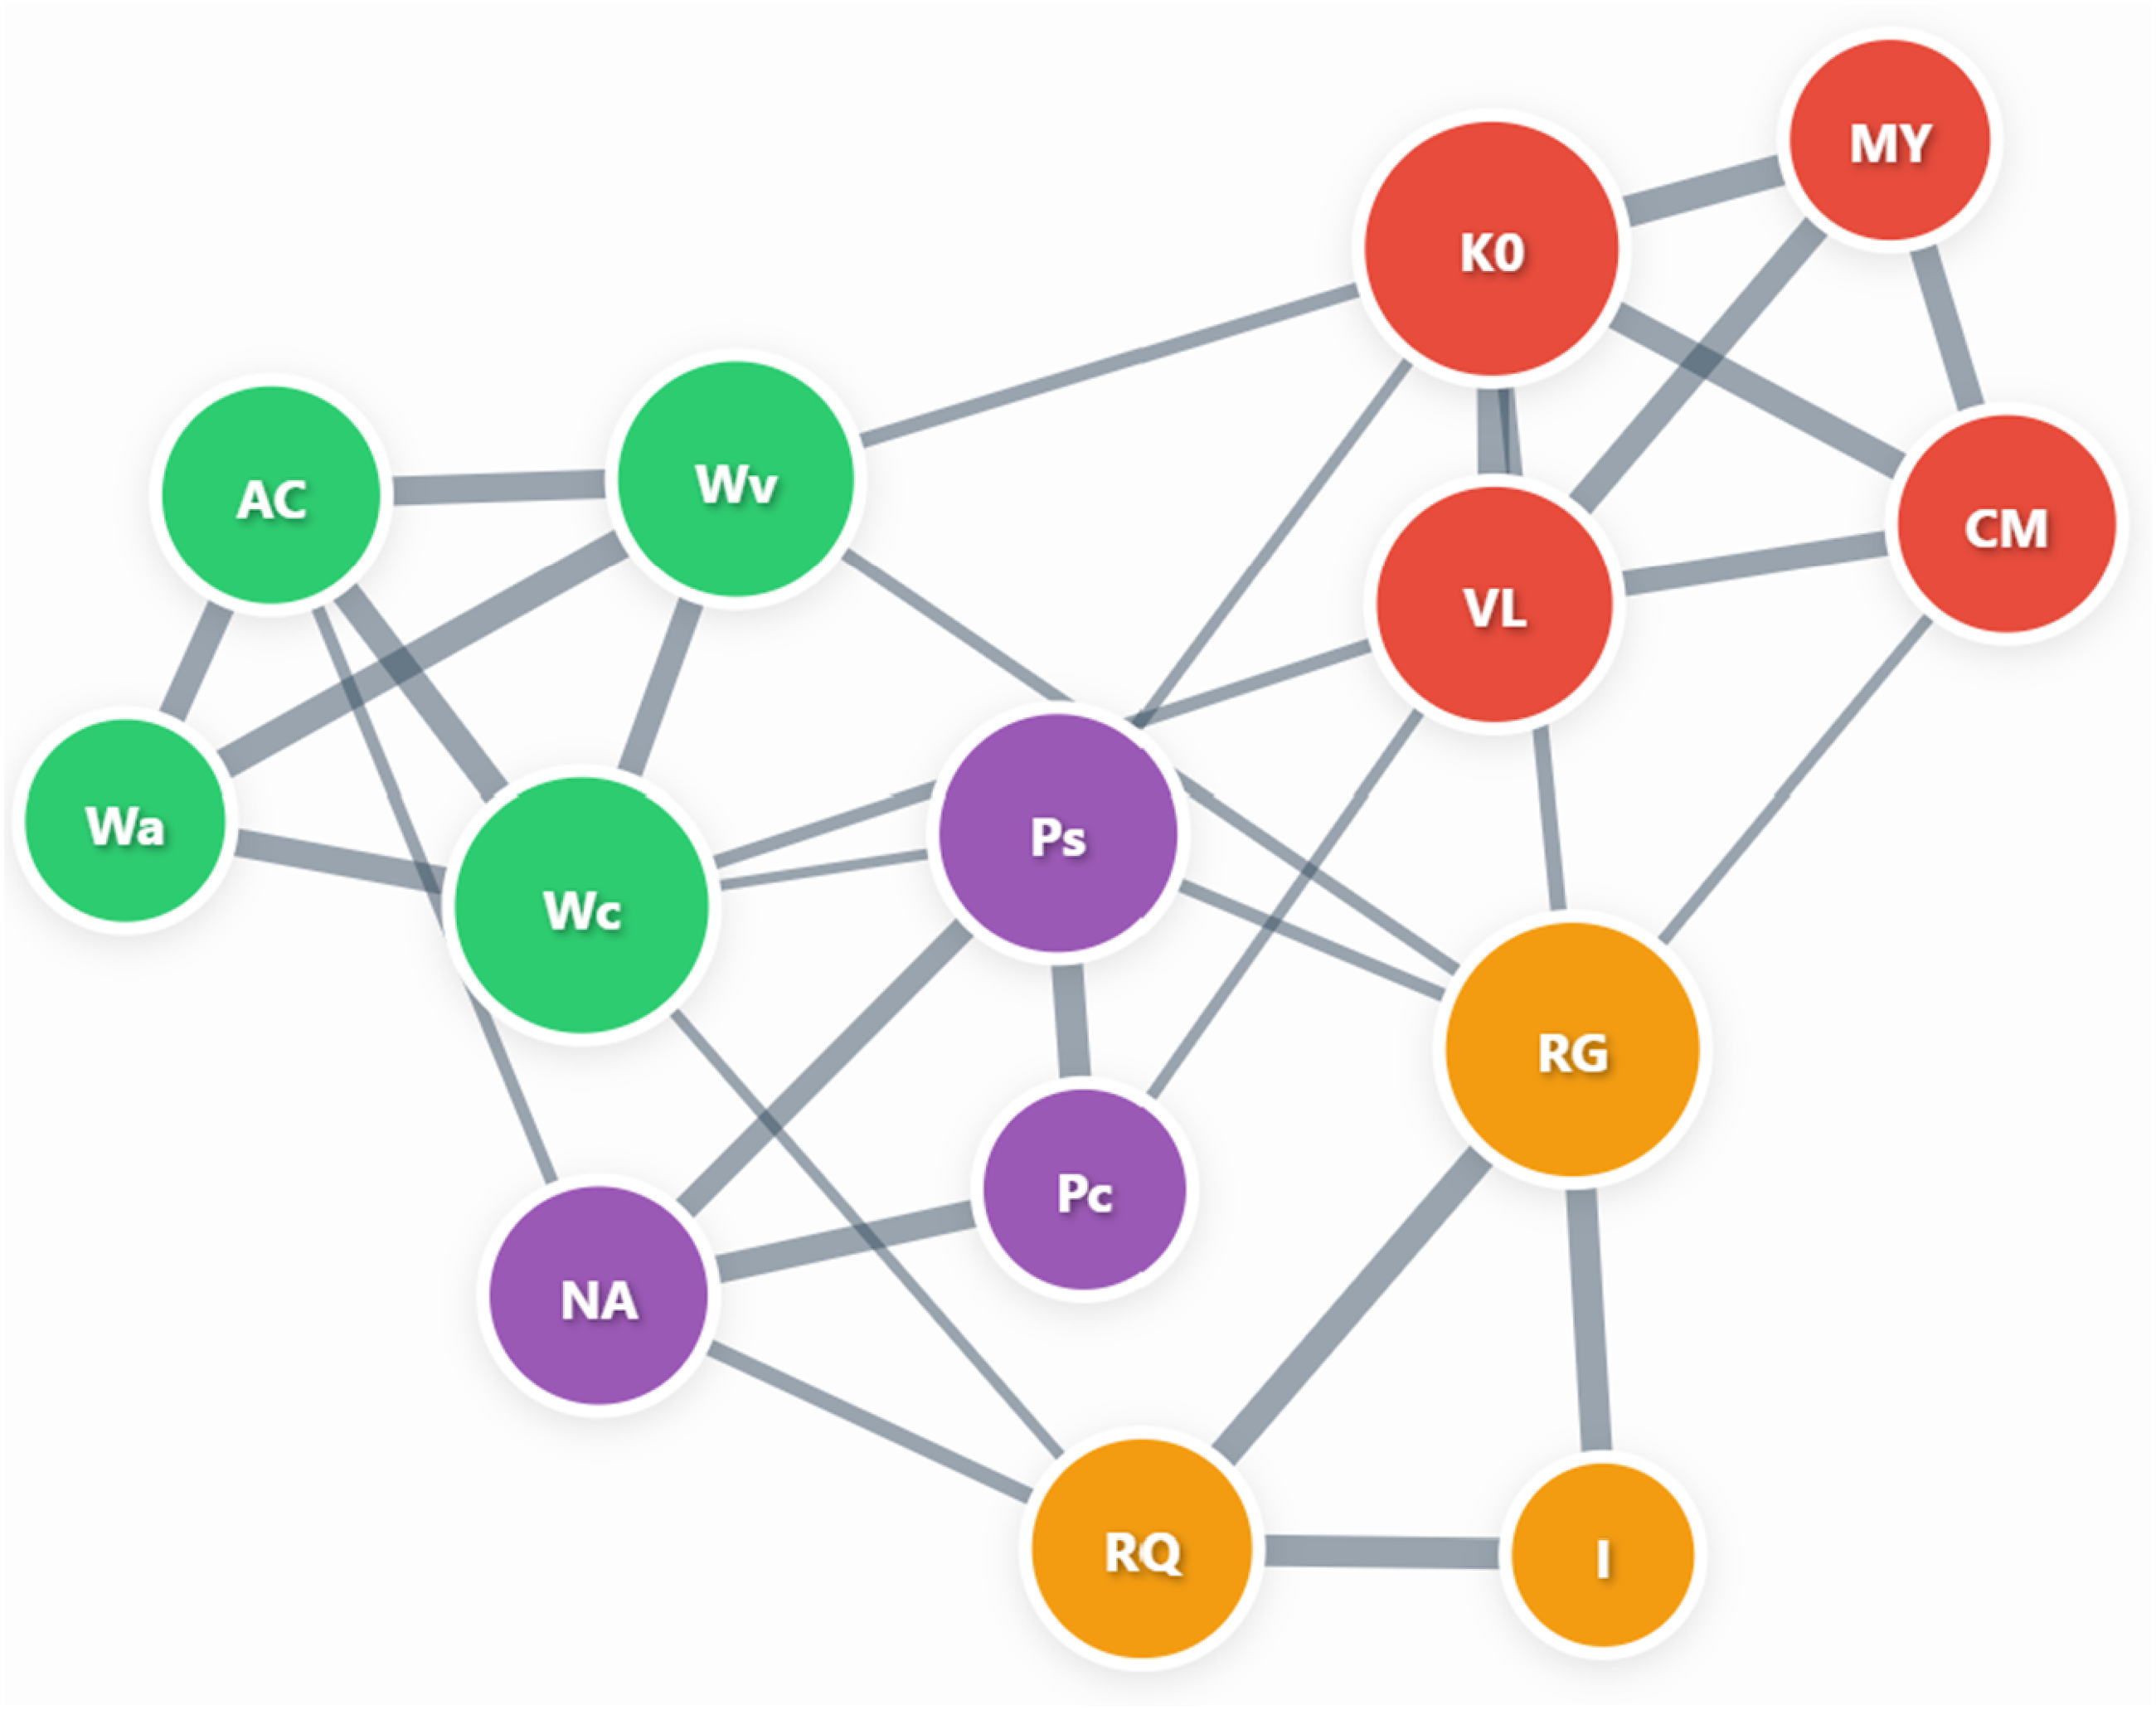
Network topography can be evaluated using network science tools (Borsboom et al., 2021; Bulut et al., 2021; Jones et al., 2018; Neal & Neal, 2021; Robinaugh et al., 2016; cf. Laforte et al., 2025, p. 252), including various centrality metrics such as closeness, betweenness, and strength—metrics that are fundamental to understanding the functional importance and clinical relevance of nodes within psychometric networks (Borgatti, 2005; Hevey, 2018). For example, Figure 1 shows the PNA results of a hypothetical battery of cognitive tests. The largest nodes in PNA (such as K0, RG, and Wc in Figure 1) represent core cognitive abilities that are most central or influential in the overall network structure. PNA methods have expanded to include exploratory graph analysis (EGA), which is used to determine the number of underlying factors or dimensions present in the data. For example, the illustration in Figure 2 shows that an EGA analysis of the hypothetical battery of cognitive tests identified four distinct dimensions with high modularity (or well-defined groups of nodes), suggesting a robust four-factor structure underlying the hypothetical cognitive battery. While PNA and EGA produce visually similar network plots with nodes, edges, and color-coded groupings, they serve fundamentally different analytical purposes. The PNA visualization (Figure 1) emphasizes individual node centrality and connectivity patterns to identify the most influential variables in the network. In contrast, the EGA visualization (Figure 2) emphasizes community detection to determine the dimensional structure of an instrument. Although the visual representations appear similar, the former addresses questions about variable importance, while the latter addresses questions about factor structure (Golino & Epskamp, 2017). Illustrative Exploratory Graph Analysis (EGA) of a hypothetical cognitive abilities network showing four detected dimensions. Note: Wc = Working Memory; Wa = Auditory Short-Term Storage; Wv = Visual Short-Term Storage; AC = Attentional Control; K0 = General Information; VL = Vocabulary; CM = Communication Abilities; MY = Grammatical Sensitivity; RG = General Sequential Reasoning; RQ = Quantitative Reasoning; I = Induction; NA = Naming Facility; Pc = Perceptual Speed Compare; Ps = Perceptual Speed Search. Network estimation was performed using the Graphical LASSO (GLASSO) method with Extended Bayesian Information Criterion (EBIC) model selection, followed by the Walktrap community detection algorithm. Nodes represent cognitive tests, edges represent partial correlations, and colors indicate detected communities: Crystallized Knowledge/Gc (red), Fluid Reasoning/Gf (orange), Working Memory/Gwm (green), and Processing Speed/Gs (purple). Thicker edges indicate stronger partial correlations within communities, while thinner edges show weaker between-community connections. Modularity = .85. Claude (Anthropic). (2025, June 19). Exploratory graph analysis visualization of cognitive abilities [Interactive data visualization]. Generated in response to the user's request for EGA dimensional analysis of four cognitive domains.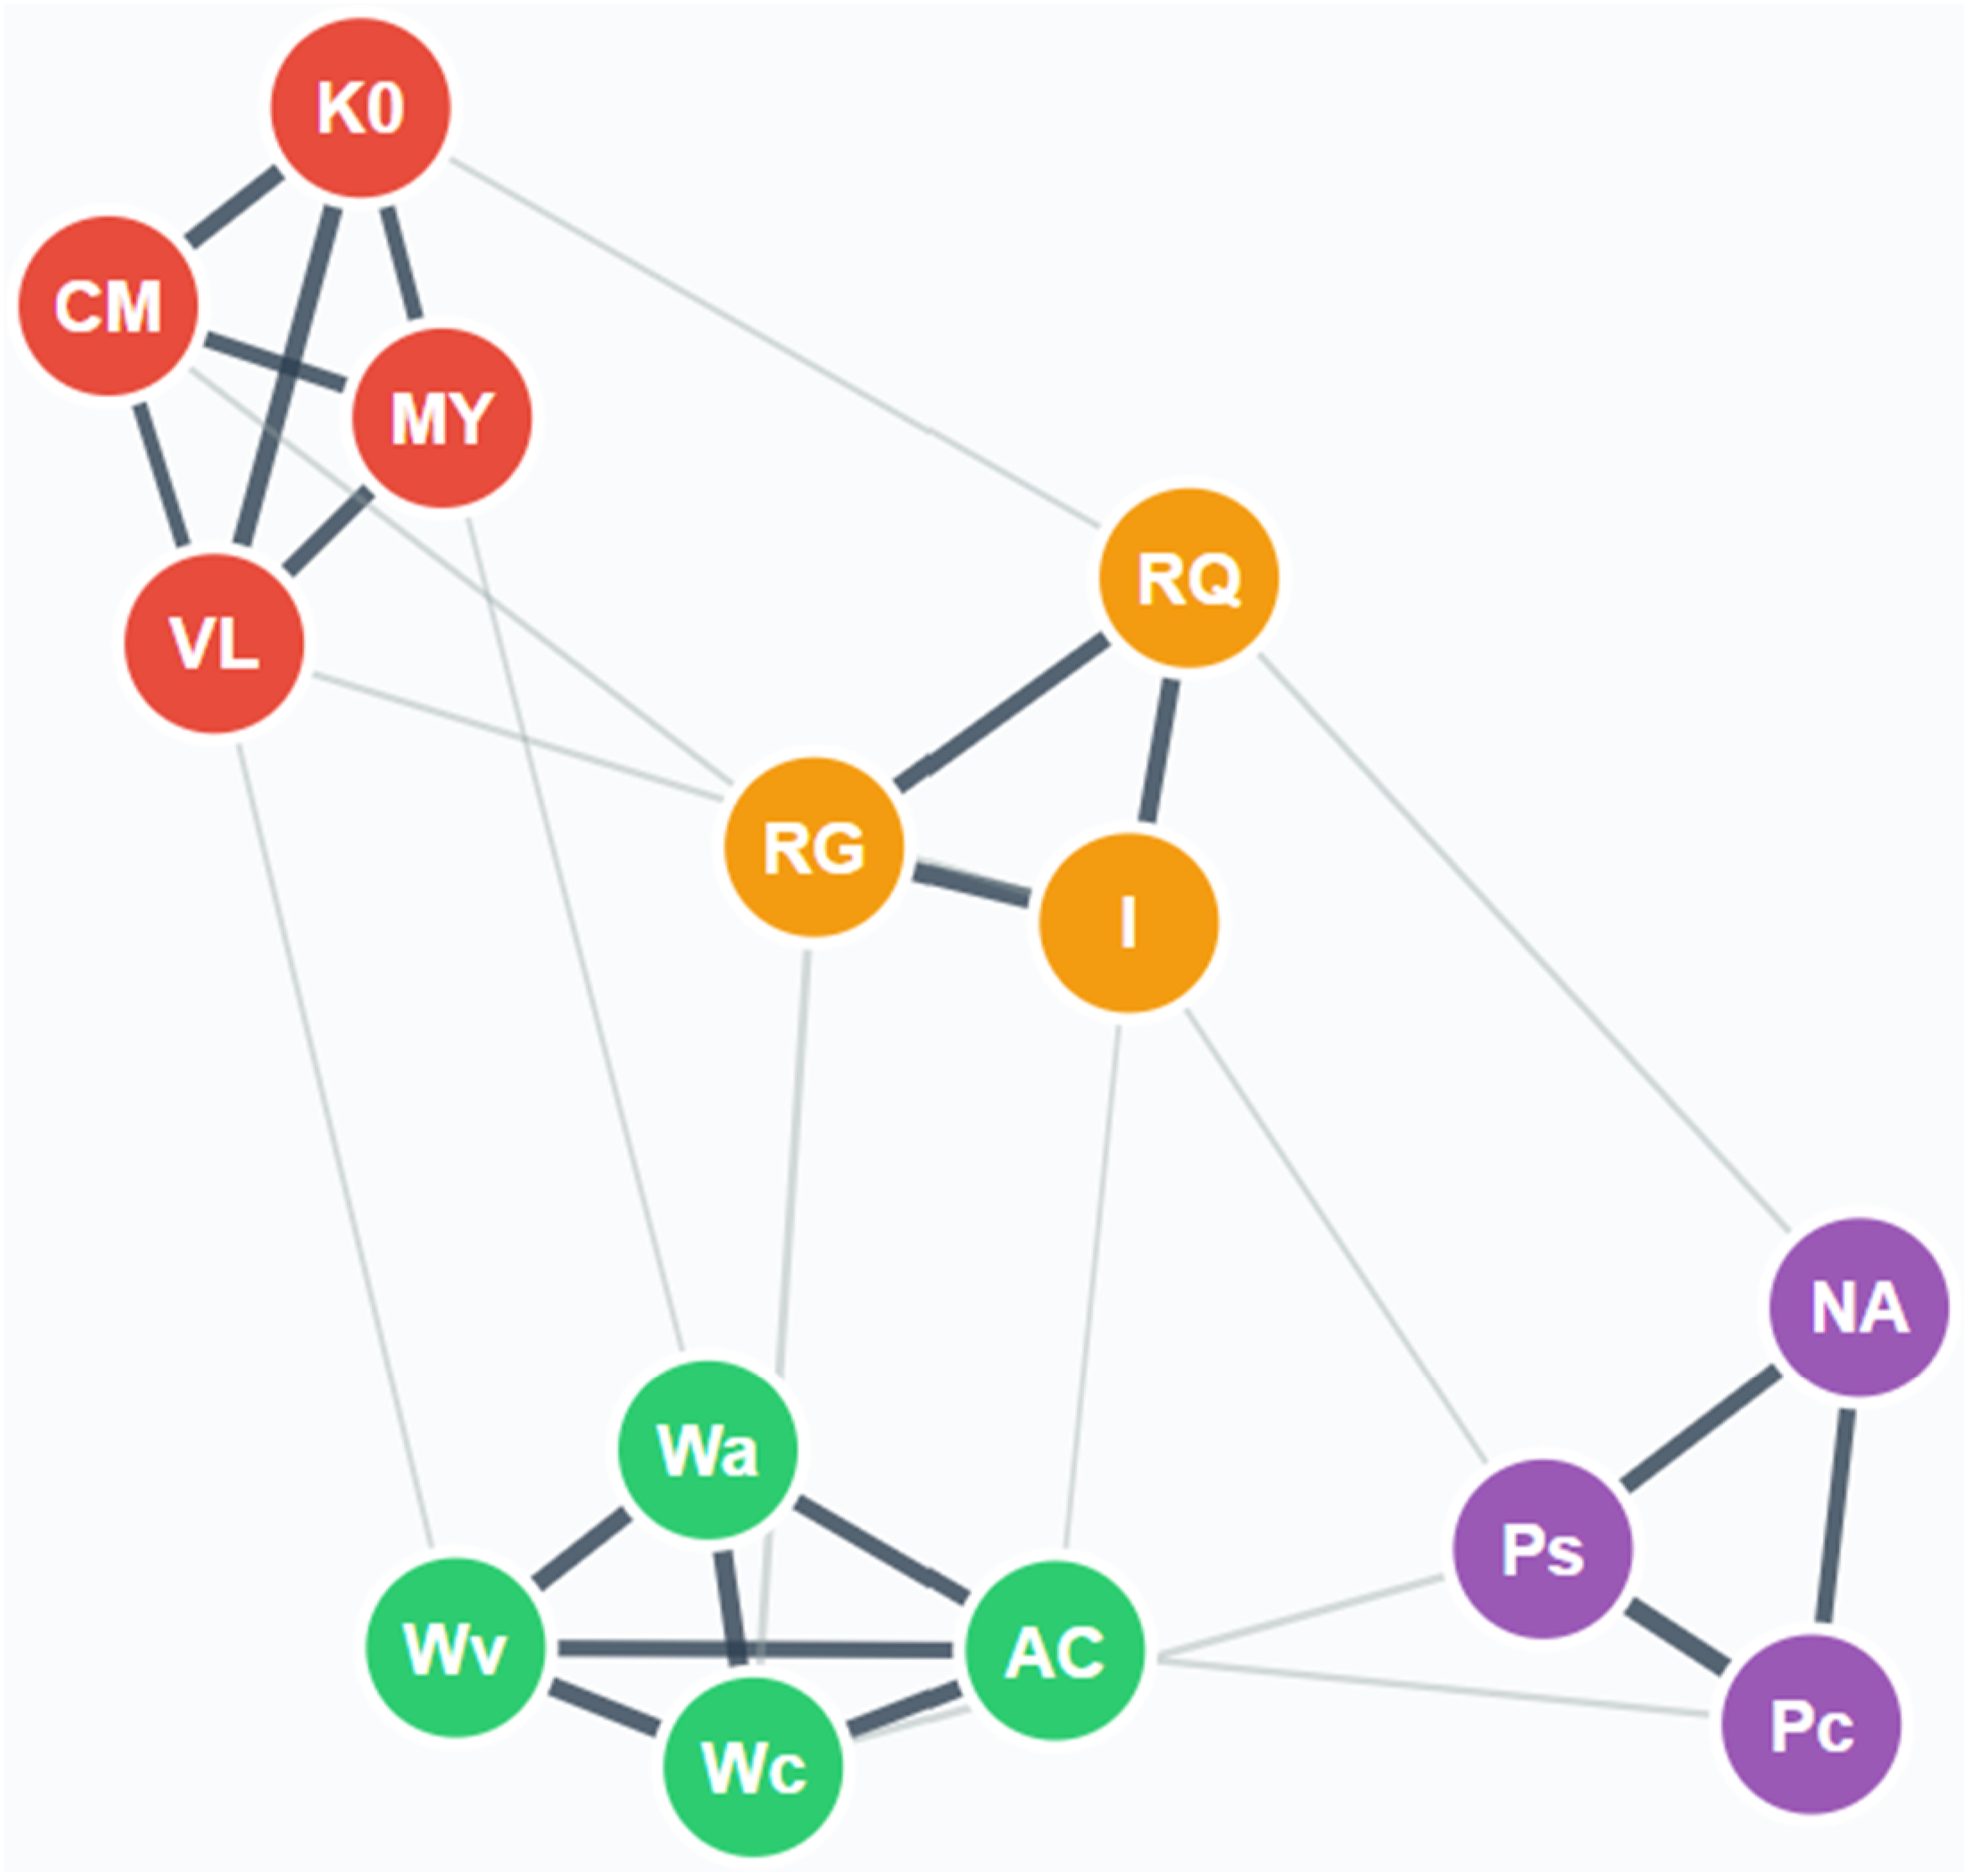
The hierarchical EGA results for the WJ V identified first-order CHC community dimensions, including Gf, Gq, Gv, Gs, Gr, Gwm-Wa, Gwm-Wc, Wa, Grw-application, and Gs/Gr-NA. These results are generally consistent with findings from traditional exploratory structural analysis. Notably, two differences emerged. Grw-skills merged with Ga tests to form a community, while Gc and Gl tests formed a general, semantically meaningful verbal abilities dimension (LaForte et al., 2025). EGA analysis also identified a speed of reasoning (Gs-RE) community that consistently appeared across four primary age groups, prompting its inclusion in the CHC taxonomy. Speed of reasoning is defined as the ability to perform reasoning tasks within time limits (LaForte et al., 2025, p. 257), as exemplified by tests that require fluent semantic processing and reasoning-based decision-making (i.e., Sentence Reading Fluency, Symbol Inhibition, and Word Reading Fluency).
The higher-order community structure suggested three dimensions: cognitive processes, cognitive speed/fluency, and cognitive working memory. A robust differentiation between cognitive level and speed abilities appeared across all age-differentiated samples, supporting Schneider and McGrew’s (2018) suggestion that cognitive processing speed may represent a higher-order taxonomy equivalent to psychometric g. Edge weight patterns between speed-related dimensions indicated core elements of this g-speed dimension, suggesting the need to explore alternative higher-order dimensional structures beyond traditional single psychometric g models (LaForte et al., 2025, p. 257).
The exploratory analyses resulted in strong evidence for 10 broad cognitive abilities (Gc, Gf, Gv, Ga, Gl, Gr, Gwm, Gs, Grw, and Gq). They also revealed narrow ability substructures within broader domains. For example, within the Gwm domain, two narrow substructures were identified: Gwm-Wa (Auditory Short-Term Storage) and Gwm-Wc (Working Memory Capacity with Attentional Control). Another example occurred within the Gs domain, where three substructures were identified: Gs-Cognitive (speed on cognitive tasks, such as Number-Pattern Matching), Gs-Achievement (speed on academic tasks, such as Math Facts Fluency), and Gs/Gr-NA (Naming Facility; defined by rapid automatized naming tasks). These substructures are clinically important because they help pinpoint a problem more precisely, leading to more targeted interventions. One of the most significant findings of the Stage 2 analyses was the consistent patterns observed across age groups and analytic methods (Laforte et al., 2025).
Cross-Validation Confirmatory Analysis
The most plausible and best-fitting CHC models emerged from Stage 2 exploratory analyses. These models were called Carroll hierarchical g broad CHC model (a model with psychometric g at the apex, most closely resembling Carroll’s [1993] three-stratum theory), Carroll hierarchical g+narrow CHC model (includes narrow abilities under broad factors), and Horn no-g broad CHC model (similar to the Carroll hierarchical g broad CHC model, but there is no psychometric g factor). The Carroll hierarchical g broad CHC model and the Horn no-g broad CHC model have the same measurement models but different structural models. The WJ V authors did not evaluate a bifactor g broad CHC model, indicating that it is not consistent with their position or Woodcock’s legacy (LaForte et al., 2025, p. 271).
Confirmatory analysis was conducted at Stage 3 for cross-validation using Sample B. The WJ V authors concluded that all three models were plausible, with the Horn no-g broad CHC model considered the most parsimonious. However, the Carroll hierarchical g+narrow CHC model “offers potentially important insights regarding the structure of the WJ V battery, possibly clinically relevant interpretations, and potential new insights into CHC theories” (LaForte et al., p. 277). The confirmatory structural model cross-validation provided evidence for the “stability and generalizability of the structural validity of the WJ V measurement model operationalized as three types of CHC models” (p. 277). The WJ V effectively measures broad and narrow CHC abilities, as well as general cognitive functioning. Overall, the combination of results from the advanced and strategic methods and analyses conducted by LaForte and colleagues provides strong evidence of the validity of the WJ V.
Concurrent Validity Study
This study involved 639 participants to evaluate correlations between WJ V and other cognitive tests, including the Wechsler Adult Intelligence Scale–Fourth Edition (WAIS-IV; Wechsler, 2008), Wechsler Intelligence Scale for Children–Fifth Edition (WISC-V; Wechsler, 2014), Wechsler Preschool and Primary Scale of Intelligence–Fourth Edition (WPPSI-IV; Wechsler, 2012), Kaufman Assessment Battery for Children–Second Edition Normative Update (KABC-II NU; Kaufman et al., 2018), Reynolds Intellectual Assessment Scales–Second Edition (RIAS-2; Reynolds & Kamphaus, 2015), Comprehensive Test of Phonological Processing–Second Edition (CTOPP-2; Wagner et al., 2013), Rapid Automatized Naming and Rapid Alternating Stimulus Tests (RAN/RAS; Wolf & Denckla, 2005), Mini-Mental Status Examination–Second Edition (MMSE-2; Folstein et al., 2010), Dementia Rating Scale–Second Edition (DRS-2; Jurica et al., 2001), Kaufman Tests of Educational Achievement–Third Edition (KTEA-3; Kaufman & Kaufman, 2014), and Wechsler Individual Achievement Test–Fourth Edition (WIAT-4; NCS Pearson, 2020)—the sampling aimed to include 100 participants for WAIS-IV and WISC-V, and 50 for others. The study ensured diversity, with 70% White, 12% Black, and 19% Hispanic participants, though geographic representation varied (LaForte et al., 2025, p. 136).
According to LaForte and colleagues (2025), the WJ V demonstrates moderate to strong concurrent validity with various tests, thereby affirming its reliability in measuring cognitive abilities, academic achievement, and specific language skills. High correlations (.80–.85) were found between the WJ V general intelligence clusters (GIA, Gf-Gc Composite, and BIA) and the Full Scale IQ and General Ability Index of the WAIS-IV and the Full Scale IQ of the WISC-V (correlation with the WISC-V General Ability Index was .77), as well as the Fluid-Cyrstallized and Mental Processing Indexes of the KABC-II NU (.79-.87) and confirming these clusters as valid representations of psychometric g across age groups. The WJ V Comprehension-Knowledge (Gc) cluster also showed high correlations (.86, .81, .78, respectively) with the Verbal Comprehension Index of the WAIS-IV and WISC-V, and the Knowledge/Gc Index of the KABC-II NU. The WJ V COG Visual Processing (Gv) cluster correlated well, but less strongly (.64) with the WISC-V Visual-Spatial Index, and KABC-II NU Simultaneous/Gv Index (.57). Moderate correlations were observed between the WJ V Cognitive Processing Speed (Gs) cluster and the processing speed indexes of the WAIS-IV (.52) and WISC-V (.62), indicating that these measures are capturing distinct abilities.
The WJ V auditory processing measures showed moderate correlations with CTOPP-2 phonological processing measures (CTOPP-2: Phonological Awareness Composite, .60; Alternate Phonological Awareness Composite, r = .56; Phonological Memory Composite, r = .45), and the WJ V Rapid Automatic Naming measures correlated moderately with CTOPP-2 RAN/RAS measures (CTOPP-2: Rapid Symbolic Naming Composite, r = .69 −.75), supporting shared constructs in auditory and processing speed abilities. Furthermore, the WJ V GIA cluster demonstrated moderate correlations with MMSE-2 (Extended Version, r = .52) and DRS-2 (Total Score, r = .46), indicating its effectiveness in identifying mild cognitive impairment. WJ V clusters, like Retrieval Fluency (Gr) and Long-Term Storage (Gl), showed moderate correlations (.58–.63) with the WAIS-IV Verbal Comprehension Index (Gc), whereas the Phonemic Retrieval Fluency (Gr) cluster had low correlations (.17–.48) with WAIS-IV indexes, emphasizing its capacity to assess distinct abilities. Although only highlights of the concurrent validity results are presented here, it is clear from the evidence presented in the technical manual (LaForte et al., 2025) that substantial evidence supports the validity of the WJ V across numerous cognitive, achievement, and language domains, establishing it as a strong assessment battery.
Clinical Validity Study
The clinical validity study assessed WJ V scores among 369 K-12 students with classifications such as giftedness, intellectual disability (ID), specific learning disabilities in reading, writing, or math (SLD-reading, SLD-writing, SLD-math), language impairment, attention deficit/hyperactivity disorder (ADHD), and autism spectrum disorder (ASD). Eleven core tests were used, with additional tests for diagnostic relevance. Target sizes were 75 for the gifted, ID, and SLD groups, and 50 for all other groups. Participants were predominantly White (68%–88%) and non-Hispanic (65%–92%), with high parental education (pp. 138–139). These data are important for establishing validity and guiding assessments and interventions, though the small sample sizes and lack of consideration for within-group heterogeneity may affect generalizability.
In the gifted group, participants demonstrated the highest scores on the Gf-Gc composite (mean standard score of 116) and Fluid Reasoning (Gf) cluster (mean standard score of 116.6). The majority of mean scores for this group fell in the high average range (i.e., 110–115), which does not warrant the identification of intellectual giftedness under specific conceptualizations. For example, a widely accepted criterion defines intellectually gifted individuals as those scoring at or above the 98th percentile on standardized intelligence tests, typically equating to an Intelligence Quotient (IQ) score of 130 or higher (Rinn and colleagues, 2022). In contrast, the ID group, as expected, demonstrated significantly lower scores. For example, the ID group had a mean GIA cluster of 58.9, which is 54 points lower than the gifted group’s GIA. Overall, the ID group’s mean scores on the WJ V general ability clusters (GIA, BIA, and Gf-Gc Composite) fall in the ID range according to widely accepted criteria (e.g., Schalock et al., 2021).
The ADHD group primarily exhibited average cognitive scores, with a mean GIA cluster of 95.8. The Academic Skills/Brief Achievement cluster was slightly lower but within the average range at 90.9. Most cognitive cluster scores for this group fell within the average range, except the RAN–Math cluster, which was 88.7. Furthermore, the newly added WJ V COG Symbol Inhibition test, a measure of Gs (but involves the executive functions of shifting and inhibiting), yielded a similar mean score of 88.6 (LaForte et al., 2025, p. 339). These findings are consistent with the findings of a meta-analysis that reviewed various cognitive deficits associated with ADHD, including processing speed and RAN tasks (Willcutt et al., 2005).
For the SLD groups, the SLD–Reading group had mean scores for the Brief Reading and Basic Reading Skills clusters of 78.8 and 78.5, respectively, and a mean GIA of 85.1. The SLD–Writing group had mean scores of 77.3 and 78.9 for the Basic Writing Skills and Spelling Skills clusters, respectively, and a mean GIA of 84.3. The SLD-Reading and SLD-Writing groups had similar mean scores for all tests they shared in common, except the Verbal Attention test, for which the writing group scored lower (79.2 versus 84.8). The SLD–Math group had a mean score of 77.5 for the Brief Math cluster and a mean score of 77.2 for the Math Problem Solving cluster. Notably, the mean score on the new Number Sense test on the WJ V ACH battery was 78.7, suggesting that this test likely adds valuable information to evaluations of suspected SLD in math. The lowest cognitive mean score for the SLD-Math group was the Fluid Reasoning (Gf) scores of 79.7, aligning with research that links Gf abilities to math achievement. Notably, the RAN–Math score was relatively higher (89.4). Among the three SLD groups, the SLD-Math group had the lowest GIA cluster (80.3). Notwithstanding within-group heterogeneity, a common characteristic of SLD samples, and small sample sizes, the patterns of relative strengths and weaknesses observed in the data appear to support the diagnostic utility of the WJ V for SLD identification. No clear patterns were observed in either the Language Impairment group or the ASD group. Due to limitations such as non-random sampling and incomplete test administration, further research is needed to confirm the observed patterns in the SLD groups, to better understand the identification of intellectual giftedness using the WJ V, and to explore the utility of the WJ V in informing diagnoses of language impairment, ADHD, and ASD.
Interpretive Options on the WJ V
The primary purpose for cognitive testing should be to find out more about the problem, not to obtain an IQ. (Woodcock, 2002, p. 6)
Historically, an overall ability score, such as an IQ, was the primary level of interpretation for most referrals. Intelligence tests were administered primarily to obtain IQ scores. While there are some reasons for obtaining overall ability scores, they are rarely at the center of understanding learning problems and exceptionalities beyond ID and intellectual giftedness. Instead, when diagnosing neurodevelopmental disorders, for example, the focus of interpretation is generally at the broad and narrow ability levels. Lezak (1995) likened the omnipresent reporting of IQ scores to a case of “the tail wagging the dog,” stating that if we were to stop reporting IQ scores, administrators would stop requesting them (p. 22). Like Lezak, Woodcock (2002) encouraged clinicians to seek information beyond IQ to gain a deeper understanding of the problem.
Although the WJ V provides three general ability clusters, the diagnostic information comes mainly from CHC broad and narrow ability and clinical clusters. Given that the WJ V is the most extensive collection of co-normed tests currently available, it is neither practical nor wise to administer the WJ V in its entirety. It must be used flexibly, requiring the user to be referral-question-focused and goal-oriented when selecting tests from the WJ V for any individual. Effective assessment requires deliberate, individualized planning rather than routine application of standard testing protocols. For example, a child who has difficulty with reading comprehension requires a different battery of tests than a child with attention difficulties or social communication challenges. Clear referral questions help focus the evaluation on relevant domains. Other considerations are the individual’s age, developmental milestones, educational experiences, culture and language background, and response to interventions. Collectively, this information helps determine which tests are developmentally appropriate and likely to yield meaningful results. Note that a comprehensive evaluation typically covers a wide range of domains, including cognitive abilities, academic achievement, executive functioning, attention, memory, language skills, and adaptive behavior. Determining which domains to include depends on the presenting concerns, but coverage should be broad enough to identify patterns of strengths and weaknesses. The goal is to create a comprehensive yet efficient assessment that provides clear diagnostic information that guides intervention selection.
After administering a WJ V test set, Riverside Score® offers numerous options for test interpretation. The WJ V Examiner’s Manual (Mather et al., 2025c) describes four levels of interpretive information for practitioners to follow, ensuring proper interpretation of WJ V test performance. Because each level provides unique insights into test performance, they cannot be used interchangeably. Information from all four levels is necessary for a comprehensive understanding of an individual’s abilities and for planning appropriate interventions. A summary of each level of interpretation is provided below.
Level 1 Interpretation: Qualitative (Criterion-Referenced)
This level involves observing the examinee during testing and analyzing responses. After each test administration, examiners have the option to complete the Response Style and Behaviors checklist, which includes test-specific items, to gather qualitative information about the examinee that can inform score interpretation (Mather et al., 2025c, pp. 10–11). The Test Session Observations checklist, an 11-category rating scale, is also optional and appears as a prompt during the submission process for scoring and selecting reporting options in Riverside Score®. These checklists, along with observations during test sessions, provide critical context for understanding factors that may have influenced test performance. Examiners should document typical and atypical behaviors relative to the examinee’s age, completing the Response Style and Behaviors checklist after each test and the Test Session Observations checklist at the end of the session. If the session does not accurately reflect the examinee’s abilities, detailed explanations are required. This qualitative information, informed by related scales and research, can highlight factors that affect performance and provide a valuable clinical context when compared to behaviors in other environments. Information from these checklists and observations can also help predict how the examinee might respond in instructional situations. Item-level analysis may also be conducted at this level, enabling the provision of specific skill-level instructional recommendations.
Level 2: Level of Development (Norm-Referenced)
Interpretation at this level focuses on an individual’s developmental standing compared to same-age/grade peers. W scores, Age Equivalents (AE), and Grade Equivalents (GE) describe the examinee’s developmental level and form the basis for describing developmental strengths and weaknesses. This level is crucial for making initial recommendations about appropriate instructional levels and materials, as well as placement decisions based on significantly advanced or delayed development.
Despite the popularity of age-equivalent and grade-equivalent scores on standardized ability tests, they have been described historically as problematic and misleading. This is because they can create false impressions when students make careless errors on easy items while completing difficult ones, resulting in grade equivalents that poorly reflect actual functioning levels. Additional issues plague these scores. For example, they do not represent equal units (one year’s growth varies dramatically across age groups), cannot be mathematically manipulated, assume steady academic progress throughout grade levels, and are often interpolated or extrapolated. At extreme levels, they become meaningless, and the same age or grade equivalent on different tests may reflect vastly different ability levels. These scores also tend to magnify minor raw score differences into seemingly large grade-level jumps, leading to inappropriate comparisons between individuals of different ages who achieve the same equivalent score (Sattler, 2018, pp. 107–108).
The age and grade equivalents on the WJ V demonstrate superior accuracy compared to those found on other assessment batteries, due to fundamental differences in their underlying measurement scales and standardization approaches. The most critical distinction lies in the fact that many cognitive and achievement tests operate on an ordinal scale. In contrast, the WJ V utilizes an interval scale, creating differences in the precision and meaningfulness of developmental scores. Specifically, all tests on the WJ V are centered on a W score value of 500 (which approximates the average performance of a 10-year-old), creating a continuous equal-interval scale that provides more precise developmental measurement. This interval scale property means that the difference between any two consecutive points on the W Scale represents the same amount of ability change, regardless of where those points fall on the scale. For example, the difference between W scores of 480 and 490 represents the same amount of ability growth as the difference between 520 and 530. This mathematical property is crucial for creating accurate age and grade equivalents, as it enables the precise quantification of developmental progress across all ability levels.
A Comparison of Age/Grade Equivalents Derived from the WJ V Compared to Other Batteries
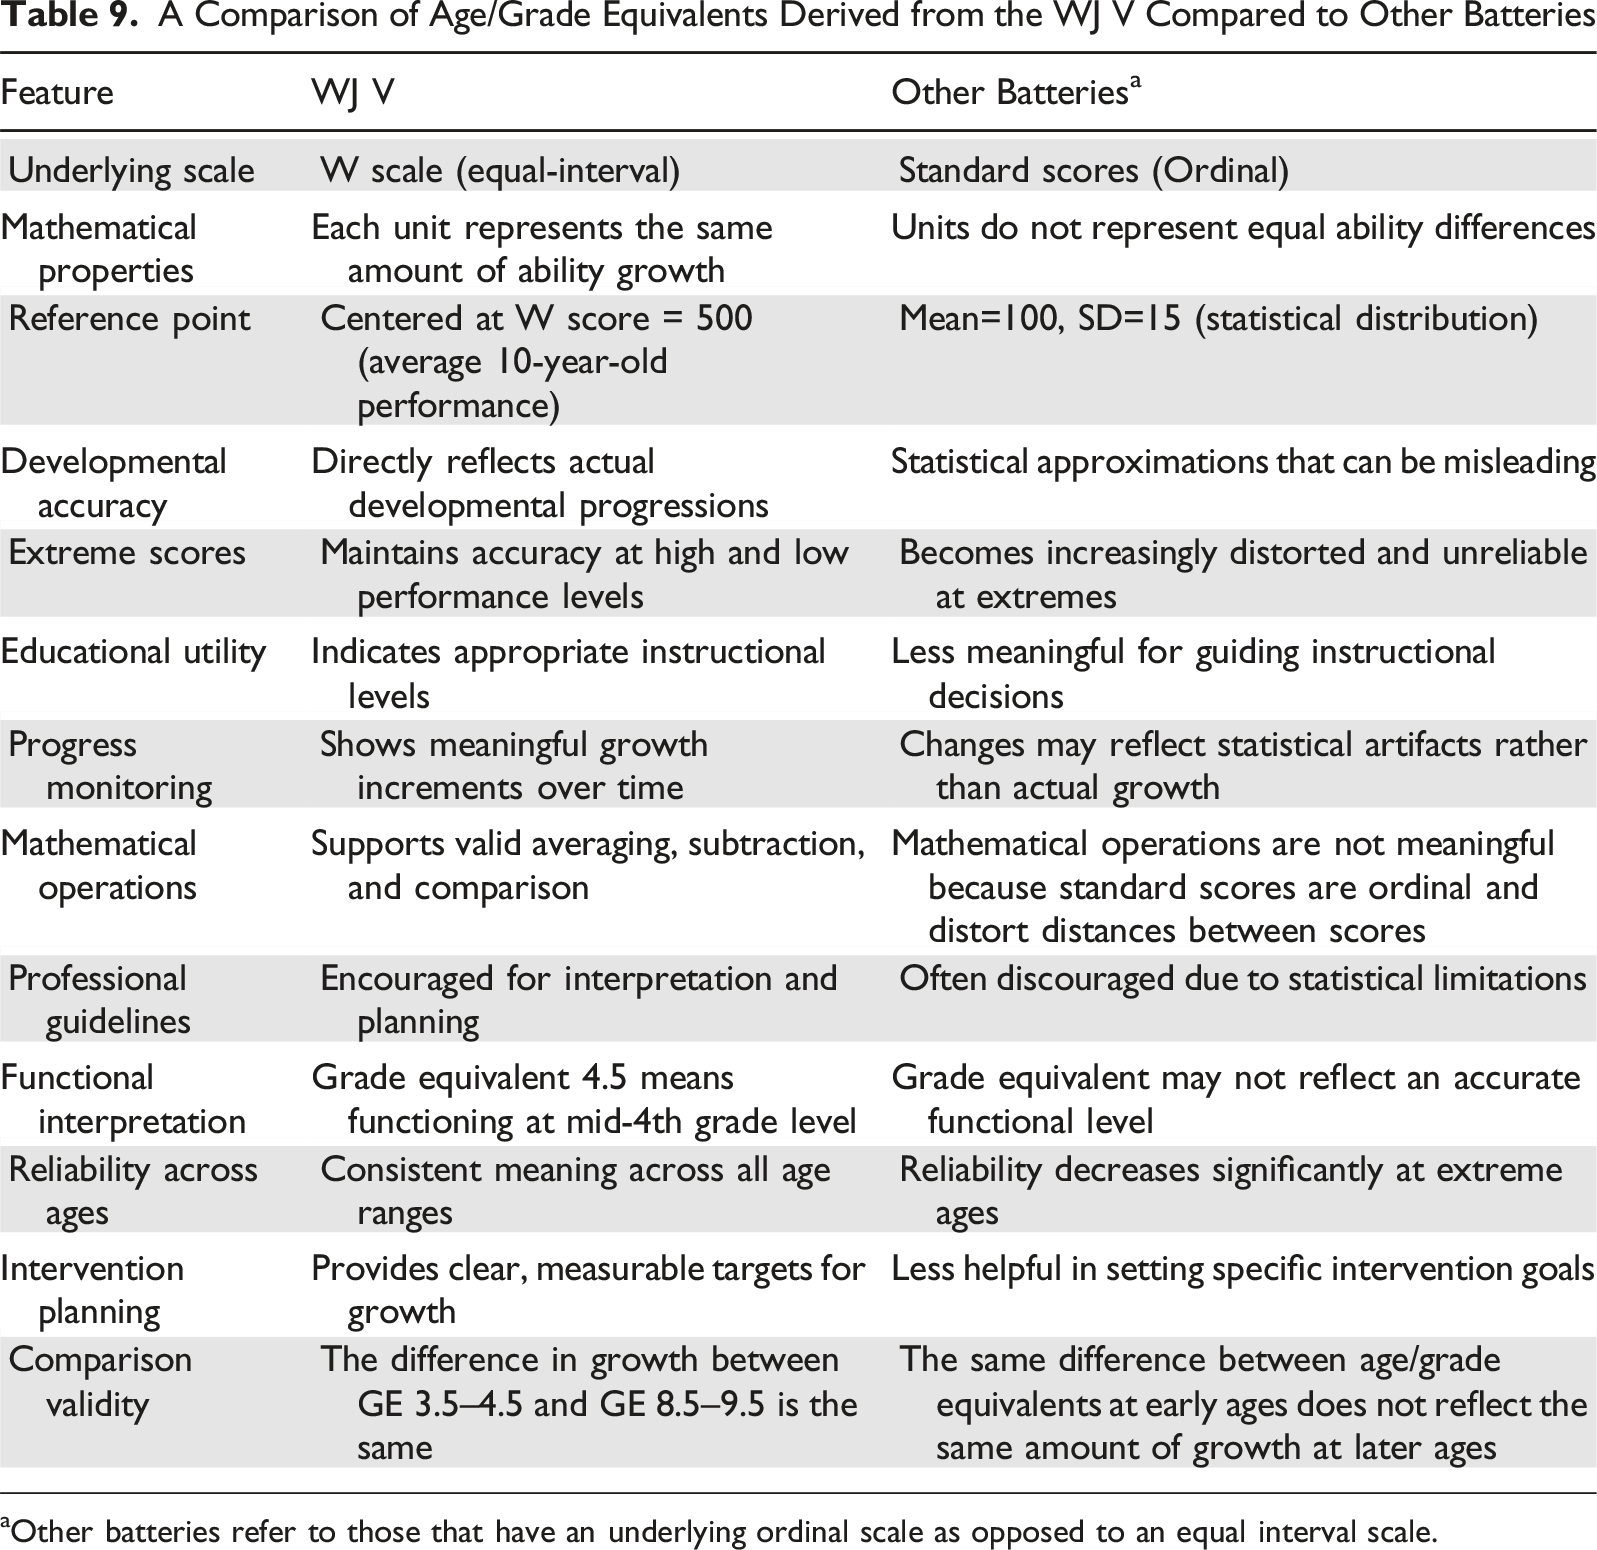
aOther batteries refer to those that have an underlying ordinal scale as opposed to an equal interval scale.
Level 3: Proficiency (Criterion-Referenced)
Several metrics, including W Difference scores, RPIs, Cognitive-Academic Language Proficiency (CALP) Levels, and Instructional/Developmental Zones, indicate how well an individual can perform tasks that are of average difficulty for their same-age or grade peers. This level helps determine the developmental range where tasks will be perceived as easy versus very difficult, making it essential for instructional planning and determining appropriate challenge levels for optimal learning.
W Score, Reference W Score, and W Difference Score
A W score is the foundational metric of the WJ V that represents an individual’s ability level on a test. It is derived from raw scores using an equal-interval scale centered on 500, which represents the average performance of 10-year-olds in the norm sample. Every test on the WJ V has a Reference W score, representing the point along the W scale at which 50% of individuals of the same age or grade succeed and 50% do not, providing a baseline for determining if someone is above, at, or below typical performance. Reference W scores are established separately for each age and grade level in the normative sample. At age 10, the Reference W score is 500. The Reference W is the comparison point against which an individual’s W score is measured, so it is akin to a “zero point” for calculating difference scores. An individual’s W score minus their same age/grade peer’s Reference W score is the W Difference Score, which can be zero, positive, or negative. See Figure 3 for an example of the application of the Reference W and W Difference scores. Examples of W Scale Development Patterns. Note: Student A has W scores that are higher than the reference W scores, indicating that she finds items at the 50% difficulty level easier than average, same-age, or grade peers. Conversely, Student B finds items at the 50% difficulty level harder than average, same-age, or grade peers.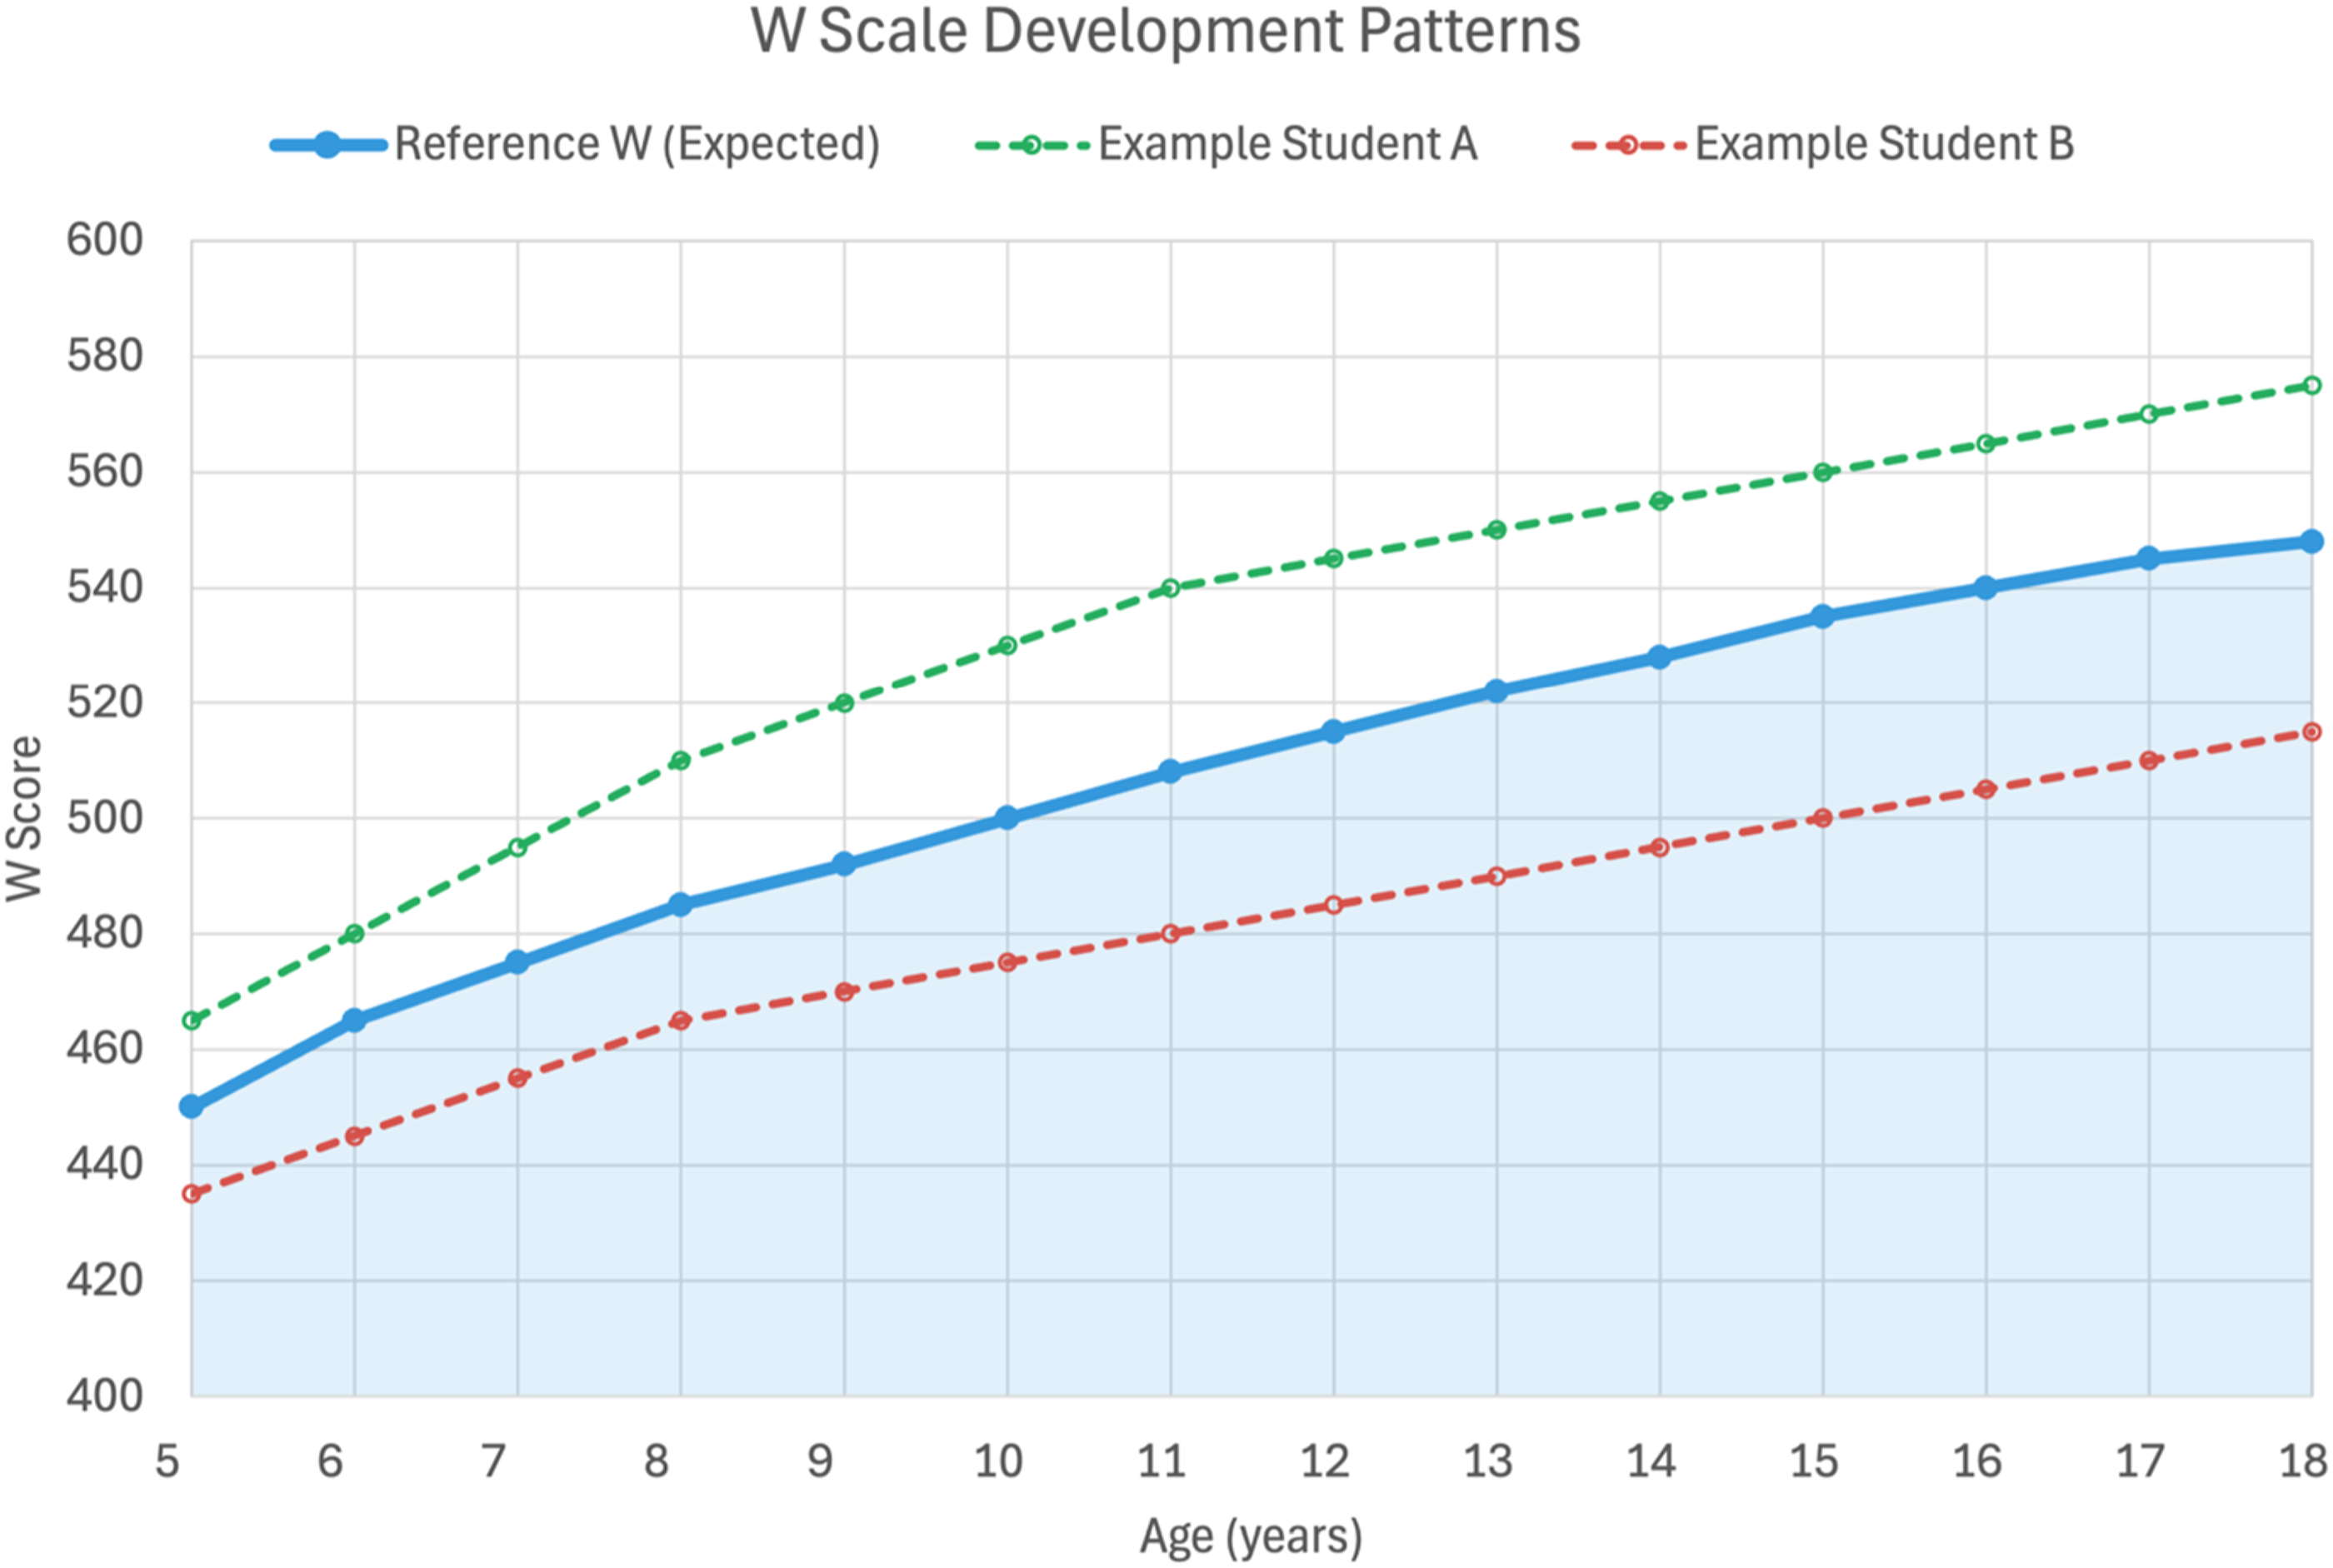
It is important to note that the Reference W score represents an optimal level of difficulty for instruction. As such, a W Difference score of zero is the point where the level of difficulty is optimal for promoting learning (referred to as an individual’s instructional level). When an individual’s W Difference is positive (e.g., +10 or higher, like Student A in Figure 3), they will find items at the 50% difficulty level for same-age peers easier than those peers do (referred to as an individual’s independent level). When an individual’s W Difference is negative (e.g., −10 or lower, like Student B in Figure 3), they will find items at the 50% difficulty level for same-age peers harder than those peers do (referred to as an individual’s frustration level).
Relative Proficiency Index
Real-World Examples of Relative Proficiency Indexes and Their Educational Implications
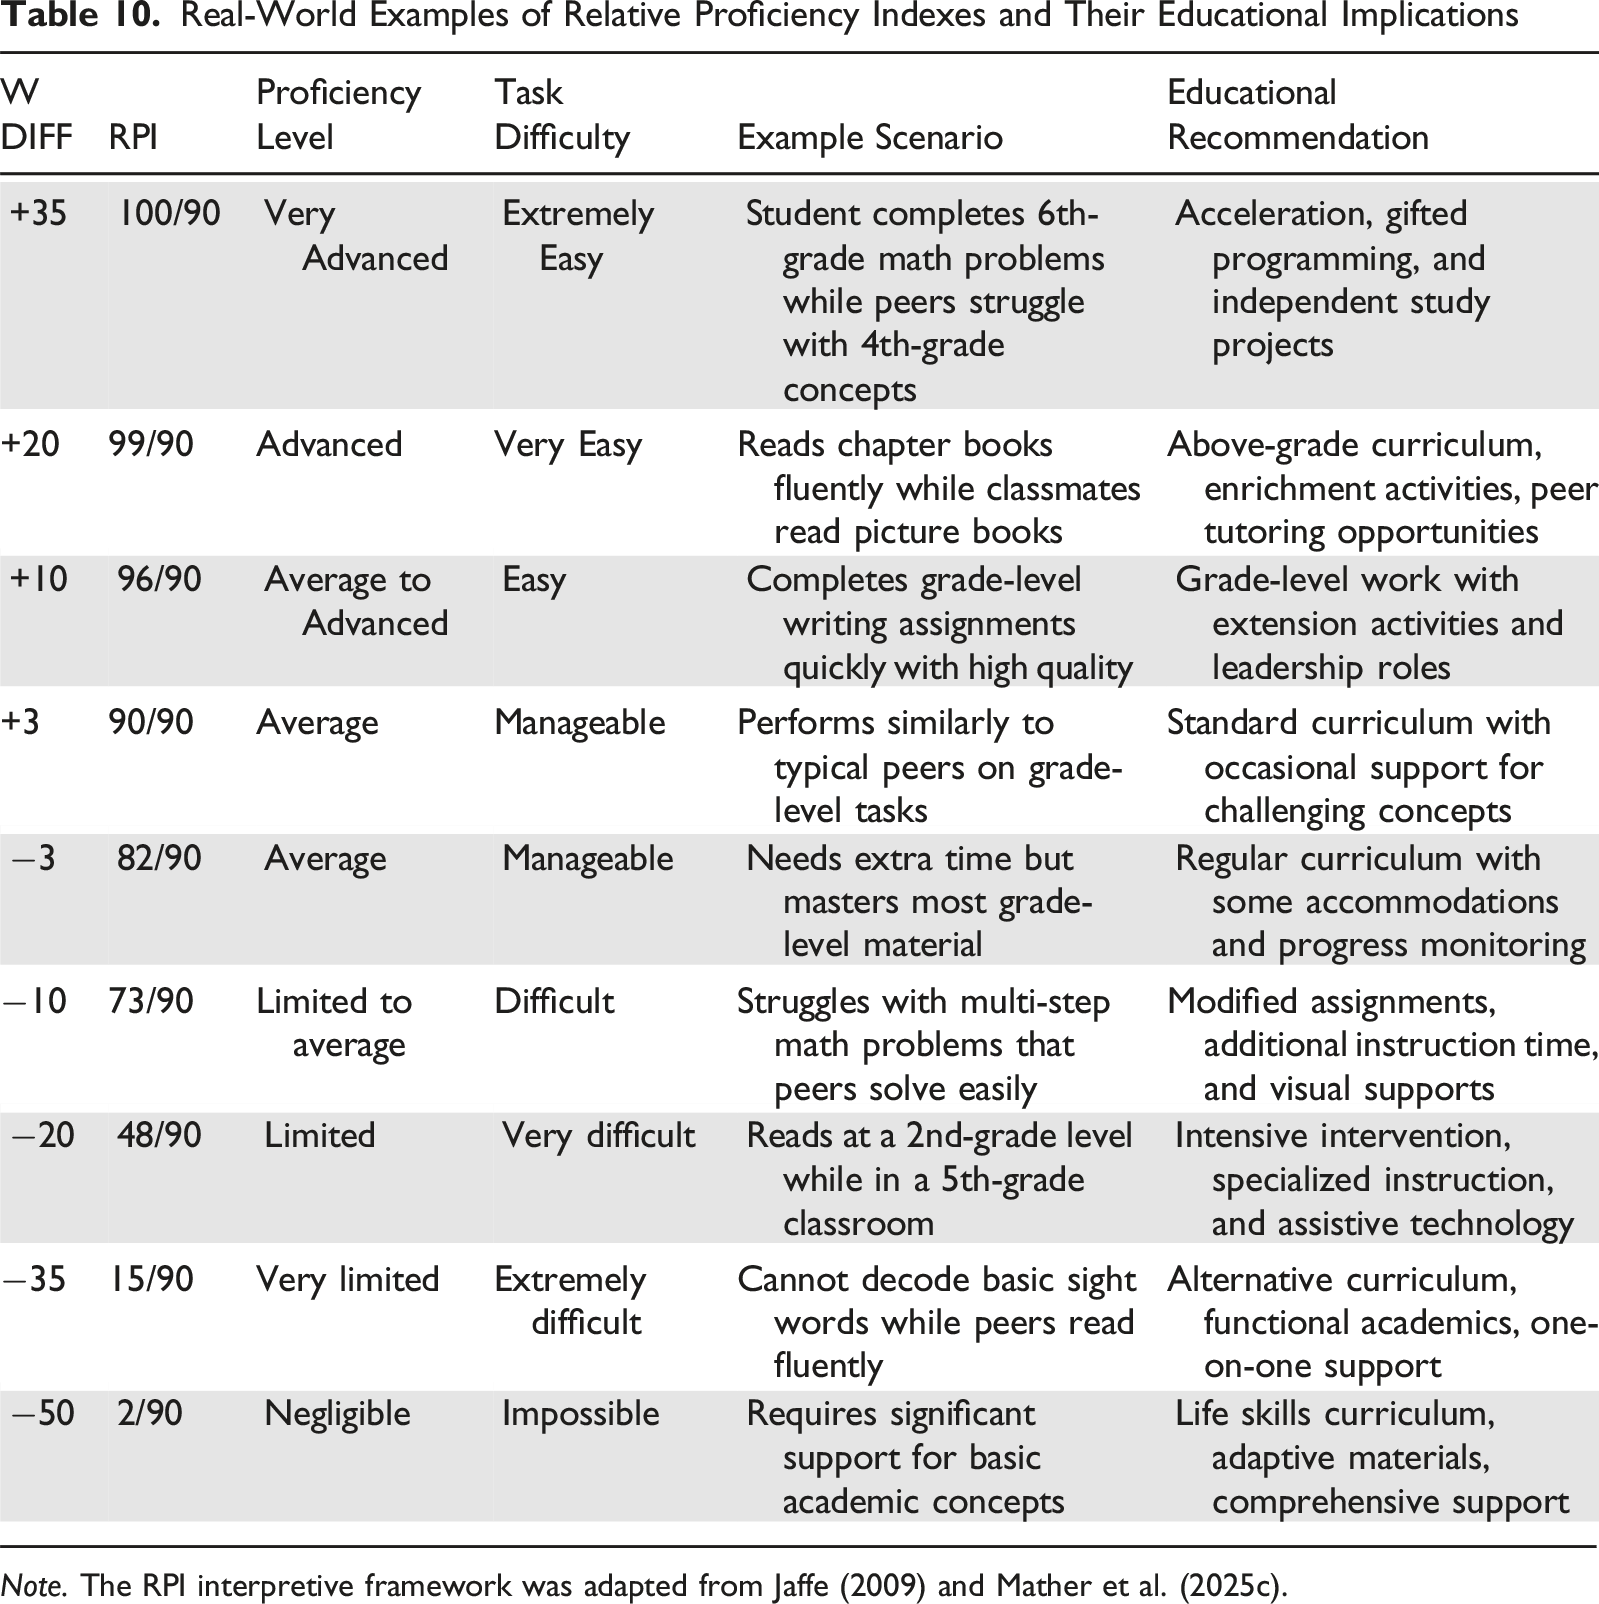
Note. The RPI interpretive framework was adapted from Jaffe (2009) and Mather et al. (2025c).
Cognitive and Academic Language Proficiency (CALP)
The WJ V provides a method for evaluating a student’s capacity to comprehend and utilize the sophisticated language demands inherent in academic settings, a concept first promoted by Cummins (1984). This scoring system operates on a six-point scale that correlates directly with a student’s ability to manage instructional content delivered in English. Students achieving the highest levels of proficiency (CALP Levels 5–6) demonstrate advanced to very advanced cognitive and academic language skills, with academic instruction presenting minimal challenge. These individuals typically find coursework extremely easy to very easy, indicating strong readiness for grade-level academic demands. Students at Level 4 exhibit fluent language proficiency, where instructional content remains manageable and accessible within their current developmental capacity (Mather et al., 2025c).
The intermediate range (CALP Levels 3–4) represents students transitioning from limited to fluent proficiency. Students at Level 3 are likely to encounter significant difficulties with standard instructional approaches, while students at Level 4 may find academic instruction challenging but not insurmountable. These students often require additional support and modified instructional strategies to access curriculum content effectively. The lower proficiency levels (CALP Levels 1–2) indicate significant challenges with academic language demands. Students at Level 2 demonstrate very limited proficiency, making standard instruction extremely difficult to navigate. Students at Level 1 face the most substantial barriers, with conventional academic instruction being nearly impossible without intensive intervention and support (Mather et al., 2025c).
The CALP levels are valuable for educational planning and can be derived from various cognitive and academic clusters, including measures of oral language, reading comprehension, and written expression. By understanding where students fall along this continuum, educators can tailor instructional approaches more effectively, select appropriate instructional materials, and provide interventions that closely align with students’ current language proficiency level. This targeted approach ultimately supports more effective learning outcomes by ensuring that academic demands align with students’ cognitive and academic language capabilities (Mather et al., 2025c).
CALP in a Broader Context and a Word of Caution
Based on Cummins’ (1979, 1980, 1984) research, he distinguished between conversational language, which he referred to as “Basic Interpersonal Communicative Skills” (BICS), and the advanced language that develops when someone attends school, which he termed “Cognitive-Academic Language Proficiency” (CALP). He noted that it takes approximately 5–7 years for CALP level proficiency to develop and that formal education is required to achieve this level of proficiency. Thus, CALP level proficiency begins to emerge at around 4th to 5th grade (ages 9–10) and continues to develop throughout one’s schooling. His research helped illustrate the fact that language, for educational purposes, does not reach a simple threshold upon the attainment of BICS, which occurs at age 3 when a child is capable of engaging in general conversation and expressing their thoughts, needs, and feelings. By age 5, children entering Kindergarten are at the advanced BICS level and ready for formal education, given that teachers can now communicate with them well enough to provide formal learning experiences, many of which are designed expressly to expand language abilities directly (e.g., reading and writing).
A potential problem with the reporting of CALP Levels on the WJ V, is that these levels are given to students for whom language development has not yet reached the point where CALP exists (Rhodes et al., 2005). If the average, monolingual English-speaking student reaches early or beginning CALP by age 9, then CALP levels do not exist for students younger than 9 (Rhodes et al.). Moreover, CALP is not a binary concept any more than BICS, which means that neither appears in a student’s development suddenly nor fully formed. Instead, both are dynamic and grow from rudimentary levels to more advanced levels, much like any other form of development. Thus, CALP does not abruptly emerge at age 9; instead, it begins to emerge at that point and then continues into an intermediate level before progressing on to advanced levels as dictated by age or grade and education. CALP levels that are reported on the WJ V are used to describe, for example, higher performance in younger children who, by definition, are not expected to have CALP. Thus, these descriptive levels have been described as misleading, albeit unintentionally (see Ortiz, 2019; Ortiz & Cehelyk, 2024, for more information).
Instructional and Developmental Zones
Instructional Zones and Developmental Zones serve different assessment purposes and are reported for different test types. Instructional Zones are explicitly associated with achievement tests and clusters, providing information about the type of academic tasks that are appropriate for instruction. These zones help educators determine what level of academic material a student can successfully engage with, given appropriate instructional support. Developmental Zones are reported for cognitive ability tests and clusters, relating to the student’s cognitive developmental level and potential for growth in cognitive abilities. These zones provide insight into the student’s cognitive readiness for learning and the types of cognitive demands that would be within their developmental capacity. The Developmental Zone framework acknowledges that cognitive abilities develop over time and that students may have different zones of readiness for various cognitive and academic tasks (Mather et al., 2025c).
Both types of zones encompass a range from 10 W units below an individual’s W ability (RPI 75/90) to 10 W units above an individual’s ability (RPI 96/90), with the lower and higher limits represented by age or grade equivalents for planning purposes. Tasks at the lower end of the range will be easy for the individual, while tasks at the higher end will be quite difficult. This technical framework provides the foundation for understanding a student’s zone of optimal challenge across different domains. These zones essentially provide a psychometric way to approximate what Vygotsky described theoretically as zones of proximal development (Vygotsky, 1978), offering concrete grade/age levels for instruction. Vygotsky’s framework guides the provision of effective support within these zones (Chaiklin, 2003).
Level 4: Relative Standing in a Group (Norm-Referenced)
The WJ V offers several types of normative scores that facilitate comprehensive interpretation of an individual’s performance relative to their age or grade peers. Standard scores are computed using a transformation of the W Difference Score (the examinee’s W score minus their same age/grade peer’s average W score), which is then transformed statistically to generate standard scores with a mean of 100 and a standard deviation of 15, allowing direct comparison with other widely-used batteries and providing familiar reference points for interpretation. Percentile ranks describe performance on a scale from 1 to 99 compared to the performance of same-age or same-grade peers in the norming sample. An examinee with a percentile rank of 80% indicates that their tested performance is better than or equal to 80% of individuals in the norm group. Importantly, standard scores and percentile ranks do not indicate proficiency or accuracy in a given domain but rather indicate relative standing in the norm group. Confidence bands around standard scores are reported to acknowledge the standard error of measurement inherent in all psychological tests and provide a range of scores within which the individual’s true score is likely to fall with a specified level of confidence (typically 68%, 90%, or 95%). Confidence intervals should always be used, as they help practitioners interpret scores more appropriately by recognizing measurement precision limitations and avoiding over-interpretation of minor score differences that may fall within the margin of error (Schneider et al., 2024).
Standard Scores and RPIs Provide Different Information
A standard score focuses on relative standing, indicating whether someone is above, at, or below average compared to peers, which is often considered in classification and special education eligibility decisions. The RPI provides instructionally relevant information about whether academic material is at an appropriate difficulty level for a student. At times, standard scores and RPIs reveal similar information. For example, the standard score represents average performance, and the RPI represents average proficiency. However, these two metrics can sometimes differ substantially, which is a function of trait variability. All tests on the WJ V have different W-score distributions with varying standard deviations, depending upon the trait being measured and the age or grade level of the individual. When the standard deviation of the W-score distribution is approximately 10, the interpretations of standard scores and RPIs will align nicely. However, when the standard deviations differ substantially from 10, a standard score may be average and an RPI may reflect Limited Proficiency or vice versa (see LaForte et al., in press, for a comprehensive discussion).
Figure 4 illustrates that the variability or standard deviation of a W-Score distribution affects standard scores, not RPIs. Two hypothetical W-score distributions are presented for sixth-grade students: one for a letter word identification test with high variability (SD = 27 W-score points) and another for a calculation test with comparatively lower variability (SD = 18 W-score points). Both distributions are centered at a hypothetical W score of 515, representing the median performance level for sixth grade (i.e., the Reference W). The visualization shows that a sixth-grade student, Joe, earned a W Difference Score (497) that was 18 points below the Reference W on both tests. Therefore, the W Difference corresponds to an RPI of 47/90 on both tests, indicating Limited Proficiency in each skill (i.e., letter-word identification and calculation). However, because the distributions have different standard deviations, the standard scores associated with a W Difference of −18 differ. In the wider distribution, Joe’s W Score of 497 is closer in proximity to the median. In the narrower distribution, his W Score, although identical, is further from the median, resulting in standard scores of 90 and 85, respectively. This is visually evident as the wider distribution has a greater density of scores in the left tail, making Joe’s position relatively less extreme. Distribution Variance Impacts Standard Score, Not RPIs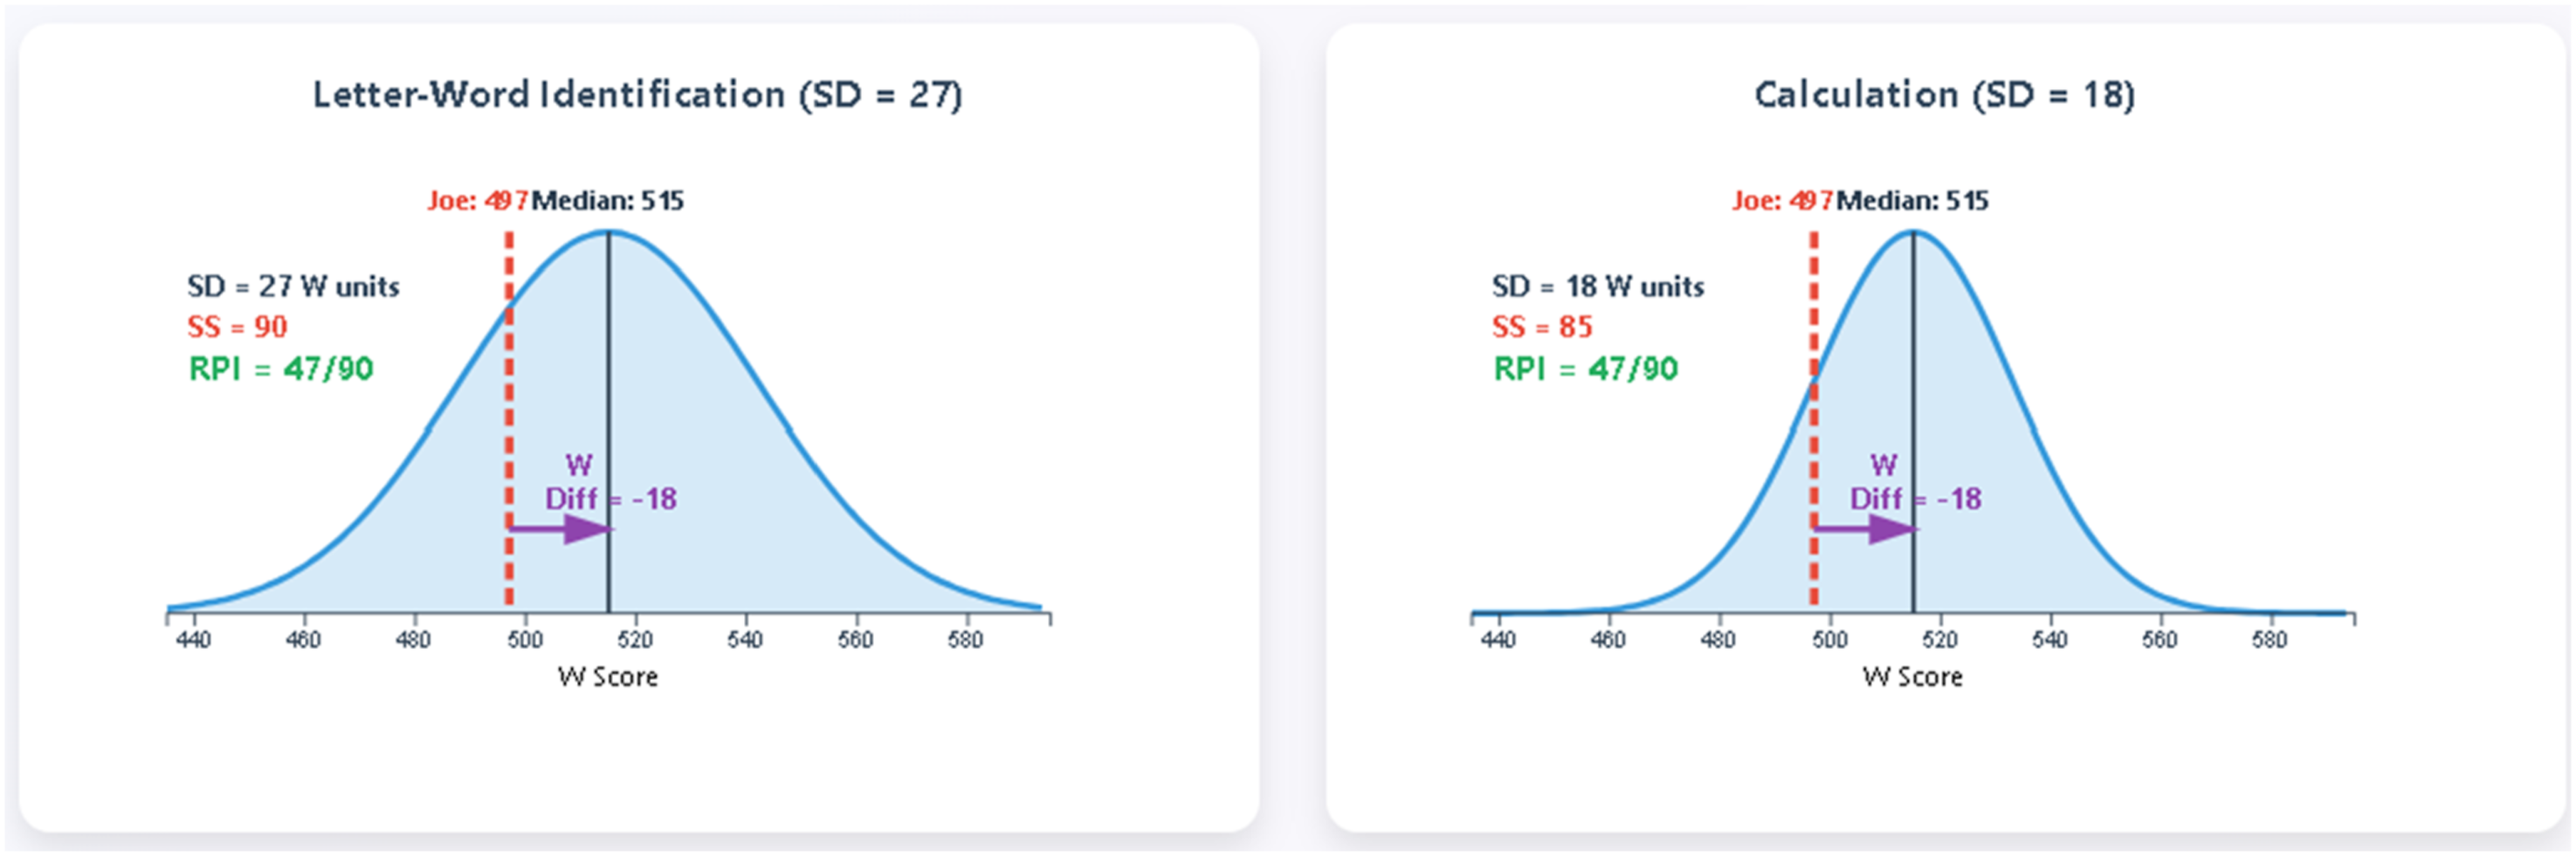
The visualization in Figure 4 demonstrates a fundamental principle of the WJ V scoring system: proficiency ranges remain constant across all tests regardless of population variability. The letter-word identification test example in the figure demonstrates the interpretive disconnect that characterizes traits with wide variability at certain ages: a W Difference score of −18 produces an “Average” standard score (90) but “Limited” proficiency (RPI = 47/90). Joe performs in the Average range relative to peers, while simultaneously demonstrating functional limitations (Limited Proficiency) in grade-level reading tasks. RPIs reveal actual functional impact regardless of how variable a trait may be in the population. The fact that standard scores and RPIs may reveal divergent interpretations due to trait variability underscores the necessity of examining both metrics to obtain a comprehensive understanding of student performance.
Base Rate Comparison Procedures
The WJ V authors have streamlined their approach to score comparisons by eliminating complex terminology from earlier versions and focusing on “base rate” interpretations. Unlike the WJ IV, which had four variation procedures and five comparison procedures, the WJ V has seven Comparison Base-Rate Procedures. There are two main types of comparisons, intra-ability and ability/achievement, providing options for comparing abilities within and across the WJ V COG, WJ V ACH, and WJ V VTL. All comparisons are restricted to clusters, and the primary focus is on base rate or prevalence of differences in the WJ V norm sample, which are more meaningful than the standard deviation of the difference. However, the latter is still available (see LaForte et al., 2025 for details).
Example of a Hypothetical Intra-Ability Comparison Base-Rate Procedure
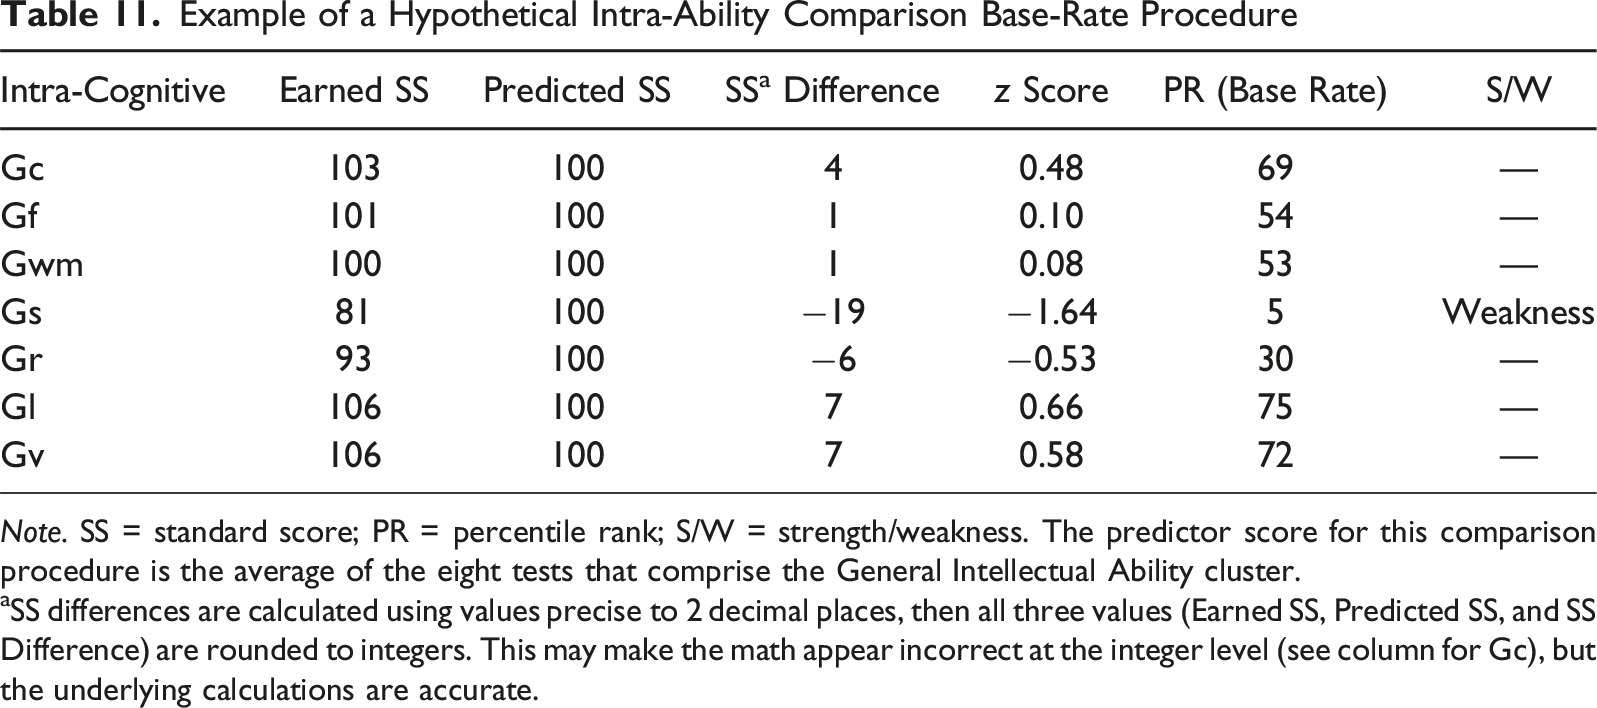
Note. SS = standard score; PR = percentile rank; S/W = strength/weakness. The predictor score for this comparison procedure is the average of the eight tests that comprise the General Intellectual Ability cluster.
aSS differences are calculated using values precise to 2 decimal places, then all three values (Earned SS, Predicted SS, and SS Difference) are rounded to integers. This may make the math appear incorrect at the integer level (see column for Gc), but the underlying calculations are accurate.
The standard score difference is compared to a distribution of difference scores of same-age/grade peers with the same predicted score in the standardization sample. From this comparison, a z-score is obtained, which represents the examinee’s difference score in standard deviation units—that is, the difference between the examinee’s difference score and the average difference score from the distribution of difference scores. The next column in Table 11 includes the Percentile Rank (PR)/Base Rate of the difference score, indicating the prevalence of the difference in the distribution of difference scores. The PR/Base Rate is the percentage of the examinee’s peer group (with the same predicted score) with a difference score as large or larger. In Table 11, the difference between the Gs earned and predicted scores is −19, which corresponds to a PR/Base Rate of 5. This base rate means that only 5% of the examinee’s peer group (with the same predicted score) had the same or larger negative difference score for the Gs cluster. A common rule of thumb for a “meaningful difference” in the psychological assessment literature varies from 5% to 15% of the population (e.g., Lezak, 1995).
The z-score column in Table 11 is associated with the Strength/Weakness (S/W) column. Specifically, the last column will report a target cluster as representing a strength or weakness when the z-score is equal to or greater than 1.5 SD. For example, Table 4 shows that the difference score of −19 is 1.64 SD below the mean of difference scores, indicating a weakness in Gs. Note that 1.5 SD is an arbitrary threshold. It can be changed to 1.0 SD in Riverside Score®, which would result in more strengths and weaknesses than the 1.5 SD criterion. Therefore, the most meaningful information from the WJ V comparison procedures is the base rate of the difference score because the interpretation is not affected by arbitrary thresholds or cut points.
The comparison base rate procedures inform decisions related to the identification of specific learning disabilities (e.g., Flanagan, 2025) and other types of neurodevelopmental disorders. However, results from these comparison procedures alone should not be used to determine special education eligibility, as current educational law requires examining broader patterns of strengths and weaknesses across multiple domains.
Practice Implications
The WJ V expands assessment capabilities through its comprehensive restructuring and the introduction of the VTL. With 60 tests spanning cognitive, academic, and language domains, practitioners now have access to the most extensive collection of co-tests currently available. This expansion enables more nuanced diagnostic evaluations and supports the identification of specific patterns of strengths and weaknesses that were previously more difficult to detect, especially with traditional assessment approaches. The separation of the former Glr cluster into Long-term Storage (Gl) and Retrieval Fluency (Gr) reflects alignment with advances in CHC theories (McGrew, 2023; Schneider & McGrew, 2018). The numerous theoretical refinements reflected in this edition of the WJ, combined with the addition of new tests, such as Symbol Inhibition and RAN tests, enable practitioners to evaluate abilities and processes with more precision and depth, ultimately leading to a better understanding of attention-related difficulties and specific learning disabilities.
The VTL helps practitioners answer complex diagnostic questions, particularly those related to reading disorders and dyslexia (Mather et al., 2025b). For example, it includes six auditory processing tests organized into two clusters (Phonological Awareness and Phonological Manipulation), along with five rapid automatized naming (RAN) tests that can be combined to form specialized RAN-Reading and RAN-Math clusters. In addition, a Dyslexia Test Set, comprising tests from the VTL and WJ V ACH batteries, provides practitioners with evidence-based guidance for dyslexia assessment based on individual referral questions. This targeted approach is an advancement in translating research findings into clinical practice, ensuring that evaluations are comprehensive and efficient.
The WJ V’s digital platform offers many advantages and addresses practical challenges that have historically complicated test administration. For example, the digital platform manages basal and ceiling rules, reducing potential errors in administration and scoring. The voice capture features enhance scoring precision and improve accuracy for timed retrieval tests. Automatic scoring and report generation via Riverside Score® also minimizes human error and improves the quality of diagnostic information available to practitioners. Successful implementation of the WJ V requires careful attention to training and infrastructure needs. The digital platform necessitates reliable internet connectivity and appropriate technology resources, including examiner laptops and examinee tablets. Organizations should allocate funds for both initial technology investments and ongoing technical support to ensure a smooth implementation. Given the complexity of the interpretive framework and the wealth of available assessment options, comprehensive training is essential for maximizing the WJ V’s diagnostic potential.
Conclusions
The WJ V represents more than an incremental improvement over its predecessors—it is an advancement in how practitioners can approach comprehensive assessment. By combining cutting-edge technology with a well-validated theoretical foundation and contemporary normative data, the WJ V provides practitioners with unprecedented capabilities for understanding individual differences in cognitive, academic, and language functioning. The WJ V’s emphasis on criterion-referenced interpretation, flexible administration options, and evidence-based diagnostic capabilities makes it an essential tool for practitioners committed to providing high-quality, individualized evaluations. However, understanding the full potential of this assessment system requires an investment in training, technology, and ongoing professional development. As the field continues to evolve toward more precise, individualized, and evidence-based assessment practices, the WJ V is leading the way. The ultimate success of the WJ V will depend not only on its technical excellence but on practitioners’ ability to use its comprehensive capabilities thoughtfully and effectively to maximize outcomes for individuals with diverse needs and challenges across the lifespan.
Footnotes
Acknowledgements
We are grateful to Genesis Tolentino for her assistance in preparing the tables for this article and to Ridge Bynum for his editorial assistance.
Funding
The authors received no financial support for the research, authorship, and/or publication of this article.
Declaration of Conflicting Interests
The authors declared no potential conflicts of interest with respect to the research, authorship, and/or publication of this article.