
Abstract
Chronic absenteeism among high school students poses a significant threat to academic success. As schools address the root causes of absenteeism, assessments such as the Washington Assessment of Risks and Needs of Students (WARNS) help identify students’ risk factors and support needs. However, assessment scores depend on the quality and authenticity of student responses. When students are disengaged (e.g., rushing through items, exerting minimal effort), the data may misrepresent their actual needs, undermining assessment validity. We examined disengagement patterns among high school students completing the WARNS, focusing on response time as a behavioral indicator of engagement. A small percentage (<5%) of students displayed disengagement, which differed between males and females and assessment context. Differences in risk classification patterns were observed for students identified as rapid responders. Results highlighted the importance of incorporating response process data into assessment interpretation and suggested practical strategies for improving the accuracy of these types of assessments.
Chronic absenteeism in high school is a serious concern, as it predicts a host of negative outcomes including low academic achievement, dropout, and increased risk of delinquency (Black & Elgaddal, 2024). In the 2021–2022 school year, 31% of U.S. students were chronically absent, meaning they missed 10% or more of school days. In 2023, the national average declined only slightly to 28% (U.S. Department of Education, n.d.). In response, educators and juvenile courts have turned to structured risk and needs assessments to identify the factors underlying truancy and to guide early interventions (Development Services Group, 2015).
Description and Utility of Risk Assessments
Risk assessments are structured tools used to evaluate the likelihood of encountering adverse outcomes (e.g., reoffending, dropping out of school, substance use) and to identify the needs or factors that, if addressed, can reduce those risks. In practice, these assessments help professionals collect and synthesize information about behavioral, emotional, academic, and social risk factors in a systematic way. The assessments yield quantitative estimates (risk scores or classifications) that inform decisions about supports for youth. That is, practitioners use risk assessments to bring objectivity and evidence into early intervention planning (Schwalbe, 2008).
This first step in early intervention can prevent escalation into more serious problems. Problems like chronic absenteeism, early aggressive behavior, or substance experimentation are warning signs for later outcomes such as dropping out of school or criminal behavior. For instance, high truancy in high school is associated with higher dropout rates and increased risk of delinquency (Henry & Huizinga, 2007; Rocque et al., 2017). By using risk assessments, schools and agencies aim to intervene early, before a student disengages completely. As Strand et al. (2023) point out, combating truancy and school failure even at the middle school level is seen as a cornerstone of intervention efforts to improve long-term outcomes. In short, youth risk assessments are critical tools because they (a) identify youth who are on concerning trajectories, (b) clarify the factors contributing to risks, and (c) guide the allocation of help (from truancy reduction efforts to mental health referrals) in a timely manner. Early, targeted intervention can alter a young person’s life path – keeping them in school and out of trouble – and risk assessments are designed to facilitate exactly that.
Risk assessments typically evaluate a broad range of factors across multiple domains, including behavioral, emotional/psychological, academic/educational, and social/environmental. These domains are grounded in research showing that challenges in any of these areas can increase a youth’s likelihood of negative outcomes (e.g., delinquency, school failure). Early aggressive behavior or conduct problems (behavioral risk) in childhood predict criminal activity (Shaw et al., 2019). Untreated depression or trauma (emotional risks) can contribute to substance abuse or school dropout. Academic difficulties and disengagement from school are strong risk factors for not graduating (academic risk, Henry et al., 2012).
The Washington Assessment of the Risks and Needs of Students (WARNS) evaluates six domains associated with school disengagement and failure (George et al., 2021). It was originally developed in response to the Washington State Becca Bill legislation to assist with identifying and addressing the needs of students with chronic unexcused absences (Gotch & French, 2020). Tools like the WARNS are employed in schools, community programs, and juvenile justice settings to collect student responses and combine them with additional information to guide supportive actions. The WARNS functions as an initial screening instrument rather than a stand-alone diagnostic, disciplinary, or placement tool. Primary score use is to begin conversations with the student and school personnel.
Quality of Risk Assessment Scores Due to Low Student Effort
Risk assessment scores are only useful if youth provide accurate responses. Many youth assessments rely on self-report or an interview, which means the youth’s cooperation and effort in responding are crucial. However, individuals may provide inaccurate or misleading answers. For example, they may minimize concerns due to fear of punishment or overstate issues in an effort to seek attention. Moreover, some youth may expend minimal effort when responding, answering so quickly that they could not have processed the item and provided a thoughtful response. The prevalence and pattern of these quick non-effortful responses is the focus of our study, as such disengaged responding can compromise assessment results and, in turn, the decisions made based on these results.
Concerns about rapid responding and invalid responses are not unique to risk assessments but tend to be an issue for any assessment that is low stakes for respondents. Unlike high-stakes assessments, low-stakes assessments have little or no personal high-stakes consequence for the respondent (Wise & DeMars, 2005). In achievement testing contexts, high-stakes assessments impact outcomes such as students’ grades, graduation, or admission decisions. By contrast, low-stakes assessments in achievement contexts are typically gathered for test development (DeMars, 2000), school improvement initiatives (Finney et al., 2016), or as formative assessments that do not impact grades but are used to provide teachers with immediate and actionable feedback about student ability (Arhavbarien, 2026). Moreover, test scores reported for comparability studies (e.g., NAEP and TIMSS) or accountability mandates (e.g., Race to the Top) are often gathered in low-stakes testing contexts, where test performance has no impact on the student (e.g., Braun et al., 2011; Cole & Osterlind, 2008; Hopfenbeck & Kjærnsli, 2016; Rios & Soland, 2022; Smith & Smith, 2004; Zamarro et al., 2019). In such low-stakes assessment contexts, a non-trivial proportion of students tend to expend minimal effort (Wise & DeMars, 2010). Importantly, low effort can bias test scores and result in inaccurate interpretations (Wise, 2017; Wise & DeMars, 2005).
Beyond achievement test performance, educators and the public are interested in a more expansive view of student competence that includes non-cognitive attributes or personal qualities (e.g., self-control, growth mindset, social belonging), with the goal of enhancing these malleable attributes (Duckworth & Yeager, 2015). These assessments are gathered in a low-stakes context in both K-12 and higher education, and issues of low effort have been empirically documented (Akhtar & Kovacs, 2023; Barry & Finney, 2016; Schaefer & Finney, 2025; Swerdzewski et al., 2011). Moreover, these attributes are often measured as part of a needs assessment or early alert mechanism to identify students with low scores (Markle et al., 2013; Markle & O’Banion, 2014; Meikrantz Sharp et al., 2026) and provide educational supports (Pope et al., 2023). Yet, students may not take these assessments seriously as they know their responses do not impact grades or graduation. In turn, measures of these attributes are often accompanied by measures of expended effort to gauge the trustworthiness of the responses (DIA Higher Education Collaborators, n.d.).
Response time is a common approach to quantify expended effort (Wise & Kong, 2005) and could be used to evaluate rapid responding on risk assessments. For example, spending only one or 2 seconds (s) answering an item is evidence of disengagement (Schnipke, 1995; Soland et al., 2019; Wise, 2017). Rapid responding is not an all-or-nothing behavior; most low-effort respondents give effort on some items (Wise & Kuhfeld, 2021). Wise (2015) illustrated how score-based inferences from achievement tests can change after removing students who rapidly responded to more than 10% of items, which previous research suggests is less than 25% of the test-taking population (Jensen et al., 2018; Kong et al., 2007; Rios et al., 2014; Soland, 2018a, 2018b; Soland et al., 2019; Soland & Kuhfeld, 2019; Wise & Cotten, 2009; Wise & DeMars, 2010; Wise & Kong, 2005). Although it is encouraging that 75% or more of students are engaging in minimal rapid responding, ideally, we want all students to put forth the requisite level of effort needed to ensure valid interpretations from scores.
For non-cognitive assessments and surveys, a variety of methods for identifying careless or inattentive responses have been used (e.g., long-string analysis, Mahalanobis distance, person-total correlations, self-reported effort; Curran, 2016; Meade & Craig, 2012; Schaefer & Finney, 2025). Response time, or the time it took an individual to complete a set of survey items, is commonly used on an intuitive basis to identify careless survey responding, yet it can be difficult to create a threshold for response time on a survey (Curran, 2016). Different methodological approaches exist to employ response time to identify careless responding. One approach is employing mixture modeling to empirically uncover classes of respondents who carelessly respond. Each respondent’s response time is given a probability of being generated by a careless responding class or non-careless responding class (Lundgren & Eklöf, 2023). This approach can also employ a stepwise weighting method that uses survey screen time information to determine the probability that an individual carelessly responded and then downweights these responses in the analysis (Ulitzsch et al., 2024).
A second approach is using a fixed or common time threshold for each item or block of items. The threshold classifies respondents’ response times as rapid if below the threshold or non-rapid otherwise. Response time effort (RTE), or the proportion of an individual’s responses classified as non-rapid can be created, representing an individual’s effort on the entire assessment (Wise & Kong, 2005). A challenge to this approach is determining the fixed threshold. A common approach for academic tests is the normative threshold (NT) method: setting the item threshold at 10%, 20%, or 30% of the mean response times (Wise, 2017; Wise & Ma, 2012). A common approach for setting the fixed threshold in surveys is to determine the number of seconds necessary to answer an item and set the threshold at this value. For example, the threshold of 2 s per item has received traction in the survey domain (Curran, 2016; Huang et al., 2012). Moreover, response time was coupled with other survey detection methods (e.g., long-string analysis) to identify disengaged survey responses at the page level of sets of survey items (Soland et al., 2019). They found that the highest overlap in responses deemed disengaged across detection methods occurred for responses under 2 s per item. Given the computational and conceptual ease of the fixed threshold method relative to a mixture modeling approach, we employed this approach for the initial assessment of rapid responding on the WARNS. Additionally, this approach has the practical advantage of being easier to communicate to stakeholders who ask about how seriously students take the assessment.
Despite growing literature on expended effort on achievement tests (e.g., Borger et al., 2025; Borghans et al., 2024) and surveys (e.g., Meade & Craig, 2012), we could find no literature on response time effort for risk assessments. If youth perceive the risk assessments as having little to no high-stakes consequences on their lives, they may rush through the assessments and provide invalid responses. Reed et al. (2024) examined test-taking effort on a low-stakes reading assessment among youth with high needs (juvenile offenders). Based on total testing times, results suggested response patterns consistent with rapid responding. Although helpful in understanding this population’s behavior on a reading test, the results do not provide insight into behavior when completing risk assessments.
Moreover, rapid responding is influenced by administration conditions. Remote assessment settings have been associated with both lower scores and lower motivation relative to in-person settings (Alahmadi & DeMars, 2022). Whereas in-person assessment settings are more controlled, remote settings are less controlled, which can negatively impact an assessment’s psychometric properties (Barry & Finney, 2009; Schaefer & Finney, 2025). Additionally, well-trained proctors are associated with increased examinee motivation relative to less trained proctors during in-person testing (Lau et al., 2009). Proctored in-person testing is associated with higher examinee motivation relative to unproctored remote testing (Alahmadi & DeMars, 2022). Research on proctoring in remote settings indicates that proctoring does not have an impact on examinee motivation relative to no proctoring (e.g., Hollister & Berenson, 2009; Rios & Liu, 2017). For risk assessments like the WARNS, youth typically complete the assessments in person; however, the presence and behavior of a proctor are often unknown. Administrators are given specific protocols explaining the use of the risk assessment scores, but it is unclear whether these protocols are implemented with fidelity and whether doing so influences youths’ perceptions of the stakes of the risk assessment. With that said, the amount of rapid responding could be examined across administration settings (e.g., school, treatment/resource facility) and formats (e.g., group vs. individual administration) to identify where rapid responding is more common. For example, group assessment administrations may increase time pressure as youth observe peers finishing, which may encourage faster responding, whereas individual administrations may reduce peer-related pressure and allow youth to answer more slowly and thoughtfully.
To begin understanding youths’ response effort when completing risk assessments, a first step is to estimate the prevalence of rapid responding and whether it is associated with individual or context characteristics. Further, rapid responding data can provide insight into risk misclassification, which can result in misallocation of resources and support. For example, a student who needs support but is misclassified as low risk (e.g., false negative) may not be offered services (e.g., meeting with a school counselor or a referral to resources) to address underlying factors contributing to their absenteeism or disengagement from school. Alternatively, a student who is misclassified as high risk (e.g., false positive) may receive unnecessary support, potentially diverting limited resources away from students who need them most. Typically, in educational screening contexts, greater priority is placed on minimizing false negatives so that students who may benefit from additional support are less likely to be overlooked (e.g., Kearney et al., 2023; Wu et al., 2026).
Purpose of the Study
We examined high school students’ rapid and effortful responding on the WARNS. We were interested in the following three research questions: (1) What percentage of students are rapidly responding to the WARNS items?
A low percentage of rapid responses would increase confidence in the interpretation and use of WARNS scores. At present, however, the prevalence of rapid responding on this risk assessment is unknown. This aim aligns with Standard 4.13 in the Standards for Psychological and Educational Testing (AERA et al., 2014), which directs assessment users to investigate potential sources of irrelevant variance that may affect scores. Pervasive rapid responding would prompt new administration processes to ensure high-quality usable scores. (2) Which student and context characteristics are associated with rapid responding?
If rapid responding is more common for particular student groups or particular administration contexts, data collection procedures could be adapted to reduce rapid responding in those settings. Currently, it is unclear whether rapid responding on the WARNS varies across student groups or administration contexts. (3) Are students who rapidly respond disproportionately classified into particular risk categories?
Understanding how rapid responders are categorized in terms of risk helps us better understand if these students have an increased rate of not getting supports or being assigned unneeded supports.
Methods
Sample
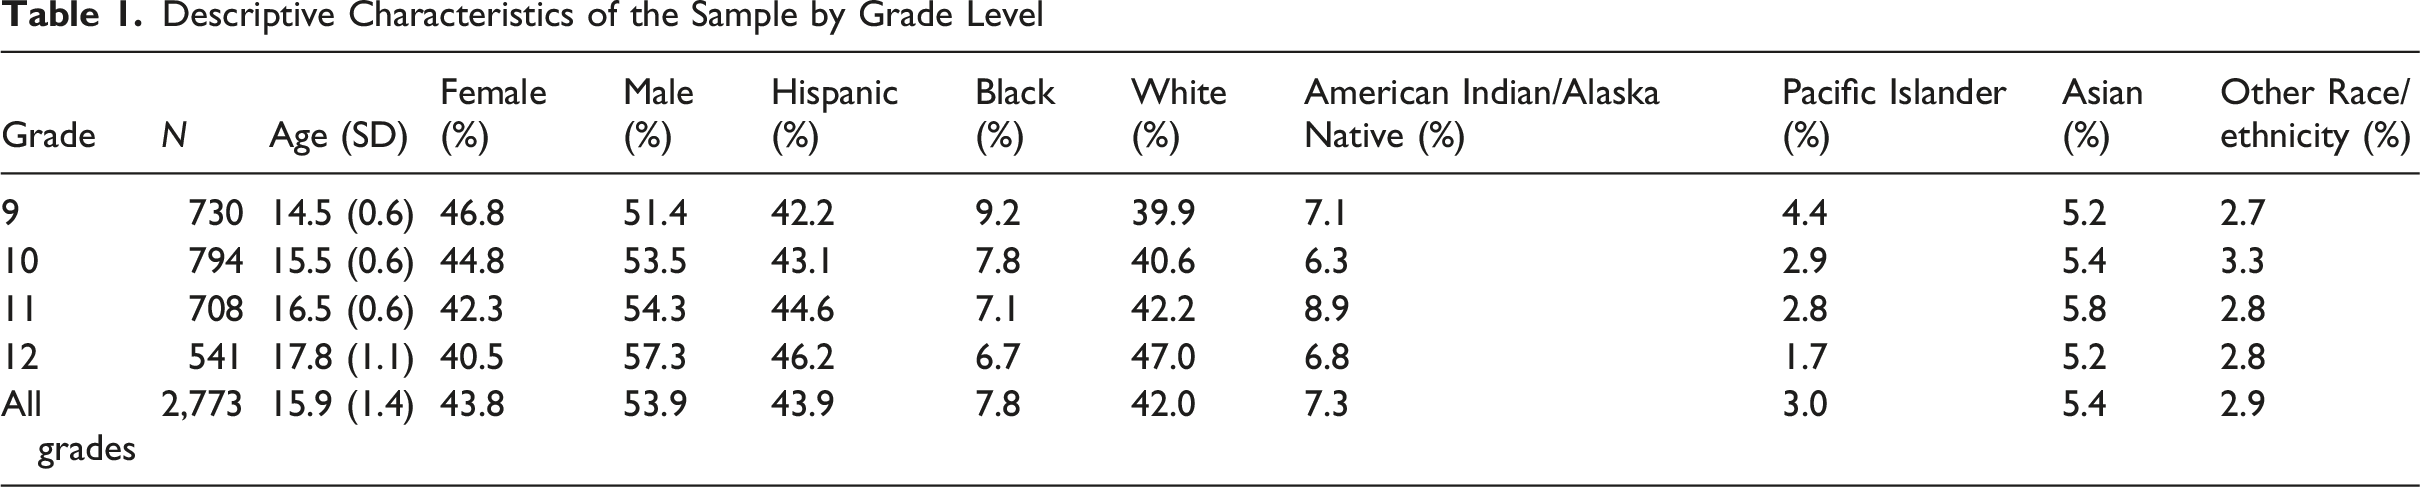
Descriptive Characteristics of the Sample by Grade Level
Instrument
The Washington Assessment of the Risks and Needs of Students (WARNS, George et al., 2021) is an online 40-item self-report measure designed for schools, courts, and youth service providers to assess students’ risks and needs related to truancy and school failure and to help target follow-up services (George et al., 2021). The WARNS measures six subdomains, including Aggression-Defiance (AD), Depression-Anxiety (DA), Substance Abuse (SA), Peer Deviance (PD), Family Environment (FE), and School Engagement (SE). The AD (7 items) subscale assesses frequency of aggressive (“I got so angry I hit or broke something”) and defiant (“I lied, scammed, or conned someone to get what I wanted”) behaviors. The DA (8 items) subscale assesses the symptoms of depression (“I felt like nothing could cheer me up”) and anxiety (“I had trouble sleeping or eating because I couldn’t get something off my mind”). The SA subscale (5 items) measures usage and effects of drugs and alcohol (“I missed or skipped school to use or recover from drugs or alcohol”). The PD subscale (5 items) queries participants’ perception of deviance of their peers with respect to multiple areas of risk such as defiance, aggression, and substance abuse (“My friends got into physical fights”). The FE subscale (6 items) measures the quality of the parent–child relationship as well as the home environment (“I felt safe with my family”). Finally, the SE subscale (9 items) measures the participant’s attachment to school and learning (“I liked going to school”), efforts to succeed (“I studied for my quizzes and tests”), and connectedness to school and school personnel (“My teachers took a personal interest in me”).
Items refer to attitudes and behaviors within the past 2 months and use a four-point rating scale ranging from “Never, or hardly ever” to “Always, or almost always.” Items are brief and written at approximately a fourth-grade reading level. Prior research supports a bifactor structure comprising one general risk and needs factor and six specific factors each corresponding to one WARNS subdomain (Strand et al., 2019). In addition, an accumulation of evidence supports several inferences in a developing validity argument for score use (e.g., Gotch & French, 2020). The internal consistency reliability estimate (omega) with data used in this study for the WARNS total score, which is used for classification of risk, was .96.
Procedures
Assessments were administered in a digital format as part of routine organizational practice by WARNS users. School districts and partner organizations determine when to administer the assessment. Typical reasons include fulfilling state-mandated assessment requirements triggered by established truancy thresholds, supporting comprehensive risk assessment initiatives, or as part of general student evaluations. No data were collected on the exact reason for completing the assessment. The online assessment platform uses a forced-choice format, requiring students to answer each item before proceeding to the subsequent item. Therefore, there is no missing data.
Administration procedures vary across organizations. Implementations include a range of contexts and formats, such as in-person or remote, individual or group sessions, and completion on either student or school devices. For example, schools using the WARNS as a general screener may administer the assessment to large groups in a computer lab, whereas referrals tied to truancy thresholds may be completed individually with a counselor. Regardless of administration procedure, all organizations are instructed to inform students why they are being asked to complete the WARNS and that the general purpose is to start a conversation about where they may need support. When completing the WARNS, students are asked to respond to the items by reflecting on their life within the past 2 months. Administrators were provided access to standard guidance and training materials describing implementation procedures and suggested language for introducing the assessments. Fidelity of these procedures at the point of use was not recorded.
Number of Rapid Responders (NRR) and Threshold Value (TV) in Seconds Per Block
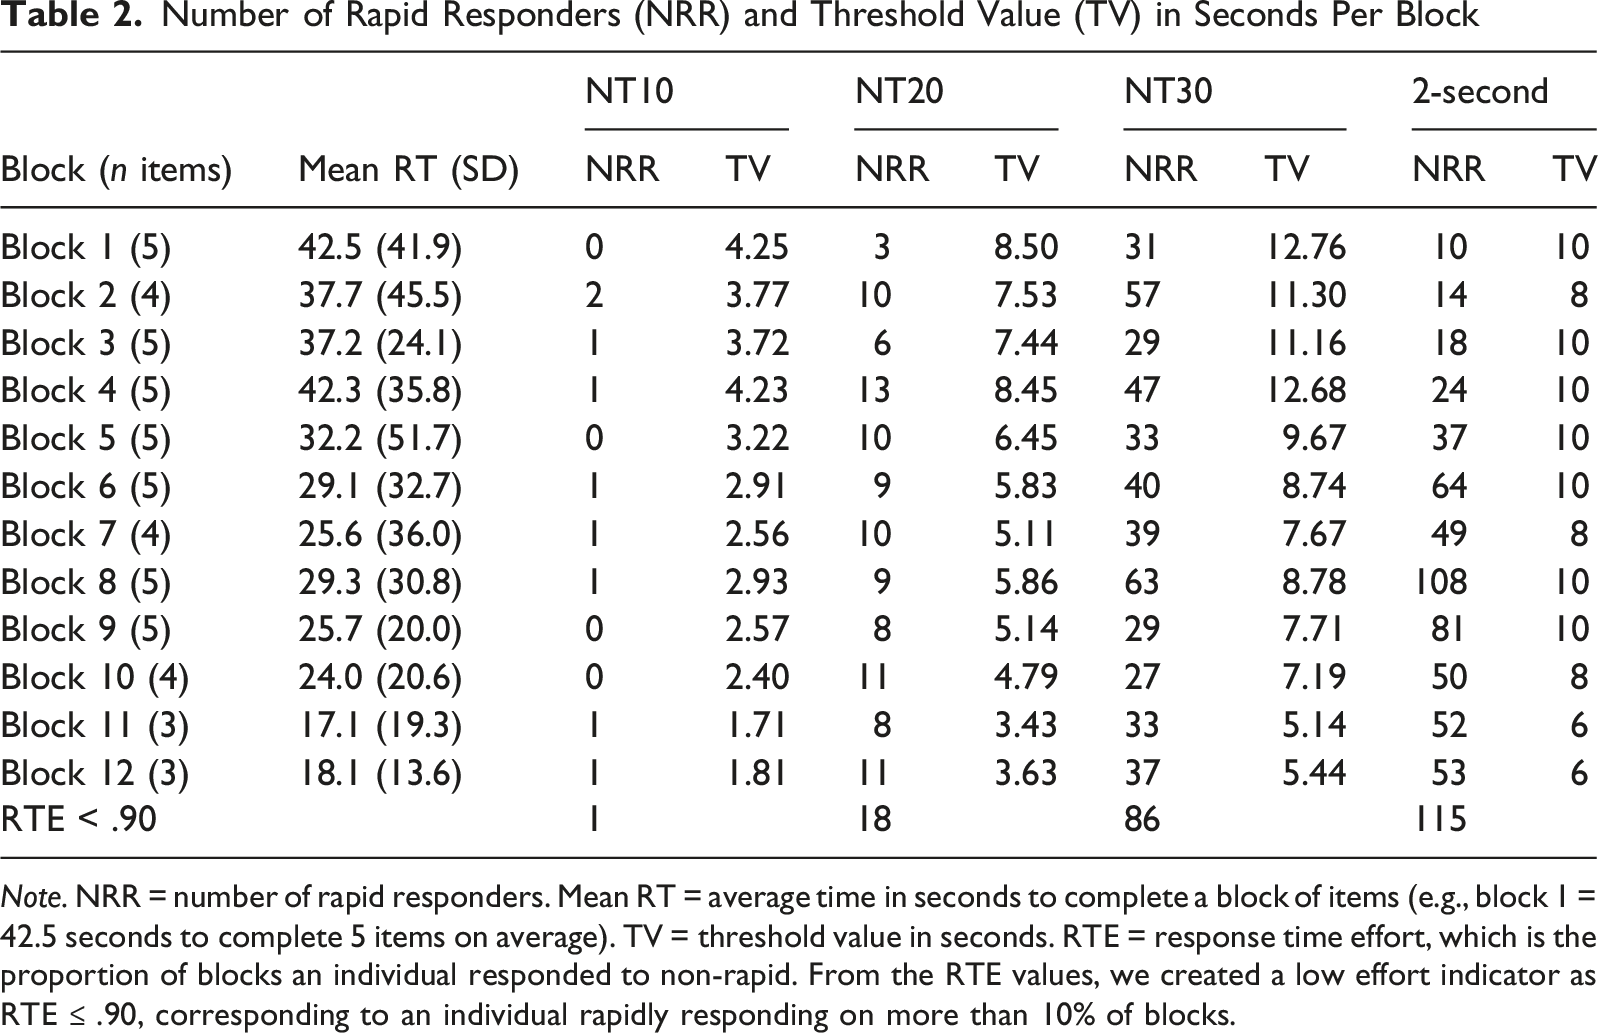
Note. NRR = number of rapid responders. Mean RT = average time in seconds to complete a block of items (e.g., block 1 = 42.5 seconds to complete 5 items on average). TV = threshold value in seconds. RTE = response time effort, which is the proportion of blocks an individual responded to non-rapid. From the RTE values, we created a low effort indicator as RTE ≤ .90, corresponding to an individual rapidly responding on more than 10% of blocks.
Item Response Analysis
Rapid responding was identified using four rules commonly applied to the block response times. First, we used the two-second per item rule (Huang et al., 2012; Soland et al., 2019), where a block was flagged as rapid if its response time in seconds was less than or equal to 2 multiplied by the number of items in the block; otherwise, it was classified as non-rapid. Second, we used a normative threshold method (NT, Wise & Ma, 2012), where responses were flagged as rapid if their time fell below a specified proportion of the block’s mean response time. Specifically, we considered thresholds of 10%, 20%, and 30% of the block mean (NT10, NT20, and NT30, respectively) given previous empirical study of their functioning to identify rapid responding (e.g., Soland et al., 2021; Wise & Kuhfeld, 2021). For example, the NT10 threshold for Block 1 was 4.25 s, representing 10% of the average block response time, with NT20 and NT30 representing 20% and 30% of the average block response time. The two-second rule defines the threshold as 2 multiplied by the number of items in the block (e.g., Block 1 = 5 items × 2 = 10 s). For each method (two-second rule, NT10, NT20, NT30), we computed response time effort (RTE) as the student-level proportion of blocks classified as non-rapid (Wise & Kong, 2005). Aligning with prior research (e.g., Rios & Deng, 2021; Rios et al., 2017; Wise & DeMars, 2005), we created a low effort indicator using RTE ≤ .90, corresponding to rapid responding on more than 10% of blocks, which was equivalent to two or more WARNS blocks.
Validity Check of Response-Time Thresholds
To evaluate the validity of response-time thresholds before applying them to the student sample, multiple administrations of the WARNS were completed by the authors of this study. Each author completed at least one effortful administration (i.e., reading and answering items carefully) and one rapid-responding administration (i.e., completing the assessment as quickly as possible without reading items). This resulted in 14 administrations with known response behavior, including six that were effortful and eight that were rapid. The rapid responding thresholds estimated using the four rules applied to the student sample (two-second rule, NT10, NT20, NT30) were compared to the authors’ time spent answering thoughtfully or as quickly as possible. A threshold setting method was considered invalid (too insensitive) if the threshold did not flag the authors’ quick, thoughtless responses as rapid responses or missed effortful responses. A method that is working well should minimize both false positives and false negatives.
Analysis of Risk Status by Disengagement Status
Proportions of students classified as low effort and effortful were estimated within overall risk level classification (high/low) and within each domain-level risk category (low, medium, high). Additional summaries of disengagement were generated by gender, grade, locale, organization type, and assessment administration format. Two-way cross-tabulations were created for pairs of grouping variables to examine patterns at subgroup intersections.
Internal Consistency Reliability Analysis
Internal consistency reliability was estimated with McDonald’s omega (ω, McDonald, 1999) for each domain-specific factor, the general factor, and the total composite. Estimates were based on the bifactor model, which tends to fit the data the best (e.g., Strand et al., 2019). Estimates were obtained for the full sample and then recomputed after effort-based filtering using the RTE ≥ .90 criterion under each response-time rule.
Results
Block-Level Performance of Response Time Threshold Methods in Author’s Response Data
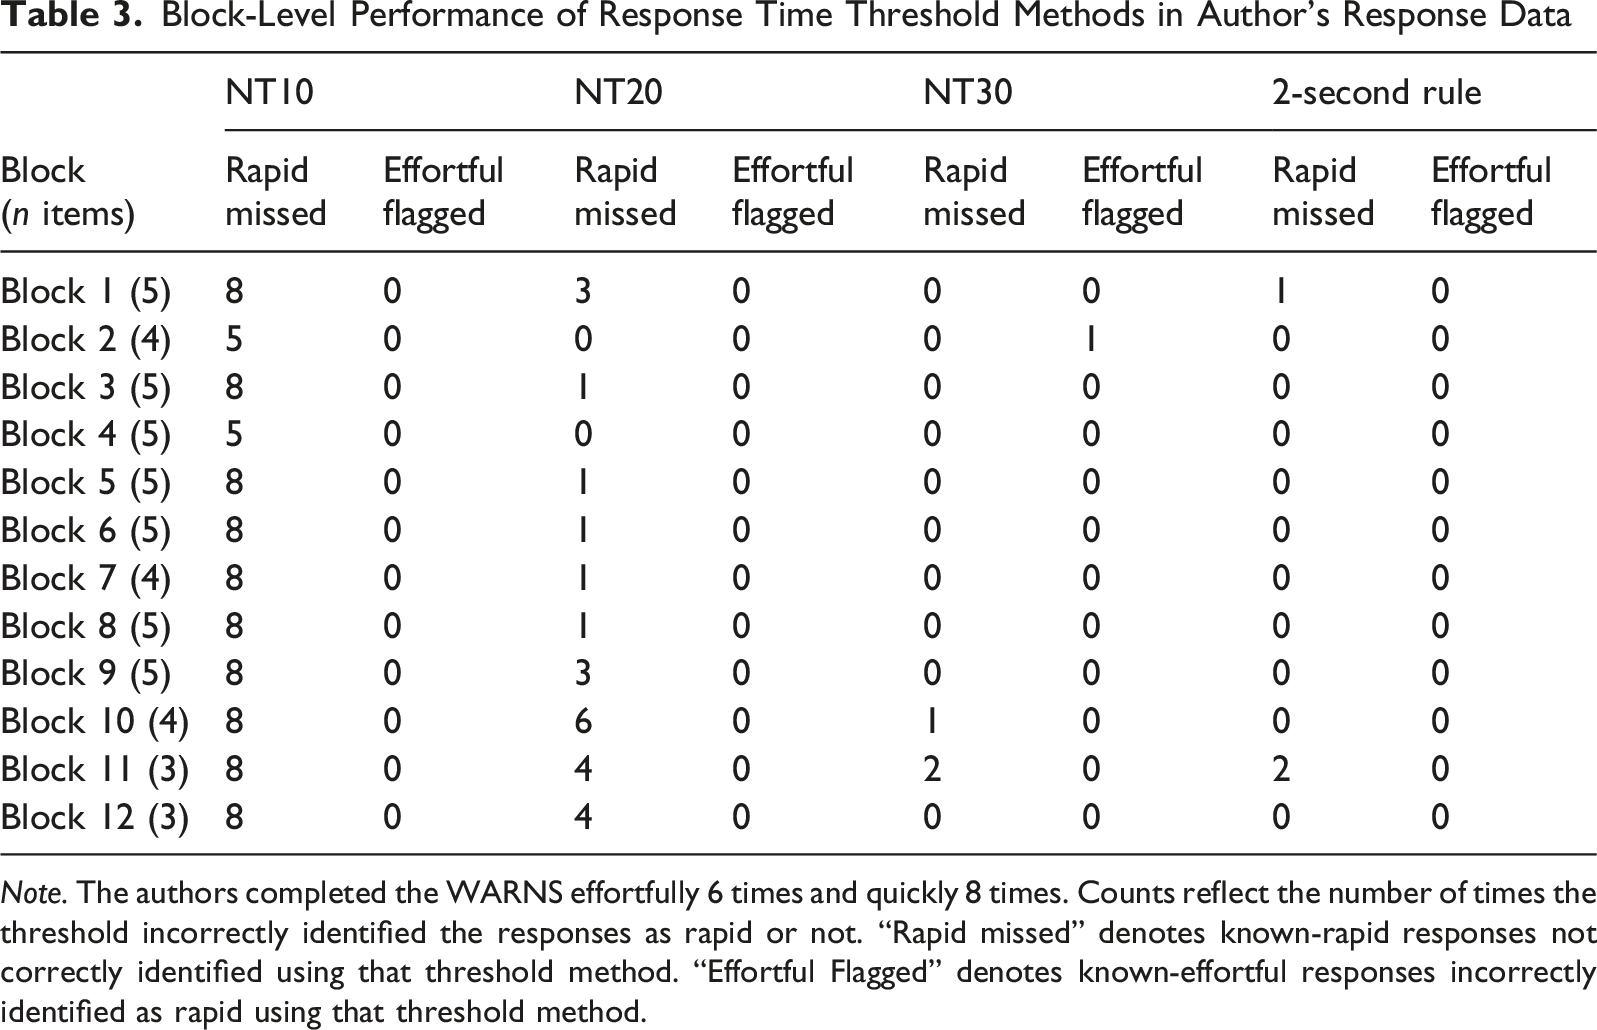
Note. The authors completed the WARNS effortfully 6 times and quickly 8 times. Counts reflect the number of times the threshold incorrectly identified the responses as rapid or not. “Rapid missed” denotes known-rapid responses not correctly identified using that threshold method. “Effortful Flagged” denotes known-effortful responses incorrectly identified as rapid using that threshold method.
In Table 2, we present the number of rapid responders (NRR) and corresponding average response threshold value (TV in seconds) for each block under four threshold rules: NT10, NT20, NT30, and the two-second rule. NRR refers to the number of students whose response times fell below the specified threshold for that block, indicating potential rapid responding. The TV column represents the cutoff time applied for that threshold (e.g., under NT10 for Block 1, responses faster than 4.25 seconds were flagged as rapid). To orient the reader, Block 1 illustrates these metrics clearly. The mean response time was 42.5 seconds (SD = 41.9), suggesting generally effortful engagement. Under NT10, 0 students were classified as rapid responders using a threshold of 4.25 s. NT20 flagged 3 students as responding rapidly using a threshold of 8.50 s. This insensitivity confirms our validity check results and our focus on the other thresholds. NT30 identified 31 students as responding rapidly using a 12.76-second threshold. The two-second rule classified 10 students as rapid responders, applying a fixed cutoff of 2 s multiplied by the number of items in the block (10 s for Block 1 with 5 items). This pattern shows that the thresholds of (NT10 and NT20 identified very few rapid responses, whereas NT30 and the two-second rule flagged substantially more students. Across all response time threshold rules, most students were classified as effortful. More than 95% of students met the RTE ≥ .90 criterion, meaning that fewer than 5% of students exhibited rapid responses on more than 10% of blocks. Specifically, the number of students classified as low effort (RTE < .90) ranged from 1 under the insensitive NT10 threshold rule to 115 under the more sensitive two-second rule (see Table 2).
Average response times declined across blocks, ranging from 42.5 s on Block 1 to 18.1 s on Block 12. Block-level prevalence of rapid responding varied substantially across blocks and threshold methods (Table 2). As expected, given the validity check of the threshold methods using the authors’ responding data, NT10 and NT20 identified relatively few rapid responses per block (0–2 and 3–13, respectively), whereas NT30 and the two-second rule identified more students (29–63 and 10–108, respectively).
Differences in Rapid Responding
Simple Group Differences
Rapid Responders by Student Group
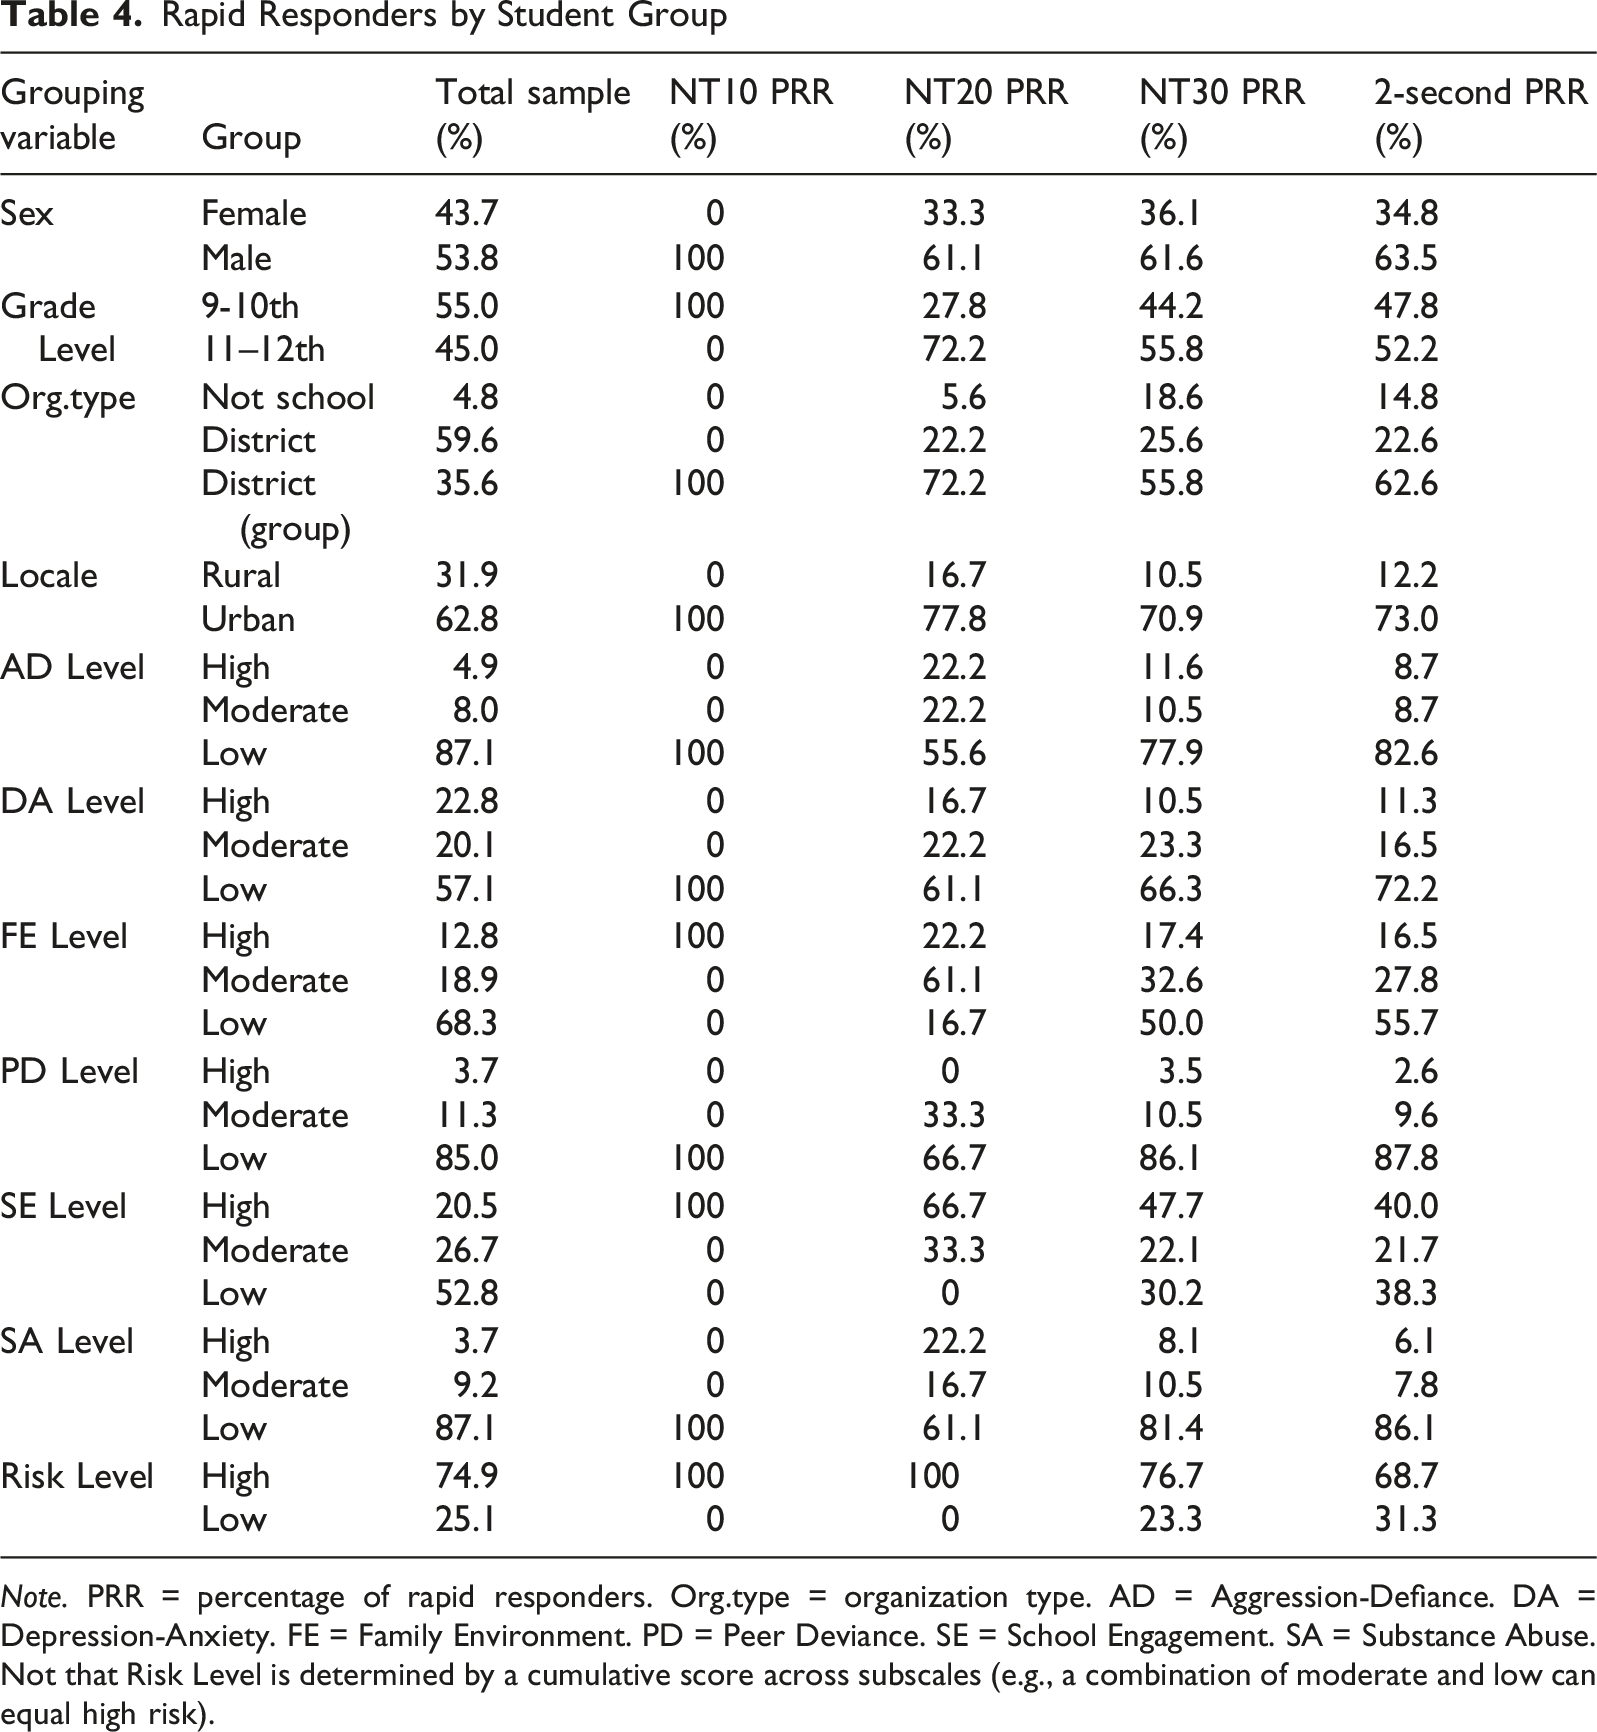
Note. PRR = percentage of rapid responders. Org.type = organization type. AD = Aggression-Defiance. DA = Depression-Anxiety. FE = Family Environment. PD = Peer Deviance. SE = School Engagement. SA = Substance Abuse. Not that Risk Level is determined by a cumulative score across subscales (e.g., a combination of moderate and low can equal high risk).
In sum, across blocks, rapid responding was rare overall (<5% of students), but prevalence varied by threshold and block. NT30 and the two-second rule flagged substantially more rapid responders than NT10/NT20. Group differences emerged: rapid responding was disproportionately higher among males, 11–12th graders, students tested in group/urban settings, and those outside district settings.
Intersectional Group Differences
Rapid Responders by Intersectional Student Group
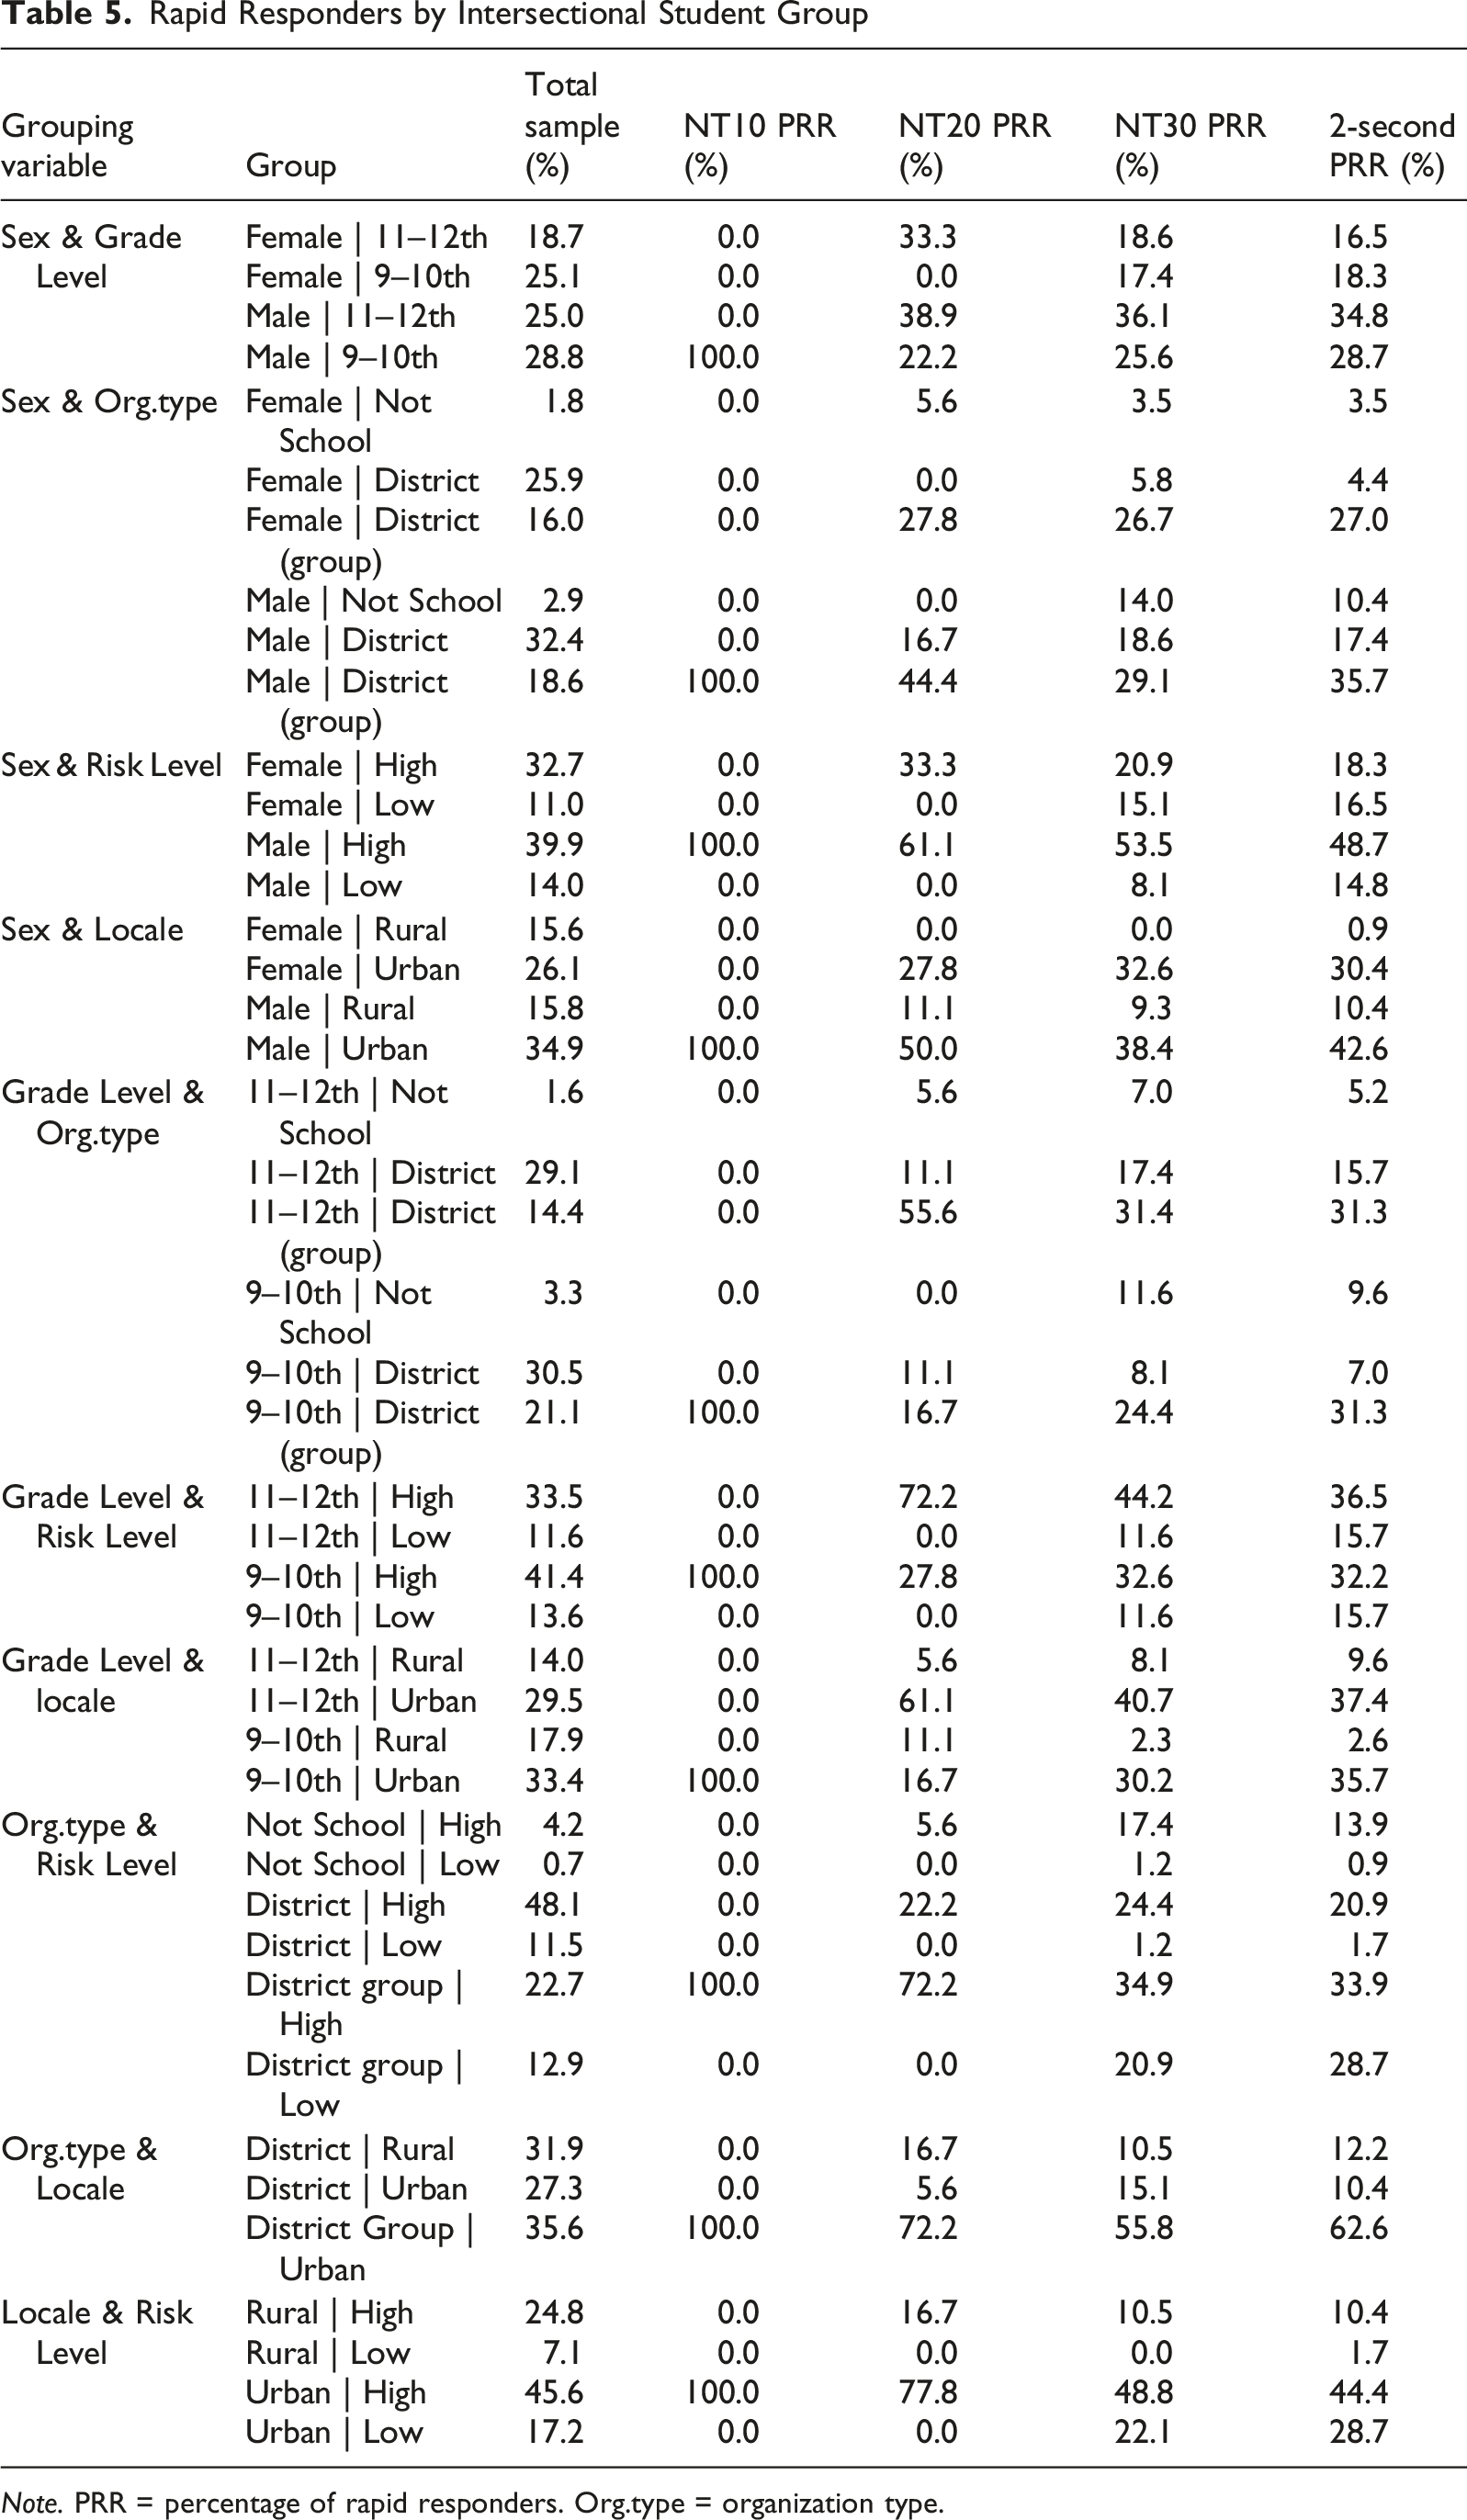
Note. PRR = percentage of rapid responders. Org.type = organization type.
In contrast, several groups in individual district administrations had smaller shares of rapid responders than the total sample. Students who identified as female and completed the assessment individually in district settings comprised 25.9% of the total sample but were only 5.8% (NT30) and 4.4% (two-second rule) of rapid responders, and 9th- and 10th-grade students who completed the assessment individually in district settings comprised 30.5% of the sample but were only 8.1% (NT30) and 7.0% (two-second rule) of rapid responders. Rural district settings showed a similar pattern, accounting for 31.9% of the total sample but were only 10.5% (NT30) and 12.2% (two-second rule) of rapid responders.
Students who completed the assessment in non-school settings (i.e., community-based agencies) and were classified as having high risk represented 4.2% of the total sample yet were 17.4% (NT30) and 13.9% (two-second rule) of rapid responders. Males in non-school settings represented 2.9% of the total sample yet were 14.0% (NT30) and 10.4% (two-second rule) of rapid responders. Males who were classified as high risk represented 39.9% of the total sample yet were 53.5% (NT30) and 48.7% (two-second rule) of rapid responders. Across gender and grade level, rapid responding was most commonly observed among male 11th–12th graders. This group represented 25% of the sample but constituted 36.1% (NT30) and 34.8% (two-second rule) of rapid responders.
Disproportional Risk Classification
Prior to filtering the rapid responders, the majority of the total sample was classified as low risk across the individual WARNS domains. As seen in Table 4, the percentage of students classified as low risk ranged from 52.8% for the School Engagement domain to 87.1% for the Aggression-Defiance and Substance Abuse domains. However, for students labeled as rapid responders using the two-second rule, the distribution of low-risk classifications differed from the full sample: low-risk was more common for Depression-Anxiety (i.e., 72.2% vs 57.1%) but less common for the School Engagement (38.3% vs 52.8%), Family Environment (55.7% vs 68.3%), and Aggression-Defiance (82.6% vs 87.1%) domains when employing the two-second rule for students who were rapid responding compared to the full sample.
For the Total Risk classification, prior to filtering rapid responders, 74.9% of students were categorized as high risk and 25.1% as low risk. For students labeled as rapid responders, 76.7% (NT30) and 68.7% (two-second rule) were categorized as high risk, whereas 23.3% (NT30) and 31.3% (two-second rule) were categorized as low risk. Using the two-second rule, low-risk categorization was overrepresented, and high-risk categorization was underrepresented relative to the full sample. Thus, at the total-risk level, evidence consistent with possible false negatives was observed under the two-second rule, but not under NT30. The opposite (i.e., false positive) could occur with straight lined responses on the WARNS (selecting the same response that represents high risk across all items), but occurred less than 1% of the time. In student risk screening, the consequences of false negatives are often more severe than those of false positives. A false negative, misclassifying a truly at-risk student as low risk, can delay or prevent access to timely intervention, allowing academic, behavioral, or mental health difficulties to compound over time. Screening systems in education frequently prioritize sensitivity when the cost of missed risk is high, and support early identification (e.g., Kearney et al., 2023; Wu et al., 2026).
Internal Consistency Reliability Across Filtering Conditions
Coefficient Omega (ω) from Bifactor CFA by Effort-Based Filtering Rule
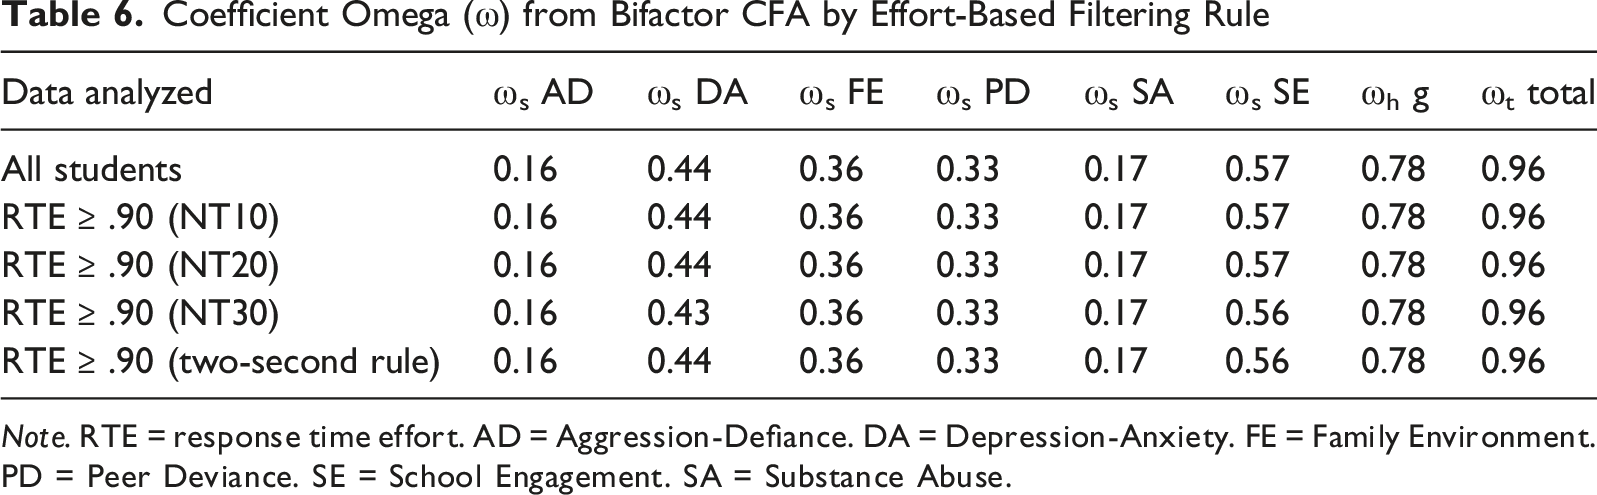
Note. RTE = response time effort. AD = Aggression-Defiance. DA = Depression-Anxiety. FE = Family Environment. PD = Peer Deviance. SE = School Engagement. SA = Substance Abuse.
Discussion
We examined the prevalence of rapid responding on a youth risk assessment, how rates of rapid responding varied across student groups and administration contexts, and how risk classifications could differ for students identified as rapid responders. We analyzed data from students who took the WARNS high school assessment, using response times to flag disengaged responses. The vast majority of students were adequately engaged, with over 95% meeting a high effort threshold (RTE ≥ .90) under various detection rules. In other words, fewer than 5% of students exhibited clear signs of rapid responding. Nonetheless, a non-trivial subset did respond rapidly. We also observed a pattern of declining response times over the course of the assessment. On average, students spent about 42.5 seconds on the first block, dropping to around 18.1 seconds by the last block. This speeding-up suggests that some students became less attentive or eager to finish as they progressed, consistent with known patterns of waning motivation during low-stakes tests.
We explored whether rapid responding varied across student characteristics or administration contexts. In general, disengaged responding was observed across different demographic groups and was not limited to any single group. Students who identified as male accounted for a larger share of rapid responders than their representation in the sample, consistent with the literature (e.g., DeMars et al., 2013; Wise & Kuhfeld, 2021). We also observed differences by administration context. For example, rapid responding was more common in less supervised, district-based group administration contexts, which is consistent with behavior of students in proctored and more controlled environments (Alahmadi & DeMars, 2022; Barry & Finney, 2009; Schaefer & Finney, 2025).
Our results underscore the importance of accounting for respondent effort when interpreting risk assessment results. Practitioners should not assume that a risk assessment score is an error-free reflection of a student’s situation. Practitioners need to be aware of how the student responded to the items. Moreover, we call for practitioners to integrate response process data, such as item response timing, into assessment scoring or reports. For example, if a student’s average response time is extremely low, the WARNS report could flag this student’s responses and recommend caution regarding score interpretation. Implementing an effort flag would allow school personnel to treat those results with skepticism and follow up with a conversation with the student. In fact, the WARNS system currently has a section for such comments from the school personnel. That is, personnel can note if they think the student did not take the assessment seriously or had odd assessment behavior. However, that option is rarely used (<10%). This flag would be helpful at the individual level, as it would allow for subsequent gathering of data to inform student support. The flag would also be helpful at the aggregate level when trying to accurately summarize risk at the group level (schools, districts, etc.). For example, Wise and Kuhfeld (2021) have advocated for motivation filtering or removing data from low-effort examinees when producing aggregate-level results. Motivation filtering leads to more valid conclusions because construct irrelevant variance reflecting low effort has been removed. In fact, filtering out disengaged responses has been shown to improve correlations between test scores and external criteria, meaning the assessment does a better job of reflecting true ability or needs once the noise of rapid responding is reduced. In a risk assessment context, such filtering should be explored at the school or district level to understand how a filtering practice may change the risk rates at that level. That is, filtering out low-risk rapid responders who may be high-risk will adjust the low-risk percentages downward to be more accurate possibly at the expense of the high-risk percentage accuracy. What is not captured in this filtering, as we have described, is the fact that some students may straight line responses as rapid responders and be classified as high-risk. We observed this behavior in less than 1% of responses. We note this because careful examination on filtering in a risk context may not be as straightforward as achievement contexts, especially when trying to understand risk at the school or district level.
Implications
Our results have important implications for practitioners using risk assessments to guide interventions. Even a few disengaged responses can distort a student’s risk profile. At the total score level under the two-second rule, rapid responders were more often classified as low risk and less often classified as high risk than students in the full sample. Thus, some students truly at high risk may appear low risk simply because they rushed through the assessment, potentially delaying follow-up and timely intervention despite actual risk (e.g., attendance, behavior, and mental health). We also acknowledge the opposite can happen. In either case (false negative or positive), low-effort responding undermines accuracy and fairness in risk assessments.
Another implication of our results is the importance of interventions to minimize rapid responding (e.g., Finney & Pastor, 2025; McFadden & Finney, 2025). This is perhaps the most critical issue at the individual level. Our findings suggest engagement often drops near the end of the assessment, possibly due to fatigue, making real-time effort monitoring valuable. Detecting rapid responses as they occur would allow staff to intervene immediately. For example, a counselor could remind a student to slow down, or the computer could prompt them after consecutive quick clicks (e.g., Wise et al., 2019). Effort-monitoring in tools like WARNS could improve the validity of score interpretations and would be low cost. More importantly, it may increase the accuracy of the information for an individual student, resulting in more appropriate next steps to support that student. This is where accuracy matters the most.
Limitations
Several limitations warrant caution. First, the sample may limit generalizability. Our data came from high school students in one U.S. region completing the WARNS, reflecting older adolescent behaviors. Findings may not extend to younger students or other populations. Regional factors such as school culture or administration practices could also influence engagement.
Second, we defined low-effort responding using response times. Although widely used, time-based thresholds involve trade-offs between false positives and negatives. We applied liberal criteria (e.g., NT30, two-second rule) to avoid mislabeling rapid responders as effortful. Other indicators such as straightlining could be examined. Moreover, asking students to self-report expended effort typically identifies students who did not respond thoughtfully but did not rapidly respond (Schaefer & Finney, 2025). Future WARNS administrations should consider asking students if their responses were thoughtful and valid. In short, we applied one behavioral method of identifying disengaged responders (i.e., rapid responding), and while grounded in established methods, some misclassification is possible thus the prevalence estimates should be interpreted as approximate (Wise, 2017).
Third, administration conditions varied by school, introducing uncontrolled variability. Setting differences (quiet office vs. group) and instructions can affect motivation (Alahmadi & DeMars, 2022; Barry & Finney, 2009; Schaefer & Finney, 2025). We do not know the extent to which students were supervised individually, in groups, or remotely. This leaves questions to explore about how different administration protocols influence or at least are related to disengagement.
Fourth, other validity threats besides rapid responding remain, such as deliberate under- or over-reporting of risks. For example, a student might downplay substance use yet appear engaged by timing metrics. Alternatively, a student may exaggerate risk behaviors (e.g., reporting higher levels of stress or substance use than actually experienced) in order to gain attention or access to additional support or resources. Such biases (e.g., social desirability, attention-seeking) are beyond response-time detection.
Future Directions
Our next step is to examine rapid responding in middle school students. Early adolescence (ages ∼11–14) may pose different challenges for self-report assessments. Middle schoolers might try harder to please adults, reducing disengagement compared to high school students (Soland, 2018a; Soland & Kuhfeld, 2019). Replication is needed for generalizability. Because middle school is critical for catching emerging attendance or behavior issues, ensuring valid risk data for this group is essential. This work will extend WARNS-like tools for early intervention.
Another avenue is refining detection methods for non-achievement scales. We used the two-second rule, but optimal thresholds may vary by question type or age group. Future studies should calibrate thresholds by context and explore machine-learning approaches to identify aberrant patterns beyond a single cutoff. Combining methods could reduce false positives and negatives, improving corrective actions.
Finally, research should explore strategies to prevent disengagement. Interventions could occur before or during assessments. For example, asking students to commit to full effort (Finney et al., 2025) or adding a pre-survey script emphasizing honest responses may boost engagement. Real-time monitoring could prompt students when rapid responding is detected (Wise et al., 2019). Piloting these approaches in schools and evaluating their impact on engagement and risk assessment outcomes would be valuable.
In conclusion, our work highlights a subtle but important threat to the validity of youth risk assessments. Disengaged responding can distort the identification of students at-risk or in need of support. Our study found that although most students put forth effort on the WARNS, a small proportion did not, and those few cases can undermine the accuracy of the results. Failing to account for rapid responding could lead to misclassification and possible misallocated resources – either students in need not receiving support or, conversely, interventions being triggered by inaccurate data. We offered suggestions for next steps for research and practice. Specifically, by extending research to different age groups, improving methods to detect and prevent low-effort responses, and integrating these practices into assessment administration, we can strengthen the effectiveness of risk assessments. The long-term goal of such work is to ensure that every student’s assessment truly reflects their circumstances, so that educators can make informed decisions and direct support to where it’s needed. In the fight against chronic absenteeism and related youth risks, maintaining the integrity of assessment data is crucial – and that means making sure disengaged responses do not lead to distorted risks.
Footnotes
Ethical Considerations
This study was conducted in accordance with ethical standards for research involving human participants. Institutional Review Board deemed the work exempt given this was archival data.
Funding
The authors disclosed receipt of the following financial support for the research, authorship, and/or publication of this article: The research reported here was supported by the Institute of Education Sciences, U.S. Department of Education, through Grant R305A210087 to Washington State University. The opinions expressed are those of the authors and do not represent views of the Institute or the U.S. Department of Education.
Declaration of Conflicting Interests
The authors declared no potential conflicts of interest with respect to the research, authorship, and/or publication of this article.
Data Availability Statement
The data that support the findings of this study are available from the corresponding author upon reasonable request. Due to privacy and confidentiality agreements, some restrictions may apply.