
Abstract
This study validated the Mandarin-Chinese Teacher Well-Being Scale (TWBS) and developed a context-specific extension (CS-TWBS) to capture culturally grounded dimensions of teacher well-being in China. Two studies were conducted with samples of in-service and former Chinese teachers. Study 1 evaluated the psychometric properties of the translated TWBS using exploratory and confirmatory factor analyses, reliability testing, and measurement invariance analyses. A bifactor model provided the best fit, supporting a predominantly unidimensional structure reflecting general teacher well-being. Study 2 developed and validated the CS-TWBS through cognitive interviews and psychometric testing. The CS-TWBS showed strong internal consistency, clear factorial structure, and expected associations with flourishing, burnout, and job stress. Together, the Mandarin-Chinese TWBS and CS-TWBS provide psychometrically sound and culturally appropriate instruments for assessing teacher well-being in Chinese educational settings and for informing targeted interventions.
Keywords
Introduction
Teacher well-being has attracted increasing scholarly attention due to its association with both teacher functioning and student development. At the teacher level, teacher well-being has been linked to greater job satisfaction, lower occupational stress, reduced burnout, and lower intentions to leave the profession (Collie, 2023; Gao et al., 2025; Klassen & Chiu, 2010). These outcomes are important given growing concerns about teacher workload and retention across many education systems. Beyond teacher outcomes, extensive research has shown that teacher well-being also has implications for classroom processes and student learning. Teachers who experience higher well-being tend to demonstrate greater instructional quality and teaching effectiveness, and report more supportive relationships with students (Aldrup et al., 2018; Harrison et al., 2023; Klusmann et al., 2008). These classroom practices are in turn associated with higher levels of student engagement, improved academic achievement, and stronger social-emotional development (Granziera et al., 2023; Jennings & Greenberg, 2009; Klusmann et al., 2016; Wang et al., 2021). Such patterns have been documented across school levels. In primary school settings, teacher well-being plays an important role in shaping early teacher-student relationships and students’ socio-emotional adjustment (Aldrup et al., 2018; Jennings & Greenberg, 2009). Within the secondary school context, as academic pressures intensify and the role of teachers becomes increasingly professionalised, the correlation between teacher well-being and both teaching quality and student academic outcomes has grown significantly stronger (Granziera et al., 2023; Klusmann et al., 2008). In primary and secondary contexts, teacher well-being serves as an upstream condition that shapes the quality of the educational environment experienced by students. This perspective has been thoroughly substantiated in the literature across cultures (Granziera et al., 2023; Wang et al., 2021), which highlights the importance of accurately measuring teacher well-being.
Contemporary frameworks conceptualise teacher well-being as multidimensional flourishing that extends beyond the absence of stress and burnout (Diener et al., 2010; Ryan & Deci, 2001; Ryff, 1989; Seligman, 2011). These frameworks emphasise positive functioning, including individuals’ sense of purpose, meaningful engagement in valued activities, and satisfaction of basic psychological needs. In educational contexts, such perspectives suggest that teacher well-being reflects not only the absence of negative states such as stress or exhaustion, but also teachers’ experiences of professional fulfilment, engagement in teaching, and feelings of competence, autonomy, and connectedness within school environments (Curren et al., 2024; Ryan & Deci, 2001).
Despite the established importance of teacher well-being, measuring it remains challenging. A systematic review by Fox et al. (2023) identified considerable heterogeneity in both the conceptualisation and operationalisation of teacher well-being, with many studies relying primarily on deficit-oriented constructs such as stress or burnout. As a result, existing measures often capture negative aspects of teachers’ work experience while overlooking broader dimensions of positive functioning. In response to this gap, several teacher-specific instruments have been developed to assess well-being within the professional context of teaching. One widely used instrument is the Teacher Well-Being Scale (TWBS; Collie et al., 2015), which assesses three dimensions of teacher well-being: workload well-being, organisational well-being, and student interaction well-being. By focusing on teachers’ experience within their professional environment, the TWBS provides a contextually grounded assessment of teacher well-being and has demonstrated strong reliability (α = .82–.85), good model fit (CFI = .94, RMSEA = .055), and expected associations with related constructs such as job stress, job satisfaction, and general well-being (r = −.49, .65, .48).
However, the experience and expression of well-being may vary across contexts (Diener et al., 2010). Cross-cultural evidence suggests that societal values such as power distance, emotional expression norms, and valuation of individual autonomy or collective harmony can influence both the experience of well-being and the ways individuals interpret and respond to self-report measures (Huppert & So, 2013; Ryan & Deci, 2001). Consequently, instruments developed in one cultural context may not fully capture culturally specific dimensions of well-being when applied in different settings.
These considerations are particularly relevant in Chinese educational contexts. Cultural traditions rooted in collectivist orientations prioritising social harmony and interdependence, while Confucian values emphasise teachers’ moral responsibility and devotion to students (Gao et al., 2025). Such cultural influences may shape how teachers perceive their professional roles and sources of fulfilment in teaching, including relationships with students and colleagues, as well as expectations regarding work commitment. Cultural norms may therefore influence not only the experience of teacher well-being but also how teachers interpret and respond to well-being survey items. Consequently, instruments developed in Western contexts may not fully capture culturally relevant dimensions of teacher well-being when applied in Chinese settings.
Research on teacher well-being in China expanded considerably over the past two decades. Much of this literature, however, has been framed through deficit-oriented perspectives focusing primarily on occupational stress and burnout (Cheng et al., 2023). Studies consistently report high levels of emotional exhaustion among Chinese primary and secondary school teachers, often attributed to factors such as examination-driven accountability systems (Zhao et al., 2015), heavy workloads, and extensive administrative demands associated with ongoing educational reforms (Cheng et al., 2023; Gao et al., 2025). While this body of work has provided important insights into the challenges faced by Chinese teachers, emerging studies have begun to highlight positive aspects of teacher well-being. For example, professional identity rooted in Confucian ideals of the teacher as a moral educator, supportive collegial relationships, and strong commitment to students’ development have been identified as meaningful sources of flourishing (Gao et al., 2025). Nevertheless, measurement approaches in this context have largely relied on instruments adapted from Western burnout or stress frameworks, raising questions about whether existing tools adequately capture the broader and culturally embedded dimensions of well-being experience by Chinese teachers.
Current Research
The present study comprised two complementary phases aimed at validating and extending teacher well-being measurement in the Chinese educational contexts. Study 1 adapted and validated the TWBS for Chinese teachers through forward-backward translation and cognitive interviews (n = 12) to evaluate item appropriateness and identify culturally salient dimensions. Online surveys (N = 653) assessed internal consistency and factorial structure through exploratory factor analysis (EFA) and confirmatory factor analysis (CFA), and measurement invariance across demographic groups. Study 2 (N = 653) developed the Context-Specific Teacher Well-Being Scale (CS-TWBS) based on cognitive interview responses, generating 11 items that collectively capture context-specific concerns identified by Chinese teachers (e.g., compensation, work-life balance, policy implementation, professional status, parental involvement, psychological support) as a unidimensional supplement to the TWBS. Study 2 examined the psychometric properties and factorial structure of CS-TWBS, and its associations with job stress, burnout, and flourishing. Together, these studies provide comprehensive psychometric evidence for a culturally responsive teacher well-being assessment in the Chinese context and contribute to theoretical understanding and practical measurement of teacher well-being across diverse cultural contexts.
Study 1: Validation of the Mandarin-Chinese Teacher Well-Being Scale
Method
Study 1 translated, culturally adapted, and validated the Teacher Well-Being Scale (TWBS; Collie et al., 2015) for use with Chinese teachers through: (a) translation and cultural adaptation via forward-backward translation and cognitive interviews, and (b) psychometric evaluation through a large-scale survey.
Cross-Cultural Translation and Adaptation
Translation and cultural adaptation of the Teacher Well-Being Scale (TWBS) followed a structured two-stage process designed to ensure semantic, conceptual, and cultural equivalence between the English and Mandarin-Chinese versions.
Three bilingual translators were involved across the two translation phases, following the forward-backward translation approach outlined by Brislin (1970). Two independent forward translations were first produced by bilingual translators who were native Mandarin Chinese speakers with advanced English proficiency and academic background in educational psychology; one of the two forward translators additionally had expertise in psychometric scale development and validation. Each translator independently translated all 16 TWBS items from English into Mandarin Chinese. The two translated versions were then compared item by item. Differences in wording, nuance, and implied meaning were discussed until consensus was reached on a reconciled version. Of the 16 items, 14 were considered equivalent across the two forward translations without modification, while two items required minor revisions following discussion to ensure semantic accuracy and naturalness of expression in Chinese. All decisions regarding item wording were documented throughout this process. Formal interrater agreement statistics (e.g., kappa) were not computed, as translation decisions were reached through structured consensus discussion rather than independent coding.
A third independent bilingual translator, with expertise in Chinese-English translation and interpretation, who had not been involved in the forward translation and was blinded to the original English version, back-translated the preliminary Mandarin-Chinese TWBS into English. All three translators then reviewed the original and back-translated version item by item to assess equivalence. No substantial discrepancies were identified at this stage. Decisions at each stage were documented in writing.
Following translation, cognitive interviews were conducted to evaluate item comprehension, cultural appropriateness, and response processes at the individual respondent level. Twelve Chinese teachers participated in the cognitive interview stage, consistent with recommendations that cognitive pretesting typically involves small samples (e.g., 5 to 15 participants) sufficient to identify comprehension issues in survey instruments (Willis, 2005). Participants indicated a preference for written asynchronous responses, which also offered the practical advantage of reducing evaluation apprehension that may arise when discussing workplace well-being (Tourangeau & Yan, 2007). Participants received the translated TWBS, a structured response booklet with a demographics form, via a Microsoft Word document and provided written responses.
The structured questions addressed five domains: (a) overall representativeness of the scale for Chinese teachers’ experiences, (b) identification of confusing items, (c) evaluation of item phrasing alignment with Chinese linguistic conventions and cultural norms, (d) identification of missing dimensions important to teacher well-being in the Chinese context, and (e) general suggestions regarding scale content and wording. Participant responses were reviewed and thematically examined by the research team to identify potential comprehension or wording problems. Two items were identified as presenting comprehension difficulties due to ambiguous phrasing in the Chinese context. These items were revised to improve clarity while maintaining the original semantic content. The remaining 14 items required no modification. The full bilingual Mandarin-Chinese TWBS is presented in Appendix A.
Responses to question (d) additionally identified several context-specific concerns not captured by the original TWBS, including work-life balance (n = 5 participants), implementation of educational policies (n = 4), school-provided support (n = 4), and salary and benefits (n = 2). These themes informed the development of context-specific items in Study 2, where they were operationalised as a unidimensional measure (see Study 2 Method).
Participants and Procedure
Cognitive Interview
Twelve Chinese teachers (n = 12; 9 female, 3 male; ages 21–50 years), including eight in-service teachers (66.7%) and four former teachers (33.3%) participated. Participants taught (or used to teach) at primary (n = 5), middle (n = 3), or high schools (n = 4), mostly in public (n = 10) and urban settings (n = 10). Teaching experience averaged 6.75 years (SD = 4.40) for in-service teachers and 3.25 years (SD = 3.30) for former teachers. Participants were recruited using snowball sampling through existing contacts; additional recruitment occurred through intermediaries to protect privacy. Participants received materials (translated TWBS, structured questions, demographics) via a Microsoft Word document and provided written responses asynchronously.
Online Survey
Participants were 653 Chinese teachers (559 in-service teachers, 94 former teachers) recruited via Xiaohongshu (Rednote), a social media platform enabling access to diverse teacher populations. Twelve participants initially indicated in-service status but also reported a non-zero number of years since leaving the profession, were recoded as former teachers after data screening. The sample included 201 male teachers (30.8%) and 452 female teachers (69.2%), with ages ranging from 21 to over 60 years (93.1% aged 40 years or younger). Teaching experience ranged from less than 1 year to over 30 years. 404 teachers (61.9%) had 5 or fewer years of experience, 173 (26.5%) had 6 to 10 years, and 56 (8.6%) had 11 or more years of experience. One participants did not report teaching experience, and nineteen cases were identified with logically inconsistent values (e.g., reported teaching experience of 30 years for a participant aged 21-30); all twenty were coded as missing and excluded from teaching experience analyses. Participants teach at primary (n = 317, 48.5%), middle (n = 242, 37.1%), or high schools (n = 94, 14.4%), mostly in public (n = 582, 89.1%) and urban (n = 462, 70.8%) settings.
Demographic Characteristics of Participants
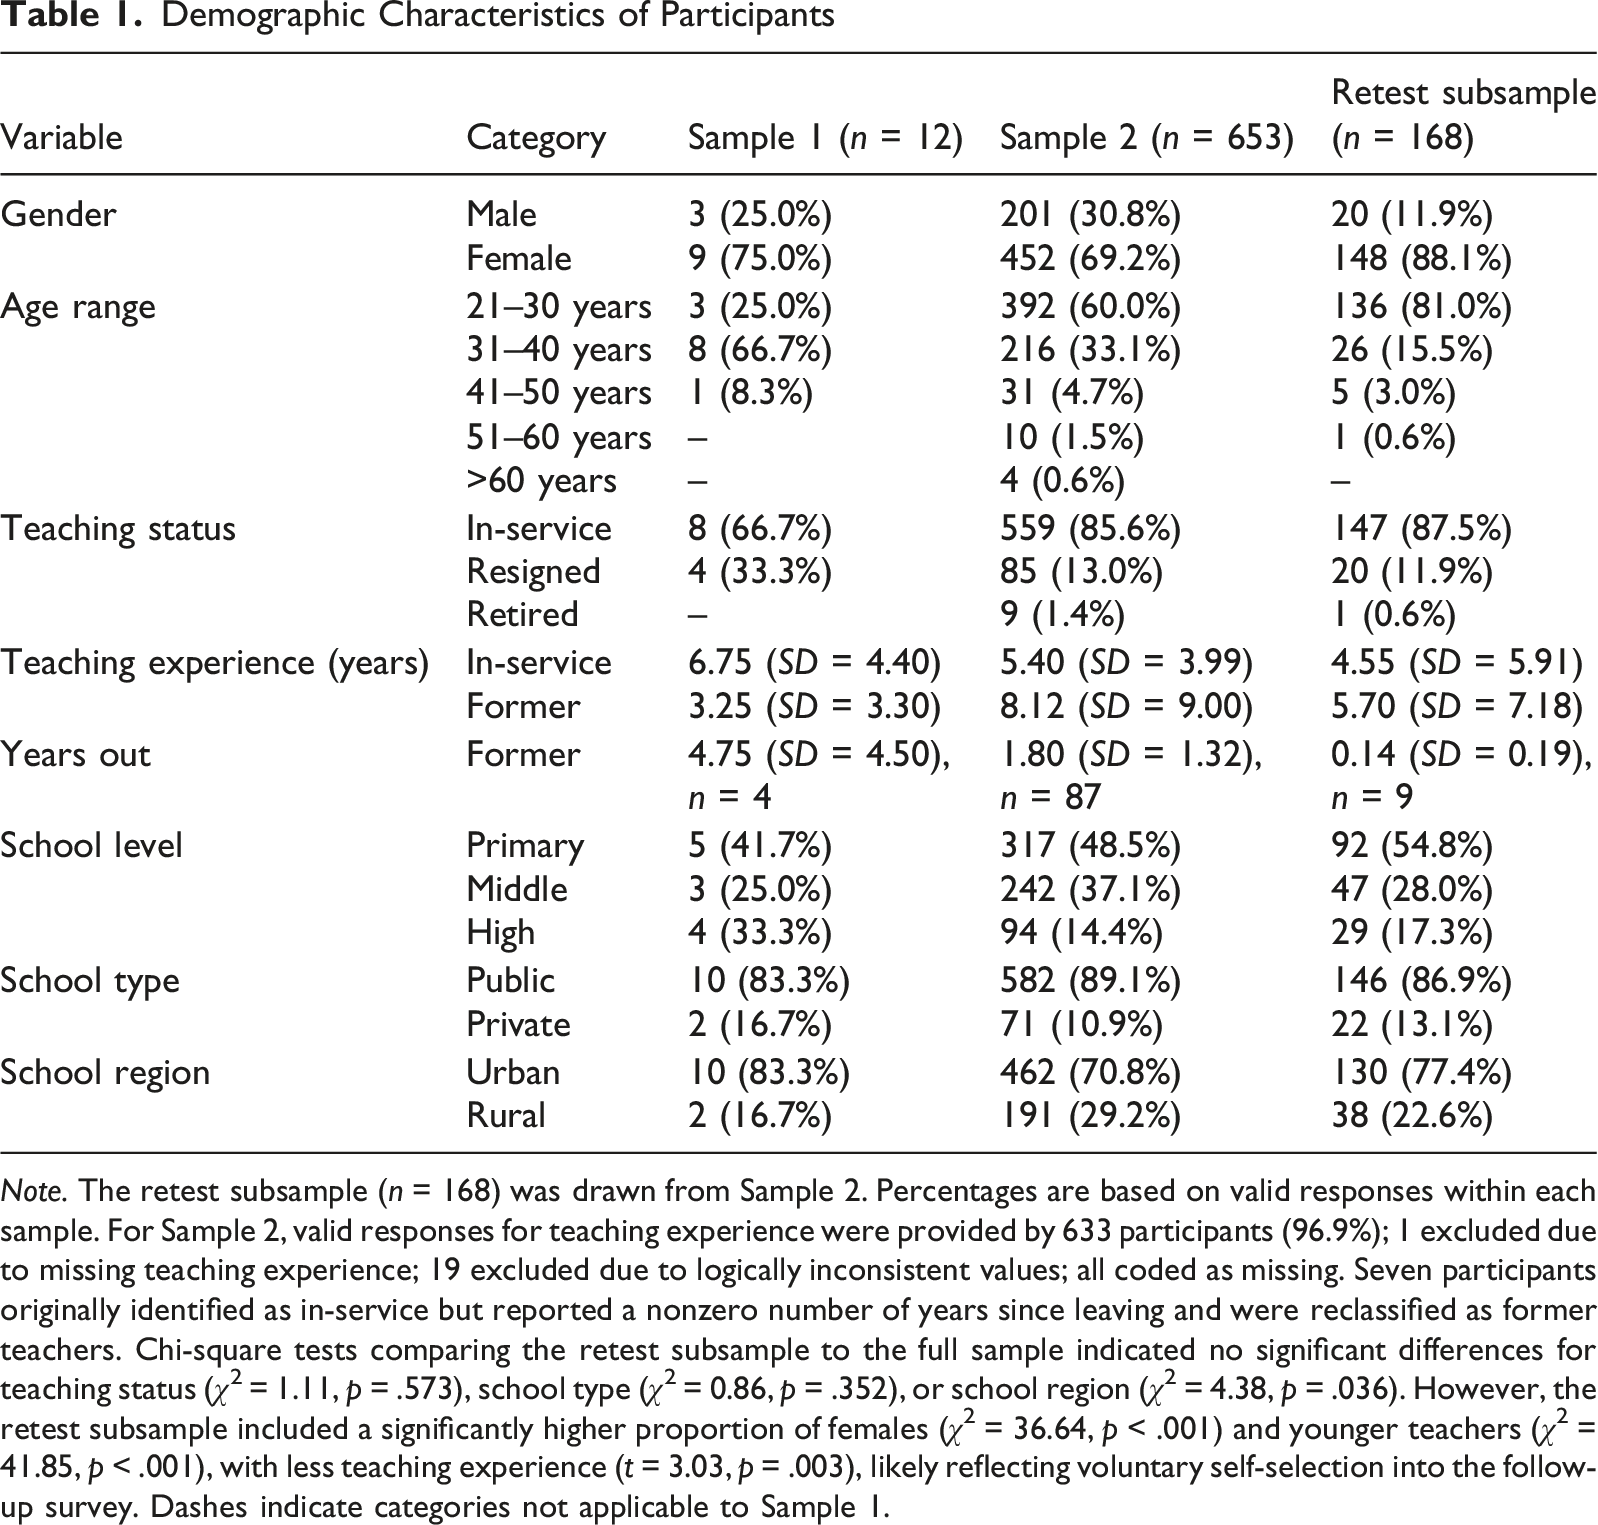
Note. The retest subsample (n = 168) was drawn from Sample 2. Percentages are based on valid responses within each sample. For Sample 2, valid responses for teaching experience were provided by 633 participants (96.9%); 1 excluded due to missing teaching experience; 19 excluded due to logically inconsistent values; all coded as missing. Seven participants originally identified as in-service but reported a nonzero number of years since leaving and were reclassified as former teachers. Chi-square tests comparing the retest subsample to the full sample indicated no significant differences for teaching status (χ2 = 1.11, p = .573), school type (χ2 = 0.86, p = .352), or school region (χ2 = 4.38, p = .036). However, the retest subsample included a significantly higher proportion of females (χ2 = 36.64, p < .001) and younger teachers (χ2 = 41.85, p < .001), with less teaching experience (t = 3.03, p = .003), likely reflecting voluntary self-selection into the follow-up survey. Dashes indicate categories not applicable to Sample 1.
Data were collected from July to September 2025 using Wenjuanxing (www.wjx.cn). The research received ethical approval from the University of Nottingham Research Ethics Committee. All participants provided informed consent.
Test-Retest Reliability
Participants who completed the initial survey were invited to voluntarily complete the Mandarin-Chinese TWBS a second time approximately 2 weeks (14 days) after their first response. The retest survey link was sent to each participant individually 14 days after their initial response, and most participants completed the retest within 1 day of receiving the link. This interval was selected to minimise memory effects while remaining short enough to capture stable well-being scores rather than genuine change (Koo & Li, 2016). To facilitate matching across the two administrations, participants who volunteered for the retest provided their email address at the end of both surveys; email addresses were used solely for matching purposes and were removed from the dataset upon completion of matching to protect participant privacy.
Data Screening
A total of 679 responses were initially received. Data were screened for quality and completeness before analysis. 26 (3.8%) cases were excluded for: (a) completion time was less than 2 minutes (n = 14), suggesting careless or insufficient effort responding (Curran, 2016); (b) suspected duplicate submissions (n = 6); or (c) straightlining (n = 6; Herzog & Bachman, 1981), resulting in 653 valid cases retained for analyses. The overall exclusion rate of 3.8% (26/679) is within acceptable ranges for online survey research (Meade & Craig, 2012).
Additionally, teaching experience data were cross-referenced with reported age to identify implausible values. One participant did not report teaching experience, and nineteen cases were identified with logically inconsistent values. These cases were coded as missing for teaching experience analysis but retained for other analyses where data were valid.
For the test-retest reliability assessment, 172 responses were initially received. Four cases were excluded during the first-stage survey data screening due to quality concerns identified above. The corresponding cases were also removed from the retest dataset to ensure only matched pairs were analysed. This resulted in a final sample of 168 responses used in the test-retest reliability analysis.
Measures
Descriptive Statistics for All Variables
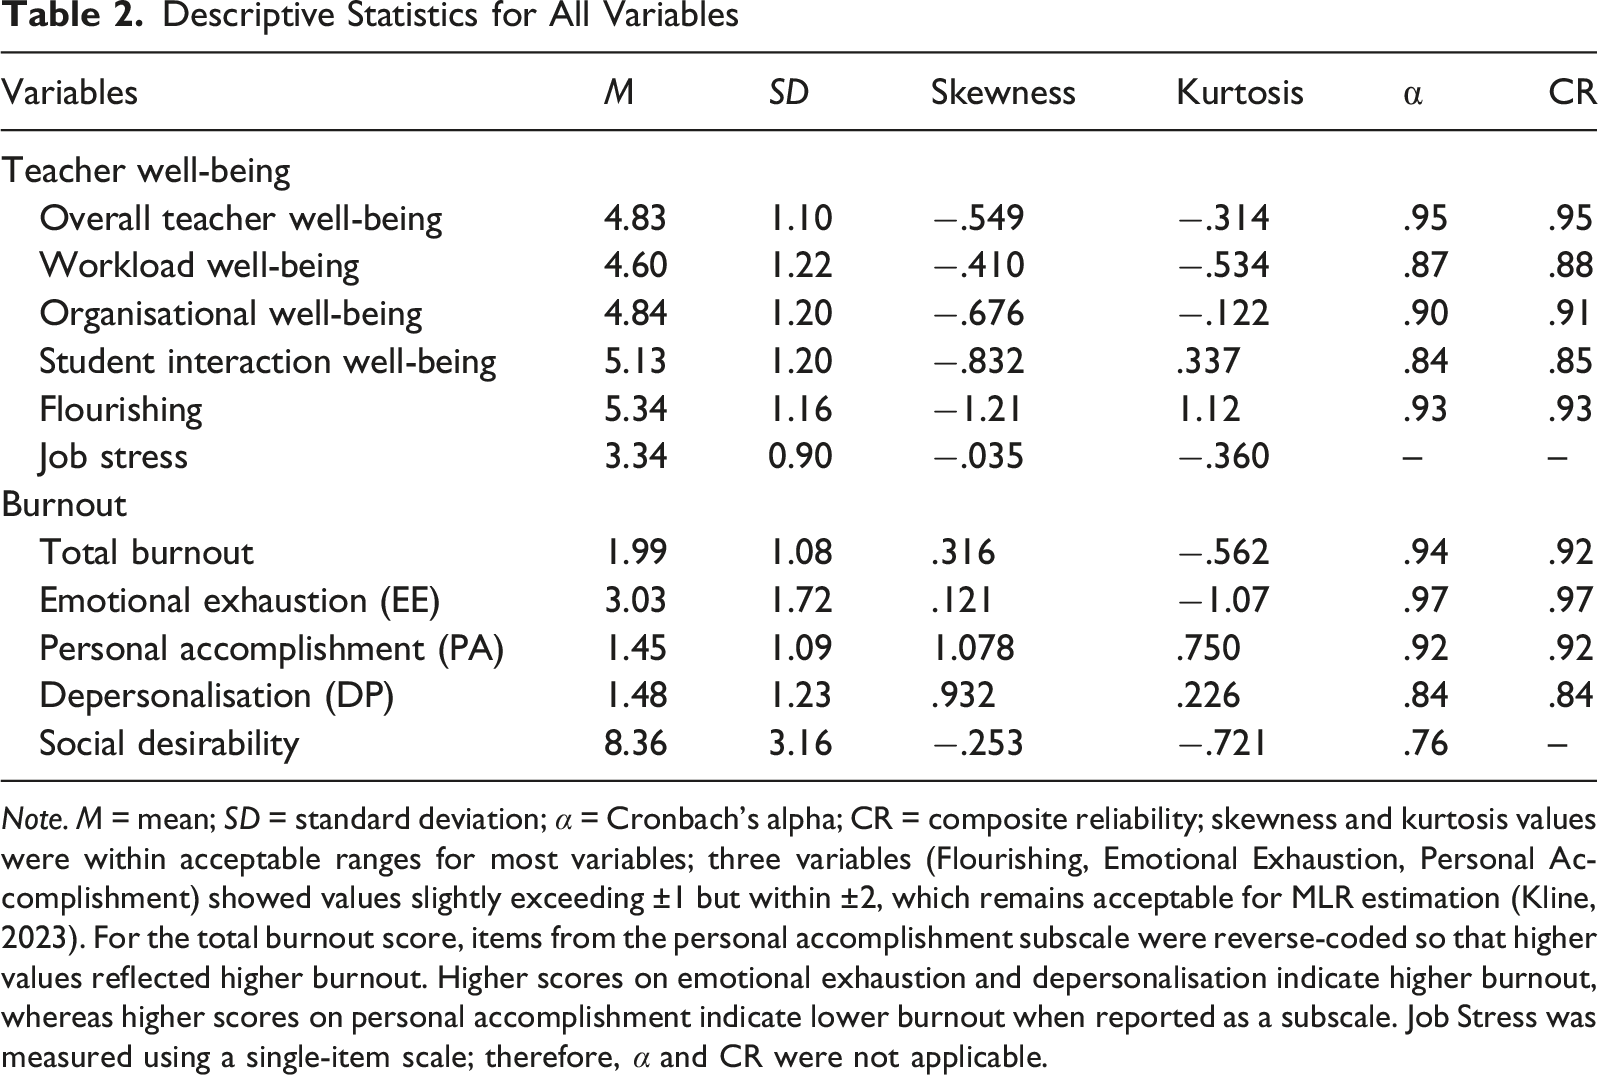
Note. M = mean; SD = standard deviation; α = Cronbach’s alpha; CR = composite reliability; skewness and kurtosis values were within acceptable ranges for most variables; three variables (Flourishing, Emotional Exhaustion, Personal Accomplishment) showed values slightly exceeding ±1 but within ±2, which remains acceptable for MLR estimation (Kline, 2023). For the total burnout score, items from the personal accomplishment subscale were reverse-coded so that higher values reflected higher burnout. Higher scores on emotional exhaustion and depersonalisation indicate higher burnout, whereas higher scores on personal accomplishment indicate lower burnout when reported as a subscale. Job Stress was measured using a single-item scale; therefore, α and CR were not applicable.
The Teacher Well-Being Scale
The TWBS consists of 16 items assessing teachers’ workplace experiences across three dimensions: workload well-being (6 items, e.g., “marking work”), organisational well-being (6 items, e.g., “relations with administrators at my school”), and student interaction well-being (4 items, e.g., “student behaviour”). Items are rated on a 7-point Likert scale ranging from 1 (negatively) to 7 (positively), with higher scores indicating greater teacher well-being. The original TWBS demonstrated strong reliability: α = .82–.85 for subscales, and .89 total (Collie et al., 2015). The Mandarin-Chinese version was developed through the translation and adaptation process described above. Internal consistency in the current sample was excellent (see Table 2).
External Constructs
Three external constructs were examined to evaluate convergent and discriminant patterns: flourishing, job stress, and burnout. Scales used to assess these constructs have shown evidence of reliability and validity (e.g., Boyle et al., 1995; Diener et al., 2010; Tang et al., 2016; Wu et al., 2016). Flourishing was selected as a convergent indicator because teacher well-being, as a positive psychological construct, is theoretically expected to be positively associated with broader eudaimonic well-being (Collie et al., 2015; Diener et al., 2010). The Simplified Chinese Version of Flourishing Scale (FS; Diener et al., 2010; Tang et al., 2016) was used to measure flourishing. The FS comprises 8 items rated on a 7-point Likert scale (1 = strongly disagree to 7 = strongly agree), with higher scores indicating greater psychological well-being. Tang et al. (2016) reported α = .93; in the current sample, α = .93. Job stress was selected because it was used in the original TWBS validation and showed a moderate negative correlation with teacher well-being (r = −.49; Collie et al., 2015). Job stress was measured with a single item: “In general, how stressful do you find being a teacher?” (Boyle et al., 1995), rated from 1 (not stressful) to 5 (extremely stressful), with higher scores indicating greater stress.
For burnout, although related to well-being, it represents a conceptually distinct construct, and prior research has consistently demonstrated negative associations between teacher well-being and burnout (Granziera et al., 2023); therefore, it was selected as a discriminant indicator. The 22-item Chinese Primary and Secondary School Teachers’ Job Burnout Questionnaire (Wu et al., 2016), a Chinese adaptation of the Maslach Burnout Inventory-Educators Survey (MBI-ES; Maslach & Jackson, 1981), was used to measure three dimensions of burnout: emotional exhaustion, personal accomplishment, and depersonalisation. Items are rated from 0 (never) to 6 (daily), with higher scores indicating greater burnout. Wu et al. (2016) reported α = .75–.90 across subscales; in the current sample, α = .84–.97 across subscales.
Social Desirability
The 14-item Chinese Short Form Marlowe-Crowne Social Desirability Scale (Crowne & Marlowe, 1960; Tao et al., 2009) was included to assess whether socially desirable responding substantially influenced self-reported well-being scores. Items are answered dichotomously (Yes/No), with higher scores indicating a greater tendency toward socially desirable responding. Tao et al. (2009) reported α = .66; in the current sample, α = .76.
Demographics
Participants reported their gender, age range, teaching status (in-service, resigned, or retired), teaching experience, school level (primary, middle, or high school), school type (public or private), and school region (urban or rural). Former teachers additionally reported the time since leaving the profession.
Data Analysis
Study 1 examined the psychometric properties of the Mandarin-Chinese TWBS through multiple sources of validity evidence. Consistent with contemporary validity theory, which conceptualises validity as a unitary concept referring to the degree to which evidence supports the intended interpretation of test scores for a proposed use (American Educational Research Association, 2014), validity evidence was gathered from multiple sources: response processes, internal structure, and relations to other variables. Internal consistency and test-retest reliability were also examined. All statistical analyses were conducted using IBM SPSS Statistics 29.0 and R 4.5.0.
Data Screening
Data were screened for normality, outliers, and missing values. Distributional assumptions were examined through skewness and kurtosis values, with values within ±2 considered acceptable for normality (Kline, 2023). Cases with more than 20% missing data on key variables were excluded. All scale items were completed by every participant, as the survey platform required responses to all items before proceeding. Missing data occurred only on demographic variables: seven former teachers did not provide years since leaving the profession, and twenty cases of missing or inconsistent teaching experience data. Full information maximum likelihood (FIML) estimation was therefore applied to handle these missing demographic values in the relevant analyses (Enders & Bandalos, 2001).
Internal Consistency
Cronbach’s alpha (α) and composite reliability (CR) assessed internal consistency, with Cronbach’s alpha coefficient of .70 or higher being considered acceptable (Nunnally & Bernstein, 1994), and CR values of .70 or above were also regarded as adequate indicators of reliability (Hair et al., 2010).
Confirmatory Factor Analysis
Four competing models were compared using confirmatory factor analysis (CFA): (a) three-factor (workload, organisational, and student interaction well-being), (b) two-factor (workload/organisational combined, student interaction separate), (c) single-factor (all items on one general factor), and (d) bifactor (general well-being factor plus three specific factors) (Reise et al., 2010). Model fit was evaluated using the robust CFI, TLI, RMSEA, and SRMR. CFI and TLI values of .95 or above were considered evidence of good fit, and values of .90 or above indicated acceptable fit (Hu & Bentler, 1999; McDonald & Marsh, 1990). RMSEA values of .06 or below were interpreted as evidence of good fit, and values of .08 or below indicated acceptable fit. SRMR values of .08 or below were considered indicative of acceptable fit (Hu & Bentler, 1999).
Relations to Other Variables
Convergent and discriminant patterns were evaluated through correlations with flourishing, job stress, and burnout. Composite scores were computed for each scale and subscale by averaging the relevant item responses, rather than using factor scores derived from the CFA model, to ensure transparency and practical replicability. Positive correlations with flourishing were expected, indicating alignment with related well-being constructs. Negative or weak correlations with job stress and burnout were expected, reflecting the conceptual distinction between well-being and these related but distinct constructs. Correlations of .30 or greater indicated meaningful convergence (Cohen, 1988); correlations below .30 or negative indicated discrimination (Campbell & Fiske, 1959). Magnitudes were interpreted as small (r = .10–.29), medium (r = .30–.49), or large (r = .50 or above).
Measurement Invariance
Measurement invariance was tested across gender (male vs. female), age range (40 years or younger vs. older than 40 years), teaching status (in-service vs. former teachers), teaching experiences (5 years or less, 6 to 10 years, 11 years or more), school level (primary, middle, or high), school type (public vs. private), and school region (urban vs. rural), using configural, metric, and scalar models (Putnick & Bornstein, 2016). Specifically, (a) configural invariance assessed whether the same factor structure held across groups; (b) metric invariance tested whether factor loadings were equivalent across groups; and (c) scalar invariance examined whether both factor loadings and intercepts were equal across groups. Model fit at each stage was evaluated using CFI, TLI, and RMSEA. Changes of .010 or less in CFI and .015 or less in RMSEA were considered evidence of invariance (Chen, 2007; Cheung & Rensvold, 2002).
Test-Retest Reliability
Among 168 participants who completed the TWBS again over 2 weeks, Pearson correlation coefficients were calculated between Time 1 and Time 2 scores to assess the temporal stability. Correlations of .70 or above indicate good test-retest reliability (Koo & Li, 2016).
Social Desirability
Social desirability scores were used to assess the potential influence of socially desirable responding on self-reported well-being scores. Descriptive statistics, reliability coefficients, and bivariate correlations with the TWBS scores were computed to evaluate whether teachers’ self-reported well-being was substantially influenced by socially desirable responding. Correlations below .30 would indicate that social desirability did not substantially confound well-being assessments (Podsakoff et al., 2003).
Results
Descriptive Statistics and Internal Consistency
All variables demonstrated acceptable univariate normality, with skewness and kurtosis values within ±2, indicating approximately normal distributions (Kline, 2023). Descriptive statistics and internal consistency coefficients are presented in Table 2. The Mandarin-Chinese TWBS demonstrated excellent overall reliability (α = .95, CR = .95). Subscale reliability was also excellent: workload well-being (α = .87, CR = .88), organisational well-being (α = .90, CR = .91), and student interaction well-being (α = .84, CR = .85). All coefficients exceeded the .70 threshold (Nunnally & Bernstein, 1994).
Factor Structure
Model Fit Indices for Four Competing Models for the Mandarin-Chinese TWBS
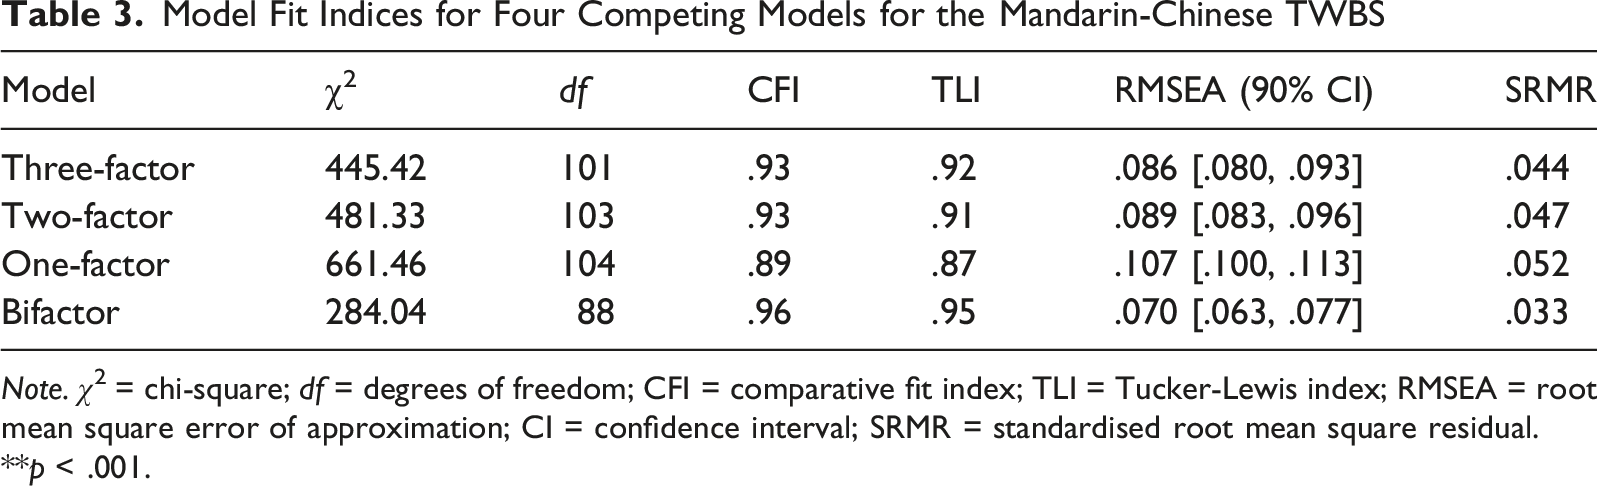
Note. χ2 = chi-square; df = degrees of freedom; CFI = comparative fit index; TLI = Tucker-Lewis index; RMSEA = root mean square error of approximation; CI = confidence interval; SRMR = standardised root mean square residual.
**p < .001.
The original three-factor model (workload, organisational, and student interaction well-being) demonstrated acceptable but slightly poor fit: χ2(101) = 445.42, CFI = .93, TLI = .92, RMSEA = .086 (90% CI [.080, .093]), SRMR = .044. While SRMR indicated good fit (below .08), CFI and TLI fell slightly below the .95, and the RMSEA exceeded the .08 criterion for acceptable fit (Hu & Bentler, 1999). Critically, interfactor correlations were extremely high: workload–organisational r = .96, workload–student interaction r = .86, organisational–student interaction r = .78, suggesting considerable overlap and limited discrimination between factors (Brown, 2015).
Given high interfactor correlations, alternative models were tested. The two-factor model (workload/organisational combined, student interaction separates) showed marginally poorer fit: χ2 (103) = 481.33, CFI = .93, TLI = .91, RMSEA = .089 (90% CI [.083, .096]), SRMR = .047. The single-factor model demonstrated noticeable poorer fit: χ2 (104) = 661.46, CFI = .89, TLI = .87, RMSEA = .107 (90% CI [.100, .113]), SRMR = .052.
The bifactor model (see Figure 1) demonstrated substantially improved fit: χ2 (88) = 284.04, CFI = .96, TLI = .95, RMSEA = .070 (90% CI [.063, .077]), SRMR = .033. This model specified a general teacher well-being factor (all items loaded), alongside three specific factors (workload, organisational, and student interaction well-being) that captured residual variance. All items showed significant loadings on the general factor (λ = .65–.81), indicating strong common variance. However, several specific-factor loadings were weak (λ below .30) or non-significant, suggesting that the specific factors contributed little unique variance beyond the general factor. Chi-square difference testing confirmed the bifactor model fit significantly better than the three-factor model, Δχ2 (13) = 147.72, p < .001. Given the superior fit and theoretical meaningfulness of a general teacher well-being construct, the bifactor model was retained as the best representation of the Mandarin-Chinese TWBS structure. Standardised factor loadings for the bifactor model are reported in Appendix C. Path diagram of the bifactor model of the Mandarin-Chinese TWBS. Note. The model includes one general well-being factor (G) and three orthogonal specific factors: workload well-being (S1), organisational well-being (S2), and student-interaction well-being (S3). Standardised factor loadings are displayed beside each path. All items loaded significantly (p < .001) on the general factor (λ = .65–.81). Several loadings on the specific factors were weak or negative, indicating that the subfactors contributed relatively little unique variance beyond the general factor. Circles represent latent variables, and rectangles represent observed items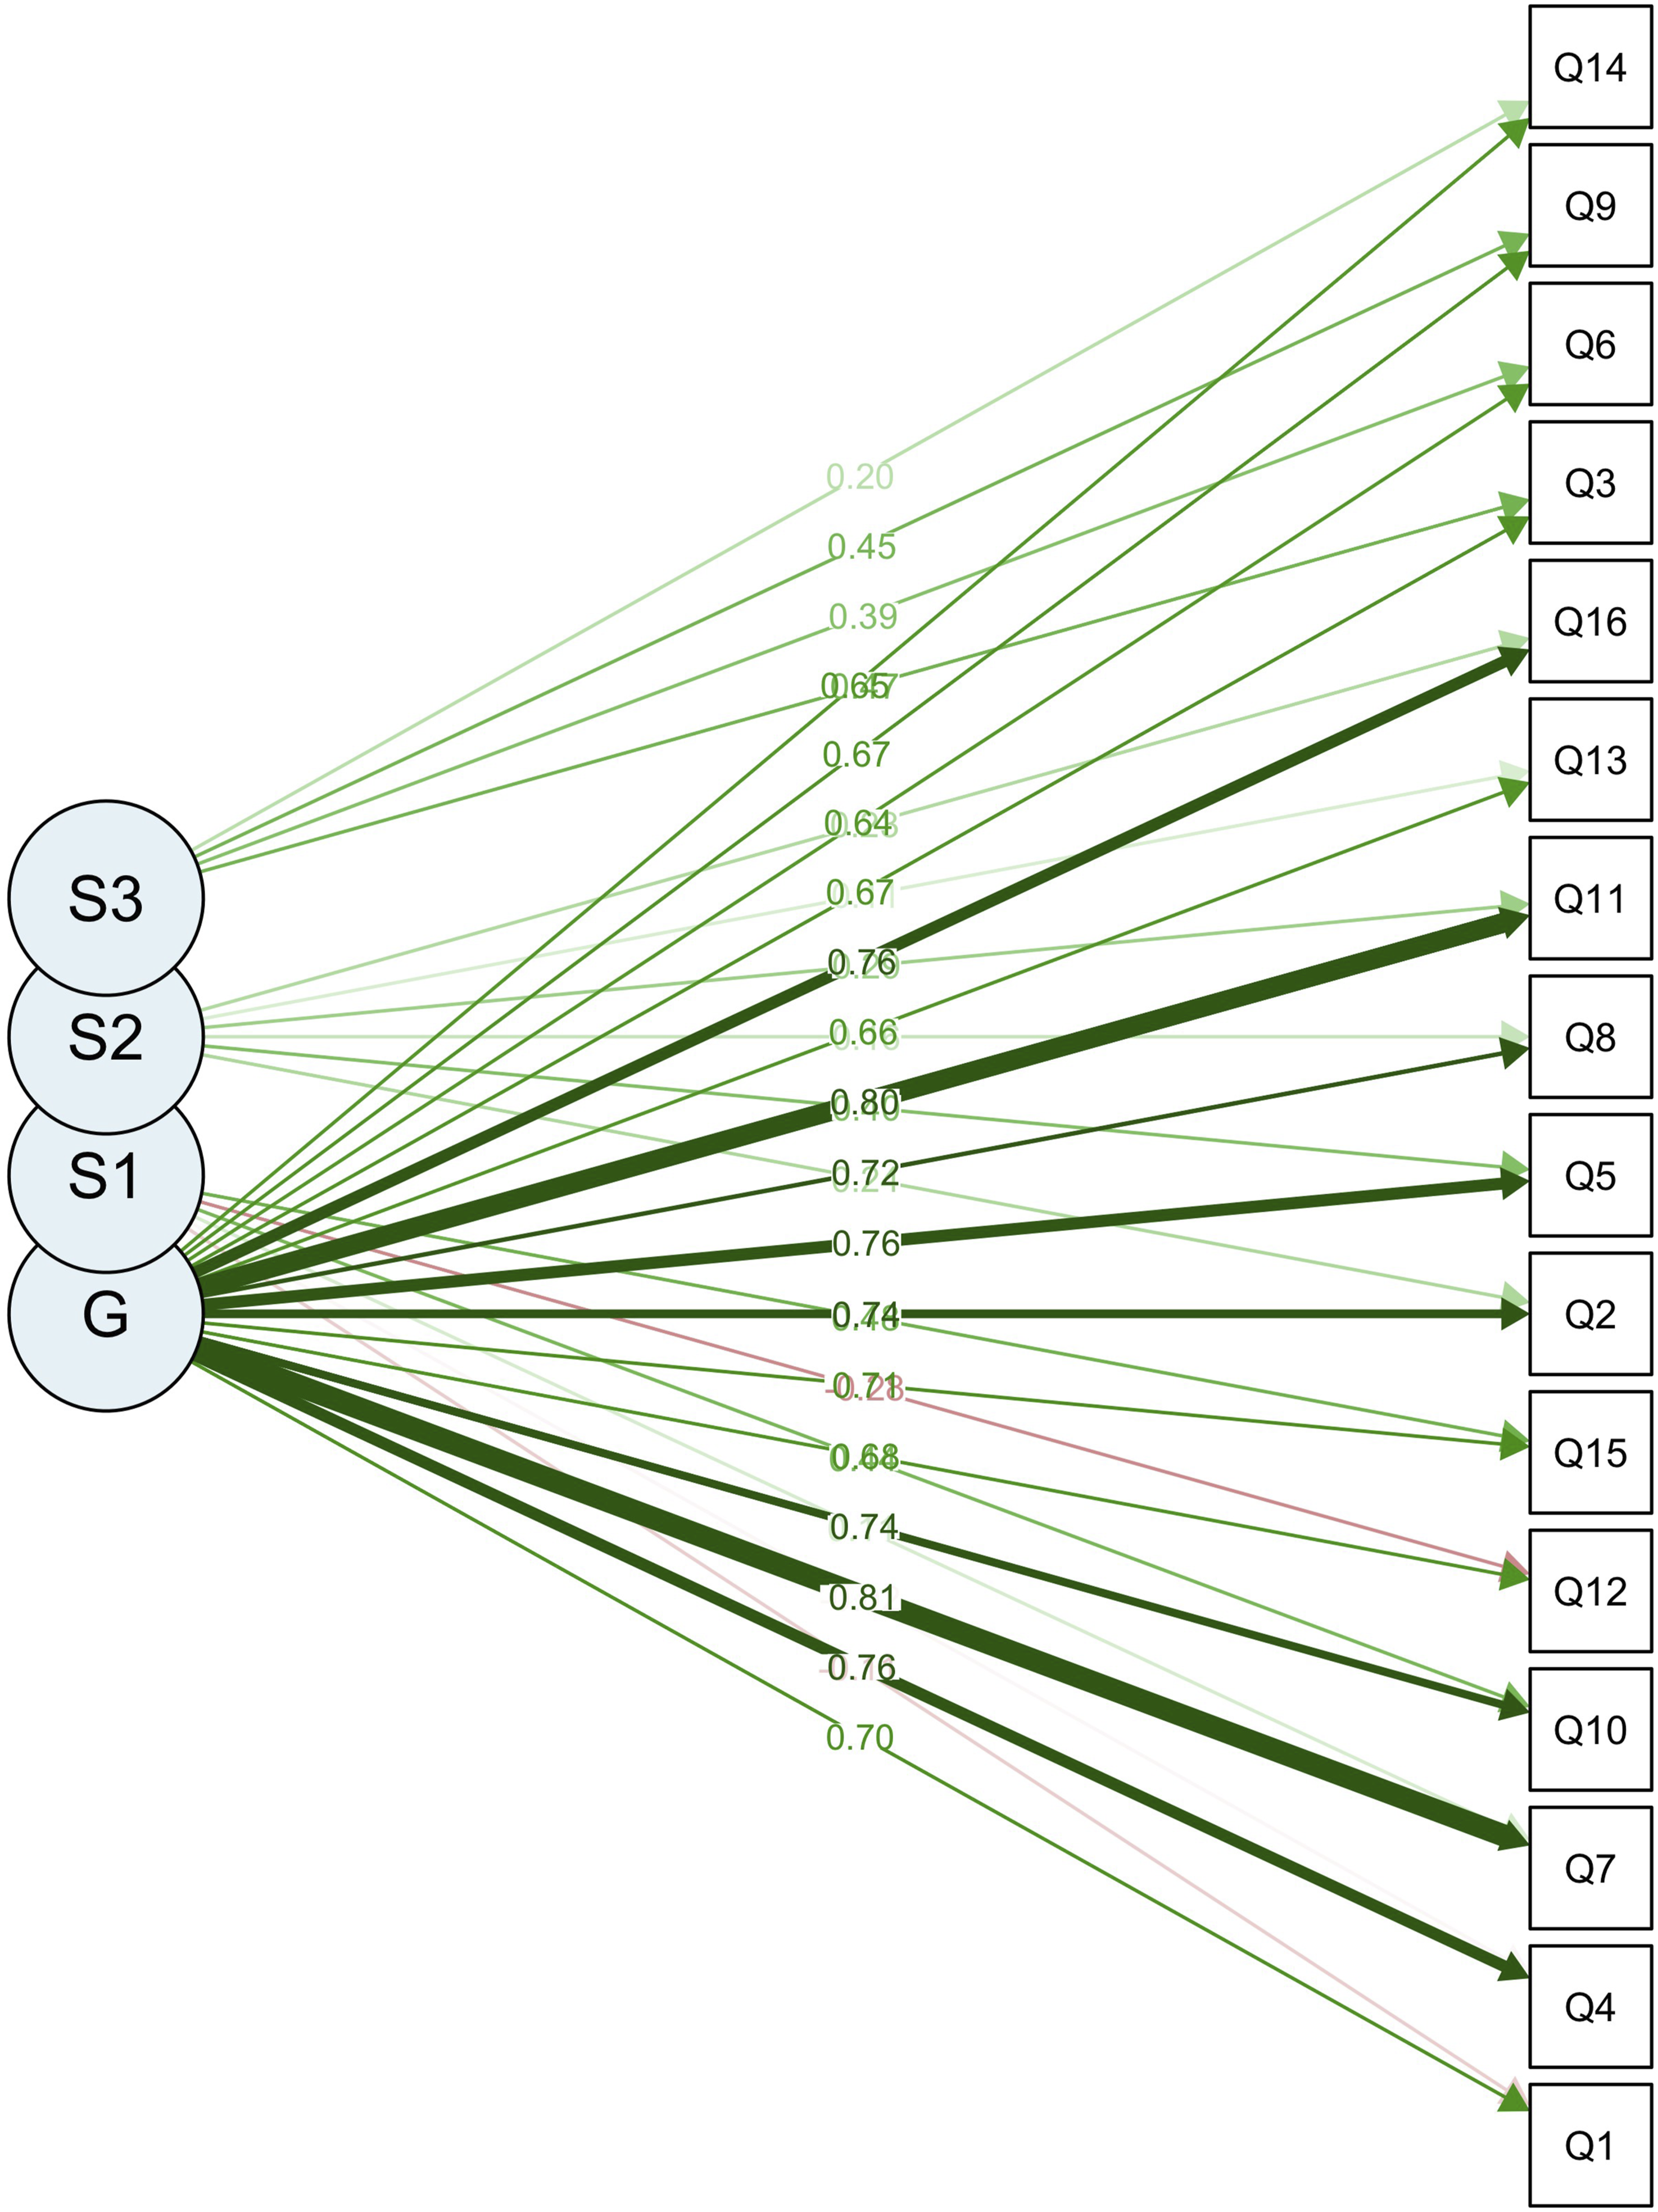
Bifactor Model Evaluation: Unidimensionality
Unidimensionality and Reliability Statistics for the Mandarin-Chinese TWBS
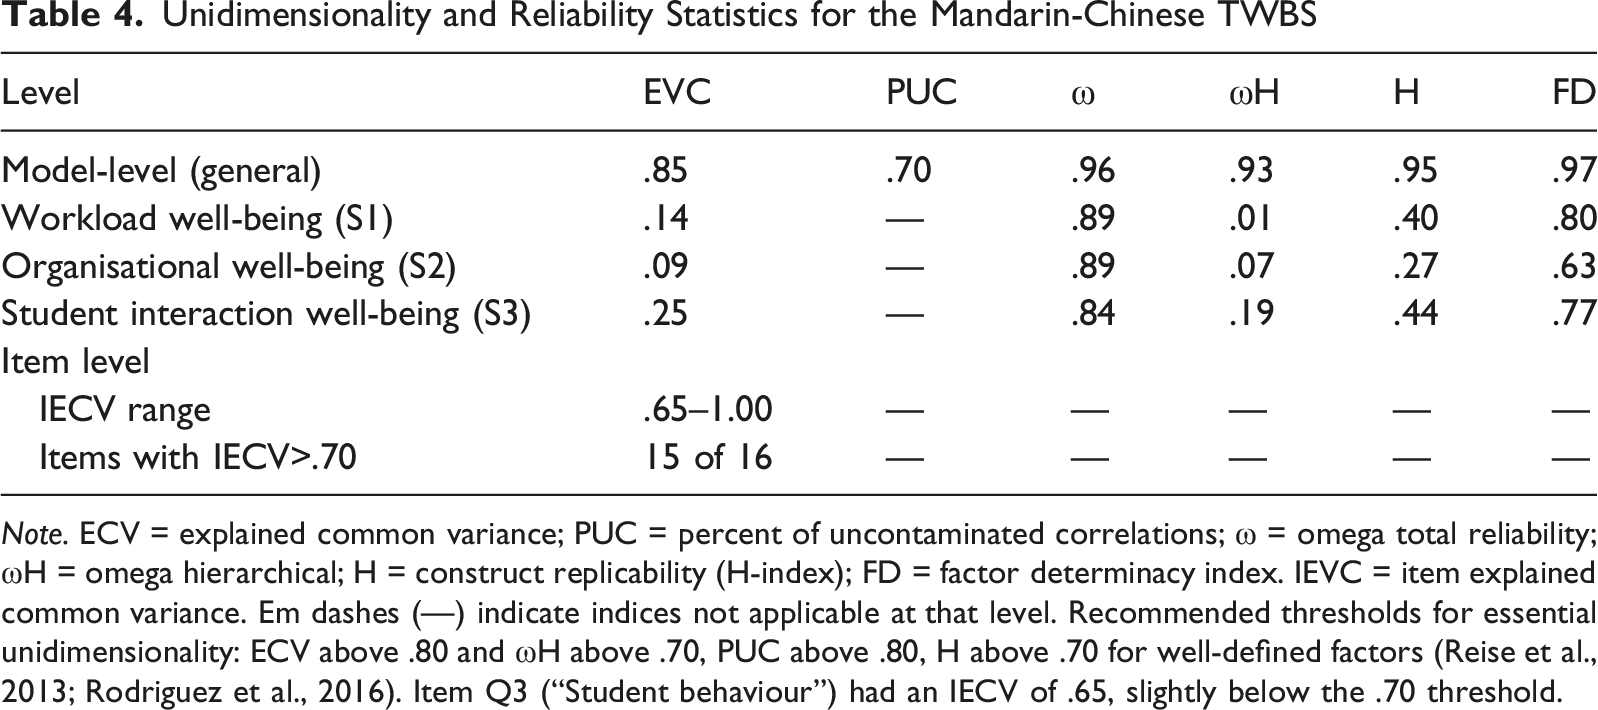
Note. ECV = explained common variance; PUC = percent of uncontaminated correlations; ω = omega total reliability; ωH = omega hierarchical; H = construct replicability (H-index); FD = factor determinacy index. IEVC = item explained common variance. Em dashes (—) indicate indices not applicable at that level. Recommended thresholds for essential unidimensionality: ECV above .80 and ωH above .70, PUC above .80, H above .70 for well-defined factors (Reise et al., 2013; Rodriguez et al., 2016). Item Q3 (“Student behaviour”) had an IECV of .65, slightly below the .70 threshold.
At the item level, IECV values ranged from .65 to 1.00, with 15 of 16 items exceeding .70. Only Q3 (“Student behaviour”) fell slightly below this threshold (IECV = .65), indicating items were predominantly explained by the general factor. These findings support essentially unidimensional interpretation. The total TWBS score reliably indicates overall teacher well-being, while the three subscale scores provide supplementary domain-specific information.
Relations to Other Variables
Correlations Between Teacher Well-Being Scores and External Measures
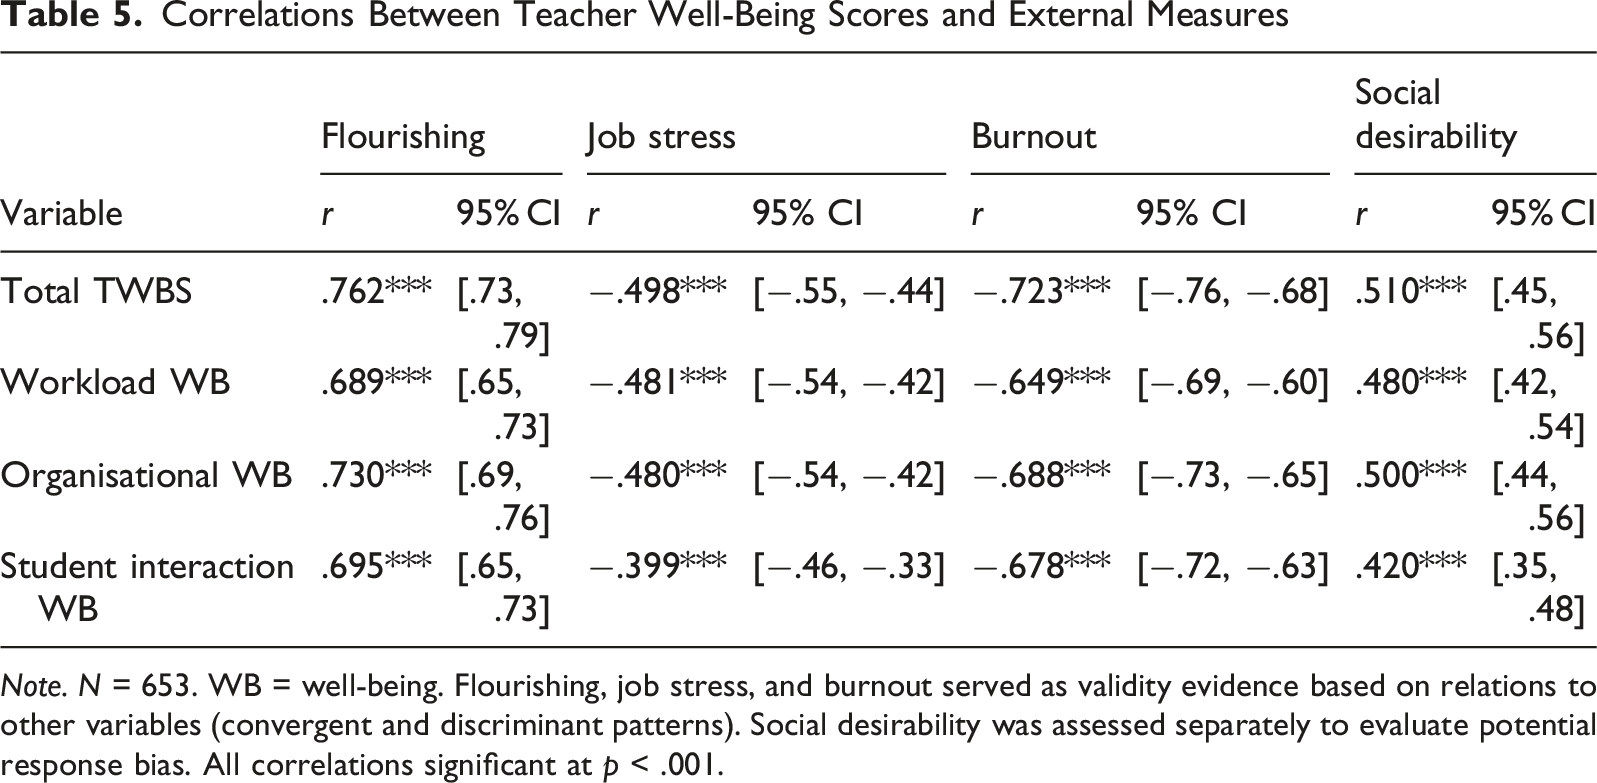
Note. N = 653. WB = well-being. Flourishing, job stress, and burnout served as validity evidence based on relations to other variables (convergent and discriminant patterns). Social desirability was assessed separately to evaluate potential response bias. All correlations significant at p < .001.
Convergent Evidence
The TWBS correlated strongly with flourishing (r = .76, 95% CI [.73, .79], p < .001). All three subscales also showed strong positive correlations with flourishing: workload well-being (r = .69), organisational well-being (r = .73), and student interaction well-being (r = .70), all p < .001.
Discriminant Evidence
The TWBS correlated negatively with job stress (r = −.50, p < .001, 95% CI [–.55, −.44]) and burnout (r = −.72, p < .001, 95% CI [–.76, −.68]). All subscales showed significant negative correlations with both job stress (workload: r = −.48, organisational: r = −.48, student interaction: r = −.40) and burnout (workload: r = −.65, organisational: r = −.69, student interaction: r = −.68), all p < .001. Together, these results provide validity evidence based on relations to other variables, demonstrating appropriate convergence with positive well-being indicators and divergence from negative psychological constructs.
Measurement Invariance
Measurement Invariance Across Groups
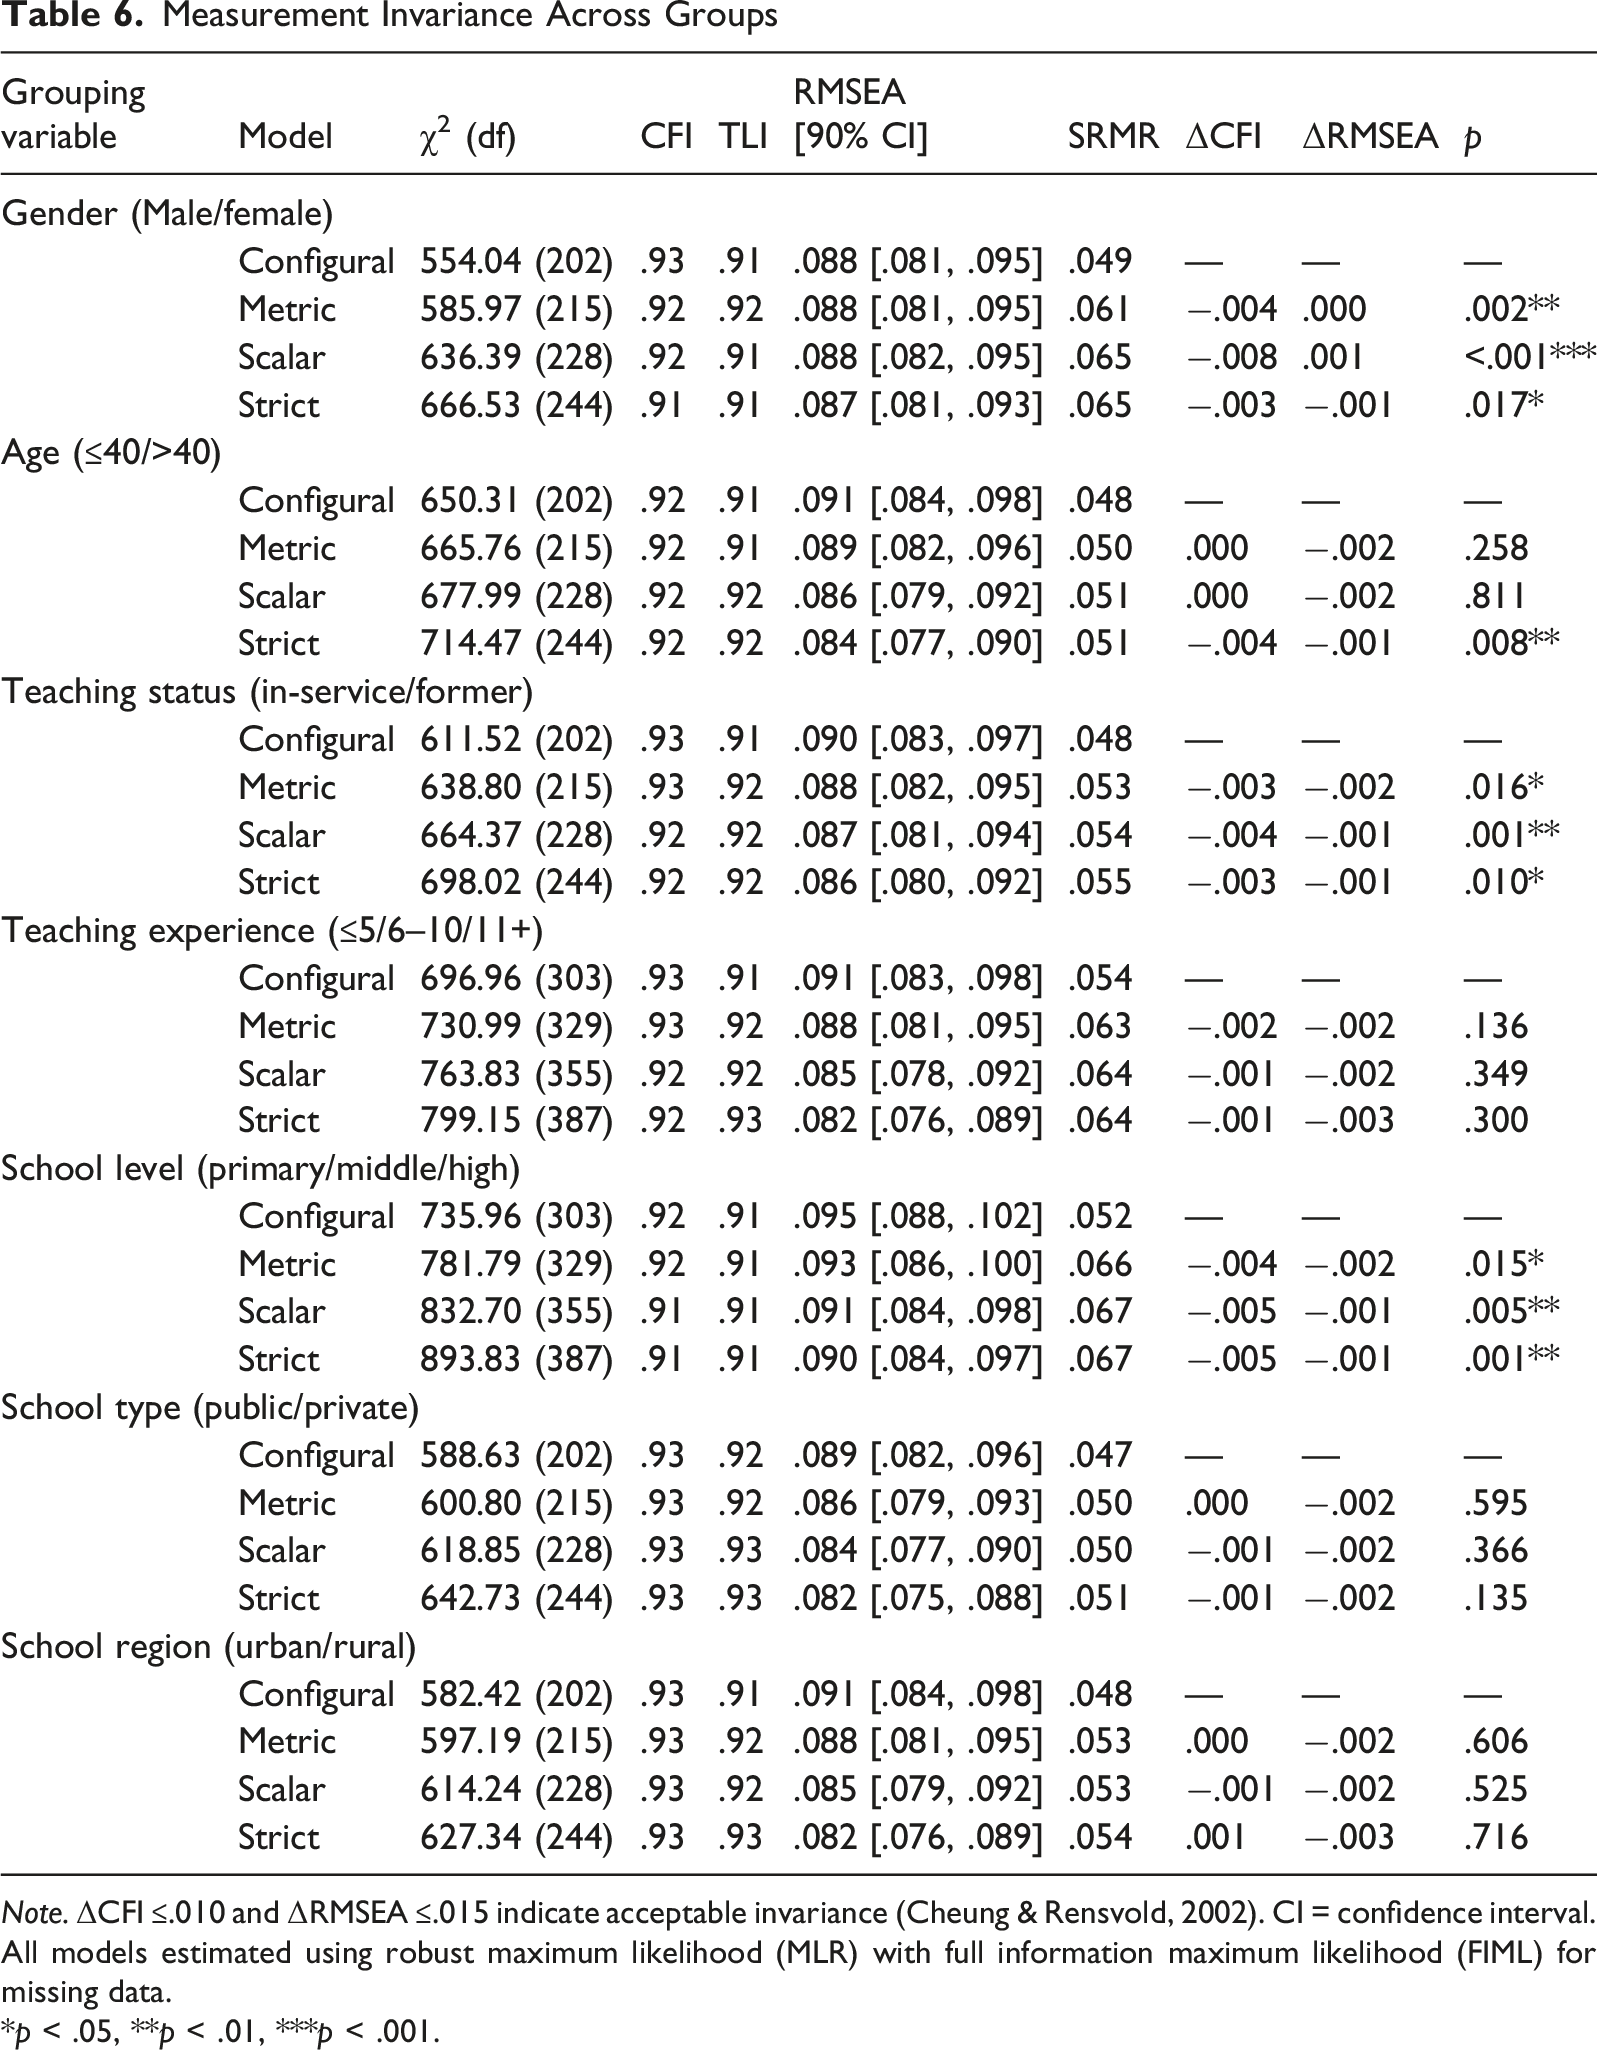
Note. ΔCFI ≤.010 and ΔRMSEA ≤.015 indicate acceptable invariance (Cheung & Rensvold, 2002). CI = confidence interval. All models estimated using robust maximum likelihood (MLR) with full information maximum likelihood (FIML) for missing data.
*p < .05, **p < .01, ***p < .001.
The Mandarin-Chinese TWBS demonstrated full measurement invariance (configural, metric, scalar, and strict) across all seven variables: gender (male, n = 201; female, n = 452), age (40 years or younger, n = 608; older than 40 years, n = 45), teaching status (in-service, n = 559; former, n = 94), teaching experience (5 years or fewer, n = 404; 6–10 years, n = 173; 11 years or more, n = 56), school level (primary, n = 317; middle, n = 242; high, n = 94), school type (public, n = 582; private, n = 71), and school region (urban, n = 462; rural, n = 191). Across all comparisons, changes in CFI ranged from .000 to .008, and changes in RMSEA ranged from .000 to .003, well within established thresholds (Chen, 2007; Cheung & Rensvold, 2002). Although the scaled chi-square difference test indicated a significant model deterioration at the metric, scalar, and strict levels for teaching status, chi-square difference tests are known to be overly sensitive to sample size and tend to reject invariance even when practical fit does not meaningfully worsen (Chen, 2007; Cheung & Rensvold, 2002). Accordingly, invariance decisions were based on changes in CFI and RMSEA, which are less susceptible to sample-size inflation and are recommended as the primary criteria in applied measurement invariance research (Chen, 2007). Twenty participants with missing or inconsistent teaching experience data were excluded from the teaching experience analysis, resulting in n = 633. These findings indicate that the scale measures teacher well-being equivalently across diverse subgroups and supports meaningful group comparisons (Putnick & Bornstein, 2016).
Test-Retest Reliability
Test-Retest Reliability of the Mandarin-Chinese TWBS (n = 168)
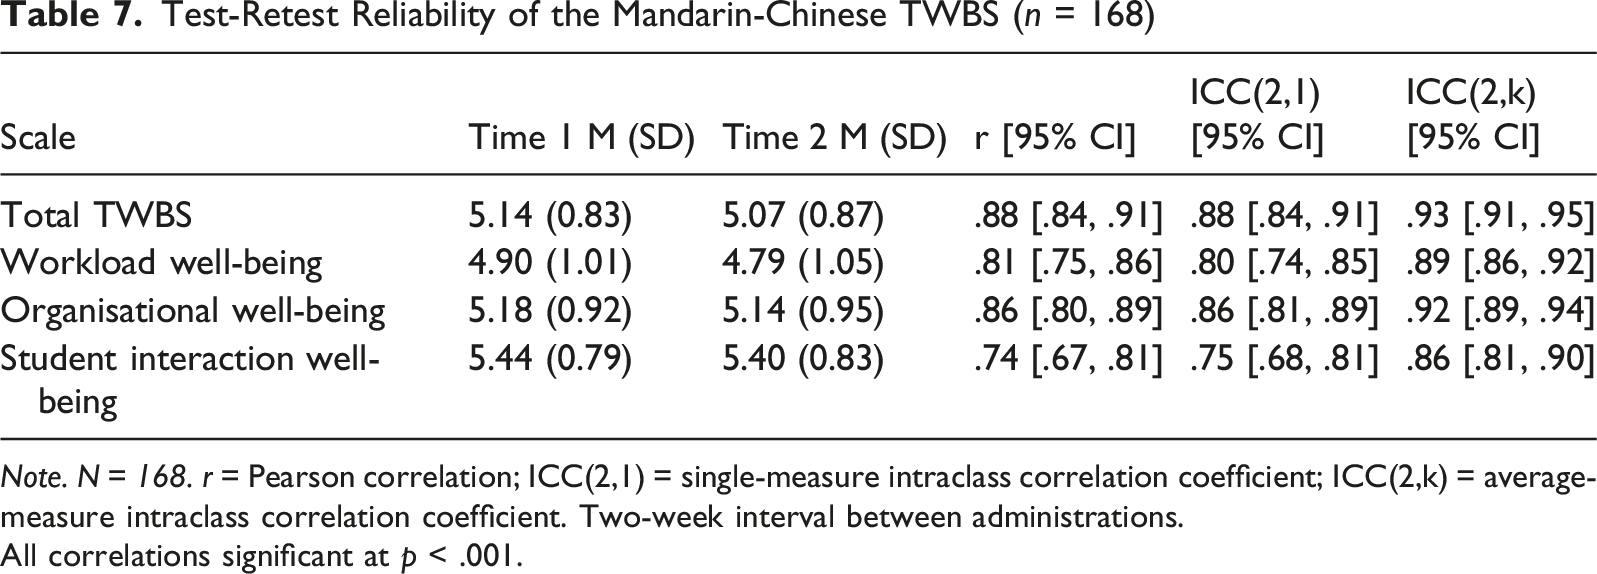
Note. N = 168. r = Pearson correlation; ICC(2,1) = single-measure intraclass correlation coefficient; ICC(2,k) = average-measure intraclass correlation coefficient. Two-week interval between administrations.
All correlations significant at p < .001.
Social Desirability
Correlations between the Chinese-language Short Form of the Marlowe-Crowne Social Desirability Scale (MC-SDS; Tao et al., 2009; M = 8.36, SD = 3.16) and the TWBS assessed response bias (see Table 5). The MC-SDS correlated positively with total TWBS (r = .51, p < .001, 95% CI [.45, .56]), and subscales: workload (r = .48 (95% CI [.42, .54]), organisational (r = .50 (95% CI [.44, .56]), and student interaction (r = .42 (95% CI [.35, .48]), all p < .001. While statistically significant, correlations fell below the .70 threshold for problematic overlap (Paulhus, 1991). This pattern is consistent with previous research in collectivistic cultures, where expressing contentment reflects both genuine well-being and culturally valued self-presentation (Lu & Gilmour, 2004; Ones et al., 1996), supporting the scale’s utility for research purposes.
Study 2: Development and Validation of the Context-Specific Teacher Well-Being Scale
Building on Study 1, Study 2 developed and validated a context-specific extension to the TWBS, capturing aspects of teacher well-being unique to the Chinese educational context. During the cognitive interviews in Study 1, participants were asked: “Are there any aspects of your well-being as a teacher that are important but were not captured by the questions in this scale?” Congnitive interview responses revealed consistent concerns related to the Chinese educational context, workplace dynamics, and societal expectations. Based on these concerns, an 11-item Context-Specific Teacher Well-Being Scale (CS-TWBS) was developed as a unidimensional supplement to the original 16-item TWBS.
Study 2 examined CS-TWBS psychometric properties, its relationship with the TWBS, and whether it provides incremental evidence beyond the original scale. Based on findings, recommendations are provided regarding when researchers should use the TWBS alone, the CS-TWBS alone, or the combined 27-item scale.
Method
Item Development
Eight of twelve interviewed participants identified missing content, generating 20 content units that revealed six primary themes: (a) Work-Life Balance (25%), (b) Compensation and facilities (15%), (c) Career Development and Professional Status (20%), (d) Policy Implementation Burden (20%), (e) External Support Systems (20%), and (f) Professional Identity and Self-Efficacy (10%). These themes were used to guide item generation, ensuring comprehensive coverage of Chinese-specific contextual factors affecting teacher well-being; however, the CS-TWBS was designed from the outset as a unidimensional measure of the overall influence of context-specific factors on teacher well-being, rather than as a multidimensional scale with separate subfactors for each theme.
Based on these themes, 11 items were developed following the TWBS noun-phrase format (e.g., “Work-life balance,” “salary and benefits”), using the same instructional prompt (“Currently, how do the following aspects of being a teacher affect your well-being as a teacher?”) and 7-point Likert scale (1 = Negatively to 7 = Positively). Eleven items are more than sufficient for a unidimensional scale (Worthington & Whittaker, 2006), and this item count allowed representation of the breadth of context-specific concerns identified by teachers while maintaining parsimony for practical use alongside the 16-item TWBS. The CS-TWBS was intended to supplement rather than replace universal TWBS dimensions.
Participants and Procedure
The same 653 Chinese teachers from Study 1 completed the CS-TWBS (demographics in Table 1). Using the same sample allowed direct examination of the relationship between universal (TWBS) and context-specific (CS-TWBS) dimensions and rigorous incremental prediction testing. Data collection conducted in a single online survey via Wenjuanxing: participants completed TWBS, CS-TWBS, and measures of related constructs (approximately 10 minutes total). This order minimises potential fatigue effects on the longer TWBS while allowing comprehensive well-being consideration.
Measures
The Mandarin-Chinese TWBS
The 16-item Mandarin-Chinese TWBS validated in Study 1 assessed workload, organisational, and student interaction well-being (7-point scale: 1 = Negatively to 7 = Positively; α = .95, ω = .96) and was used as the reference measure for CS-TWBS validation and incremental validity assessment in Study 2.
Context-Specific Teacher Well-Being Scale (CS-TWBS)
The 11-item scale measured context-specific dimensions using the same format and 7-point scale (1 = Negatively to 7 = Positively) as TWBS. Items were drawn from six content areas identified during cognitive interviews: work-life balance (1 item), compensation and facilities (2 items), career development and professional status (2 items), policy implementation burden (2 items), external support systems (2 items), and professional identity and self-efficacy (2 items). These content areas guided item development to ensure comprehensive coverage, but do not represent separate subscales. The CS-TWBS is scored as a unidimensional scale. Higher scores indicate that the aspect affects well-being more positively. The full bilingual CS-TWBS is presented in Appendix B.
Measures of Related Constructs
The Simplified Chinese version of Flourishing Scale (Tang et al., 2016), the Chinese Primary and Secondary School Teachers' Job Burnout Questionnaire (Wu et al., 2016), and the Job Stress Scale (Boyle et al., 1995) were used to examine convergent and discriminant patterns in relation to other variables (details of scales presented in Study 1).
Data Analysis
Data analyses examined the psychometric properties of CS-TWBS and its relationships to TWBS using IBM SPSS Statistics version 29.0 and R 4.5.0. Exploratory factor analysis (EFA) examined the underlying factor structure of the CS-TWBS using principal axis factoring with oblique rotation; Kaiser-Meyer-Olkin (KMO) and Bartlett’s test assessed data suitability. Confirmatory factor analyses (CFA) validated the factor structure of: (a) CS-TWBS alone, (b) TWBS, and (c) the combined 27-item scale using MLR estimation. Model fit criteria: CFI/TLI of .90 or above, RMSEA and SRMR of .08 or below (Hu & Bentler, 1999). For the combined scale, a bifactor model specified a general well-being factor plus specific subfactors (workload, organisational, student interaction, context-specific).
Unidimensionality was assessed via omega hierarchical (ωH), explained common variance (ECV), and percentage of uncontaminated correlations (PUC); ωH and ECV of .70 or above and PUC above .80 indicate essential unidimensionality (Rodriguez et al., 2016). Internal consistency was assessed using Cronbach’s α and McDonald’s ω (of .70 or above acceptable, of .80 or above good). Convergent and discriminant patterns were evaluated through correlations with flourishing, job stress, and burnout, and the relationship with TWBS was examined to assess the degree of overlap between universal and context-specific dimensions. Composite scores were computed by averaging item responses for each scale, consistent with the approach used in study 1. Incremental validity was tested using hierarchical multiple regression: TWBS entered in Step 1, CS-TWBS added in Step 2. A statistically significant ΔR2 indicates a unique CS-TWBS contribution. Competing structural models were compared using fit indices (AIC, BIC) and theoretical interpretability.
Results
Descriptive Statistics and Internal Consistency
Descriptive Statistics for the Context-Specific Teacher Well-Being Scale (CS-TWBS)
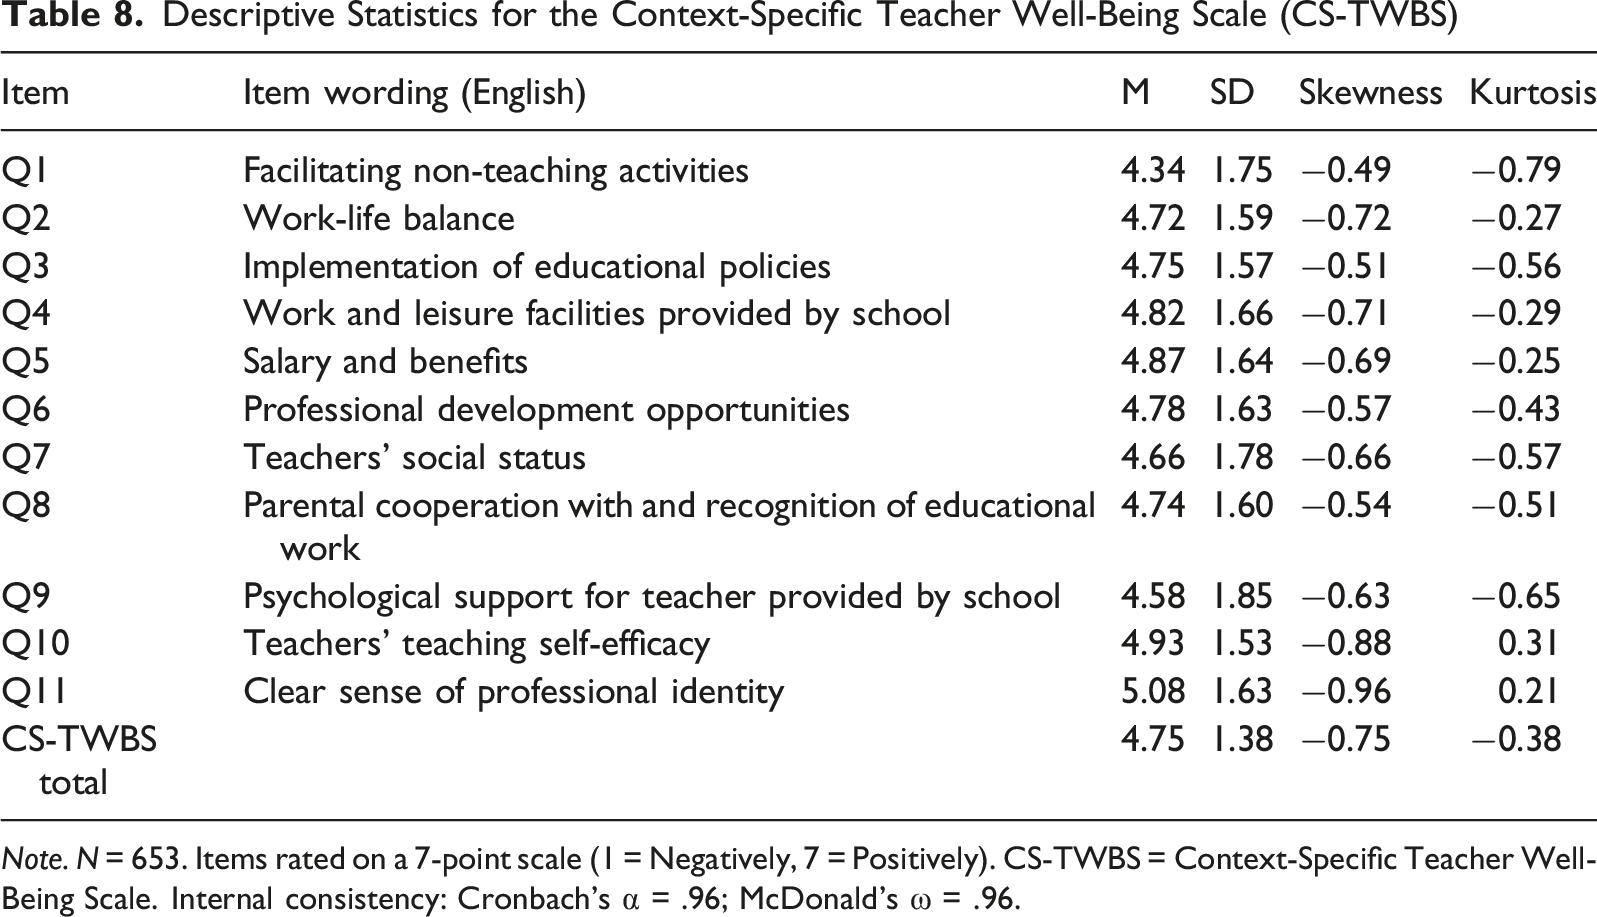
Note. N = 653. Items rated on a 7-point scale (1 = Negatively, 7 = Positively). CS-TWBS = Context-Specific Teacher Well-Being Scale. Internal consistency: Cronbach’s α = .96; McDonald’s ω = .96.
Exploratory Factor Analysis
EFA was conducted in three stages using principal axis factoring with oblique rotation.
Stage 1: Original TWBS (16-Item)
Preliminary checks indicated excellent sampling adequacy (KMO = .96; Bartlett’s test of sphericity, χ2 (120) = 6887.35, p < .001). A two-factor solution explaining 63.14% of the total variance: Factor 1 (8 items: Q2, Q4, Q5, Q7, Q10, Q11, Q15, Q16), Factor 2 (6 items: Q1, Q3, Q6, Q9, Q12, Q14); Q8 and Q13 showed weak/cross-loadings. High interfactor correlation (r = .78) indicated strongly related dimensions. The pattern matrix for the original TWBS is presented in Appendix D.
Stage 2: CS-TWBS (11-Item)
Sampling adequacy was excellent (KMO = .956; Bartlett’s χ2 (55) = 6145.75, p < .001). A clear single-factor solution explained 69.21% variance, with all items loading strongly (λ = .74–.88), confirming the unidimensional structure of the CS-TWBS. The factor matrix for the CS-TWBS is presented in Appendix E.
Stage 3: Combined Scale (27-Item)
The combined 27-item scale also demonstrated excellent sampling adequacy (KMO = .976; Bartlett’s χ2 (351) = 14,485.50, p < .001). A two-factor solution explained 62.90% variance: Factor 1 (all 11 CS-TWBS items and seven TWBS items: Q2, Q5, Q7, Q10, Q11, Q15, Q16), Factor 2 (6 TWBS items: Q1, Q3, Q6, Q9, Q12, Q14); Q4, Q8, and Q13 showed cross-loadings across both factors. The correlation between the two factors was also high (r = .80). The pattern matrix for the combined scale is presented in Appendix F.
Confirmatory Factor Analysis
A single-factor CFA model for the CS-TWBS showed acceptable fit (χ2 [44] = 375.91, CFI = .95, TLI = .93, RMSEA = .108, SRMR = .035). To further evaluate dimensionality, alternative two-factor and three-factor CFA models were compared with the single-factor solution. The two-factor model showed negligible improvement in fit (χ2 [43] = 369.31, CFI = .95, TLI = .93, RMSEA = .108) and produced a near-unity factor correlation (r = .99). The three-factor model similarly showed minimal fit improvement (χ2 [41] = 352.75, CFI = .95, TLI = .93, RMSEA = .108), with interfactor correlations ranging from .97 to .99. These near-unity correlations indicate that the factors were empirically indistinguishable, providing further support for the unidimensional interpretation of the CS-TWBS.
Fit Indices for Competing Model of the Combined 27-Item Scale
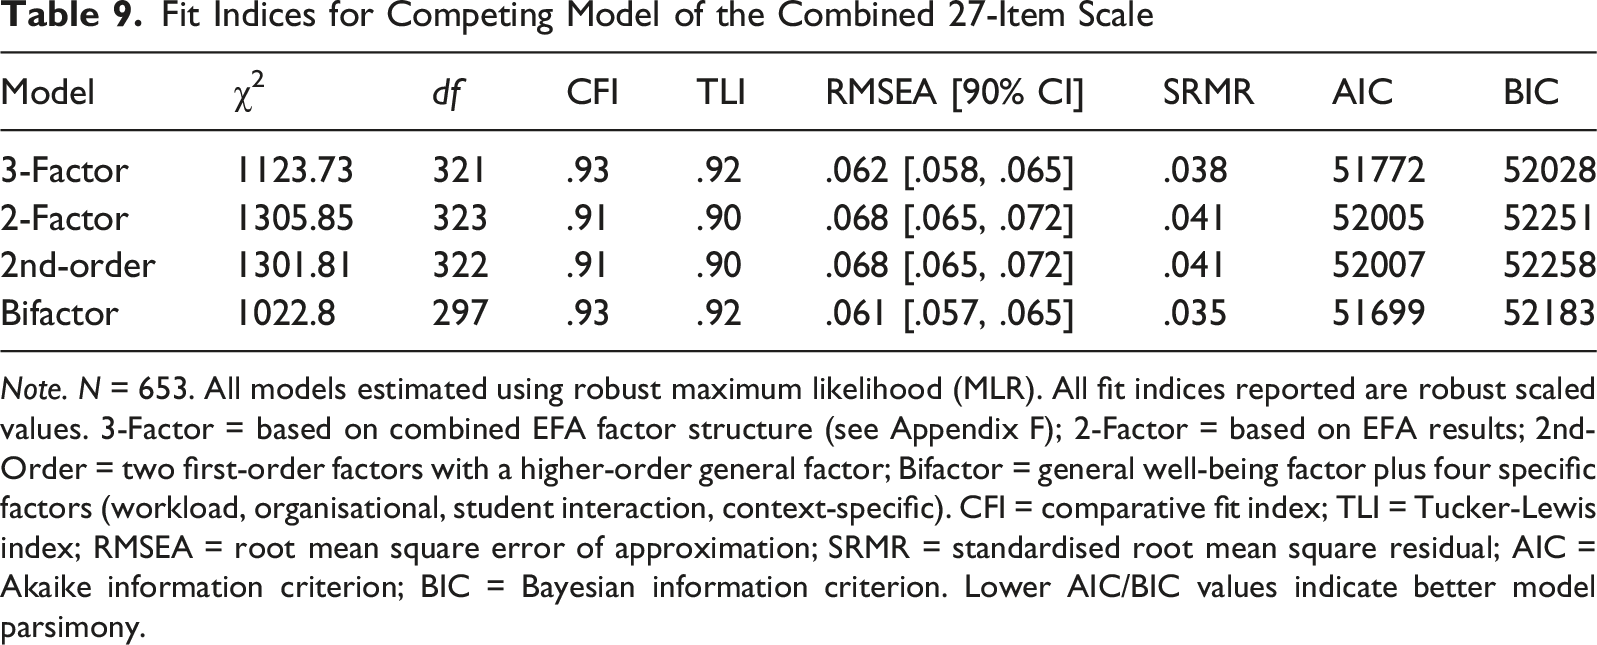
Note. N = 653. All models estimated using robust maximum likelihood (MLR). All fit indices reported are robust scaled values. 3-Factor = based on combined EFA factor structure (see Appendix F); 2-Factor = based on EFA results; 2nd-Order = two first-order factors with a higher-order general factor; Bifactor = general well-being factor plus four specific factors (workload, organisational, student interaction, context-specific). CFI = comparative fit index; TLI = Tucker-Lewis index; RMSEA = root mean square error of approximation; SRMR = standardised root mean square residual; AIC = Akaike information criterion; BIC = Bayesian information criterion. Lower AIC/BIC values indicate better model parsimony.
Bifactor Modelling and Unidimensionality
Indices of Unidimensionality and Reliability for the Combined TWBS (27 Items)
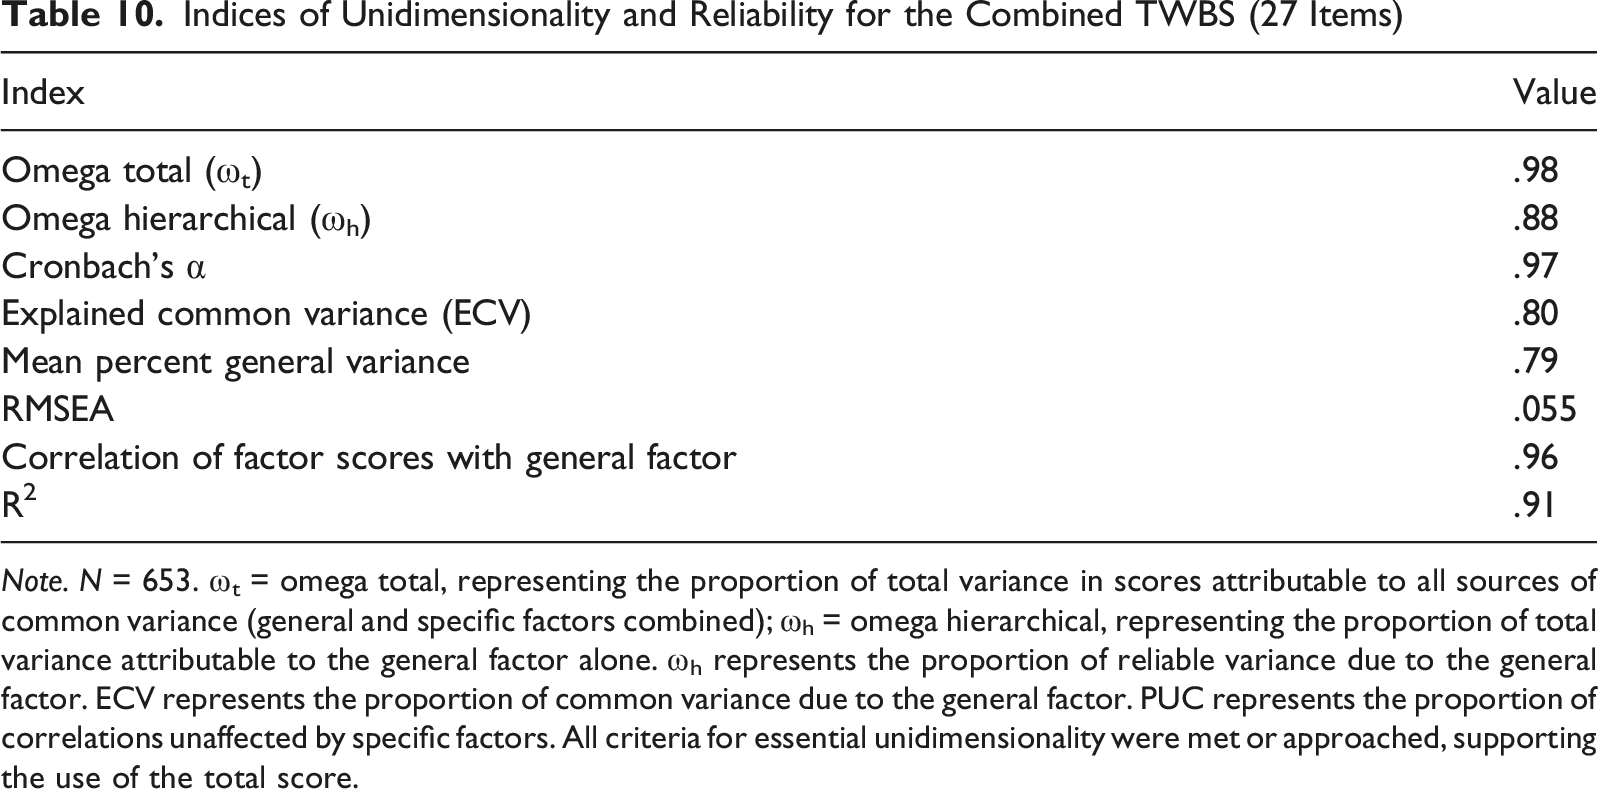
Note. N = 653. ωt = omega total, representing the proportion of total variance in scores attributable to all sources of common variance (general and specific factors combined); ωh = omega hierarchical, representing the proportion of total variance attributable to the general factor alone. ωh represents the proportion of reliable variance due to the general factor. ECV represents the proportion of common variance due to the general factor. PUC represents the proportion of correlations unaffected by specific factors. All criteria for essential unidimensionality were met or approached, supporting the use of the total score.
Relations to Other Variables
Correlations Between Teacher Well-Being Scales and Measures of Related Constructs
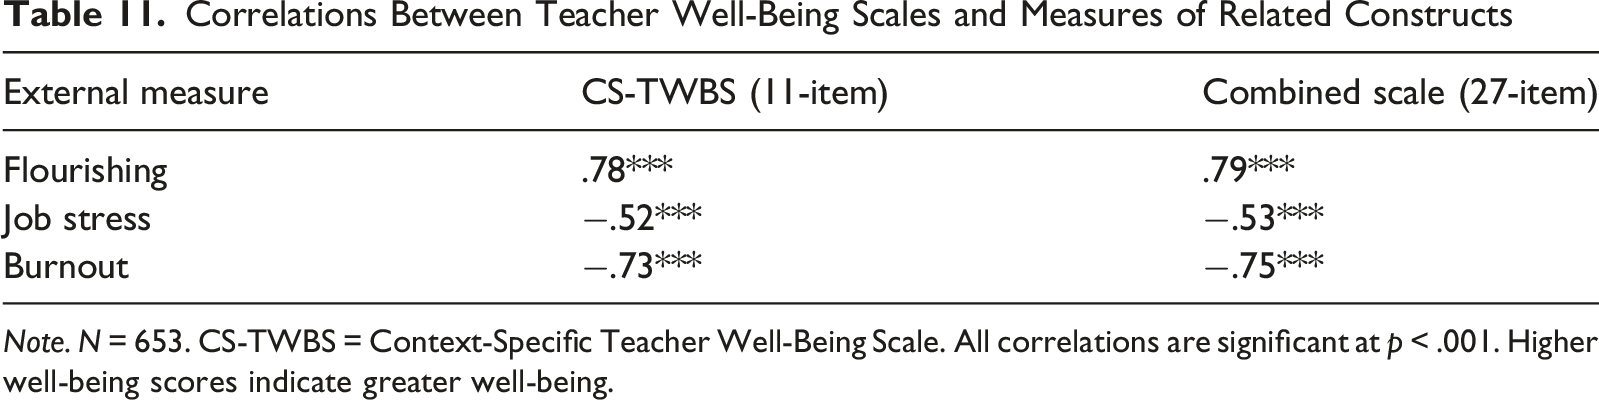
Note. N = 653. CS-TWBS = Context-Specific Teacher Well-Being Scale. All correlations are significant at p < .001. Higher well-being scores indicate greater well-being.
Relationship Between Mandarin-Chinese TWBS and CS-TWBS
The relationship between the TWBS and CS-TWBS was examined to determine whether the two instruments assess overlapping or distinct aspects of teacher well-being, and whether their combination is empirically justified. Conceptually, both scales assess teacher well-being but from complementary perspectives: the TWBS captures universal workplace dimensions (workload, organisational, and student interaction), while the CS-TWBS reflects contextual factors specific to the Chinese educational environment (e.g., compensation, policy implementation, parental involvement). If the two scales share substantial common variance while the CS-TWBS also contributes meaningful unique variance, this would support their combined use.
Correlations Between TWBS-16 and CS-TWBS
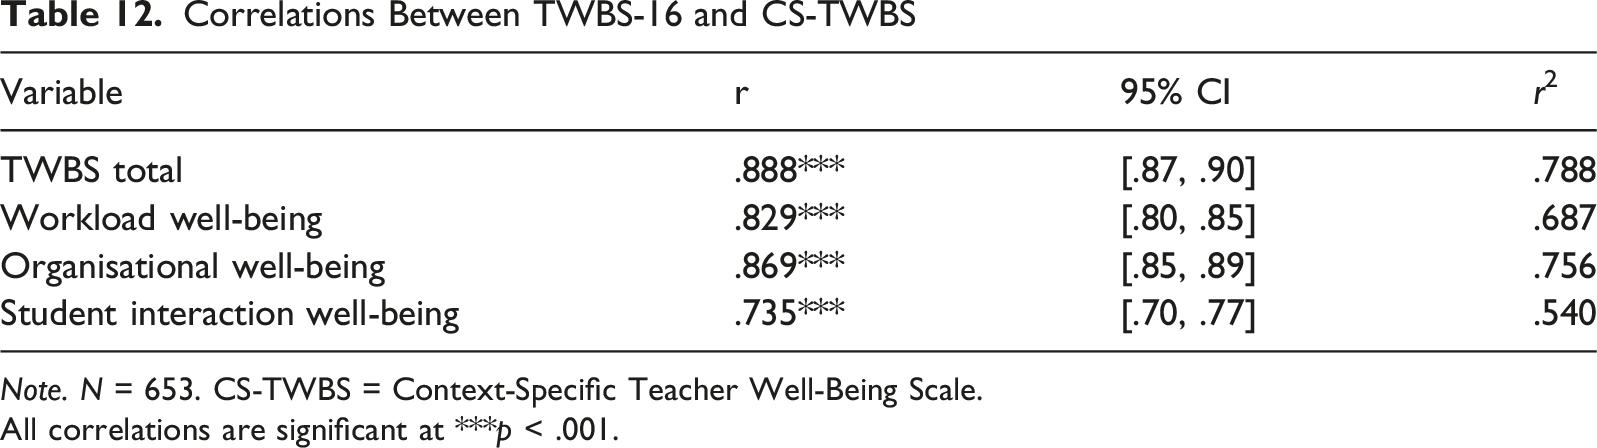
Note. N = 653. CS-TWBS = Context-Specific Teacher Well-Being Scale.
All correlations are significant at ***p < .001.
Structural Model Comparison and Usage Recommendations
Structural Model Comparison for TWBS and CS-TWBS Integration
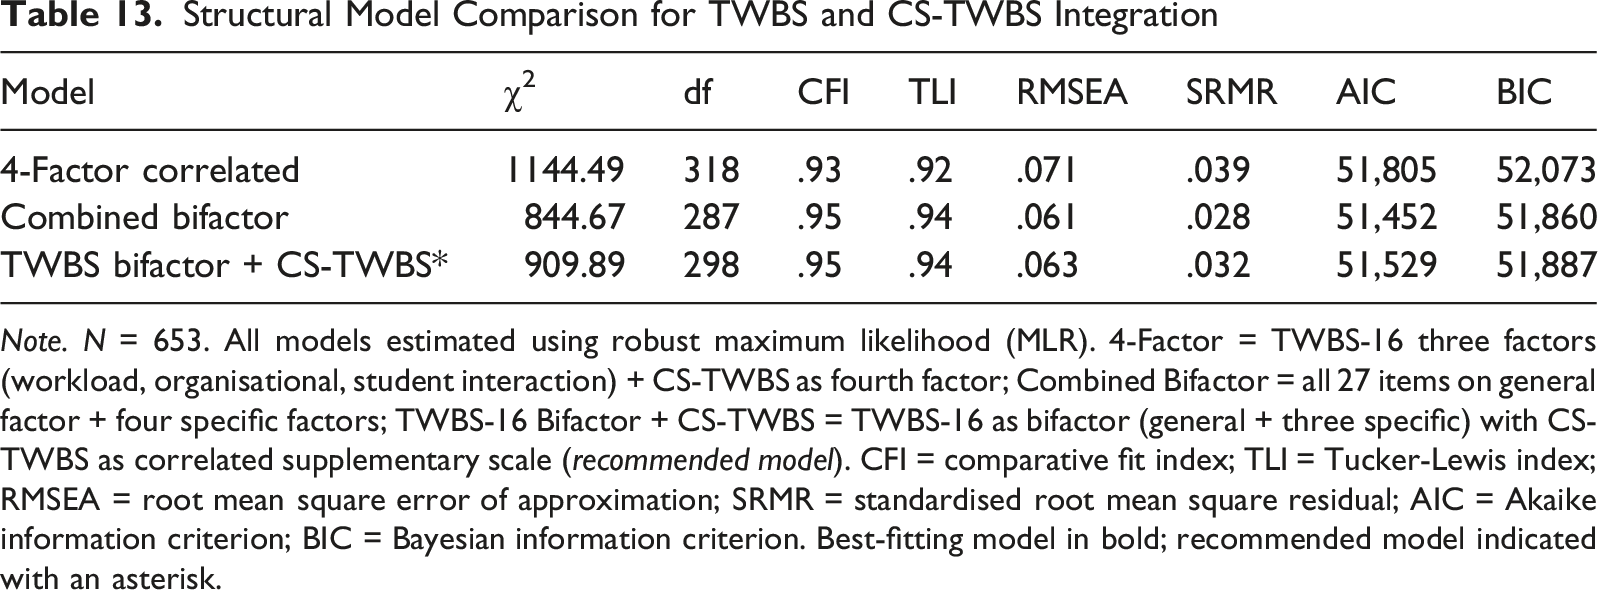
Note. N = 653. All models estimated using robust maximum likelihood (MLR). 4-Factor = TWBS-16 three factors (workload, organisational, student interaction) + CS-TWBS as fourth factor; Combined Bifactor = all 27 items on general factor + four specific factors; TWBS-16 Bifactor + CS-TWBS = TWBS-16 as bifactor (general + three specific) with CS-TWBS as correlated supplementary scale (recommended model). CFI = comparative fit index; TLI = Tucker-Lewis index; RMSEA = root mean square error of approximation; SRMR = standardised root mean square residual; AIC = Akaike information criterion; BIC = Bayesian information criterion. Best-fitting model in bold; recommended model indicated with an asterisk.
Although the combined bifactor model showed slightly superior fit (ΔCFI = .006; ΔRMSEA = .002), the bifactor TWBS plus supplementary CS-TWBS model was selected based on both psychometric evidence and theoretical interpretability. Psychometrically, the minimal fit difference between the two models indicates that treating the CS-TWBS as a correlated supplement does not meaningfully reduce model adequacy. Theoretically, this structure preserves the distinction between universal workplace dimensions (captured by the TWBS) and culturally specific contextual factors (captured by the CS-TWBS), which is important for two reasons. First, maintaining the TWBS as a standalone instrument allows cross-cultural comparisons with studies using the original English version. Second, treating the CS-TWBS as a modular supplement allows researchers to add it when studying Chinese teachers specifically without altering the core TWBS structure. This structure allows researchers to: (a) use the TWBS alone for cross-cultural comparisons or when cultural factors are not of primary interest, (b) add the CS-TWBS when studying Chinese teachers specifically to capture context-specific variance, or (c) use the combined 27-item scale for comprehensive assessment of both universal and contextual dimensions.
Incremental Validity
Incremental Validity of CS-TWBS Beyond TWBS
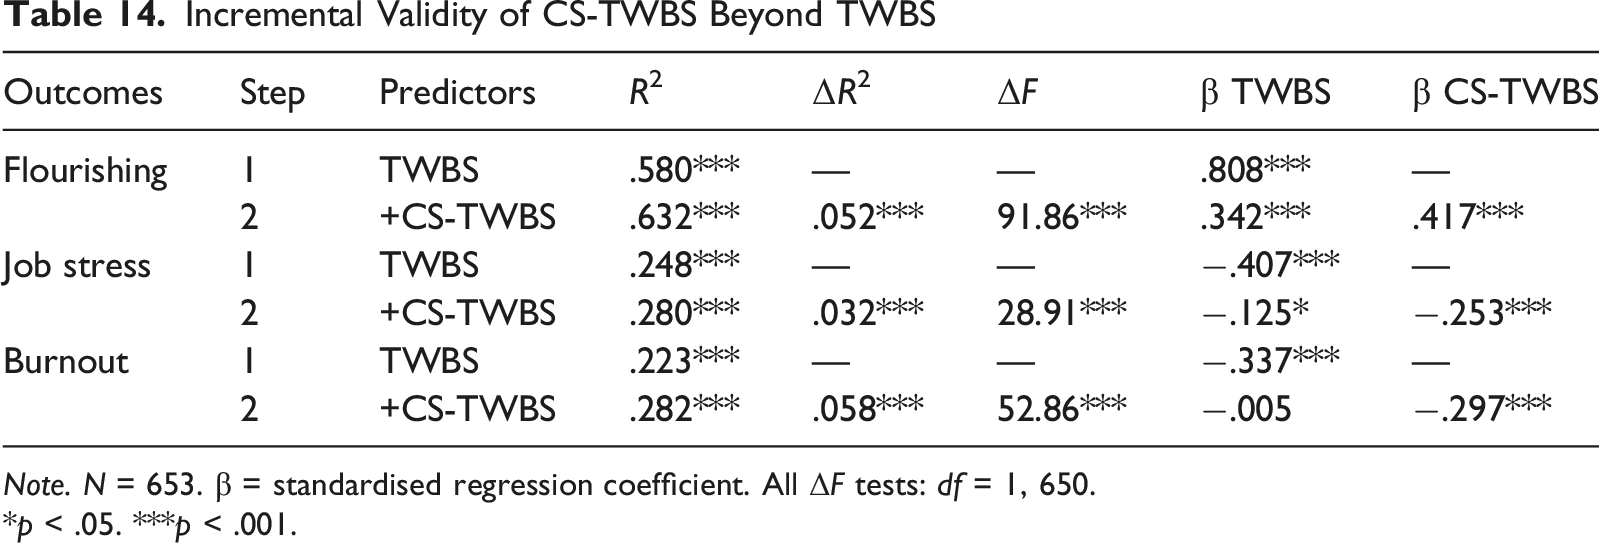
Note. N = 653. β = standardised regression coefficient. All ΔF tests: df = 1, 650.
*p < .05. ***p < .001.
Flourishing: TWBS predicted flourishing (R2 = .580, p < .001). Adding CS-TWBS significantly improved prediction (ΔR2 = .052, ΔF[1, 650] = 91.86, p < .001), with final model explaining 63.2% variance. Both TWBS (β = .342) and CS-TWBS (β = .417) remained significant, with CS-TWBS showing stronger prediction. Job stress: TWBS predicted job stress (R2 = .248, p < .001). Adding CS-TWBS improved prediction (ΔR2 = .032, ΔF[1, 650] = 28.91, p < .001), with CS-TWBS (β = −.253) emerging as stronger predictor than TWBS (β = −.125, p = .035). Burnout: TWBS predicted burnout (R2 = .223, p < .001). Adding CS-TWBS produced largest incremental effect (ΔR2 = .058, ΔF[1, 650] = 52.86, p < .001). In the full model, CS-TWBS (β = −.297, p < .001) was only significant predictor, while TWBS became non-significant (β = −.005, p = .924).
CS-TWBS demonstrated significant incremental validity across all outcomes (ΔR2 = .032–.058), with particularly strong effects for burnout. Context-specific dimensions account for virtually all burnout predictive variance, suggesting culture-specific contextual factors (policy implementation, compensation, parental involvement) may be especially important for understanding teacher burnout in Chinese settings.
Discussion
This research adapted and extended the Teacher Well-Being Scale (TWBS; Collie et al., 2015) for use in the Chinese educational context. Study 1 validated the Mandarin-Chinese TWBS in a sample of 653 teachers, while Study 2 developed and validated a Context-Specific Teacher Well-Being Scale (CS-TWBS) capturing culturally relevant aspects of teacher well-being. Together, these findings provide robust evidence for a comprehensive, culturally grounded framework for assessing teacher well-being in China.
Mandarin-Chinese TWBS Validation
The Mandarin-Chinese TWBS demonstrated excellent psychometric properties: strong internal consistency (α = .95), measurement invariance across demographic groups, test-retest reliability (r = .88), and theoretically expected associations with flourishing (r = .76), burnout (r = −.72), and job stress (r = −.50). While the three-factor model fit acceptably, high interfactor correlations (r = .82–.95) and superior bifactor model fit (ωH = .93, ECV = .85) indicated that most variance is explained by a general well-being factor, justifying use of total scores.
Development and Validation of the CS-TWBS
Cognitive interviews revealed culturally specific concerns missing from TWBS (e.g., salary and benefits, educational policy implementation demands, and professional identity). The 11-item CS-TWBS demonstrated excellent reliability (α = .96), clear unidimensional factor structure explaining 69.21% of variance, and expected patterns of association with related constructs. The combined 27-item scale exhibited excellent bifactor model fit (CFI = .93–.95, RMSEA = .055–.061), with unidimensionality indices (ωH = .88, ECV = .80), supporting a general well-being factor encompassing both universal and culture-specific dimensions.
Incremental Validity of Culture-Specific Assessment
CS-TWBS correlated strongly with TWBS (r = .89) yet explained unique variance (21.2%), with the strongest correlations with organisational well-being (r = .87) and weakest with student interaction well-being (r = .74), consistent with its organisational/systemic focus. Hierarchical regressions demonstrated significant incremental validity: CS-TWBS explained additional variance in flourishing (ΔR2 = .052), job stress (ΔR2 = .032), and burnout (ΔR2 = .058), all p < .001. Critically, for burnout, CS-TWBS was the only significant predictor (β = −.297), while TWBS became non-significant (β = −.005), suggesting culture-specific factors, such as compensation, policy implementation, and parental involvement, may be more strongly linked to teacher burnout than general workplace factors.
Usage Recommendations
Based on these findings, practical usage recommendations are provided. Researchers should use Mandarin-Chinese TWBS alone for cross-cultural comparisons or brief assessments; add the CS-TWBS when studying Chinese teacher populations specifically or investigating predictors of burnout. Use the combined 27-item scale when comprehensive assessments of both universal and contextual factors are needed (see Results for detailed guidance).
Methodological Considerations
Studies 1 and 2 used the same sample, which offered distinct methodological advantages. The two studies tested different constructs (universal vs. culture-specific well-being) using distinct items, so the participant overlap does not constitute a replication issue but rather enables direct comparison of complementary measurement approaches. We employed a sequential strategy, treating Study 1 as model fitting and Study 2 as model testing, consistent with best practices in instrument development (Anderson & Gerbing, 1988). The strong correlation between scales (r = .89) alongside demonstrated incremental validity (ΔR2 = .032–.058) represents a particularly stringent within-subjects test of unique predictive value, controlling for all individual differences.
Social Desirability in Cultural Context
Teachers reported moderate levels of socially desirable responding (M = 8.36), which correlated positively with both TWBS (r = .51) and the CS-TWBS (r = .50). While these correlations exceed the .30 threshold typically indicating meaningful construct overlap, they remain well below the .70 threshold associated with problematic redundancy. In Western contexts, such correlations might raise concerns about defensive self-presentation inflating well-being scores. However, in a collectivistic context like China, this likely reflects cultural values of harmony, modesty, and face-saving (Lalwani et al., 2006) rather than measurement bias. For teachers, who have a morally authoritative role in Chinese culture, positive well-being reports may reflect internalisation of the “good teacher” image. Researchers should recognise social desirability as an integral component of how well-being is experienced and expressed within Chinese cultural frameworks.
Limitations and Implications
While the same-sample design offered methodological advantages, independent validation in separate samples would strengthen confidence in generalisability. The CS-TWBS was developed based on cognitive interviews with 12 in-service and former teachers who provided feedback on the TWBS and identified culturally relevant concerns not captured by the original scale. While this sample size is consistent with recommendations for cognitive interviewing (Willis, 2005) and yielded coherent, theoretically meaningful themes, a larger and more diverse qualitative sample might have identified additional culturally specific dimensions of teacher well-being in China. Future research using broader qualitative inquiry across diverse teaching contexts could refine and extend the CS-TWBS item pool.
Additionally, the test-retest subsample (n = 168) was drawn from volunteers who provided their email address for follow-up, and demographic comparisons revealed that this subsample included a significantly higher proportion of female and younger teachers with less teaching experience than the full sample. Although the subsample was comparable on teaching status, school type, and school region, the demographic differences suggest that the temporal stability estimated may not fully generalise to all subgroups, particularly older and more experienced male teachers. Future research could employ strategies to improve retest participation across demographic groups.
Our social media recruitment strategy yielded a geographically and demographically diverse sample from across China, representing teachers from various provinces, career stages, and school contexts. Although this diversity enhances the generalisability of our findings to Chinese teachers broadly, it includes an in-depth examination of how context-specific well-being dimensions may function differently across distinct teaching contexts. Theoretical perspectives on teacher development (Day & Gu, 2014) and occupational well-being (Bakker & Oerlemans, 2019) suggest that the salience and impact of specific well-being dimensions may vary systematically by career stage, school type, and educational level. For example, early-career teachers may prioritise organisational support and professional development opportunities, while experienced teachers may be more concerned with compensation adequacy and professional status recognition (Klassen & Chiu, 2010). Similarly, rural teachers may have fewer opportunities for professional development (Liu & Onwuegbuzie, 2012), and high school teachers may face distinct workload challenges compared to primary teachers due to the Gaokao (Zhao et al., 2015). Future research employing purposive sampling within specific contexts, such as studies focused exclusively on rural teachers, secondary school teachers, early-career teachers, or private school contexts, would enable a more nuanced examination of how universal versus context-specific well-being dimensions operate within homogeneous teaching contexts. Such targeted investigations could reveal whether certain CS-TWBS items are more or less relevant in specific contexts and could inform more precisely tailored interventions.
Although these studies provide strong psychometric evidence, all data were self-reported and cross-sectional, introducing potential shared-method variance and limiting causal inference. While social desirability was explicitly examined, future research could incorporate multi-method and longitudinal designs to triangulate self-reported well-being with behavioural indicators and to examine temporal stability and sensitivity to intervention.
Despite these limitations, our findings offer clear practical guidance. For school administrators and policymakers, effective interventions should target the context-specific factors identified by CS-TWBS, with particular attention to compensation, policy implementation burden, professional status, psychological support, and parental involvement, which were most prominently identified by Chinese teachers. By addressing these context-specific factors alongside universal workplace dimensions, educational leaders can more effectively support teacher well-being and reduce burnout in Chinese educational contexts.
Conclusion
This research demonstrates that while universal well-being dimensions matter, culture-specific contextual factors capture meaningful variance in Chinese teacher well-being beyond universal measures, with particularly strong implications for understanding burnout. By providing validity evidence for score interpretations from both universal (Mandarin-Chinese TWBS) and context-specific (CS-TWBS) instruments with clear usage guidance, we advance culturally informed teacher well-being assessment. For Chinese teachers, compensation, additional burdens arising from the policy implementation, professional status, and organisational support are not secondary but central to well-being and burnout. Recognising this complexity is essential for developing effective, culturally appropriate interventions supporting teacher well-being and retention in Chinese educational systems.
Supplemental Material
Supplemental material - Validation of the Mandarin-Chinese Teacher Well-Being Scale and Development of a Chinese Context-specific Extension
Supplemental material for Validation of the Mandarin-Chinese Teacher Well-Being Scale and Development of a Chinese Context-Specific Extension by Hongchen Li, David Murphy, Urszula Plust, Shun Chen, Sui He in Journal of Psychoeducational Assessment
Footnotes
Acknowledgements
The authors thank the participating teachers, including current teachers, former teachers, and retired teachers, for their invaluable contributions to this study.
Ethical Considerations
This study has received ethical approval from the School of Education Ethics Committee at the University of Nottingham (Reference Number: LiH_366).
Consent to Participate
All participants provided informed consent prior to data collection.
Funding
The authors received no financial support for the research, authorship, and/or publication of this article.
Declaration of conflicting interests
The authors declared no potential conflicts of interest with respect to the research, authorship, and/or publication of this article.
Data Availability Statement
The data that support the findings of this study are available on request from the corresponding author. The data are not publicly available due to the terms of General Data Protection Regulation (GDPR).
Supplemental Material
Supplemental material for this article is available online.
References
Supplementary Material
Please find the following supplemental material available below.
For Open Access articles published under a Creative Commons License, all supplemental material carries the same license as the article it is associated with.
For non-Open Access articles published, all supplemental material carries a non-exclusive license, and permission requests for re-use of supplemental material or any part of supplemental material shall be sent directly to the copyright owner as specified in the copyright notice associated with the article.