






Abstract
School anxiety can have detrimental effects on various aspects of students’ lives, including their academic performance, emotional well-being and social development. Despite its significant impact, there is a lack of brief, validated tools that are easy to administer for assessing school anxiety in students. To address this gap, the present study developed and validated the School Anxiety Scale (SAS), specifically designed for use with primary and secondary school students. The study involved 1,236 students (M = 11 years, SD ≈ 6 months) from France and Switzerland. Both exploratory and confirmatory factor analyses supported a robust single-factor structure. The SAS demonstrated strong psychometric properties, including high internal consistency, test–retest reliability, and good convergent validity. These results highlight the SAS as a reliable and practical instrument for assessing school anxiety.
Keywords
Highlights
• This study introduces and validates the School Anxiety Scale (SAS), developed for use with primary and secondary school students. • It fills a gap in the literature by providing a reliable and easily applicable instrument to assess school-related anxiety among youth in French-speaking educational contexts. • The SAS demonstrates strong psychometric properties and cross-cultural validity, supporting its use for both research and school-based screening.
Introduction
School is a central environment in children’s lives, where they spend nearly half of their waking hours, making it a critical context for understanding and addressing mental health concerns (Jones et al., 2019). Among these concerns, anxiety is particularly prominent. Several studies have identified school itself as a major source of anxiety for youth, with evidence suggesting it is one of the most commonly reported psychological issues in educational settings (Tekin & Aydin 2022).
School anxiety is a construct characterized by a set of cognitive, physiological, and behavioral responses triggered by school situations that are perceived, though not necessarily objectively, as threatening, ambiguous, or dangerous (García-Fernández et al., 2008). It typically involves distressing thoughts and anticipatory worry, heightened physiological arousal, and avoidance or escape behaviors in response to stressors such as speaking in front of the class, interacting with peers, or responding to teacher questions (García-Fernández et al., 2008). This definition is based on Lang’s (1968) three-dimensional model of anxiety, which determines that there are three different anxiety response systems: cognitive (e.g., worry or unpleasant thoughts), physiological (e.g., muscle tension) and behavioral (e.g., avoidance). School anxiety appears relatively common in youth populations. For example, Fernández-Sogorb et al. (2022) identified approximately 20% of Spanish adolescents as belonging to a high school-anxiety profile based on School Anxiety Inventory responses, while Vicent et al. (2025) referred to epidemiological estimates suggesting that school anxiety affects around 18% of youth. Research has shown that it increases substantially around the ages of 11–12, often coinciding with the transition to secondary education and the associated increase in academic demands (García-Fernández, Inglés, & Martínez-Monteagudo, 2011; García-Fernández, Martínez-Monteagudo, & Inglés, 2011; Méndez et al., 1996). In addition, it is more prevalent among girls than boys (Freudenthaler et al., 2008; García-Fernández, Martínez-Monteagudo, & Inglés, 2011; Méndez et al., 1996; Salter et al., 2024).
It is important to distinguish school anxiety from the related but distinct concept of school phobia, also referred to as school refusal or school avoidance, terms that are often used interchangeably in the literature (Brand & O’Conner, 2004). In this article, we use the term school refusal, as it has become the most widely accepted and commonly used term in recent literature. School refusal describes a pattern in which a child persistently avoids or refuses to attend school, which often leads to prolonged absences (Brand & O’Conner, 2004). This avoidance is frequently accompanied by heightened levels of negative affect and emotional distress, including excessive fear, temper outbursts, or physical complaints such as feeling ill when confronted with the idea of going to school. These children generally remain at home with the awareness and consent of their parents, and their behavior is notably absent of antisocial traits, such as lying, stealing, or destructiveness (Brand & O’Conner, 2004; Fremont, 2003). Drawing on an illustration by Endler and Kocovski (2001), we can conceptualize school distress along a continuum of intensity: One end of the continuum represents a low amount of anxiety, the middle represents a higher level of anxiety, and the other end of the continuum represents a severe level of anxiety. Anxiety disorders are at the end representing a severe level of anxiety, within which school refusal logically falls. In this framework, the term school anxiety encompasses the lower to moderate levels of this continuum, while school refusal reflects the most severe, clinically significant manifestation. In this sense, school anxiety can be understood as the emotional, cognitive, and physiological distress experienced in relation to school, whereas school refusal refers to the behavioral manifestation of this distress, expressed through avoidance of school attendance. Although elevated school anxiety may contribute to the development of school refusal, not all students experiencing school anxiety engage in school refusal behaviors. However, neither school anxiety nor school refusal is currently recognized as a distinct diagnostic category in major international classification systems, such as the Diagnostic and Statistical Manual of Mental Disorders, Fifth Edition (DSM-5; American Psychiatric Association, 2013), or the International Classification of Diseases, 11th Revision (ICD-11; World Health Organization, 2018).
School anxiety can have negative consequences in all the developmental stages (i.e., during childhood, adolescence, and adulthood). It has been associated with trait anxiety (i.e., an emotional tendency to react anxiously to situations perceived as dangerous), state anxiety (i.e., a transitory emotional state manifested in a specific situation), depression, low academic performance, and low self-esteem (Hernández-Pozo et al., 2008; Martínez-Monteagudo et al., 2013; Vicent et al., 2025). In addition, school anxiety is closely linked to school refusal, as it appears to be a predictor of it (Miralles et al., 2024; Tekin & Aydın, 2022). School refusal has been associated to academic difficulties, psychiatric problems (i.e., depression), parental conflict, diminishing peer relationships, somatic complaints, and substance abuse (Fremont, 2003; Ingul & Nordahl, 2013; Kearney, 2008; Thastum et al., 2019). Persistent school refusal can ultimately lead to school dropout, which is associated with higher rates of unemployment, economic hardship, psychiatric disorders and increased risk of encounters with the criminal justice system (Fremont, 2003; Lansford et al., 2016; Thastum et al., 2019). Thus, school anxiety can significantly hinder a student’s personal, social and academic development. These findings highlight the critical need for early identification and targeted interventions.
To effectively understand and address students' emotional experiences in academic environments, it is essential to have access to valid and reliable assessment tools that accurately capture the range of emotional responses associated with school. However, to date, there is a lack of validated instruments specifically designed to assess school anxiety as a broad construct. Many available measures target specific dimensions of school anxiety, such as test anxiety (von der Embse et al., 2018), subject-specific forms such as math anxiety (Ganley & McGraw, 2016), or school-related fears (García-Fernández et al., 2010), rather than assessing anxiety related to the broader school environment. In addition, some existing instruments focus primarily on school refusal, as assessed by tools such as the Behavioral Scale of Phobic Anxiety (ECAP; Vera, 1996) and the School Refusal Assessment Scale–Revised (SRAS-R; Kearney, 2006). To date, to our knowledge, only two validated, peer-reviewed instruments have been developed to provide a comprehensive assessment of school anxiety as a broad construct. The first is the Children’s School Questionnaire (SQ; Phillips, 1978), which includes 198 items covering various aspects of school life. Among them, 74 items specifically assess school-related anxiety, forming the School Anxiety subscale of the instrument. The second is the more recent School Anxiety Inventory (SAI; García-Fernández, Inglés, & Martínez-Monteagudo, 2011; García-Fernández, Martínez-Monteagudo, & Inglés, 2011), designed to assess school anxiety multidimensionally across cognitive, behavioral, and physiological domains. Originally developed for Spanish secondary students (ages 12-18), the self-report questionnaire is grounded in Lang’s three-dimensional theory of anxiety (cognitive, behavioral, and physiological components; Lang, 1968). The SAI consists of four situational factors: school failure anxiety and school punishment (e.g., failing a test), aggression anxiety (e.g., being insulted or threatened by a schoolmate), social evaluation anxiety (e.g., speaking in front of the class) and academic evaluation anxiety (e.g., taking a written test) and assesses three response systems: cognitive, psychophysiological and behavioral. It comprises 200 items rated on a 5-point Likert scale. The scale demonstrates strong internal consistency (Cronbach’s α = .82–.93) and good test–retest reliability over two weeks (r = .74–.84). Example items include: “If a classmate tries to force me to do things I don’t want to” (aggression anxiety); “If the teacher punishes me” (school failure anxiety and school punishment); “Going to the blackboard” (social evaluation anxiety); “When I’m taking an exam” (academic evaluation anxiety). A shorter version with a three-factor structure (aggression, social evaluation and school failure anxiety) of the scale was later developed (García-Fernández et al., 2014) comprising 116 items. It has also been adapted for primary school children (SAI-PE; García-Fernández et al., 2024), college students (SAI-CV; Beckmann & Jastrowski Mano, 2023), and translated into multiple languages, including Slovenian (Puklek Levpušček et al., 2015) and French (Delgado et al., 2019).
Both instruments, the School Questionnaire (SQ; Phillips, 1978) and the School Anxiety Inventory (SAI; García-Fernández, Inglés, & Martínez-Monteagudo, 2011; García-Fernández, Martínez-Monteagudo, & Inglés, 2011) are valid but lengthy, making them time-consuming and difficult to implement in school settings. Therefore, we consider that there is a need for a brief, easily applicable, and validated tool to assess school anxiety in students.
The Current Study
To address this gap, the present study aimed to develop and validate a brief scale specifically designed to assess school anxiety in primary and secondary school students. The study focused on the scale’s development and examined its validity using samples of upper primary and lower secondary students in France, as well as upper primary students in Switzerland.
Method
Participants
The study was based on three fully independent samples of students from French-speaking schools in France and Switzerland. The first sample (n = 646; mean age = 10 years 5 months, SD ≈ 5 months; 331 girls, 296 boys, 19 unknown gender) consisted of French pupils in their final year of primary school from 30 classes across 28 schools and was used for exploratory factor analyses (EFA). The second sample (n = 396; mean age = 11 years 8 months, SD ≈ 6 months; 103 boys, 104 girls, 189 unknown gender due to school policies) included French pupils in their first year of secondary school from 24 classes across five schools and served for an initial confirmatory factor analysis (CFA). The third sample (n = 194; mean age = 10 years, SD ≈ 11 months; 93 girls, 101 boys) comprised Swiss pupils in the last 4 years of primary school from 16 classes across eight schools in the canton of Vaud and was used to replicate the factorial structure with CFA. Socioeconomic backgrounds varied across samples, ensuring heterogeneity.
Instruments
Three instruments were administered:
The School Anxiety Scale: It was developed for the present study as a school-contextualized adaptation of the trait version of the State-Trait Anxiety Inventory for Children (STAIC; Spielberger, 1973). More specifically, the item development process was based on the validated French-Canadian version of the STAIC by Turgeon and Chartrand (2003), which has demonstrated satisfactory psychometric properties in French-speaking children. The STAIC was selected as the conceptual starting point because it is one of the most widely used and well-validated instruments for assessing anxiety in children (Julian, 2011). The objective was not to reproduce the STAIC items verbatim, but to adapt its trait-anxiety framework to the school context and to supplement it with additional items judged relevant to children’s school-related anxiety. The initial version of the SAS comprised 17 items. All items were preceded by a common contextual stem referring to anxiety experienced “at school or before going to school,” in order to ensure that responses specifically reflected anxiety in or in anticipation of the school environment. This stem was also intended to distinguish the construct from general trait anxiety by anchoring children’s responses in the school context. The initial 17-item pool is provided in Supplemental Material A, and the final 7-item version is presented in Appendix A. The response format was a four-point Likert scale ranging from “never” to “all the time,” with higher scores indicating higher school-related anxiety. The initial item pool was designed to capture the most plausible manifestations of school anxiety in children. Consistent with Lang’s (1968) three-dimensional model of anxiety and with the definition of school anxiety proposed by García-Fernández et al. (2008), items were written to reflect cognitive, physiological/somatic, affective, and school-contextual manifestations of anxiety. Several items were directly inspired by formulations found in the validated French-Canadian STAIC trait scale (Turgeon & Chartrand, 2003), particularly those referring to worry about making mistakes, intrusive thoughts, rapid heartbeat, sleep difficulties, somatic discomfort, embarrassment, and school-related worry. Other items were newly formulated to capture school-specific manifestations judged relevant for the target population. These domains are also broadly consistent with the structure of existing school anxiety measures, such as the School Anxiety Inventory (SAI), which assesses anxiety responses across school-related situations involving academic evaluation, school failure or punishment, social evaluation, and peer-related threat (García-Fernández, Inglés, & Martínez-Monteagudo, 2011; García-Fernández, Martínez-Monteagudo, & Inglés, 2011). However, unlike the SAI, which provides a highly detailed assessment of specific anxiety-provoking school situations, the SAS was intentionally designed as a brief screening instrument. Consequently, it does not aim to assess the full range of situational dimensions covered by this more comprehensive measure. Although the initial item pool covered different manifestations of anxiety, the intended construct was theoretically unidimensional: a stable predisposition to experience anxiety in school-related contexts. The final version retained seven items reflecting different manifestations of this single underlying school-anxiety construct, including fear, physiological arousal, somatic discomfort, social-evaluative discomfort, worry about making mistakes, intrusive thoughts, and general anxiousness. The statistical procedure used to reduce the initial 17-item pool to the final 7-item version is described below.
The Trait Anxiety subscale of the STAIC (Spielberger, 1973): it was used as an external measure of general anxiety. It includes 20 items (e.g., “I worry too much”) rated on a three-point scale from “almost never” to “often.” Higher scores reflect higher trait anxiety.
The School Satisfaction subscale of the Multidimensional Student Life Satisfaction Scale (MSLSS; Huebner, 1994): it was administered in its French adaptation by Fenouillet et al. (2015). The subscale comprises eight items (e.g., “I like being at school”), rated on a four-point scale (“never” to “all the time”). Higher scores indicate greater satisfaction. This measure was included to assess convergent validity, as school satisfaction is typically negatively associated with anxiety (Horanicova et al., 2022).
Procedure
Data were collected during school hours in a quiet room within each school. Administration was carried out by the first two authors together with two trained graduate students experienced in psycho-affective assessment. Given the age range of the participants, standardized instructions and all questionnaire items were read aloud to the pupils while they completed the questionnaires individually. When students demonstrated or expressed comprehension difficulties, additional clarification was provided to ensure understanding.
Ethical Considerations
The research protocol was approved by the French National Education Ministry and, in Switzerland, by the Education Research Coordinating Committee and the Cantonal Commission for Ethics in Human Research of Vaud (Project-ID 2022-00908). Data were anonymized in accordance with the GDPR. Written consent was obtained from legal guardians, school directors, and teachers. In France, children provided verbal assent, whereas in Switzerland written assent was collected. It should be noted that the present study draws on data from two broader studies conducted respectively in France and Switzerland.
Statistical Analysis
Psychometric Analyses
Prior to analysis, data were screened for missing values. Item-level missingness ranged from 0% to 16.2%. Little’s MCAR tests confirmed that data were missing completely at random (Sample 1: χ2(41) = 47.05, p = .240; Sample 2: χ2(26) = 22.14, p = .680; Sample 3: χ2(10) = 11.86, p = .290). Given the modest proportion of missing data, the confirmation of the MCAR assumption, and the sufficiently large sample sizes, listwise deletion was applied. This strategy, commonly recommended in validation studies, allows analyses to be based on complete observed data, thereby minimizing the risk of artefactual results linked to model-based imputations and enhancing the transparency and robustness of findings (Schafer & Graham, 2002).
Item Reduction and Exploratory Factor Analysis
The reduction from the initial 17-item pool to the final 7-item version was conducted through an iterative exploratory factor analytic procedure on the first independent sample. Analyses were carried out in SPSS 29. The initial item pool was first examined using principal axis factoring with oblique (promax) rotation, without imposing a fixed number of factors. Factor retention was guided by Kaiser’s criterion, inspection of the scree plot, and the interpretability of the extracted factors. This first step was used to identify items that contributed clearly to the dominant latent dimension while avoiding premature constraints on the number of factors.
Items were evaluated using both statistical and substantive criteria. Items were considered for removal when they showed a negative or weak association with the dominant factor, failed to load meaningfully on the main factor, or showed an ambiguous loading pattern. In particular, items were removed when they loaded above .30 on secondary factors that were not theoretically interpretable or not retained according to Kaiser’s criterion, while not contributing clearly to the dominant school-anxiety factor. Positively worded or reverse-coded items were also inspected carefully, as such items can sometimes form method-related factors rather than reflecting the intended construct.
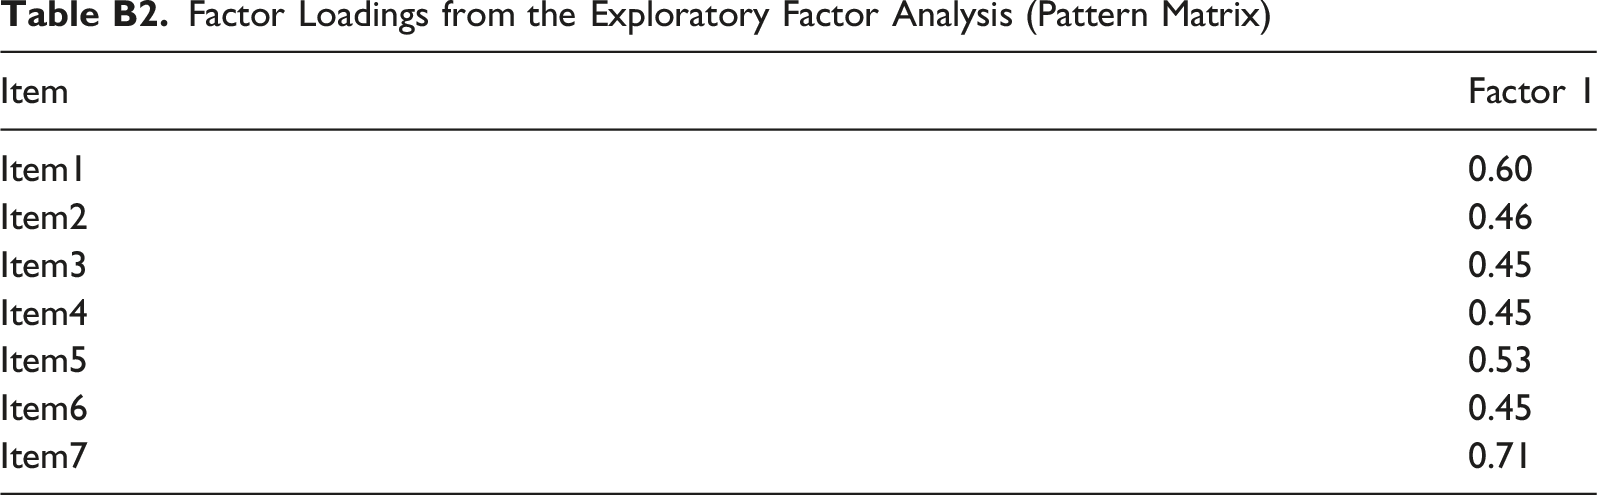
The reduction process was therefore not based solely on maximizing internal consistency. Instead, the final selection aimed to retain items that combined adequate factor loadings, clear contribution to the dominant factor, absence of problematic cross-loadings, and conceptual relevance to school anxiety. The reduced 7-item version was then re-examined through a second EFA on the same independent sample, this time using maximum likelihood (ML) estimation. Prior to this analysis, data suitability was confirmed by the Kaiser–Meyer–Olkin (KMO) index and Bartlett’s test of sphericity. The ML-based EFA allowed model fit evaluation via the χ2 test and provided further support for the unidimensionality of the construct. The results of the item reduction and final EFA are presented in Table B1 and Table B2 in Appendix B.
Confirmatory Factor Analyses
A CFA was carried out on two independent samples to validate and test the stability of the factor structure identified in the EFA. Models were estimated with maximum likelihood (ML) using AMOS 28 and JASP 0.95.1. Model fit was evaluated with standard indices: χ2 and its significance, χ2/df ratio, RMSEA with 90% CI and PCLOSE, CFI, TLI, and SRMR. Residual variances (uniquenesses) were also inspected.
Multi-Group Confirmatory Factor Analysis
Multi-group confirmatory factor analyses (MG-CFA) were conducted to examine whether the SAS functions equivalently for boys and girls. Sex was selected as the grouping variable, as testing invariance across gender is the most common practice in psychometric validation, given both its systematic availability and the importance of ensuring measurement equivalence between groups (Meredith, 1993; Putnick & Bornstein, 2016; Vandenberg & Lance, 2000).
Models were estimated sequentially following conventional procedures: (a) configural invariance, assessing whether the factorial structure is comparable across groups; (b) metric invariance, constraining factor loadings to equality; and (c) scalar invariance, additionally constraining item intercepts (Meredith, 1993; Vandenberg & Lance, 2000).
At each stage, model adequacy was evaluated using the Comparative Fit Index (CFI) and the Root Mean Square Error of Approximation (RMSEA), together with their changes (ΔCFI, ΔRMSEA). Invariance was considered established when ΔCFI ≤.01 and ΔRMSEA ≤.015 (Cheung & Rensvold, 2002).
Reliability and Validity
Internal consistency was evaluated with Cronbach’s alpha (α) and McDonald’s omega (ω), the latter being more appropriate when item loadings are unequal. Test–retest reliability was examined in both the French (2–3 months interval) and Swiss (4 months interval) samples using intraclass correlation coefficients (ICC(2,1), two-way mixed-effects, consistency). Convergent validity was assessed through positive correlations with the STAIC in both samples and was also tested in the Swiss sample via negative correlations with the School Satisfaction subscale of the MSLSS (Fenouillet et al., 2015).
Results
Exploratory Factor Analysis (Sample 1_french)
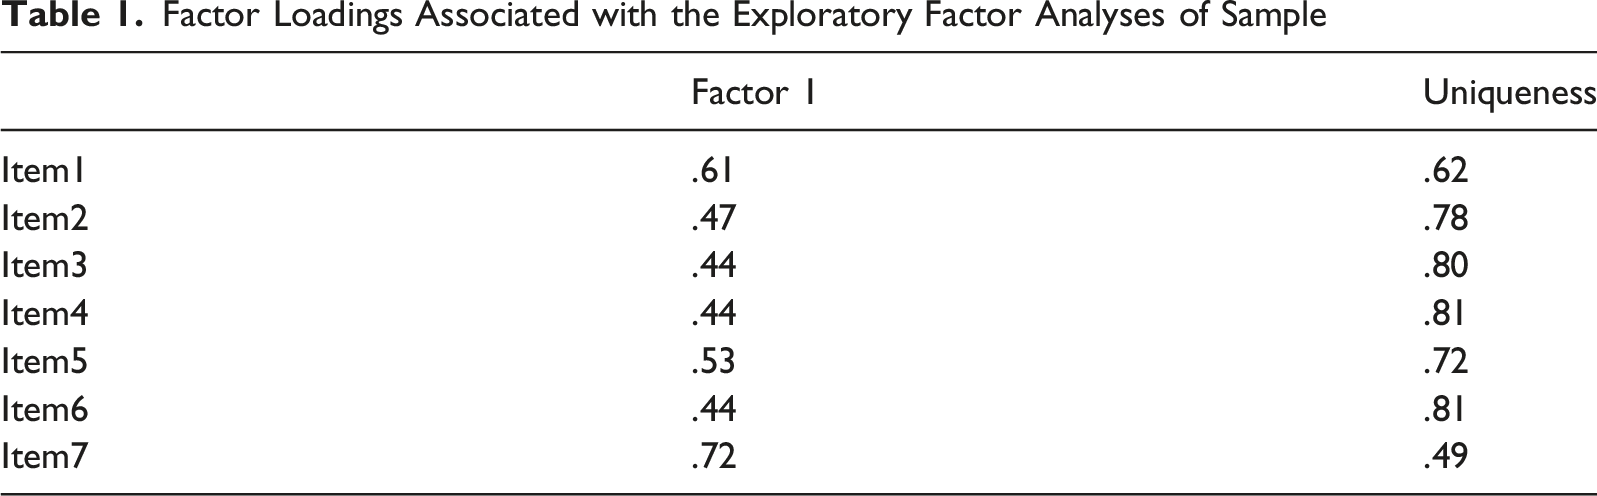
An EFA was first conducted to explore the latent structure, using maximum likelihood extraction with oblique (promax) rotation. Data suitability was confirmed by a satisfactory KMO index (.82) and a significant Bartlett’s test (χ2(21) = 632.84, p < .001). Both the scree plot and parallel analysis supported a unidimensional solution: only the first eigenvalue (2.65) exceeded the simulated threshold (≈1.13), with all others below (Figure 1). The retained factor explained 28.01% of the variance. Although this percentage of explained variance was moderate, it was interpreted in conjunction with other factor-retention evidence, including the scree plot, parallel analysis, the absence of additional eigenvalues above 1, and the excellent model fit indices obtained for the one-factor solution. A subsequent CFA confirmed this structure, with a non-significant chi-square (χ2(14) = 16.43, p = .290) and excellent fit indices (RMSEA = .01, 90% CI [0.000, 0.040], p = .953; SRMR = .03; TLI = 1.00; CFI = 1.00). According to established criteria (Browne & Cudeck, 1993; Fabrigar et al., 1999; Hu & Bentler, 1999), these results strongly support the adequacy of a single-factor model. Scree plot of Eigenvalues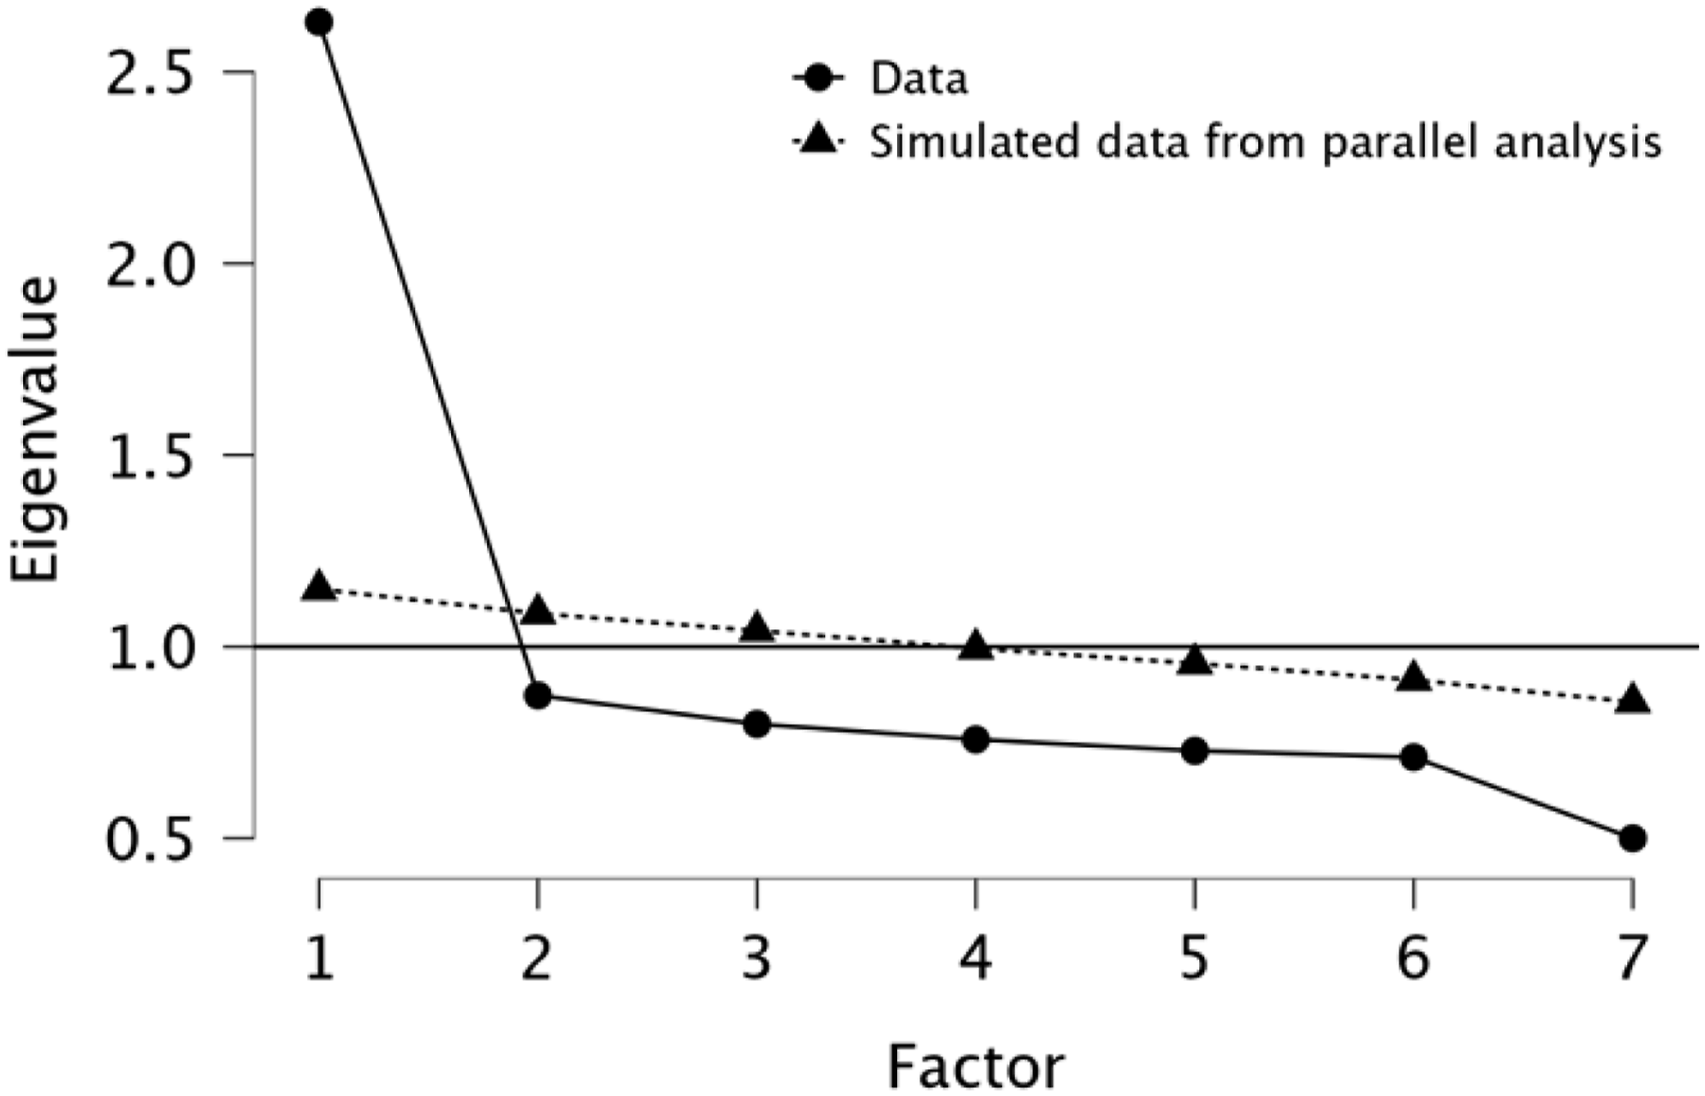
Factor Loadings Associated with the Exploratory Factor Analyses of Sample
Confirmatory Factor Analysis (Sample 2_french)
Factor Loadings Associated with the Confirmatory Factor Analysis of Sample 2
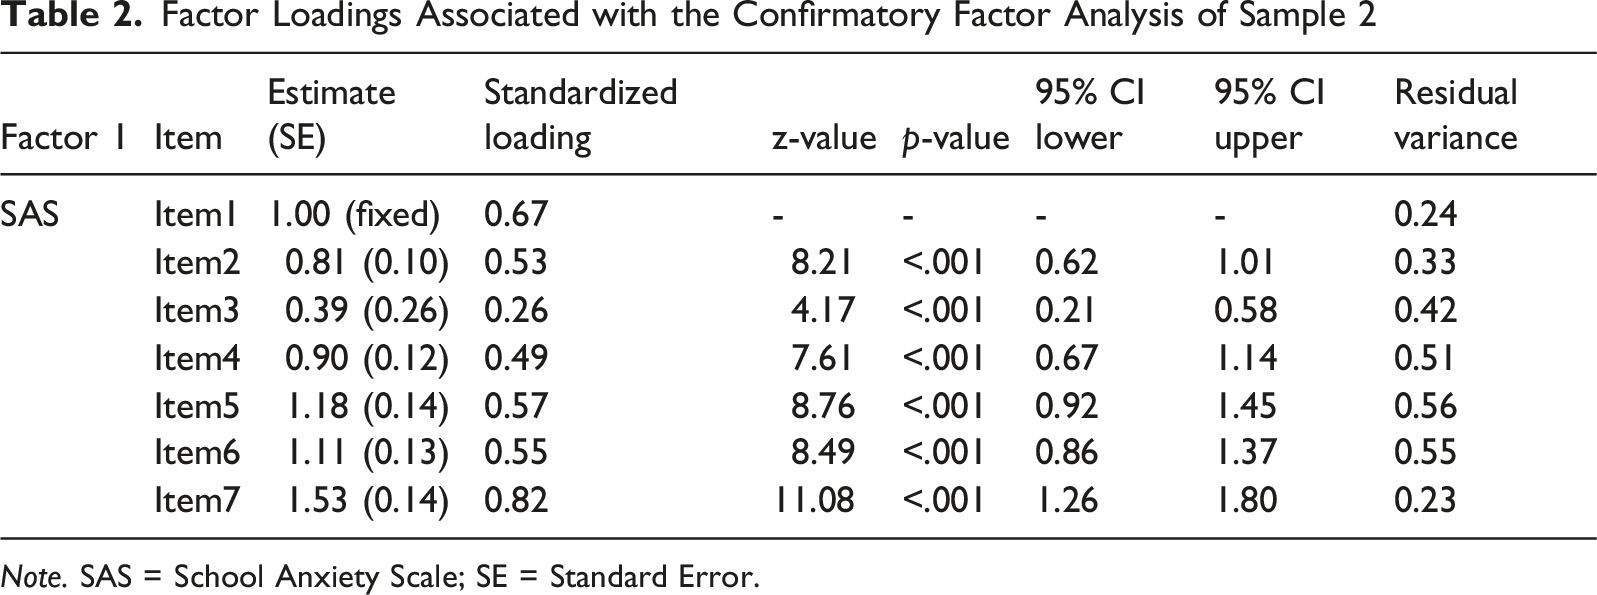
Note. SAS = School Anxiety Scale; SE = Standard Error.
Second Confirmatory Factor Analysis (Sample 3_swiss)
To confirm the factor structure previously identified, a confirmatory factor analysis (CFA) was performed on a new, independent sample using Maximum Likelihood (ML) estimation. Sampling adequacy was supported by a Kaiser-Meyer-Olkin index of .83 and a significant Bartlett’s test of sphericity (χ2(21) = 318.1, p < .001). Results from the single-factor CFA provided further confirmation of the proposed structure, with an overall acceptable fit: χ2(14) = 23.38, p = .054; χ2/df = 1.67; CFI = .97; TLI = .96; SRMR = .04; RMSEA = .06 (90% CI [0.000, 0.100], p = .324). The confidence interval including zero and the non-significant PCLOSE reinforced the hypothesis of close fit (Browne & Cudeck, 1993).
Factor Loadings Associated with the Confirmatory Factor Analysis of Sample 3
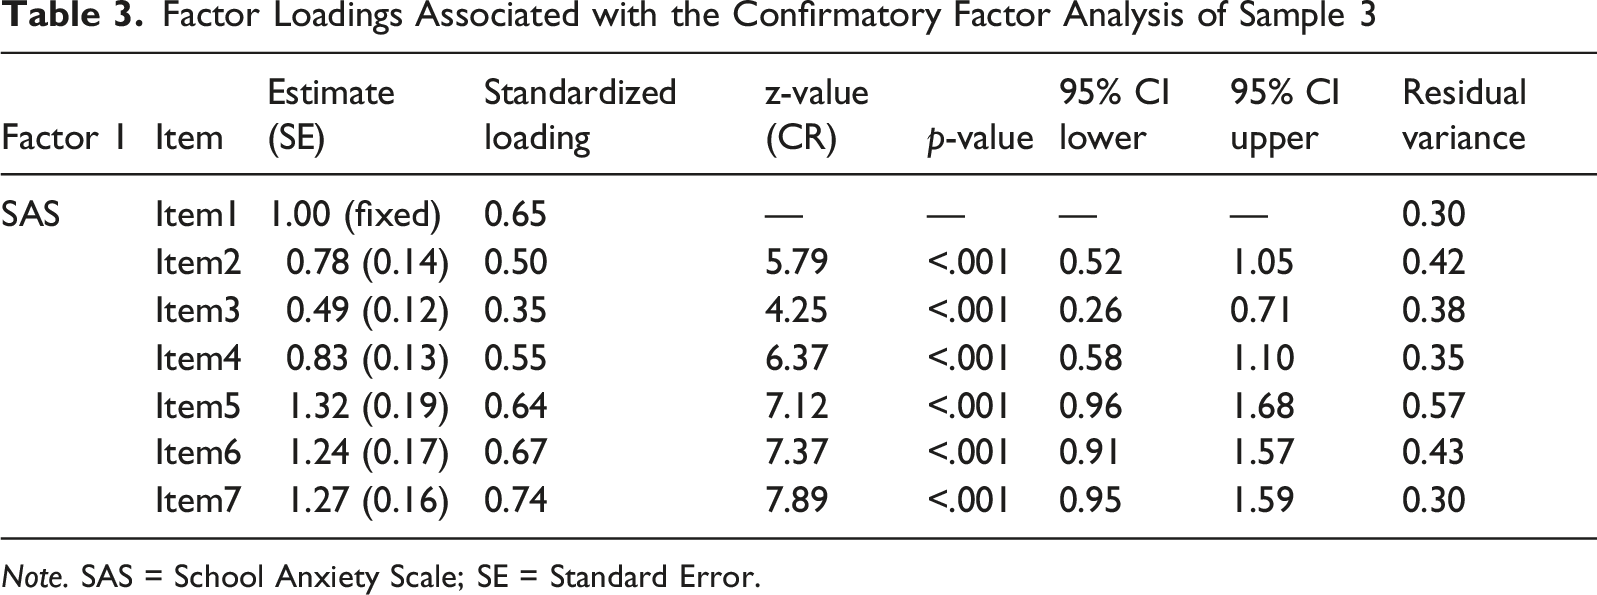
Note. SAS = School Anxiety Scale; SE = Standard Error.
Convergent validity was supported by a strong positive correlation with the STAIC (Spielberger, 1973; r = .77, p < .001), and with a small negative correlation with the School Satisfaction subscale (Fenouillet et al., 2015; r = −.24, p = .022), showing that higher anxiety scores were modestly linked to lower school satisfaction, consistent with theoretical expectations. This third independent sample (n = 194) had previously been involved in an intervention study including experimental and control groups. To avoid potential bias, test–retest reliability was assessed only in the control group (n = 92). Results indicated moderate temporal stability for a single SAS score, ICC(2,1) = .62 (95% CI [0.475, 0.730]; F(91, 91) = 4.25, p < .001; Koo & Li, 2016). This estimate reflects the stability of the scale score across the two measurement occasions. Altogether, findings from this independent third sample provide additional support for the temporal consistency and validity of the scale, further confirming the robustness of its unidimensional factor structure.
Measurement Invariance Across Gender (Sample 3_swiss)
Configural invariance was tested to determine whether the factorial structure of the SAS is equivalent across gender groups. The unidimensional model demonstrated satisfactory fit. The chi-square test was significant (χ2(28) = 44.675, p = .024), which is not uncommon given the sensitivity of this statistic to sample size; therefore, interpretation relied primarily on alternative fit indices (Kline, 2023). The Comparative Fit Index (CFI = .95) and the Tucker–Lewis Index (TLI = .92) both exceeded the conventional threshold of .90, indicating good model fit (Bentler & Bonett, 1980; Bentler, 1990). The Root Mean Square Error of Approximation (RMSEA = .08, 90% CI [.03, .12]) fell within the acceptable range, though approaching the upper bound of conventional cutoffs (Hu & Bentler, 1999). The PCLOSE test was non-significant (p = .14), suggesting that the hypothesis of close fit cannot be rejected. The Standardized Root Mean Square Residual (SRMR = .06) was well below the .08 cutoff. Taken together, these findings provide evidence for configural invariance, supporting the equivalence of the SAS factorial structure across gender groups.
Metric invariance was then tested to assess whether the factor loadings are equivalent across gender. The model demonstrated satisfactory fit. The chi-square test was non-significant (χ2(34) = 47.452, p = .063), and the increase relative to the configural model (Δχ2 = 2.777, Δdf = 6) was minimal, indicating no substantial deterioration in fit. Fit indices further supported metric invariance: the CFI improved from .95 to .96 (ΔCFI = +.01), the TLI increased from .92 to .95, and the RMSEA decreased from .08 to .06 with a non-significant PCLOSE (.28). The SRMR (.07) remained below the .08 threshold, despite a slight increase. Conventional cutoffs (Hu & Bentler, 1999) suggest that CFI/TLI ≥.95 and RMSEA ≤.06 indicate good fit. Moreover, the ΔCFI criterion (Cheung & Rensvold, 2002; Chen, 2007) confirms that metric invariance is supported when ΔCFI <.01, which was the case here. These results indicate that the strength of the relationship between items and the latent construct is consistent across gender groups.
Scalar invariance was subsequently tested to determine whether item intercepts are equivalent across gender. The model showed acceptable fit overall, though with evidence of deterioration relative to the metric model. The chi-square test was significant (χ2(40) = 58.945, p = .027), and the increase relative to the metric model (Δχ2 = 11.493, Δdf = 6) suggested some decline in fit. Fit indices reflected this trend: the CFI decreased from .96 to .94 (ΔCFI = −.018), the TLI dropped from .95 to .94, and the RMSEA (.07, 90% CI [.03, .11]) remained within acceptable bounds, with a non-significant PCLOSE (.19). The SRMR (.07) increased slightly but remained below the .08 threshold. Although configural and metric invariance were supported, the ΔCFI criterion (Cheung & Rensvold, 2002; Chen, 2007) indicates that strict scalar invariance was not achieved, as ΔCFI exceeded −.01.
Summary of Measurement Invariance Models Across Gender Groups

Discussion
The present study aimed to validate the psychometric properties of the School Anxiety Scale (SAS), initially designed for French-speaking school students in late primary and early secondary school. The scale was developed based on the trait version of the State–Trait Anxiety Inventory for Children (Spielberger, 1973), one of the most widely used and well-validated instruments for assessing anxiety (Julian, 2011).
The exploratory factor analyses supported a single-factor structure, with satisfactory item loadings indicating that the seven retained items contribute meaningfully to the underlying construct. Although the first factor explained a moderate proportion of variance, this result should be interpreted in light of the scale’s purpose and the convergence of psychometric evidence. The SAS was designed as a brief global measure covering heterogeneous manifestations of school anxiety, which may naturally increase item-specific variance. The unidimensional solution was therefore retained not on the basis of explained variance alone, but because it was consistently supported by the scree plot, parallel analysis, factor loadings, model fit, reliability, and convergent validity evidence.
Some items showed relatively high uniqueness values, particularly those reflecting somatic discomfort, social-evaluative discomfort, and intrusive thoughts. Item 3, which refers to headache, also showed the lowest factor loading across the three samples. This pattern is theoretically plausible, as headaches may reflect school-related anxiety but can also be influenced by broader factors such as fatigue, general stress, health status, or nonspecific somatic complaints. However, the item was retained because somatic manifestations are a core component of anxiety responses and are particularly relevant in children, who may express distress through bodily symptoms. Its inclusion therefore helps preserve the content breadth of a brief scale and prevents the measure from focusing too narrowly on cognitive anxiety alone. Importantly, item 3 remained significantly associated with the latent factor and did not form a separate interpretable dimension. Moreover, the overall unidimensional structure was consistently supported across analyses.
Confirmatory factor analyses on independent samples further supported the scale’s unidimensional structure, with good-to-excellent fit across conventional indices. Measurement invariance testing provided preliminary evidence of configural and metric invariance across gender, suggesting that the factor structure and item–factor relationships were broadly comparable in boys and girls. However, because scalar invariance was not supported, firm conclusions about full gender equivalence or latent mean comparisons cannot yet be drawn. In addition, the scale showed good internal consistency and good test–retest reliability in both the French and Swiss samples, underscoring the measure’s stability over time. Convergent validity was demonstrated by a strong positive correlation with the trait-STAIC (Spielberger, 1973), consistent with previous findings (García-Fernández et al., 2010, García-Fernández, Inglés, & Martínez-Monteagudo, 2011; García-Fernández, Martínez-Monteagudo, & Inglés, 2011). In addition, a weak negative correlation with the School Satisfaction Scale (Fenouillet et al., 2015) suggested that the instrument captures a construct inversely related to school satisfaction, thereby providing further evidence of theoretically expected associations with related constructs. Taken together, the results revealed satisfactory psychometric properties in both the French and Swiss samples, indicating that the instrument is appropriate for assessing school anxiety.
Research, Clinical and Educational Implications
Although the SAS was not derived from the SQ or SAI, it captures several core manifestations of school anxiety also represented in these instruments, including cognitive, behavioral and physiological domains associated with school-related anxiety. However, unlike the SQ and SAI, which provide multidimensional and highly detailed assessments of specific anxiety-provoking school situations (e.g., social evaluation, school failure, aggression), the SAS was intentionally designed as a brief screening instrument. Consequently, it does not aim to assess the full range of situational dimensions covered by these more comprehensive measures. Moreover, the short version of the SAS does not include behavioral domains, although these were represented in the original long version. It also includes items related to social evaluation and school failure anxiety, but not to aggression.
Compared to existing validated instruments such as the School Questionnaire (SQ; Phillips, 1978) and the School Anxiety Inventory (SAI; García-Fernández, Inglés, & Martínez-Monteagudo, 2011; García-Fernández, Martínez-Monteagudo, & Inglés, 2011), the SAS offers several key advantages. While both the SQ and SAI provide comprehensive assessments of school anxiety, their length and complexity make them less practical for use in school settings, particularly when time and resources are limited. In contrast, the present scale is brief, comprising only seven items, and is therefore easy to administer and score. It covers core cognitive, emotional, and physiological aspects of school anxiety in a concise manner, allowing for efficient screening and early identification of anxious students. This makes it especially suitable for use by teachers and school psychologists in both primary and secondary educational contexts.
Beyond clinical and educational applications, the scale also represents a valuable research tool for advancing research on school anxiety. The limited availability of brief and user-friendly instruments has likely contributed to the scarcity of large-scale investigations. Its brevity and ease of administration, make it particularly suitable for large-scale studies in French-speaking populations. In particular, it can help address the current lack of nationally representative epidemiological data that specifically assess school anxiety (as distinct from general anxiety or broader emotional disorders) in countries such as France and Switzerland (Motreff et al., 2024).
Furthermore, in line with previous research, there is a growing need for school-based prevention and psychoeducational programs aimed at reducing students’ emotional distress in educational settings (McDonald et al., 2023). Previous studies have identified emotional competence, emotional regulation skills, resilience, and positive teacher–student relationships as factors associated with lower levels of school anxiety (Fiorilli et al., 2020; Petrides et al., 2018; Salter et al., 2024). In this context, the SAS may represent a useful tool for the early identification of students experiencing school anxiety and for evaluating changes in anxiety levels following school-based interventions or prevention programs.
Limitations and Future Directions
Several limitations of this study suggest directions for future research. First, the scale was validated only in pupils aged 8–13. Further investigations with both younger primary school children and older secondary school students would be valuable. Second, conducting validations in English and other languages would facilitate cross-national research and extend the scale’s relevance beyond French-speaking contexts. Third, although configural and metric invariance were supported, scalar invariance could not be confirmed in the Swiss sample. Given the relatively modest group sizes (93 girls, 101 boys), these invariance findings should be considered preliminary. Future studies should re-examine measurement invariance in larger samples and test partial scalar invariance to determine whether meaningful gender comparisons are possible after freeing non-invariant item intercepts. Item-level differential item functioning (DIF) analyses would also help determine whether specific items function differently across gender groups. In addition, developing normative data stratified by sex and age may enhance the descriptive interpretation of scores in educational and clinical contexts. However, such norms should not be considered a substitute for scalar invariance; rather, they should be developed and interpreted in light of further evidence on item-level functioning and measurement equivalence. Finally, although convergent validity with trait anxiety was confirmed, further work is needed to evaluate the scale in relation to conceptually related but distinct constructs, such as school refusal and social anxiety, by comparing it with other established measures in these domains.
Conclusion
School anxiety is an increasingly prevalent issue across global educational systems. However, validated and easily administered instruments for its assessment remain limited. This study sought to address this gap by developing and validating a new brief scale specifically designed to assess school anxiety in students at the late primary and early secondary levels. The scale exhibited strong psychometric properties, including good model fit, high reliability, and robust internal consistency. These findings indicate that the instrument is a reliable tool for the early identification and screening of school anxiety within this age group. Furthermore, validation across both French and Swiss samples highlights its cross-cultural applicability and reinforces its utility in diverse educational and research settings.
Supplemental Material
Supplemental material - The School Anxiety Scale: A Psychometrically Sound and Time-Efficient Tool to Identify School Anxiety in Children
Supplemental material for The School Anxiety Scale: A Psychometrically Sound and Time-Efficient Tool to Identify School Anxiety in Children by Jérémy Pouille, Myrto Atzemian, Rebecca Shankland, Catherine Martinet, Quentin Hallez, Natacha Boissicat, Valentin Flaudias, Pascal Bressoux in Journal of Psychoeducational Assessment.
Footnotes

Ethical Considerations
The research protocol was approved by the French National Education Ministry and, in Switzerland, by the Education Research Coordinating Committee and the Cantonal Commission for Ethics in Human Research of Vaud (Project-ID 2022-00908). Data were anonymized in accordance with the GDPR. Written consent was obtained from legal guardians, school directors, and teachers. In France, children provided verbal assent, whereas in Switzerland written assent was collected. It should be noted that the present study draws on data from two broader studies conducted respectively in France and Switzerland.
Author Contributions
RS, PB, VF and CM, supervised and managed the project. JP and MA recruited all the participants and collected and coded the data. JP contributed to the conceptualization of the scale. JP and QH managed the statistical analyses. MA, JP and QH wrote the first draft of the manuscript. All authors provided critical feedback and helped shape the final version of the manuscript and approved the submitted version of this article.
Funding
The authors received no financial support for the research, authorship, and/or publication of this article.
Declaration of Conflicting Interests
The authors declared no potential conflicts of interest with respect to the research, authorship, and/or publication of this article.
Data Availability Statement
The data that support the findings of this study are available from the corresponding author upon request.
Generative Artificial Intelligence (AI)
ChatGPT (OpenAI) was used to assist with English language editing and stylistic refinement of the manuscript; the authors take full responsibility for the content.
Supplemental Material
Supplemental material for this article is available online.
Appendix A
Appendix B
Total Variance Explained from the Exploratory Factor Analysis (Principal Axis Factoring) Note. Extraction method = Principal Axis Factoring; rotation = oblique (promax). Factor Loadings from the Exploratory Factor Analysis (Pattern Matrix)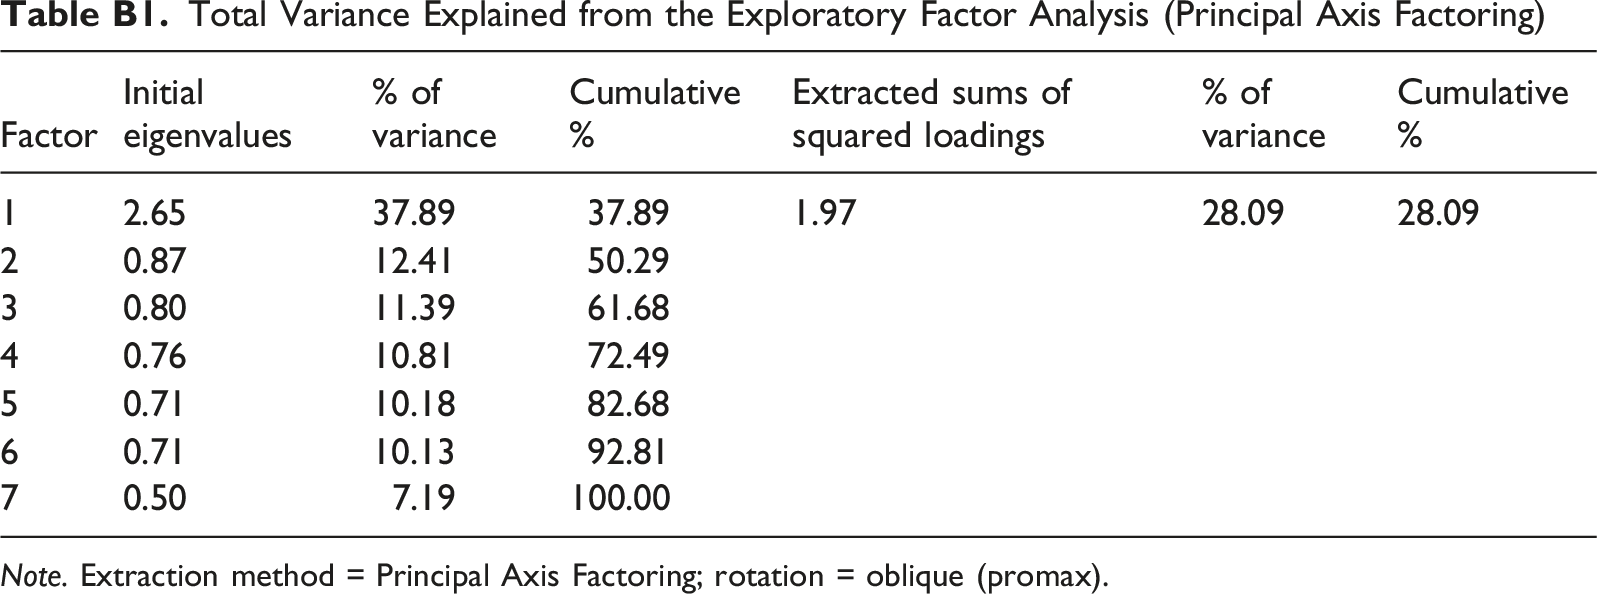
Factor
Initial eigenvalues
% of variance
Cumulative %
Extracted sums of squared loadings
% of variance
Cumulative %
1
2.65
37.89
37.89
1.97
28.09
28.09
2
0.87
12.41
50.29
3
0.80
11.39
61.68
4
0.76
10.81
72.49
5
0.71
10.18
82.68
6
0.71
10.13
92.81
7
0.50
7.19
100.00
Item
Factor 1
Item1
0.60
Item2
0.46
Item3
0.45
Item4
0.45
Item5
0.53
Item6
0.45
Item7
0.71
References
Supplementary Material
Please find the following supplemental material available below.
For Open Access articles published under a Creative Commons License, all supplemental material carries the same license as the article it is associated with.
For non-Open Access articles published, all supplemental material carries a non-exclusive license, and permission requests for re-use of supplemental material or any part of supplemental material shall be sent directly to the copyright owner as specified in the copyright notice associated with the article.
