






Abstract
The Perception of Inclusion Questionnaire (PIQ) is a 12-item tool measuring students’ emotional well-being, social inclusion, and academic self-concept. To validly compare scores across groups or time, measurement invariance must be established. This study assessed the longitudinal and gender invariance of the PIQ with 201 students aged 11–14. Analyses confirmed strict longitudinal invariance across metric, scalar, and residual levels, confirming the PIQ is suitable for tracking changes over time in adolescence. For gender, strict invariance was found at ages 11 and 12, but only partial scalar invariance at ages 13 and 14. Results also indicated that the model’s quality and internal consistency improved over the years, while completion time significantly decreased. The study concludes that the PIQ possesses strong invariance properties for longitudinal research and for comparing girls and boys, particularly in early adolescence.
Keywords
Introduction
Providing, inclusive, quality education for all children is one of the United Nations’ sustainable development goals for 2030 (United Nations, 2015). Quality education is not limited to the acquisition of academic skills but must also promote social inclusion and well-being (UNESCO, 2004). To achieve this goal, it is necessary to be able to measure the quality of inclusion for all students with reliable tools. The Perception of Inclusion Questionnaire (PIQ, Venetz et al., 2015) was originally developed as a German-language questionnaire assessing school inclusion of students aged 8 to 16 with or without special educational needs. It is composed of 12 items and measures students’ inclusion at school along three dimensions, emotional well-being, social inclusion and academic self-concept. Emotional well-being, social inclusion and academic self-concept are closely related to a feeling of belonging, satisfaction, and engagement in school (see e.g., Kyttälä et al., 2023). Moreover, emotional well-being and social inclusion are essential for realizing a truly inclusive school environment (e.g., Guillemot & Hessels, 2021), implying meaningful experiences of social interaction, as well as empathic relationships with and acceptance by schoolmates (Koster et al., 2009; Pozas et al., 2023). Social and emotional competences determine a student’s functioning in school (Berkovits & Baker, 2014) and are related to academic success (see e.g., Bücker et al., 2018). Finally, it has been shown that learning outcomes of students with special educational needs can be high in inclusive settings (Dessemontet et al., 2012). Sound learning experiences and a positive academic self-concept mutually reinforce each other with favorable effects on learning outcomes (e.g., DeVries et al., 2021). Each dimension of the PIQ is assessed with four items, formulated in very simple terms, for example, for emotional inclusion, “I like going to school,” for social inclusion “I have a lot of friends in my class” and for academic self-concept “I am a fast learner.” In each dimension, one item is reversed, for example, “I have no desire to go to school.” Respondents position themselves on a 4-modality Lickert scale from “not at all true” to “certainly true.” The questionnaire has been translated into 25 languages and is available in three versions: one for students (PIQ student), one for parents (PIQ parents) and one for teachers (PIQ teacher). Recently, also, a version for younger pupils has been proposed (PIQ-Early), with the particularity of not proposing negatively formulated items (Grüter et al., 2023). The various versions are all available online at https://piqinfo.ch/. The questionnaire has been the object of studies in Austria, Germany, Switzerland, France, Spain, Italy, Saudi Arabia, Mexico, Finland, Poland, Sweden, Slovenia and China since 2017. The Perceptions of Inclusion Questionnaire (PIQ) has been widely applied across various countries and research contexts beyond its core purpose of measuring the three dimensions of inclusion. Its usage spans diverse topics, such as the role of inclusion in fostering resilience for victims of bullying (Ganotz et al., 2021) or analyzing friendship networks in inclusive classrooms (Garrote et al., 2023). Researchers have also employed the PIQ to investigate how school placement and parents’ social capital influence the perception of inclusion in children with physical disabilities (Finnvold & Dokken, 2023). In Saudi Arabia, a study showed the relation between teachers’ perceived use of inclusive practices, and social and academic inclusion measured with the PIQ (Alnahdi et al., 2022). Furthermore, it has assessed the academic self-concept and social inclusion of students with specific needs, such as behavioral, emotional, and social difficulties (Zdoupas & Laubenstein, 2023). Other studies have utilized the PIQ to explore its relationship with classroom climate (Hoffmann et al., 2021) measure the impact of interventions designed to improve school climate (Weber et al., 2021), and validate other questionnaires (Schwab et al., 2018).
When using a questionnaire to compare several groups or to measure the evolution of psychological characteristics over time, it is important to know its invariance properties. Indeed, if a scale used to assess a particular dimension does not show evidence of longitudinal invariance, then interpreting changes over time becomes hazardous (Horn & McArdle, 1992). Since the interpretation of a construct may change over time, developmental psychologists need to ascertain the longitudinal invariance of the measures used (Putnick & Bornstein, 2016). When measurement invariance is demonstrated, the measures represent the same constructs in different groups and/or at different points in time. Conversely, when measurement invariance is not guaranteed, the construct measured may be quite different across groups, or at different times (Putnick & Bornstein, 2016). Widaman and Reise (1997) outline four levels of measurement invariance: configural, metric, scalar, and residual. Configural invariance requires an equivalent model structure across groups. Metric invariance adds the requirement of equal factor loadings. Scalar invariance further demands equal intercepts. Residual invariance, the strictest level, requires equal residuals. Each level permits specific comparisons. Configural invariance indicates the same constructs are being measured. Metric invariance allows comparison of structural parameters and correlations. Scalar invariance enables comparison of latent variable scores. Residual invariance indicates equivalent measurement error. Complete invariance across all levels is rare. When not achieved, researchers often establish partial measurement invariance by relaxing equality constraints for some loadings or intercepts. There is no full consensus, but Vandenberg (2002) suggests a factor can be considered invariant if the majority of its items are invariant.
A number of studies have examined the longitudinal invariance of questionnaires relating to well-being or life satisfaction at school. Ortiz et al. (2021) demonstrated longitudinal invariance in the measurement of subjective well-being in adolescents aged 11–14 with the Subjective Happiness Scale questionnaire, which consists of four questions on a single dimension. Similarly, Ng et al. (2018) demonstrated longitudinal invariance of the Brief Multidimensional Students’ Life Satisfaction Scale (BMLSS), a short five-item self-report scale, between the ages of 12 and 13. A longitudinal invariance study between ages 4 and 12 of the Satisfaction With Life scale (SWLS; four items) revealed scalar invariance but no residual invariance (Guhn et al., 2018). For other questionnaires, on the other hand, longitudinal invariance was rejected, for example, the Emotional Activity Sociability Temperament Survey (EAS) between the ages of 14 and 17 (Spence et al., 2013). It is much more difficult to obtain longitudinal invariance for multifactor models when the initial measurement model does not show very good psychometric qualities than it is for single-factor models. Gender invariance has been the subject of a larger number of studies. For example, for the Satisfaction With Life Scale (SWLS), residual gender invariance has been demonstrated at ages 9 and 12 (Guhn et al., 2018). In France, the same questionnaire showed scalar invariance by gender for students between 8 and 16 years of age, without distinguishing between the different ages (Bacro et al., 2019). Jovanović et al. (2022) obtained the same result with this questionnaire on a sample of 22,710 adolescents between the ages of 13 and 19 from different countries. Emerson et al. (2017), in their review of the literature, concluded that the majority of studies had demonstrated measurement invariance of this scale according to gender However, recent studies have shown that differences in well-being between girls and boys begin to appear at around 12–13 years of age (González-Carrasco et al., 2017; Yoon et al., 2023). These studies show that girls’ averages decline more sharply during adolescence, but do not indicate whether the scale used is invariant across gender.
The psychometric properties of the PIQ were studied in different countries and for students of different ages. A systematic search identified 18 studies (see Supplemental Materials), that either directly addressed PIQ’s psychometric properties or established these properties before using the data to answer a particular research question. The three-factor model showed good goodness of fit in all studies except Poland (Zwierzchowska et al., 2022). Gender invariance has been partially or strictly demonstrated in various studies (DeVries et al., 2018; Guillemot & Hessels, 2021; Knickenberg et al., 2022; Palma, 2024; Pozas et al., 2023; Schmidt et al., 2021; Wang et al., 2024). The study of invariance according to having special educational needs or according to placement showed that students with special educational needs had more difficulty with negatively worded items (Zurbriggen et al., 2017), scalar invariance (DeVries et al., 2018, 2021; Schmidt et al., 2021) or partial scalar invariance (Knickenberg et al., 2019; Palma, 2024; Pozas et al., 2023) have been demonstrated. Scalar invariance according to the age or class of the student has been demonstrated, for example, in two measurements taken 4 months apart (Grüter et al., 2023), or partially by comparing two grades (DeVries et al., 2021; Knickenberg et al., 2019). One study investigated invariance between two countries (Germany and Saudi Arabia), and only metric invariance was achieved (Alnahdi & Schwab, 2020). Longitudinal invariance was explored in the study by DeVries et al. (2018) over 2 years, scalar longitudinal invariance was established between grade 6 and grade 7, that is, for students aged around 11–12 years.
The present review of the literature reveals the growing interest among researchers for using the PIQ and the various invariance studies that have been conducted with this instrument. Nevertheless, only one study has looked at the longitudinal invariance of the PIQ over 2 years (DeVries et al., 2018). The aim of present research is to evaluate the longitudinal invariance of the PIQ over a period of 4 years and to study gender invariance across that same time span. Given the results of other studies hitherto, we expect at least partially scaler invariance according to gender to be established at each age. For longitudinal invariance, the study is innovative and it is somewhat more difficult to predict our findings. Nevertheless, drawing on demonstrated results from other questionnaires measuring related constructs, such as in Ortiz et al.’s study with a unidimensional scale (2021), we have reason to expect that longitudinal scalar invariance may be established. Even though the research literature suggests that measurement invariance is considerably harder to obtain when questionnaires comprise multiple dimensions (Spence et al., 2013), the very sound psychometric indices of the PIQ-scales demonstrated previously, let us presume that scalar invariance, or at least partial invariance, may be obtained. Thus, we expect to find at least partial scalar invariance for gender and, possibly, longitudinal scalar invariance.
Method
Transparency and Openness
The data is open access at the following address https://osf.io/jbrz5/?view_only=4db37511922a4a09b2c017abc1f76487.
Participants
The study took place in a secondary school in Loire Atlantique (France) over four consecutive years, from 2020 to 2023. In 2020, parents and students were asked to take part in the study, and 97% responded positively. During the first survey in November 2020 (T1), the students were in 10 different sixth grade classes. They were surveyed again in seventh grade (November 2021: T2), eighth grade (November 2022: T3) and ninth grade (November 2023: T4). The tests were completed by all students at a given level: 287 students participated at T1, 268 at T2, 262 at T3, and 250 at T4. Each year, newly arrived students joined the study, while others discontinued for reasons such as moving to another district or city, repeating a year because of learning difficulties, or simply being absent due to illness on the day of the study. A total of 324 secondary school students took part in at least one of the four surveys, with 201 students responding to all four surveys, representing approximately 75% of the students who completed the questionnaire at T1. The average age of the students who took part in the four waves was 11.4 (SD = 0.4) at T1 and 14.4 (SD = 0.4) at T4. The percentage of girls in the total sample was 53.6%, and students with special educational needs made up 12.3% of the sample. Of the students who responded 4 times, 55.7% were girls and 10.0% of the sample were students with special education needs. The proportion of girls in the final sample is slightly higher than in the total sample, whereas the percentage of students with special educational needs is slightly lower. This probably reflects the fact that boys repeated a grade more often than girls, which excluded them from the study, while new boys appeared in the cohort because they had repeated in a subsequent grade. The status of students with special educational needs was communicated by the school administration. These concerned students with disabilities or students with significant learning difficulties. Specific educational accommodations had been implemented for these students. The data collected in 2020 gave rise to the first article validating the PIQ (Guillemot & Hessels, 2021).
Measures
The students completed the French version of the PIQ questionnaire (https://piqinfo.ch/sprachversionen/). The questionnaire consists of 12 statements that students are asked to rate on a four-point Likert scale from “strongly disagree” (1) to “strongly agree” (4). The items are divided into three dimensions: emotional well-being, social inclusion and academic self-concept. For each dimension, one item is formulated negatively. The scores on each dimension are obtained by averaging the four corresponding items after reversing the scores of the negatively worded items. The average scores are between 1 and 4, the higher the score the greater the inclusion measured on this dimension.
Protocol
Each year, the questionnaires were administered during two science or technology lessons in the school’s computer rooms, half of the class per session, with the teachers present. Firstly, the students were asked to consent to taking part in the study. After having registered the student’s consent, the PIQ questions were displayed one at a time. At the end of the questionnaire, socio-demographic information was collected. A researcher was present during the first rounds of questioning to ensure that everything went smoothly and to respond to any difficulties, after which the teachers dealt with their classes alone. The teachers and researchers were available to answer any questions that students had difficulty understanding. In the first year (age 11–T1), the researchers noted that the students had some difficulty using the computer and answering the questionnaire on screen. From the second year (age 12–T2) onwards, the questionnaires were completed more easily and more quickly. Completion times were recorded.
Statistical Analysis
Measurement invariance, both longitudinal invariance over 4 years and according to gender was tested using Confirmatory Factorial Analysis models (CFA). The models were tested using R (R Core Team, 2023) and the lavaan package (Rosseel, 2012). To test longitudinal invariance, nested models are tested, starting with the lowest number of constraints and adding successively more constraints. Unlike measurement invariance across groups, longitudinal designs allow for correlations between residual errors of the same item across successive waves. Explicitly modeling these residual correlations accounts for the temporal dependency inherent in longitudinal data (Padgett, 2023). The diagonally weighted least squares (DWLS) estimator proposed by Muthén (1993) was used. The approach followed is that of Padgett (2023), inspired by Wu and Estabrook (2016) see Supplemental Materials for more details on statistical analyses.
Results
An attrition analysis was first performed to ensure that the final retained sample (201 students with four time points) did not significantly differ from the initial sample at T1 (N = 287). Comparisons were made between students who participated 4 times (n = 201, retained) and those present at T1, but who then were absent at least once (n = 86, non-participants). The retained sample had a higher proportion of girls and fewer students with special educational needs (SEN), though chi-square tests indicated these differences were not significant (χ2 (1,287) = 1.15, p = .28 for gender; χ2 (1,287) = 2.37, p = .13 for SEN). Welch’s tests revealed that the retained sample had significantly higher means for emotional PIQ (t (168.7) = 2.57, p = .01, d = 0.33) and academic PIQ (t (138.2) = -3.12, p = .002, d = 0.42), whereas social PIQ showed no significant difference (t (133.8) = 1.48, p = .14, d = 0.20). Therefore, the retained sample was comparable to the initial sample regarding gender and SEN composition, but had significantly higher emotional and academic PIQ scores.
Completion Time and Internal Consistency of the Scales
The average response time for the 12 questions in the PIQ was 2.30 min (SD = 0.67 min) in the first year (11 years-T1), 1.95 min (SD = 0.77) in the second year (12 years-T2), 1.96 min (SD = 0.71) in the third year (13 years-T3) and 1.61 min (SD = 0.37) in the final year (14 years-T4). A repeated measures analysis of variance and Bonferroni post-hoc tests show a significant difference in the time taken to complete the questionnaire between the different ages, with a significant drop between 11 and 12 years and between 13 and 14 years of age F (3,600) = 45.4, p < .001, η2 = 0.13, see Figure 1. Mean response time, internal consistency and comparative fit index (CFI by age)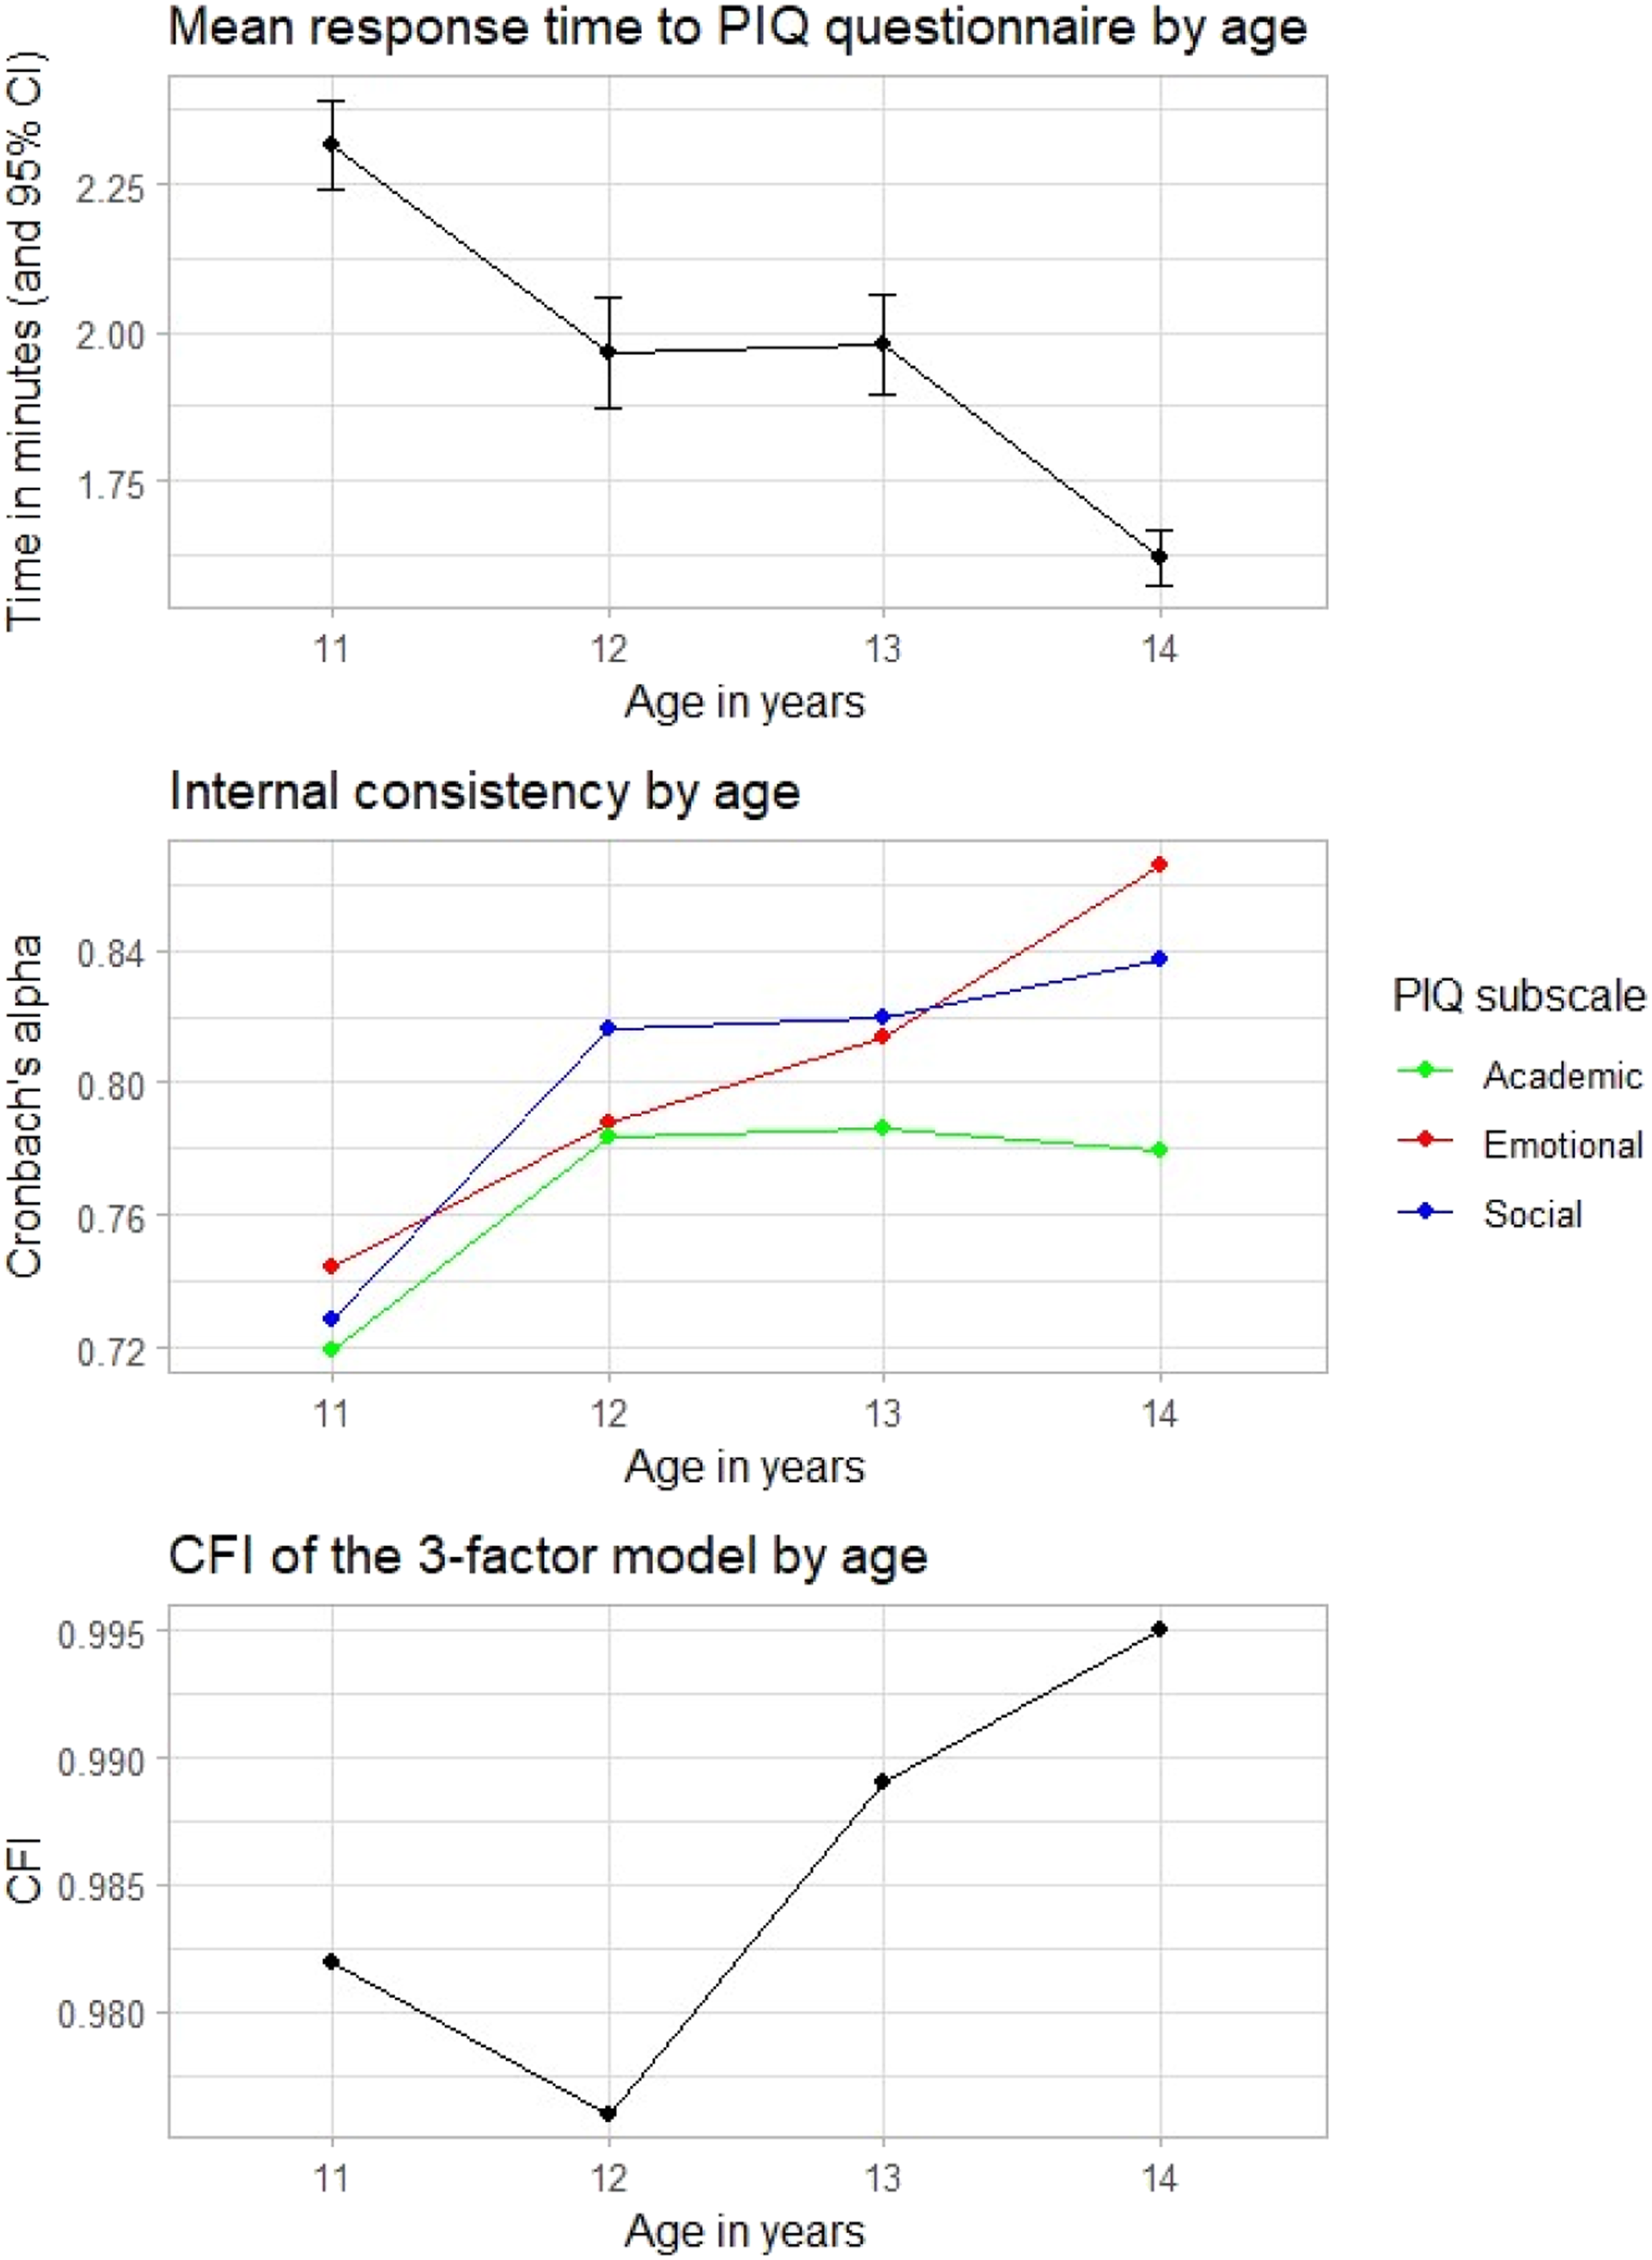
Over time, the internal consistency of the various subscales (Cronbach’s alphas and McDonald’s omega) improved. The internal consistency coefficients were calculated at the four measurement times for the three dimensions of the PIQ and are presented in Figure 1. The internal consistency coefficients are higher at 14 years-T4 (between 0.78 and 0.87) than at 11 years-T1 (between 0.72 and 0.74).
Longitudinal Invariance
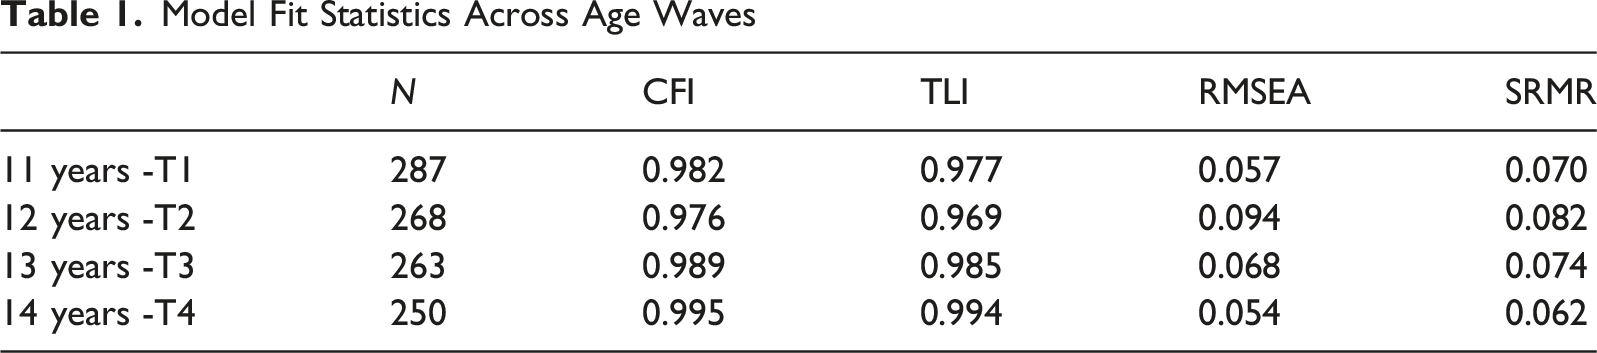
Model Fitting at Ages 11, 12, 13 and 14
Model Fit Statistics Across Age Waves
Measurement Invariance Between Ages 11, 12, 13 and 14
Fit Indices for Configural, Threshold, Metric, Scalar, and Residual Invariance Models
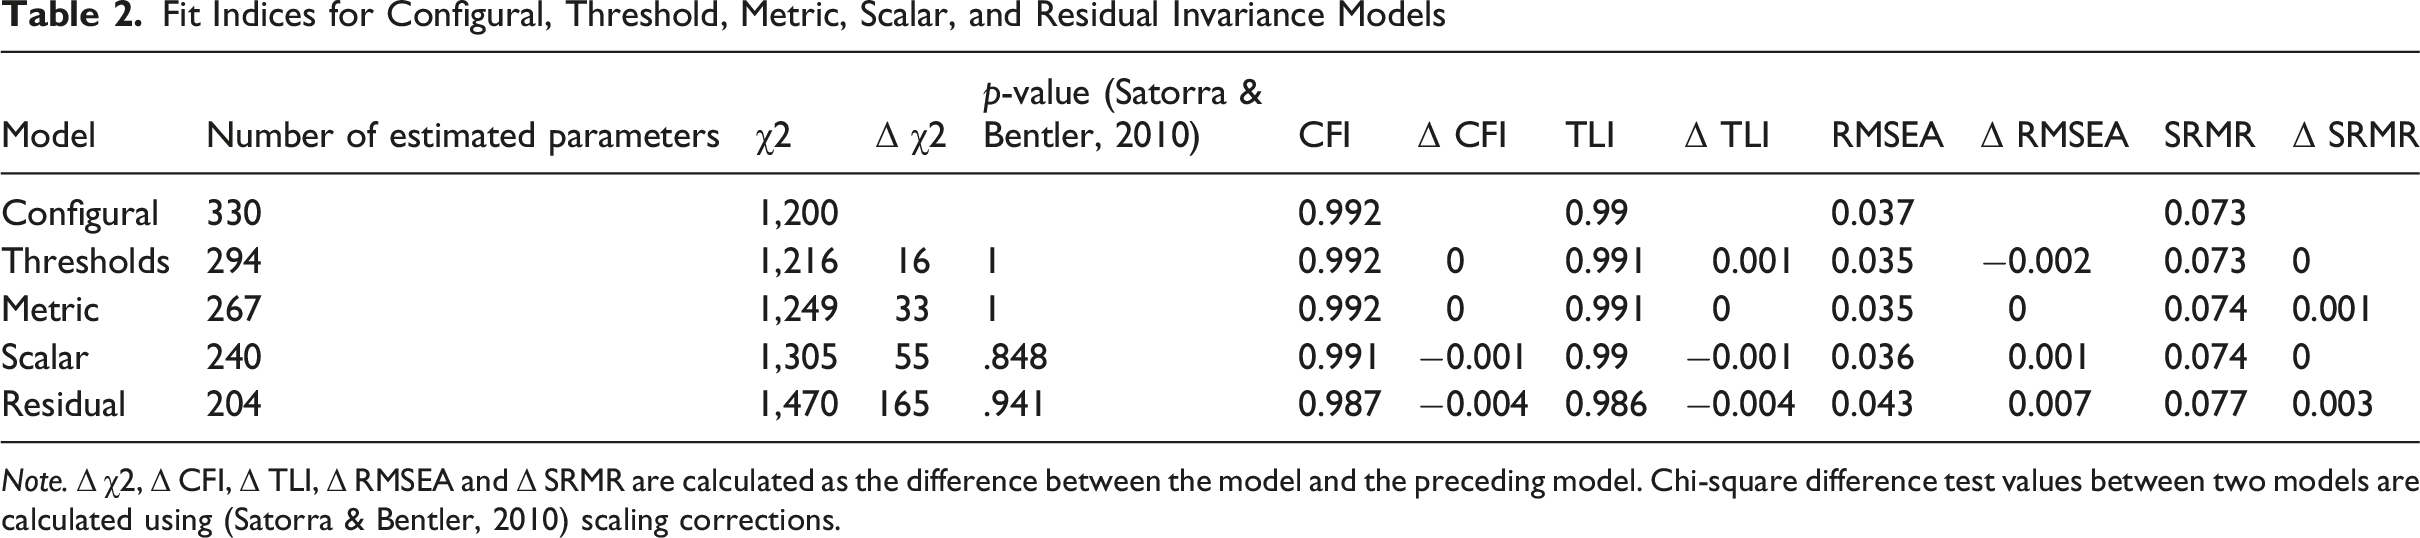
Note. Δ χ2, Δ CFI, Δ TLI, Δ RMSEA and Δ SRMR are calculated as the difference between the model and the preceding model. Chi-square difference test values between two models are calculated using (Satorra & Bentler, 2010) scaling corrections.
Gender Invariance
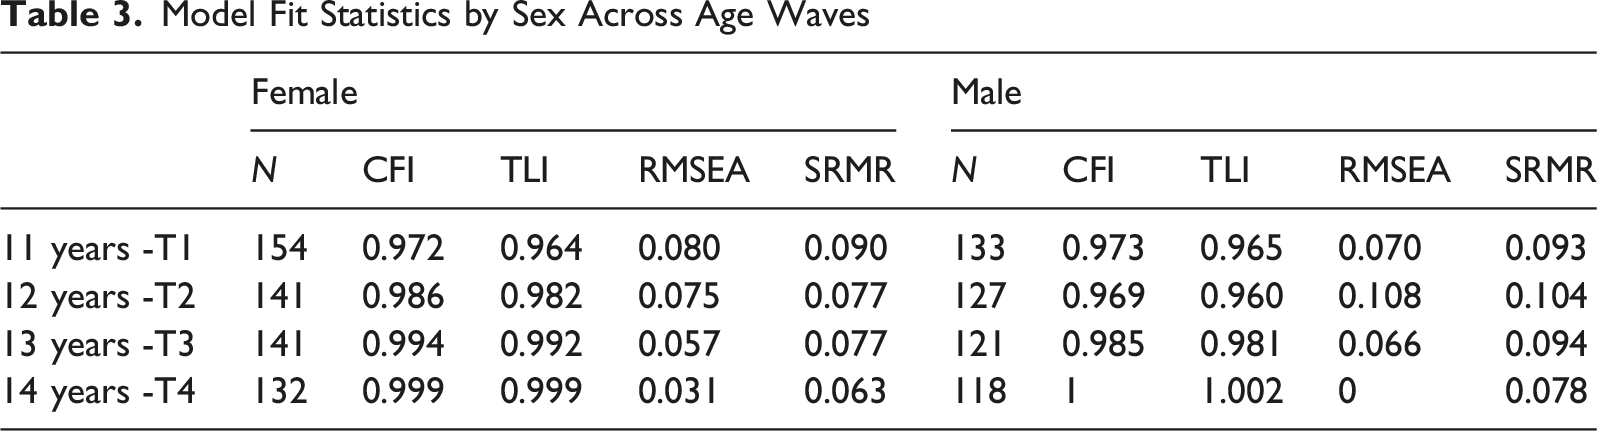
Adjustment of Models to 11, 12, 13 and 14 Years Depending on Gender
Model Fit Statistics by Sex Across Age Waves
Measurement Invariance by Gender at T1, T2, T3 and T4
Measurement invariance by gender was then tested at each age. At ages 11 and 12, residual invariance (strict invariance) is achieved. Variations in the CFI and TLI of the RMSEA and SRMR between two consecutive models are below the recommended thresholds (see Supplemental Materials). At age 13, only the configurational invariance of the first model (M1) was confirmed, while metric invariance was not completely obtained due to a variation in RMSEA equal to 0.035 (greater than 0.03) combined with a significant chi-square test. The analysis of modification indices indicated that the largest improvement in model fit would be achieved by relaxing the equality constraint on the factor loading of the third item in the emotional domain (“I like it in school”). The associated modification index was χ2 (1) = 20.03, p < .001, which exceeds the commonly adopted threshold of 3.85. Inspection of the item loadings revealed a substantial difference between groups: the loading was 2.8 for girls and 1.1 for boys. It was therefore decided in the second model (M2) to relax the assumption of equal factor weights between girls and boys for this item. For this new model (M2) the differences between the models for the CFI and TLI (ΔCFI and ΔTLI) remain below 0.01, for the RMSEA, the difference between the configural and metric models is now ΔRMSEA = 0.008, which is less than 0.03, for the scalar models the variation is less than 0.015. However, the variation ΔRMSEA is greater than 0.015 between the scalar and residual models. Thus, only partial scalar invariance is achieved. Taken together, these results lead us to conclude that there is partial scalar invariance according to gender at age 13.
At age 14, only metric invariance was achieved for the first model (M1). Scalar invariance was not supported, as the RMSEA increased by 0.018 between the metric and scalar models, exceeding the recommended threshold of 0.015. The analysis of modification indices revealed that the largest improvement in model fit would be achieved by relaxing the equality constraint between girls and boys on the second item of the academic domain (“I am able to solve very difficult exercises”). The modification index for this parameter was χ2 (1) = 5.42, p < .05. In this model, the factor loading of the second academic item differed significantly between girls and boys (0.964 for girls, 1.794 for boys). After this item was relaxed, scalar invariance was achieved, but residual invariance was still not obtained, with an RMSEA variation greater than 0.015. Thus, at age 14, partial scalar invariance according to gender was demonstrated.
Discussion
The paucity of studies focusing on longitudinal invariance was shown in our review of the literature and overview of the studies carried out with the PIQ. Demonstrating measurement invariance is particularly important when researchers wish to study changes in scores on a questionnaire over time or compare different groups and more studies are required. Measurement invariance was tested using the conventional thresholds from the literature (Chen, 2007; Cheung & Rensvold, 2002; Hu & Bentler, 1999). One must be aware, however, that these thresholds are not entirely suitable for assessing longitudinal invariance. Unfortunately, until now, there is no consensus or single answer for choosing these thresholds, especially when DWLS estimators are employed. The thresholds used in this study were defined specifically for this research and rigorously applied to all results. Consequently, a number of consistent results could be established.
Therefore, the first part of our study focused on longitudinal invariance. The attrition analysis first of all shows that the retained sample (students who responded at all 4 time points) has broadly the same composition (with regard to gender and the presence of special educational needs) as the initial sample (students who responded at T1). However, the emotional well-being and academic self-concept of students who were absent at one of the subsequent time points were significantly lower. This can be explained by higher absenteeism rates among students with lower school well-being, a finding that is consistent with the results of Korhonen et al. (2014), who showed that low academic well-being is associated with higher school dropout rates. Next the results indicate that the time needed to complete the PIQ is very short (less than 3 min on average) and decreases over time. Furthermore, a gradual improvement over time is observed regarding the psychometric properties of the questionnaire. Indices for internal consistency increased and the goodness-of-fit of the three-factor model was greater at age 14 than at age 11. One explanation of these results may be that the questionnaire is better understood with increasing age. The study by Schwab et al. (2020) with the PIQ, which included responses of parents, teachers and students, supports this view. The authors found better psychometric properties for the versions of the questionnaire intended for parents and teachers than for student version. This suggests that the older the respondent, the better the understanding of the questionnaire and, consequently, the better the psychometric qualities. Another explanation may be that a sensitization effect exists, since students answered the questionnaire 4 times and, thus, became increasingly familiar with the questions, which lead to better psychometric qualities. Although the context is somewhat different, such effects are also observed when cognitive tests are administered repeatedly: with each repetition, participants need less time to answer the familiar questions and accuracy increases, regardless of age (Tao et al., 2019). It is very well likely that the two factors are concurrent, that is, that the improvements in response time and psychometric properties are the result of both a sensitization effect and an improvement in the understanding of the questions as the students grow older.
Next, the PIQ showed excellent longitudinal measurement invariance between the ages of 11 and 14, with strict invariance, corresponding to invariance of the configuration, factor loadings, intercepts and residuals, demonstrated. These results complement those of DeVries et al. (2018), which showed longitudinal invariance between the ages of 11 and 12. Our results concur with those obtained in studies with single-dimension scales relating to the quality of life of adolescents which also demonstrated longitudinal invariance, such as the Subjective Happiness Scale (Ortiz et al., 2021), the Brief Multidimensional Students’ Life Satisfaction Scale (Ng et al., 2018) and the Satisfaction With Life scale (Guhn et al., 2018). Rejoicingly, compared to other multidimensional questionnaires, the PIQ seems to be much more robust regarding measurement invariance. For example, for the Emotional Activity Sociability Temperament Survey (EAS), Spence et al. (2013) showed that the three-factor model did not present good configurational invariance. The authors had to resort to a four-factor model with items that saturated on several dimensions to obtain longitudinal invariance. Indeed, from the start, the authors of the PIQ (Venetz et al., 2015) aimed to create three short unidimensional scales, each with only four very discriminative items, while paying attention to linguistic simplification and gender-appropriate wording. This led to an instrument with three clearly distinct dimensions with very high reliability and very good fit to a multi-unidimensional graded response model (GRM). Also, differential item functioning (DIF) between students with and without learning difficulties (LD) showed little to no bias (Zurbriggen et al., 2017). The PIQ was thus founded on a very sound theoretical and methodological basis. This has certainly contributed to the fact that the PIQ demonstrates excellent longitudinal invariance. In sum, the PIQ demonstrates invariance properties comparable to those of unidimensional instruments, notwithstanding its multidimensional nature. This strength may be explained by several factors. First, the clear differentiation between its three subscales, a characteristic not necessarily shared by the multidimensional instruments discussed earlier. Also, the highly straightforward wording of the items and their unequivocal interpretation appear independent of the age of the participants. Furthermore, the concepts measured and their qualitative structure also appear to be relatively stable over time which most likely also contributes to the stability of the measures. Consequently, it is possible to conduct longitudinal studies of variations in emotional well-being, social inclusion, and academic self-concept using this instrument.
The second part of the study examined gender invariance, which appears more difficult to obtain than longitudinal invariance given the increasing psychosocial differentiation between girls and boys during adolescence. In our study, at ages 11 and 12, the maximum level of invariance was reached, namely residual (strict) invariance. This result is in line with the majority of the results obtained with the Satisfaction With Life Scale (SWLS), according to the literature review by Emerson et al. (2017). However, in our study ages vary from 11 to 14 years of age. As mentioned, at ages 11 and 12, strict invariance is achieved, but at 13, only configurational invariance was demonstrated. The weight of the item “I like it in school” diverged between boys and girls, the latter group having a much greater weight in the area of emotional inclusion. After relaxing the hypothesis of equality of the weight of this item for girls and boys, (partial) scalar invariance was demonstrated. Similarly, at age 14, only metric invariance could be demonstrated. The item ‘I am able to solve very difficult exercises’ showed a much greater weigh for boys than for girls regarding academic self-concept. By not imposing equal weights for this item, (partial) scalar invariance was demonstrated. Thus, the PIQ shows excellent measurement invariance properties according to gender at ages 11 and 12, but somewhat less at ages 13 and 14. These results can be explained by qualitative differences, that is, a stronger differentiation between girls and boys during adolescence. Studies in which gender invariance was demonstrated, made no distinctions related to age. In this sense, our study can be considered more precise. The results of the present study are consistent with those found in other studies with the PIQ. For ages under 12, the questionnaire has the highest gender invariance properties, both scalar and residual (DeVries et al., 2018, 2021; Guillemot & Hessels, 2021; Schmidt et al., 2021), whereas for older children only partial scalar invariance can be achieved (Pozas et al., 2023). This result is also perfectly consistent with that of Knickenberg et al. (2022), whose first study with children aged 9–10 showed scalar invariance and second study with children aged 12–14 showed only partial invariance. Unfortunately, the items of which the weights had to be released to obtain partial invariance were not specified in the study by Knickenberg et al. (2022) and Pozas et al. (2023).
Indeed, during adolescence, a growing differentiation between girls and boys emerges. Yoon et al. (2023), using the Strengths and Difficulties Questionnaire (SDQ), observed disparities in girls’ and boys’ well-being. At age 11, there was little difference and at ages 11–12, the differences remain minimal. However, at ages 13–14, differences in subjective well-being and total scale scores, are observed. Similarly, González-Carrasco et al. (2017) showed that the decline in subjective well-being is more pronounced for girls than for boys between the ages of 10 and 15. Nevertheless, these studies did not specify whether measurement invariance for the instruments used had been demonstrated. Our study shows that at ages 11 and 12, the concepts measured by the PIQ are identical for boys and girls, but that certain items do not have the same meaning for girls and boys at ages 13 and 14.
To summarize, the PIQ is an excellent tool for longitudinally studying variations in the perception of inclusion between the ages of 11 and 14. Longitudinal invariance makes it possible to compare averages between years. Furthermore, the PIQ questionnaire is perfectly suited to studying differences between girls and boys at ages 11 and 12. At ages 13 and 14, since total scalar invariance has not been achieved, it is necessary to remain cautious when comparing averages between girls and boys, especially regarding the dimension of emotional well-being at age 13 and the dimension of academic self-concept at age 14. Nevertheless, following Vandenberg (2002), the influence of one item on the total score is limited, and will thus have little influence on mean comparisons. For the last dimension (social inclusion), comparisons of averages are possible without special precautions at all ages.
A first limitation emerged from the attrition analysis. Longitudinal invariance was established with the sample that completed all measures at all time points. This sample exhibited a slightly higher emotional well-being and academic self-concept at baseline than the original sample. Since we were unable to longitudinally assess all students, we must be somewhat cautious regarding the generalizability of our findings. Future, probably also more qualitative research, should complement research like ours to obtain a more detailed picture of the well-being and academic self-concept of students who show high absenteeism and who, according to our data, may be more at risk, including those who repeat grades and dropouts. A second key limitation is the inability to disentangle repetition effects from age-related maturation in the longitudinal design. While psychometric performance improves with age, it remains unclear whether this results from genuine developmental gains or mere practice from repeated testing. Future studies should incorporate an independent cross-sectional control group to isolate these confounding factors. A compelling direction for future research is to examine measurement invariance between students with and without Special Educational Needs (SEN). Other studies demonstrated that he PIQ questionnaire is particularly suited for students with Special Educational Needs (SEN), The limited size of the SEN subgroup in our sample precluded such an analysis. To achieve sufficient statistical power, a future study would require a minimum of 100 SEN participants and a matched control group of equal size. This design would enable a rigorous test of whether the instrument’s items function equivalently across both groups.
It can be concluded that the PIQ is a very simple and economic instrument to administer (on average, the response time is under 3 min for the 12 items). Its French version demonstrates excellent properties of longitudinal invariance from ages 11–14 and good measurement invariance properties by gender (particularly at ages 11 and 12). Therefore, the PIQ can be considered a reliable tool for assessing the perception of inclusion of students between the ages of 11 and 14. It allows for longitudinal and gender-based comparisons across the three domains of the PIQ: emotional inclusion, social inclusion, and academic self-esteem.
Supplemental Material
Supplemental material - The Perceptions of Inclusion Questionnaire (PIQ) in 11- to 14-Year-Old French Students: Longitudinal and Gender Measurement Invariance
Supplemental material for The Perceptions of Inclusion Questionnaire (PIQ) in 11- to 14-Year-Old French Students: Longitudinal and Gender Measurement Invariance by Françoise Guillemot and Marco G. P. Hessels in Journal of Psychoeducational Assessment
Footnotes

Ethical Considerations
The study began in 2019, and there was no ethics committee at the University of Nantes.
Consent to Participate
The parents have agreed to their children’s participation. The children gave their consent for their participation in each phase of the study.
Funding
The authors received no financial support for the research, authorship, and/or publication of this article.
Declaration of Conflicting Interests
The authors declared no potential conflicts of interest with respect to the research, authorship, and/or publication of this article.
Supplemental Material
Supplemental material for this article is available online.
References
Supplementary Material
Please find the following supplemental material available below.
For Open Access articles published under a Creative Commons License, all supplemental material carries the same license as the article it is associated with.
For non-Open Access articles published, all supplemental material carries a non-exclusive license, and permission requests for re-use of supplemental material or any part of supplemental material shall be sent directly to the copyright owner as specified in the copyright notice associated with the article.
