






Abstract
A substantial body of research supports the use of data-based decision making (DBDM) to support student reading progress, particularly in the areas of foundational skills such as word reading and oral reading fluency; less is known about DBDM in the context of reading comprehension. In this study, we compared a researcher-developed content-specific curriculum-based measurement (CS-CBM) with a standardized Maze CBM to determine the ways in which these sources of data may mediate student reading comprehension outcomes. Students’ progress was monitored using the CS-CBM and the Maze CBM during a reading comprehension intervention (Strategies for Reading Information and Vocabulary Effectively; STRIVE) paired with data-based decision making (DBDM). Findings reveal that both measures have potential utility in the decision-making process; the CS-CBM may be more predictive of outcomes as well as more sensitive to student growth over time, specifically for students receiving content-area reading comprehension intervention.
Keywords
Measurement of student learning is an essential part of the educational process for all students. For students with and at-risk for learning disabilities, more frequent data collection and decision-making are needed to intensify intervention (Santi & Vaughn, 2007; Stecker et al., 2008). Curriculum-based measurement (CBM), a collection of brief, psychometrically sound progress monitoring tools, were created to be an efficient and systematic assessment of academic skills over time (Deno, 1985). Using CBM, teachers administer assessments on a weekly basis and graph individual student progress towards a global outcome over time to determine whether a student demonstrates adequate response to academic intervention, a process referred to as data-based decision making (DBDM; National Center on Intensive Intervention, 2013).
A wealth of studies demonstrate the effects of DBDM on student achievement across academic areas (Jung et al., 2018; Stecker et al., 2008), including reading (Filderman et al., 2018). However, most of this research is on decoding; there are substantially fewer studies on DBDM for reading comprehension (Filderman et al., 2018), which comprises a variety of unconstrained (e.g., complex, more gradually emerging) skills that may be more challenging to capture for the purposes of DBDM (Catts & Kamhi, 2017). In the present study, we compare the reliability, and utility, of two progress monitoring tools (i.e., Maze curriculum-based measurement [CBM], content-specific [CS]-CBM) used to intensify a reading comprehension intervention for 5th grade students with reading difficulties.
Progress Monitoring Measures for Reading Comprehension
It has traditionally been difficult to capture the construct of reading comprehension with standardized assessment due to the complexity of requisite subskills (Catts & Kamhi, 2017; Filderman et al., 2022). Despite this challenge, several measures have been used as indicators of reading comprehension for the purposes of progress monitoring, or gathering global indicators of student progress in reading, even if they don’t directly measure reading comprehension. Although originally developed as a fluency measure that could be administered in groups via the computer rather than relying on oral read-aloud, the Maze CBM, a passage with missing words that requires students to select which word makes the most sense from a choice of three options within 2.5 to 3 minutes, is frequently used to measure reading comprehension (Wayman et al., 2007). Research has demonstrated that the Maze may not in itself be a measure of reading comprehension, with substantiated arguments that it relies more on decoding/silent reading fluency (Keenan et al., 2008; Lekwa et al., 2025; Muijselaar et al., 2017) and sentence-level/syntactical understanding (January & Ardoin, 2012; Jensen & Elbro, 2022; Lekwa et al., 2025; Shanahan et al., 1982) rather than passage-level comprehension. However, the Maze CBM has also been demonstrated to be a valid predictor of performance on comprehension assessments across grade levels (Espin et al., 2010; Shin et al., 2000), including students in intermediate grades (3–5; weighted average r = .65 between Maze and state reading tests; Shin & McMaster, 2019). Therefore, although the Maze CBM may not be a direct measure of reading comprehension, it may still act as a global indicator of growth in reading and has been used as such for decades (Filderman et al., 2018; Jung et al., 2018; Stecker et al., 2008; Wayman et al., 2007). Despite the recommended use of Maze CBM for decision-making, there is limited research on the reliability of this measure for decision-making (Wayman et al., 2007).
An alternative to Maze CBM is content-specific CBM (CS-CBM), a vocabulary-matching measure developed to evaluate student progress in content-area instruction (Espin et al., 2013; Espin & Foegen, 1996). CS-CBM is a timed assessment in which students match vocabulary words to the correct definition in four blocks of five words each, with an additional definition included in each block as a distractor. Although CS-CBM is not a direct measure of reading comprehension, the relationship between vocabulary and reading comprehension is well documented (e.g., Cromley & Azevedo, 2007; Wagner & Ridgewell, 2009), suggesting the potential benefit of considering vocabulary when investigating reading comprehension outcomes. Research documents specific instructional practices, such as having opportunities to interact with the meaning of words (e.g., application activities that extend beyond memorizing a definition), and their positive impact on near-transfer measures of vocabulary acquisition; however, less is known about how to impact far-transfer measures of comprehension (Cervetti et al., 2023; Wright & Cervetti, 2017). Interestingly, CS-CBM has a small to moderate relationship with standardized reading comprehension outcomes for students in 6th grade (range: r = 0.30–0.59; Lembke et al., 2017), suggesting its utility for instructional decision-making in this area. Further, CS-CBM may better reflect student growth because they are better aligned with the content of the specific instruction or intervention being delivered, allowing decisions to be made in shorter amounts of time (Busch & Espin, 2003; Conoyer et al., 2022). Like Maze CBM, CS-CBM has demonstrated moderate to strong alternate form reliability and criterion validity with content-area pre-and post-tests (Conoyer et al., 2022; Espin et al., 2001, 2013; Lembke et al., 2017). In fact, Espin and Foegen (1996) identified vocabulary-matching CBM as being the most efficient and effective way to predict content-area performance. CS-CBM have been documented as effective ways to monitor progress in science (Espin et al., 2013) and social studies (Lembke et al., 2017; Mooney et al., 2010) in middle grades. Additional studies examining the relationships between CS-CBM and reading comprehension, particularly for students in upper elementary grades are warranted to highlight the potential benefits of using CS-CBM to monitor progress of students’ progress.
The current study evaluates the utility of a researcher-developed, intervention-aligned CS-CBM compared to a standardized Maze CBM to determine the ways in which these sources of data may predict student outcomes. In so doing, we seek to add to the evidence base for the utility of these measurement systems for DBDM. Both progress monitoring tools were administered to all students weekly within the context of a social studies-based reading comprehension intensive reading intervention. Specifically, we ask: (1) What is the predictive utility of CS-CBM and Maze CBM in terms of their association with reading comprehension outcome measures? (2) How do CS-CBM and Maze CBM mediate longitudinal relations between pre-intervention and post-intervention reading comprehension outcomes?
Method
Sample
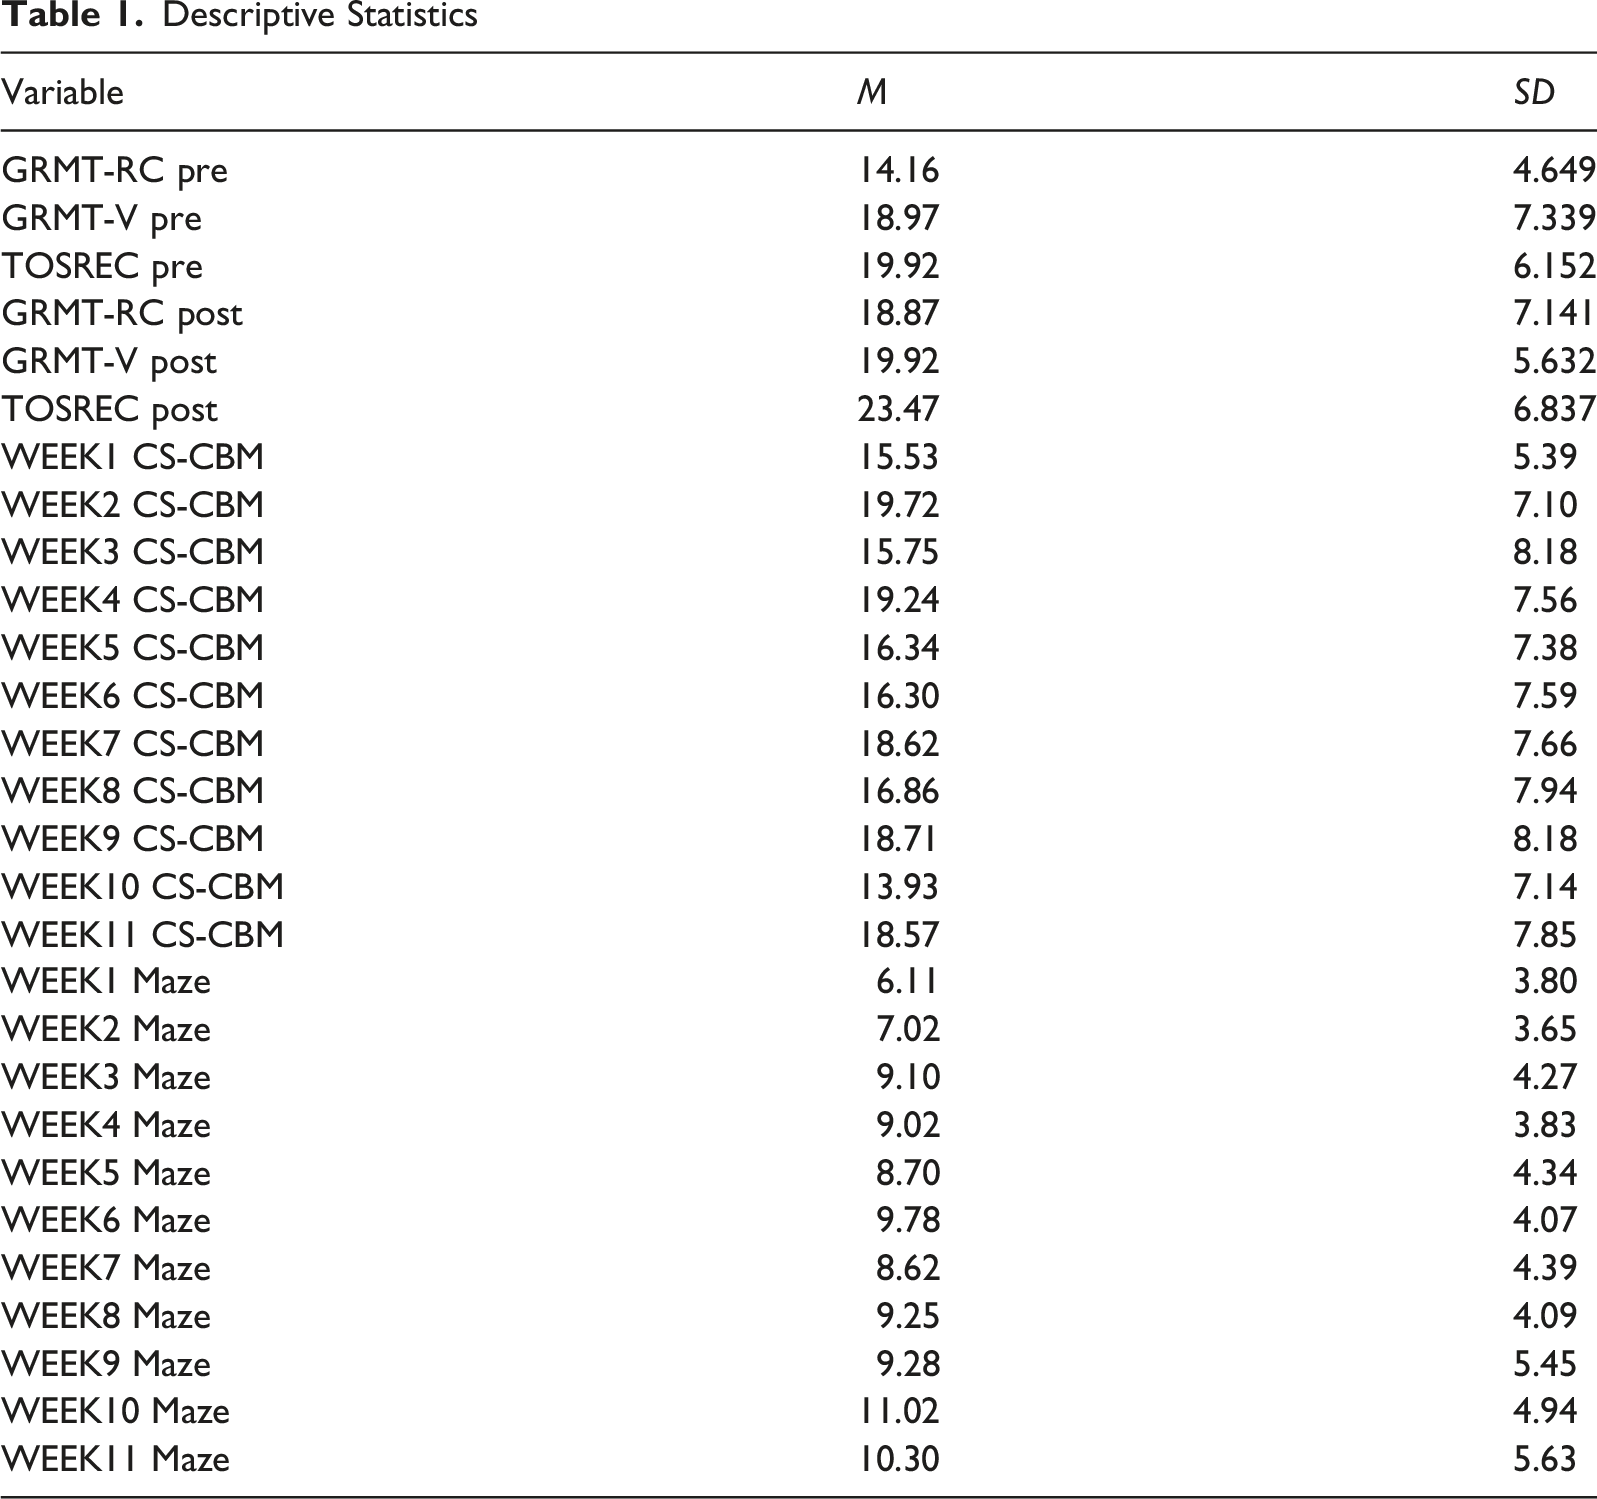
The sample consisted of 62 students in the 5th grade across six schools in the Southeast United States. Approximately 18% (n = 11) of the sample were reported to be White while 74% (n = 46) were Black or African American, 7% (n = 4) were Hispanic, and 2% (n = 1) were Asian. With regard to gender, approximately 42% (n = 26) of the sample reported to female while 58% (n = 36) were male. The average age of the sample was 11.21 years (SD = 0.67). Approximately 82% (n = 51) qualified for free or reduced lunch. Approximately 2% (n = 1) were identified as having limited English proficiency, and roughly 3% (n = 2) were identified as having an Individualized Education Program. Students were eligible for the study if they had a score at or below the 30th percentile on the reading comprehension subtest of the Gates-MacGinitie Reading Test - 4 (GMRT-4; MacGinitie et al., 2002) and above the 20th percentile on the word identification subtest of the Woodcock Reading Mastery Test - 3 (WRMT-3; Woodcock, 2011). The coefficient of variation for the GRMT-4 reading comprehension subtest qualifying scores was 0.33, which suggests more than sufficient variation (M = 14.16, SD = 4.65) precluding any restriction of range.
Procedures
All students received an intervention based on Strategies for Reading Information and Vocabulary Effectively (STRIVE), an evidence-based instructional model that supports reading comprehension using informational social studies text (Simmons et al., 2010; Swanson et al., 2023). Studies have demonstrated STRIVE improved content reading comprehension, content vocabulary, and content knowledge for students with disabilities in an inclusive setting (g = 0.16, 0.32–0.35, and 0.33–0.40, respectively; Swanson et al., 2021); content knowledge (g = 0.50–0.99) and vocabulary (g = 0.45–0.65) when used as a small group intervention (Stevens et al., 2020); and vocabulary (g = 0.87–1.12) when used as an intensive intervention. Instructional activities include building background knowledge, providing explicit vocabulary instruction using semantic maps, posing a multitude of text-based discussion questions, engaging in main idea generation, and combining main ideas to compose summaries. The 45-minute sessions were delivered in small groups of four to five students, three days per week, over 12 weeks.
Each student was monitored once per week with both the Maze CBM and researcher-developed CS-CBM. The measures were administered on different days of the week to avoid testing fatigue and were administered one week apart to the extent possible based on external factors (e.g., school scheduling and student attendance). No other constraints were placed on assessment administration. Data were evaluated at the mid-point of the study (i.e., after 6 weeks of instructional delivery), the minimum recommended time for data use for instructional decision-making (Ardoin et al., 2013), including for Maze CBM (Stecker & Lembke, 2011). Although more than six data points have been demonstrated to increase the accuracy of Maze slopes (e.g., minimum of 10 weeks; Espin et al., 2010; Tichá et al., 2009; Chung et al., 2018), the combination of multiple measures supports accuracy of decisions and is more practical for instructional decision-making and more immediately addresses students’ needs (VanDerHeyden & Burns, 2018).
Specifically, each student’s observed slope was compared with their expected slope. The baseline score was added to the expected slope (.85 words correct per minute per week for Maze, .85 correctly selected words per week for CS-CBM), then multiplied by the number of weeks in the intervention as recommended for reading comprehension progress monitoring measures (Stecker & Lembke, 2011). The Maze CBM was evaluated first as a global indicator of student growth; if the observed slope was above the expected slope, the student was deemed a responder while if the observed slope was lower than the expected slope, the student was deemed in need of further review. We next reviewed the CS-CBM slopes as it was more proximal to the intervention. If the CS-CBM observed slope was also lower than the expected slope, the student was identified as a non-responder in need of additional support. Support was provided within the same small group, with additional supports for non-responders in the form of increased opportunities to respond; scaffolded instruction; and increased immediate, specific, corrective feedback (see Filderman et al., 2025 for more information).
Measures
Descriptive Statistics
Bivariate correlations among variables
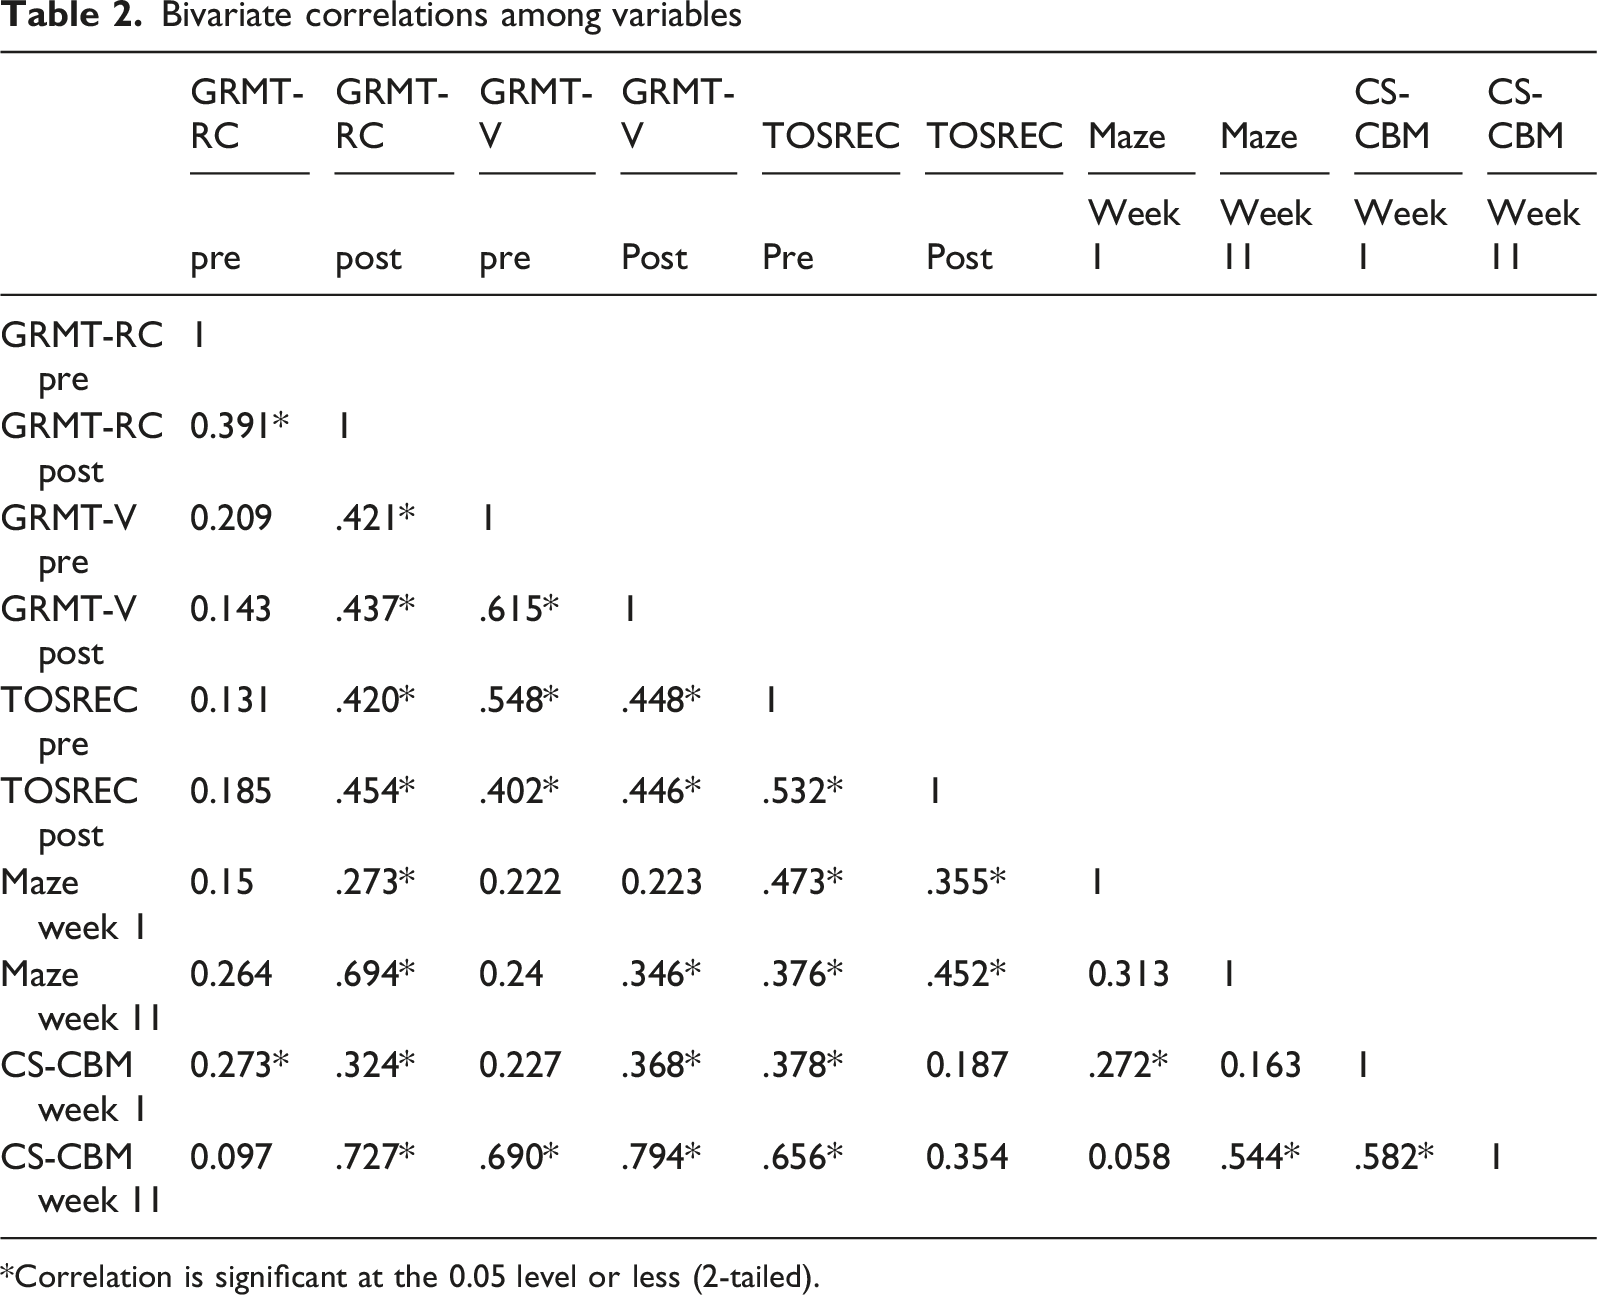
*Correlation is significant at the 0.05 level or less (2-tailed).
Progress Monitoring
Expository passages from the Acadience Maze CBM, a standardized Maze procedure, were used to measure progress monitor reading comprehension. Within each Maze passage, every 7th word was omitted. Students had 2.5 minutes to complete the assessment. Students were instructed to read each passage silently and select the appropriate word choice from a field of three, comprised of one correct response and two distractor responses. Students were scored on the number of correct words selected within the allotted time. For fifth grade students, alternate form reliability is α = 0.77 (Dewey et al., 2015), and predictive criterion-related validity is moderate-strong at r = 0.61–0.65 (beginning to middle of 5th grade, respectively, with Group Reading Assessment and Diagnostic Evaluation criterion; Good et al., 2019).
The CS-CBM, developed by the researchers, was used to monitor progress on content-specific vocabulary. Using recommendations from Espin and colleagues (2013), each form included twenty vocabulary words that were randomly selected out of a total of 61 words taught across the units of the intervention, blocked on unit to ensure equal representation of words from each unit on each form. This technique was to ensure the measure more accurately represented CBM to demonstrate growth over time as opposed to a mastery measure which would indicate mastery of only the terms already instructed. Different forms were provided each week to monitor vocabulary growth throughout the intervention.
Words used on the measure were taken directly from the STRIVE + DBI intervention (Filderman et al., 2021). These words were of high utility and important for social studies understanding (e.g., delegate, exchange, regulate, etc.). Students had 2.5 minutes to match content-specific vocabulary words to the correct definition in four blocks of five words each (e.g., “resource”). In each block, a distractor definition was also included, totaling six possible definitions for every five vocabulary words included (e.g., “something you can use”).
Students were scored on the number of correct definitions matched. As time-series data for a researcher-developed measure, the split-half reliability was α = 0.95 but this may be due to test-retest effects. The canonical correlation between first and second halves of the total weeks was r = 0.85, but again, data were time-series, thus subject to test-retest effects.
Pre-and Post-testing
The Gates-MacGinitie Reading Test fourth edition subtest of reading comprehension (GMRT–4 RC; MacGinitie et al., 2002), a 35-minute timed assessment, consists of 48 items, including narrative and informational passages that vary in length from three to 15 sentences. This subtest was administered in groups of up to 25 students. Students silently read each passage and then answered three to six multiple-choice questions to evaluate their comprehension of the passage. Students were scored based on the total number of correct responses selected. The GMRT-4 vocabulary subtest (GMRT–4 V), a 20-minute timed assessment, consists of 45 vocabulary words frequently encountered from Grades 1 through 12. Students are presented with a target word in context and asked to select the correct definition from a field of five. This assessment was administered in groups of up to 25 students. Students were scored on the total number of correct definitions selected.
Alternative form reliability for the reading comprehension subtest is α = 0.80–0.87 and internal consistency reliability is α = 0.91–0.93 Test-retest reliability and the Kuder–Richardson Formula 20 (K-R 20) reliability coefficient are both α = 0.92 for the vocabulary subtest. The authors report high correlations between fall and spring scores on vocabulary (r = 0.85) and comprehension (r = 0.83), as well as between the GMRT and other standardized assessments (e.g., SAT, state tests), although no statistics or further details are provided.
The Test of Silent Reading Efficiency and Comprehension (TOSREC), a three-minute assessment, was used to measure students’ comprehension fluency. Students determined if a given sentence was truthful after reading it silently. To determine the students final score on the assessment, incorrect responses were subtracted from the total number of correct responses. For 5th grade students, alternate form reliability is α = 0.89 (Wagner et al., 2010) and concurrent validity with a state reading test was reported at α = 0.80 (Johnson et al., 2011).
Analyses
Our primary research questions centered on modeling time-varying covariates and their proximal relationships with outcome variables across repeated observations. We utilized multilevel modeling techniques using a Bayes estimator via Mplus (v. 8.0; Muthén & Muthén, 2017) using two Markov Chain Monte Carlo (MCMC) chains to answer the first research question. The small degree of missingness (approximately 7.14%) of the data were handled within the estimator. Progress monitoring data (Maze and CS-CBM scores) were group-mean centered at the individual level to isolate within-person growth across weeks. Given the repeated-measures structure of the data, a two-level model was used, with time points nested within individuals. Multilevel modeling with person-mean centering enabled us to focus on intraindividual processes over time. This structure also allowed us to model contextual effects (within- vs. between-person contributions) without requiring latent variable estimation. Week, included as a fixed effect to model growth trajectories over time, captures the average rate of change across individuals, while the random slope captures person-specific deviations from this average trajectory.
Although we considered latent growth curve modeling, a type of multilevel modeling that incorporates the estimation of latent variables for growth and initial status across longitudinal data, to account for these trends, we selected a two-level Bayesian multilevel modeling approach due to its flexibility in handling small samples and irregular time points. While LGMs are powerful tools for examining individual trajectories and their covariation, they typically assume a more parametric structure of change (e.g., linear or quadratic growth) and may not flexibly accommodate time-varying predictors or changes that do not follow a smooth trajectory. Additionally, the integration of mediators and outcomes in an LGM framework, while informative, can shift the focus of the research questions away from contemporaneous associations toward broader developmental trends which may result in different substantive interpretations of the effects of interest. For more information, we refer to our readers to Curran et al. (2010).
Default prior estimates (e.g., normal distribution) were utilized given this was the first time the intervention was administered, which may be less reliable than informed prior estimates. These are suitable for small sample sizes where informative priors may not be available (see Asparouhov & Muthén, 2021; Muthén & Muthén, 2017). In particular, normal priors for regression coefficients were retained due to their stability in small-sample Bayesian estimation to avoid over-fitting while allowing for model convergence.
The intra-class correlation class value of the unconditional model was r = 0.495 for the Maze and r = 0.569 for CS-CBM without any covariates predicting Maze or CS-CBM scores, which indicates the model may have sufficient variation according to individual without the addition of covariates. Deviance Information Criterion (DIC) values were used for model comparison, with lower values indicating better model fit (Nokelainen et al., 2022). We conducted statistical significance difference testing of the DIC values for the unconditional versus conditional models to indicate whether the conditional model may result in significantly better model fit indicated by a frequentist p-value. Values of r-squared were also reported for the relevant dependent variables, which also indicated acceptable model fit.
To answer the second research question, we estimated the indirect effect of progress monitoring data to determine the degree to which progress monitoring mediated the relationship between outcome measures pre- and post-intervention (i.e., TOSREC, GMRT-RC, GMRT-V, and the latent variable of reading comprehension as a combination of the three measures; please see Figure 1). The indirect effect estimates were divided by the total effect or the sum of the direct effect and indirect effect to calculate the percent mediated. We did not examine the interaction of the two measures because although both scores may be utilized in practice, they would not be aggregated together and then interpreted. Mediation was analyzed using a two-level Bayesian multilevel modeling in Mplus, where pre-test scores predicted post-test outcomes through the indirect pathways of weekly CS-CBM and Maze growth. Unlike traditional Sobel tests, this study utilized a Bayes estimator with Markov Chain Monte Carlo (MCMC) chains to calculate indirect effects, offering a robust method for handling smaller sample sizes. These mediation results are interpreted descriptively as structural associations that clarify the predictive relationship between variables rather than as evidence of a causal mechanism (Hernán, 2018; Shmueli, 2010). Examining the longitudinal relationship between pre- and post-test scores via mediators is critical for identifying which progress monitoring tools effectively capture growth and predict final outcomes, thereby informing the data-based decision-making process for intensifying reading comprehension interventions. Indirect effects were modeled using pre-test scores (GMRT-RC, GMRT-V, TOSREC, and latent composite) as predictors, Maze and CS-CBM as mediators, and corresponding post-test scores as outcomes. Each model according to measure as well as latent factor overall
Results
Descriptive statistics and bivariate correlations are presented in Tables 1 and 2, respectively. Strong positive correlations were found between CS-CBM Week 11 scores and post-test GMRT-RC, GMRT-V, and TOSREC, supporting the predictive validity of CS-CBM. These results complement the path model findings indicating significant associations between CS-CBM and outcome measures. Next, the unconditional model was defined as an intercept-only model accounting for random variation across individuals. The conditional model included fixed effects for pre-test scores and time (Week). The Deviance Information Criterion (DIC) values indicated strong support for the conditional model (ΔDIC = 813.40), consistent with the Bayesian convention that a ΔDIC >10 represents substantial improvement in model fit (Gelman et al., 2013). The unconditional model revealed a DIC value of 9,096.59 with an estimated number of parameters of 181.86. The conditional model DIC value was 8,283.19 with an estimated number of parameters of 254.10. This unconditional model DIC value was significantly larger than the conditional model DIC value, ΔDIC = 813.40, p < .001, which indicates that the conditional model revealed significantly better model fit. Values of r-squared for the dependent variables ranged from r2 = 0.27, p < .001 (Maze) to r2 = 0.44, p < .001 (CS-CBM; Table 2).
Summary of parameter estimates and statistical significance
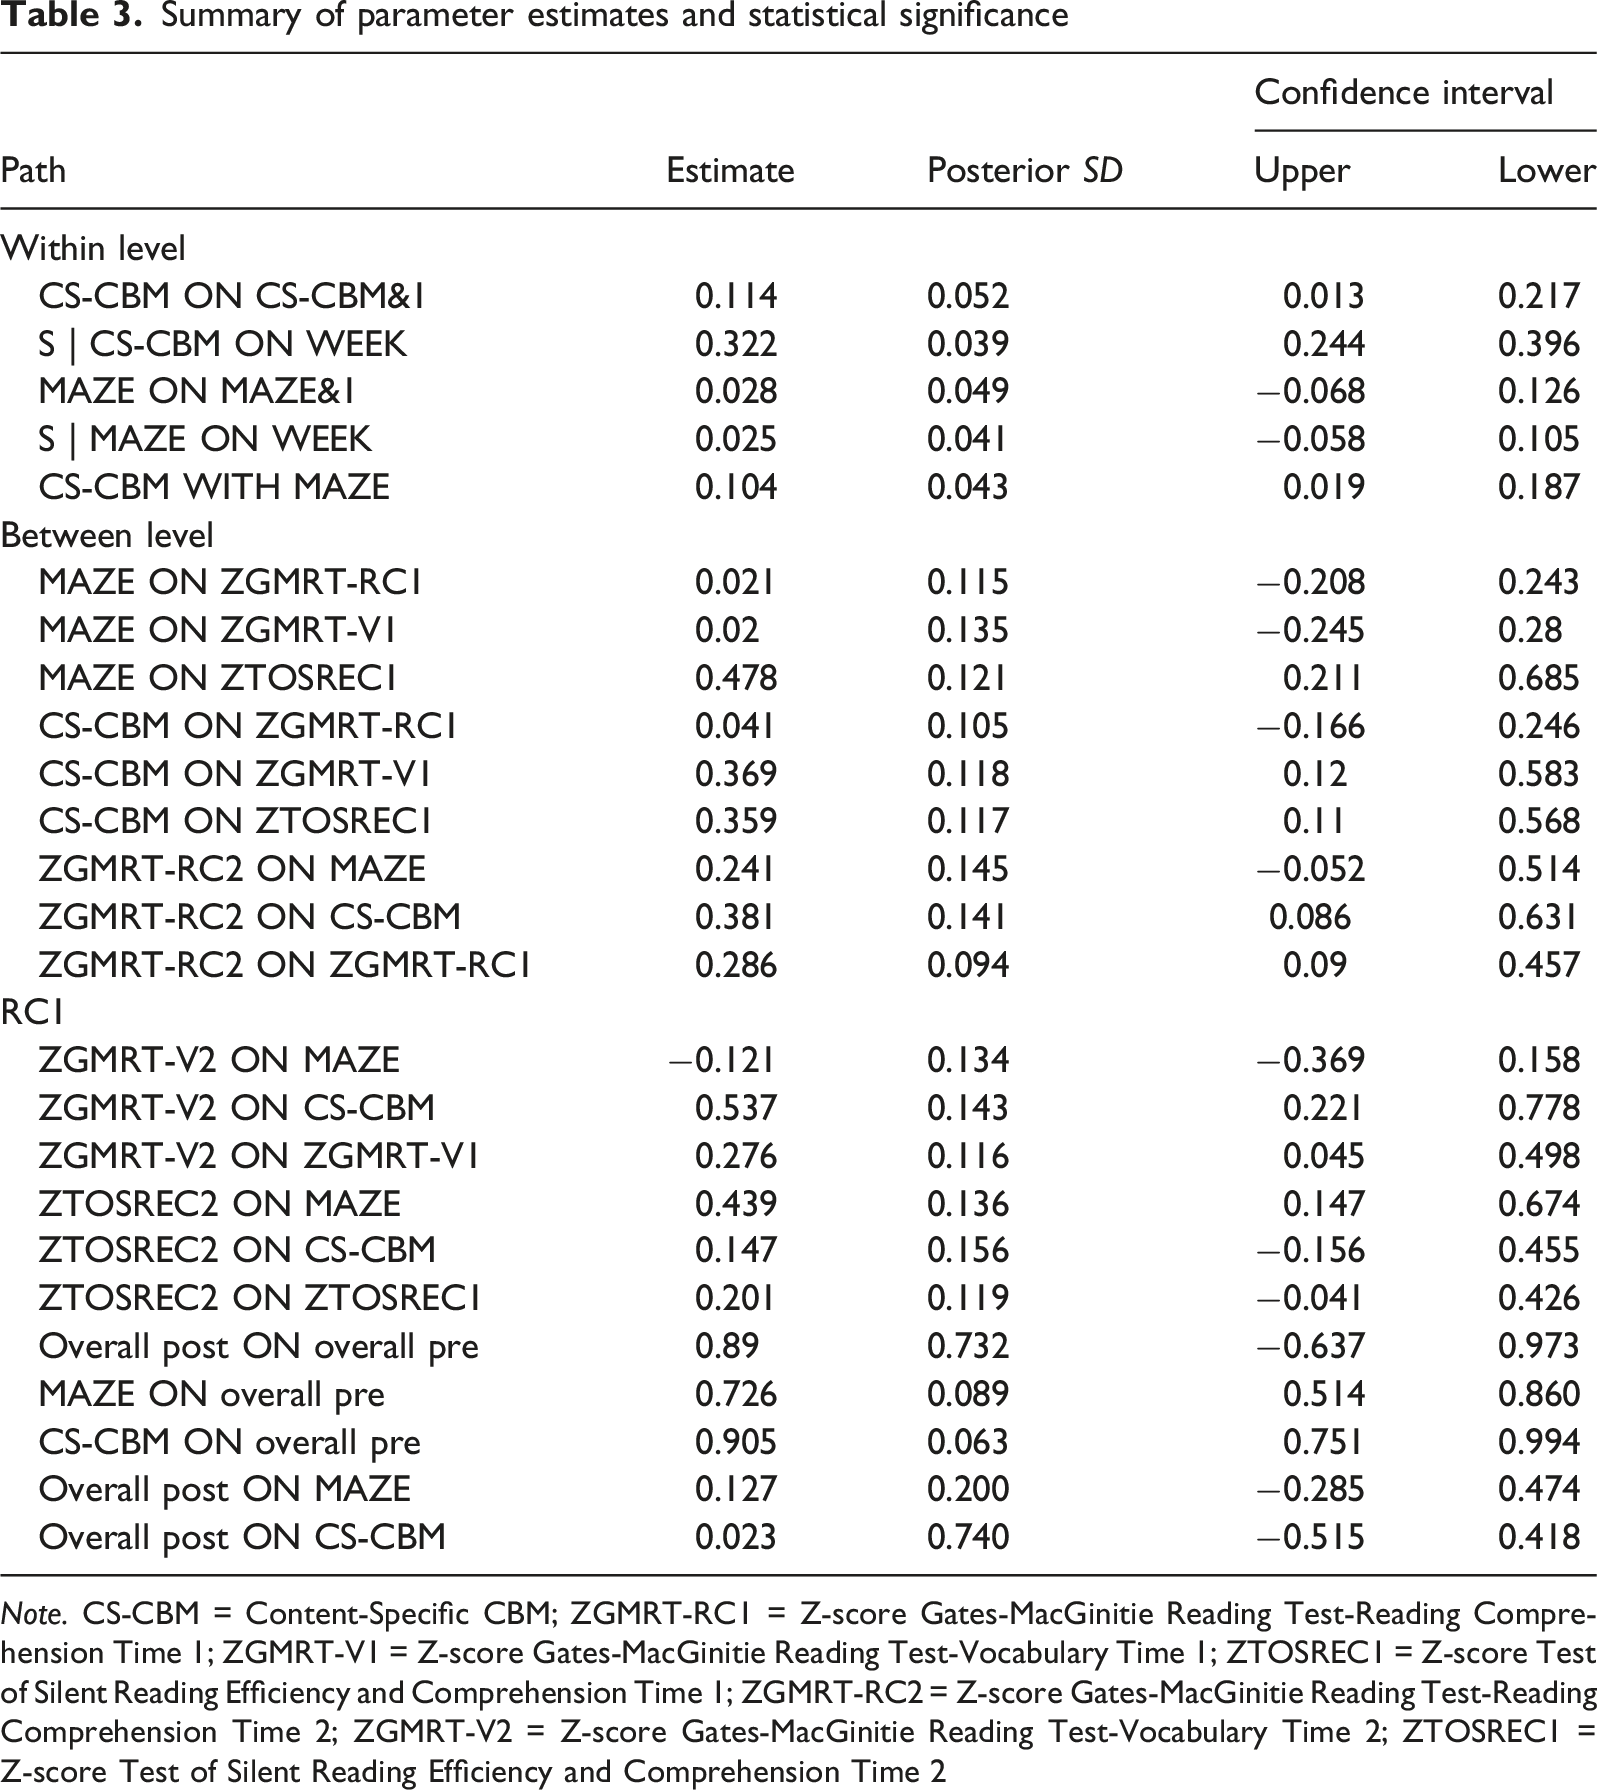
Note. CS-CBM = Content-Specific CBM; ZGMRT-RC1 = Z-score Gates-MacGinitie Reading Test-Reading Comprehension Time 1; ZGMRT-V1 = Z-score Gates-MacGinitie Reading Test-Vocabulary Time 1; ZTOSREC1 = Z-score Test of Silent Reading Efficiency and Comprehension Time 1; ZGMRT-RC2 = Z-score Gates-MacGinitie Reading Test-Reading Comprehension Time 2; ZGMRT-V2 = Z-score Gates-MacGinitie Reading Test-Vocabulary Time 2; ZTOSREC1 = Z-score Test of Silent Reading Efficiency and Comprehension Time 2
Indirect, direct, and total effect estimates
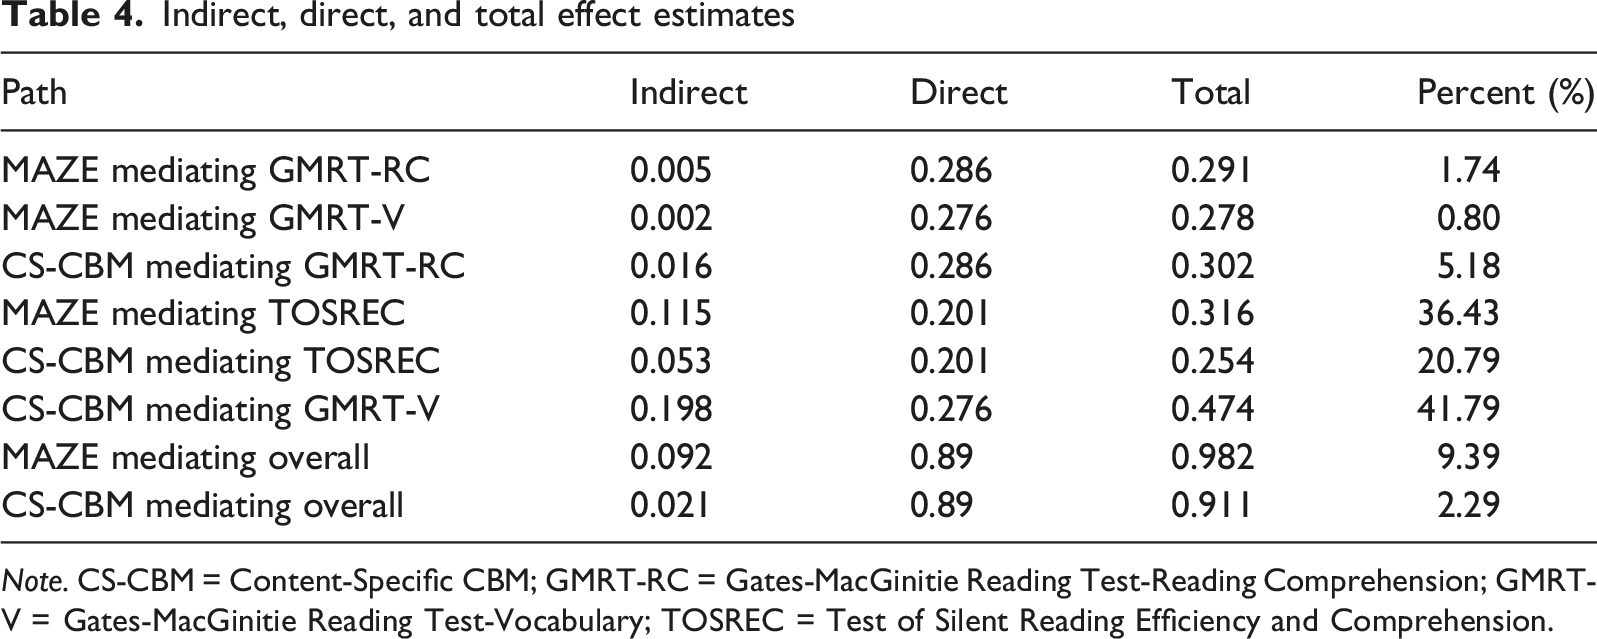
Note. CS-CBM = Content-Specific CBM; GMRT-RC = Gates-MacGinitie Reading Test-Reading Comprehension; GMRT-V = Gates-MacGinitie Reading Test-Vocabulary; TOSREC = Test of Silent Reading Efficiency and Comprehension.
Discussion
The present study explored the utility of the CS-CBM and Maze CBM within the context of monitoring student response to a reading comprehension intervention. As such, we asked: (1) What is the predictive utility of CS-CBM and Maze CBM in terms of their association with reading comprehension outcome measures; and (2) How do CS-CBM and Maze CBM mediate longitudinal relations of reading comprehension? Overall, results indicated the CS-CBM and Maze mediated student TOSREC performance—that is, both measures were strong indicators of students’ subsequent reading comprehension efficiency. Additionally, the CS-CBM mediated students’ performance on the GMRT-V subtest (β = 0.198, Table 4), a lengthier measure of vocabulary knowledge. On the other hand, neither of the measures mediated student response on the GMRT-RC (β = 0.005 for the Maze and β = 0.016 for the CS-CBM), an untimed and lengthier measure that evaluates comprehension of reading passages. Together, these findings indicate both the utility of the measures for reading comprehension intervention and the need for continued research into progress monitoring tools that may be used to understand untimed, global reading comprehension outcomes.
A Comparison of the Maze CBM and CS-CBM
Findings indicate that both measures have potential utility in the decision-making process. First, there was a positive association between the Maze CBM and the CS-CBM (β = 0.104), suggesting that both measures capture a related construct. Second, both the Maze CBM and CS-CBM were related to the overall factor of standardized measures of reading comprehension efficiency at pre- (β = 0.726 for the Maze and β = 0.905 for the CS-CBM) and post-test (β = 0.127 for the Maze and β = 0.023 for the CS-CBM). The current study thus provides additional evidence that aligns with findings in prior studies which indicate the criterion-related validity of both the Maze CBM (Shin & McMaster, 2019; Wayman et al., 2007) and CS-CBM (Espin et al., 2013). The current study builds upon these findings by implementing the measures on a weekly basis and during the course of a reading comprehension intervention. Despite the potential utility of both, a comparison of the measures indicates the CS-CBM may be more predictive of outcomes as well as more sensitive to student growth over time, specifically for students receiving content-area reading comprehension intervention. First, the data for the CS-CBM showed a significant and positive rate of improvement over weeks, while the Maze CBM did not. Maze CBM is a well-established predictor of reading comprehension (Ardoin et al., 2013; Wayman et al., 2007); thus, this is likely due to the variability in scores for the Maze (Ardoin et al., 2013) and the increased alignment of the CS-CBM with the targeted intervention (Espin et al., 2013). Yet, the variability in scores associated with Maze CBM creates a practical challenge when progress monitoring for individual student data. As a result, CS-CBM may be more effective when calculating the rate of progress (i.e., slope) for individual student progress over time, a central tenet of DBDM.
Moreover, the CS-CBM, although not a direct measure of reading comprehension, significantly mediated student response to a latent reading comprehension measure consisting of the GMRT-V, GMRT-RC, and TOSREC. In comparison, the Maze CBM, which is more typically used for instructional decision-making (Filderman et al., 2018), was not significantly associated with the latent reading comprehension measure. These results add to previous literature, which identifies vocabulary-matching measures as a stronger predictor of content performance than Maze CBM (e.g., Espin & Foegen, 1996), and are consistent with previous work documenting a significant relationship between a distal standardized measure of reading and the CS-CBM (e.g., Espin & Foegen, 1996; Lembke et al., 2017). Our findings further suggest that CS-CBM may be used to track student progress in a content-based reading comprehension intervention and may ultimately predict student outcomes on standardized reading comprehension assessments in the long-term. Our results also contribute to the work of Wright & Cervetti (2017) and Cervetti and colleagues (2023) by shedding light on a near-transfer vocabulary measure (CS-CBM) that may actually predict general reading comprehension.
Implications, Limitations, and Future Research
As the Maze CBM did not show strong growth or alignment with other measures, more content-aligned tools like CS-CBM may be more appropriate when monitoring student progress within the context of reading comprehension intervention. This aligns with prior literature emphasizing the need for progress monitoring tools more aligned with the targeted intervention (Busch & Espin, 2003; Conoyer et al., 2022). In practice, teachers and interventionists implement assessments, which begs the question of how feasible it is to expect teachers to (a) develop CS-CBM and (b) engage in ongoing data collection using CS-CBM to support reading comprehension of content-area text. Teachers have a wealth of expertise in identifying key vocabulary within instruction. One possible solution, then, could be the development of an application that randomly generates alternate forms based on the entry of teacher-selected words and student-friendly definitions. Alternatively, we encourage reading comprehension curriculum and intervention developers to consider more aligned progress monitoring tools to facilitate timely and accurate teacher decision-making.
Although we worked with fifth grade to ensure similar content-area standards across states, our sample did not include schools outside of one state. In addition, we only utilized progress monitoring data from one content area (i.e., social studies). Replication studies across other states and other grade levels with different content are necessary. Furthermore, we did not examine the utility of a CS-CBM as a predictor of social studies acquisition using a standardized measure of social studies content. Previous work documents the use of CS-CBM to predict performance on standardized social studies assessments (e.g., Beyers et al., 2013; Mooney et al., 2010). Future work should include opportunities to examine the utility of CS-CBM as both a predictor of standardized social studies assessments and reading assessments.
Another limitation was our sample size, which was relatively small. However, the study utilized a Bayesian multilevel modeling approach, which offers superior flexibility and stability for small samples compared to traditional frequentist methods (van de Schoot et al., 2014). Bayesian analysis does not eliminate the limitations of a small sample size, nor does it reduce the inherent uncertainty of the parameters. Instead, it provides a more robust framework for modeling the probability distribution of those parameters given the available data, especially compared to traditional frequentist methods. This more robust framework employed a Bayes estimator with Markov Chain Monte Carlo (MCMC) chains to calculate indirect effects.
Finally, although inclusion criteria for participants included a measure of word reading to ensure challenges in comprehension were not due to decoding deficits, it is still possible that reading fluency impacted student performance and response to the intervention. Future research may also include screening in reading fluency and/or incorporate a CBM that measures oral reading fluency as another way to understand student reading growth holistically.
Conclusion
In an effort to examine the ways in which a CS-CBM and/or a Maze CBM mediate student reading comprehension outcomes, we investigated their utility within the context of a reading comprehension intervention (STRIVE) in conjunction with DBDM. Findings revealed both measures have potential utility in the decision-making process; the CS-CBM may be more predictive of outcomes as well as more sensitive to student growth over time, specifically for students receiving content-area reading comprehension intervention. Without more research examining these findings across geographical regions and across other content areas, we cannot confirm the CS-CBM is a more useful tool to monitor progress in reading comprehension when implementing DBDM; however, we document encouraging evidence in support of CS-CBM use, which speaks to a need for additional research in this area.
Footnotes

Funding
The authors disclosed receipt of the following financial support for the research, authorship, and/or publication of this article: The research reported in this article was made possible in part by a grant from the Spencer Foundation (#202100245). The views expressed are those of the authors and do not necessarily reflect the views of the Spencer Foundation.
Declaration of Conflicting Interests
The authors declared no potential conflicts of interest with respect to the research, authorship, and/or publication of this article.