
Abstract
While public service motivation (PSM) provides an important theory for understanding the motivations that underpin public sector worker behavior, theoretical connections to the institutional forces that produce and shape PSM remains underexamined. Given other-orientated motives that define part of PSM, exposure to peers from a variety of social backgrounds presents an input that may shape PSM earlier in life. Drawing on insights from intergroup contact theory, we use a nationally representative dataset of high school sophomores to examine the effect of school-level diversity along demographic and socioeconomic dimensions on students’ PSM-related values. Specifically, we use a fixed-effects approach to isolate the contribution of 10th grade exposure to students of a different race or socioeconomic background on 12th grade measures of PSM-related values. We find attending schools with a balanced mix of different-race students has a large and statistically significant impact on students’ PSM-related values by the end of secondary school.
Introduction
“Unity, not uniformity, must be our aim. We attain unity only through variety. Differences must be integrated, not annihilated, nor absorbed. [. . .] We learn how to create the common will in our groups, and we learn here not only the process but its value. [. . .] Without this activity, the forms of democracy are useless, and the aims of democracy are always unfulfilled.” - Mary Parker Follett, The New State, pages 13 and 17, 1918.
Scholars of public management and administration have long considered, debated, and examined the importance of public values, other-regarding motives and behaviors, and obligations to society for governing competing interests in a democracy (Bozeman, 2002; Bertelli & Lynn, 2006; Dewey, 1927; Jørgensen & Bozeman, 2007; Redford, 1969). Public service motivation (PSM), and the motivation public sector workers bring with them into the workforce more generally, remains a core concept in public administration and human resource management (HRM) research and theory (Ritz et al., 2016), and, notwithstanding valid criticisms about measurement and conceptual clarity in the PSM literature (Bozeman & Su, 2015), serves as a useful framework for considering theoretical linkages between individual-level psychological processes and broader social outcomes. Generally, PSM theory argues individuals enter public service with multiple dimensions of motivation, some intrinsic and some extrinsic, and management of public workers should therefore match the different source of motivation among workers in the public and nonprofit sectors (Perry, 1996; Perry & Hondeghem, 2008).
Beyond the implications for managing public sector workers, PSM’s correlation with volunteering, voting, and other civic behaviors (Holt, 2019, 2020; Lee, 2012; Piatak, 2014) suggests the production of PSM serves a broader social function as well. To serve the public well, public service workers should reflect both competence in their jobs but also strong public values in line with the society in which they are situated. How PSM-related values are shaped early in individuals’ lives is important to understand the values public service motivated individuals will ultimately bring into public service employment. One set of values is respect for the diversity that characterizes many societies; as such, we argue contact with dissimilar members of the community can shape PSM-related values.
In recent decades, policymakers, researchers, and practitioners from a variety of disciplines have noted two broader, troubling latent trends in the United States. First, participation in community groups, local government, and other arenas of civic life has declined in some areas of the country (Putnam, 2000). Second, residential and educational segregation has increased or remained at a persistently high level in many parts of the country. The dual trends of withdrawal from civic life and living daily in increasingly homogeneous neighborhoods may be related. Intergroup contact theory, or the idea that interactions with members of different demographic, religious, or socioeconomic backgrounds can engender empathy and connection, provides some insight into the relationship between broader segregation and withdrawal from public life (Allport et al., 1954). Moreover, we argue PSM, focused on concern for the broader community and grounded in public institutions, provides a theoretical link between intergroup contact and putting forth the effort needed for a healthy and robust community. Exposure to the full range of people and circumstances in the community may engender a desire to help others, be more active in the community, and value the public institutions of a given community. Put another way, interacting with a more diverse population of peers may cultivate PSM and PSM-related values.
We draw on data from the Education Longitudinal Study of 2002 (ELS), a nationally representative sample of high school students in the United States, to investigate the link between exposure to different race and different socioeconomic status students in schools and PSM-related values just before graduating secondary school. Schools provide a useful context for testing the link between diversity and PSM-related values for several reasons. First, assignment to schools happens as a result of administrative boundaries and administrative districts created by public officials. That is, practitioners and policymakers have direct control over many of the factors that determine school attendance. Second, the nature of secondary school in the United States means many students will have a variety of opportunities over time for substantive encounters with their peers, both in classes and in extracurricular activities. In short, practitioners and policymakers can influence the administratively determined population of schools, and experiences in schools will largely shape students’ understanding of their broader communities.
We find that, after accounting for school-specific factors and a rich set of observable student characteristics, students who attend schools with a mix of same race and other race students experience larger increases in PSM-related values during high school than peers in either predominantly same race schools or predominantly different race schools. Much of the observed association between exposure to other-race students and PSM-related values is driven by the negative effect of attending on a predominantly white high school on both white and nonwhite students’ PSM-related values. We see similar changes when examining exposure to students from a different socioeconomic group. Against the backdrop of national trends leading to both residential segregation along racial and socioeconomic lines and longstanding concerns about declining social capital, establishing a potential connection between exposure to different groups and PSM may provide a theoretical link between these two phenomena and identify an additional social cost to increasingly homogeneous communities.
In the remainder of the article, we review the relevant literature from PSM and intergroup contact theory, describe our data and analytic methods, present our results, and provide concluding remarks in terms of what these results mean for the future of public service employment and getting public service motivated individuals into the public service.
Literature Review
Public Service Motivation
Since Perry and Wise (1990) first drew on psychological frameworks of motivation to argue for the importance of considering alternatives to self-interest when modeling the behaviors of public workers, a vast literature has grown aiming to develop measures of PSM (Kim et al., 2013; Perry, 1996; Wright et al., 2013) and test the relationship between such motivational bases and behaviors important for public servants (see Perry & Vandenabeele, 2015; Ritz et al., 2016; Wright & Grant, 2010 for reviews). Generally, the literature on PSM falls into three broad buckets: devising and testing measures of PSM, examining the relationship between PSM and outcomes of interest to the field of public management and human resource management, and a much smaller body of work on the antecedents of PSM. While still subject to valid criticism about conceptual clarity (e.g., see Bozeman & Su, 2015), scholars researching PSM have provided empirical evidence that PSM is positively associated with job satisfaction (Brewer & Selden, 1998; Kim, 2005; Kjeldsen & Andersen, 2013), volunteerism and civic engagement (Brewer, 2003; Ertas, 2014; Holt, 2019; Houston, 2006; Lee, 2012; Piatak, 2014), and performance in public facing roles (Andersen et al., 2014; Bellé, 2013; Brewer et al., 2000).
As many scholars have noted, the importance of PSM in seeking work in public service (see Carpenter et al., 2012; Christensen & Wright, 2011; Holt, 2018; Kjeldsen & Andersen, 2013; Lewis & Ng, 2013; but see also Vandenabeele et al., 2014) and in prosocial and civic behaviors (Brewer, 2003; Piatak, 2014; Holt, 2019) suggests institutional arrangements that produce PSM in the broader populace may play an important role in building social capital and strengthening public institutions. In short, the social benefits of PSM may warrant a deeper investigation into the factors that shape individual’s PSM, with particular attention to factors within the control of public administrators and policymakers.
In an early look at the antecedents of PSM, Perry (1997) asked public servants to recall aspects about their childhood and examined the correlation between the recollected experiences and PSM. He found education and parental modeling, such as involvement in civic or religious activities, predicted PSM. Scholars since have confirmed these relationships and also found factors such as age, race, and gender to be influential in determining PSM using a similar method (Bright, 2011; Charbonneau & Van Ryzin, 2017; Naff & Crum, 1999). More recently, scholars have turned to examining participation in a variety of activities that may influence PSM.
Ward (2014) examines a sample of participants and nonparticipants in AmeriCorps, a volunteering program that provides a small stipend for young adults sent by the program to communities in need to provide aid and service, and finds participants had higher levels of PSM after participation and greater civic participation rates years after participation. Using randomized participation in a service-learning course in college, Seider et al. (2011) found a similar increase in PSM attributable to participation in service learning. Finally, using the ELS, Holt (2019) found that while participation in civics courses had little effect on PSM-related values, participation in school-based community service had a positive effect on some PSM-related values. Still, little is known about the contextual factors that influence PSM and what this means for public service workers. One important area of inquiry may be those institutions that shape individuals early in their lives—their neighborhoods and their schools.
Social Consequences of Segregation
In a separate body of work, scholars have begun to explore some of the impacts of residential and educational segregation along class and race lines on a variety of socially important outcomes. While there is some disagreement on the extent and geographic distribution of segregation, scholars have long known that both residential and educational segregation remains a persistent problem in many parts of the United States (Charles, 2003; Iceland & Wilkes, 2006). Moreover, the isolation of low-income and racial minority groups into separate schools leads to a deterioration in the quality of services offered to those students, largely because high quality teachers exit the schools (Boyd et al., 2008; Jackson, 2009; Steele et al., 2015). Given that teachers also volunteer in their communities (Holt, 2020), the loss of talented teachers in segregated schools may only compound the impact on the surrounding community. Beyond the impact on the schools themselves, segregation may lead to a loss of other important social effects provided by exposure to diversity. Scholars studying intergroup contact have long posited that exposure to different groups of people might reduce negative stereotypes about said groups and lead to a variety of improvements in social attitudes (Allport et al., 1954).
Drawing on intergroup contact theory, scholars have amassed a large body of evidence that suggests contact with different groups substantially reduces prejudice (see Paluck et al., 2018; Pettigrew & Tropp, 2006; for systematic reviews). A growing body of evidence examining college diversity also highlights a variety of benefits from exposure to diversity, including intellectual and social self-confidence (Chang, 1999), cognitive and non-cognitive skills (Gurin et al., 2002), and continued openness to diversity after graduation (Chang et al., 2004, 2006; Jayakumar, 2008, for a review, see Clarke & Antonio, 2012). Others have exploited the random assignment of roommates in military schools and colleges to estimate the effect of randomly having a different race roommate and also find such close exposure reduces prejudice later in life (Boisjoly et al., 2006; Corno et al., 2019; Carrell et al., 2015). More recently, using the same strategy, Carrell et al. (2019) find living with a randomly assigned high-ability black roommate in the U.S. Air Force Academy increases the likelihood white men will choose a black roommate in later years from a different set of black peers, consistent with the possibility of exposure leading to increased comfort with different race peers.
Beyond the social benefits of reduced prejudice, recent evidence suggests intergroup contact also engenders prosocial behaviors. In a series of econometric analyses using administrative data and field experiments on students in schools in India, Rao (2019) provides compelling evidence that wealthy kids exogenously exposed to poor classmates and assigned poor students as study partners volunteer more, are more generous to others regardless of their socioeconomic class, and are less discriminatory in their preferences.
Collectively, the work on intergroup contact theory suggests two important possibilities worth considering in public sector HRM and PSM research. First, given the importance of social equity as a pillar of good public administrative practice (Frederickson, 1976), the linkages between intergroup contact theory and more tolerance for diversity suggests institutional arrangements that enhance intergroup exposure may yield future public workers more adept at working with diverse colleagues and communities. Second, in light of evidence suggesting a correlation between PSM and more general measures of other-regarding motives (e.g., Piatak & Holt, 2020; Wright et al., 2013), the extant evidence that intergroup contact drives more empathetic and generous dispositions points to the possibility that intergroup contact also cultivates PSM. As HRM in the public sector grapples with diversifying the public workforce and serving an increasingly more diverse public, intergroup contact theory provides insights for producing and identifying candidates likely to be successful in diverse work environments.
Intergroup Contact and PSM
Evidence to date regarding intergroup contact theory has focused primarily on the effect of interacting with people from different backgrounds on prosocial behaviors or prejudice. However, the evidence regarding potential mechanisms or related associations with intergroup contact remain under-examined in public administration and public HRM research. Recent work in public management suggests Agreeableness, one of the Big Five personality traits, corresponds with the compassion and self-sacrifice dimension of PSM (Van Witteloostuijn et al., 2017). Notably, research from psychologists regularly finds that Agreeableness negatively correlates with aspects of prejudice (e.g., Sibley & Duckitt, 2008), one of the outcomes influenced by intergroup contact. These two streams of work drawing on personality traits, contingent motivations (such as PSM), and prejudice suggest factors that influence prejudice may also influence PSM. Since public servants often work in diverse workplaces serving diverse communities, early exposure to diverse sets of peers may be particularly important for producing less biased future public servants with higher levels of PSM.
Given the importance of changes in underlying values and attitudes for enduring behavioral changes (e.g., Marks & Jones, 2004) and evidence demonstrating that PSM and PSM-related values predict future prosocial behaviors (e.g., Holt, 2019; Piatak & Holt, 2020), we argue changes in PSM-related values related to intergroup contact explains some of the observed changes in prejudice and prosocial behaviors. Specifically, interacting with peers from different backgrounds, experiences, and preferences challenges pre-conceived notions held about different groups of people. The exposure to a broader range of life circumstances and perspectives induces empathy and other-regarding values. The broader view of society engendered by directly interacting with more representative members of society also imbues students with the motivation to contribute to public institutions charged with serving society.
Schools in the United States provide a useful and compelling context to test the link between intergroup contact theory and PSM for several reasons. First, compulsory attendance in secondary school ensures students regularly enter the same campus on the same schedule alongside peers at a similar physical, psychological, and social developmental point in their lives. In short, the nature and structure of education in the U.S. ensures that students at the same school are likely to interact in a variety of semi-structured social situations (e.g., in class, during social events, in extracurricular clubs) at a developmental point when values and social habits are most malleable (Borghans et al., 2008; Low & Rounds, 2007). Second, probabilistic exposure to peers from a different socioeconomic circumstance or demographic background during this developmental period of life varies considerably across schools (Fiel, 2015; Owens et al., 2016; Stroub & Richards, 2013), providing an opportunity to examine differences in PSM-related values among individuals exposed to varying degrees of peer differences during a period of life when social values and preferences are forming. Finally, school assignment boundaries that determine school attendance can be directly shaped by policymakers and district administrators.
Drawing on the theoretical model laid out by Perry (1997) and extended in Holt (2018), Figure 1 presents the theoretical model informing our analysis. As we indicate in our theoretical model, the characteristics of the schools students attend (staffing, programming, and student composition) will directly shape core aspects of their self-identity, including PSM and other values. However, the student body composition in the school will also shape students’ opportunities to interact with peers from different social groups and these interactions will, in turn, change students’ future self-concept and long-run behaviors. Drawing on insights from scholarship on intergroup contact theory and PSM, we argue intergroup contact might be an important factor in shaping PSM and PSM-related values. Here, we follow Park and Rainey (2008) and Vogel and Kroll (2016) in referring to our secondary data measure as PSM-related values to highlight and acknowledge that we are not using the conventional measures of PSM.

Theoretical model of link between intergroup contact and PSM-related values.
Data
We investigate the linkages between students’ exposure to demographic and socioeconomically different peers and later PSM-related values using data from the Education Longitudinal Study of 2002 (ELS). The ELS contains data on a nationally representative sample of approximately 16,000 adolescents who were sophomores in high school in the academic year 2001 to 2002. In the spring of 2002, the base year of the study, survey data was collected from students, one of their parents, their English and math teachers, and administrators at their school. Data was also collected during the spring semester of 2004, when the students were in the last semester of their “on-time” senior year of secondary school. Important for our purposes, the ELS links school identifiers to the Common Core of Data (CCD), which provides school-level information about the proportion of nonwhite students and free or reduced-price lunch (FRL) eligible students at the school.
In addition to basic information about the demographic and socioeconomic make-up of the student population at the school, the ELS surveys students on a variety of values using a three-point scale. Holt (2018) provides evidence that five items in the ELS are correlated and resemble items commonly used to measure PSM. 1 In addition to providing evidence regarding the reliability of the PSM-related values items in the ELS, Holt (2018) demonstrates that PSM-related values are significantly correlated with sector sorting in the labor market, which suggests the items provide a valid measure of PSM-related values appropriate for gaining insights about the factors that influence the development of PSM. Still, we encourage interpretation of the results of our analysis with the caution that the items are not the precise items used to measure PSM in the literature more broadly.
Figure 2 shows state-level average PSM-related values in the ELS across states measured during the senior year of high school. As the map in the figure suggests, states vary quite substantially in their production of PSM-related values among high school seniors. Of course, states also vary along some of the known correlates of PSM, such as demographics and religiosity (Bright, 2011; Perry, 1997). Figure 3 adjusts senior-year PSM-related values for race and religiosity, providing the aggregate PSM-related values at the state-level not explained by race or religiosity. While some states, such as Mississippi, Louisiana, New York, and North Carolina, fall into a lower quantile of PSM-related values after accounting for demographic and religiosity, others, such as Iowa, Arizona, and Nevada, rise into a higher quantile nationally. An important take away from Figures 1 and 2 is that factors such as demographics and religiosity clearly explain some of the variation in state’s PSM-related values, but a great deal of variation in PSM-related values across states remains even after accounting for demographics. Exposure to peers from diverse backgrounds in adolescence may represent another factor that contributes to the observed variation across the United States.
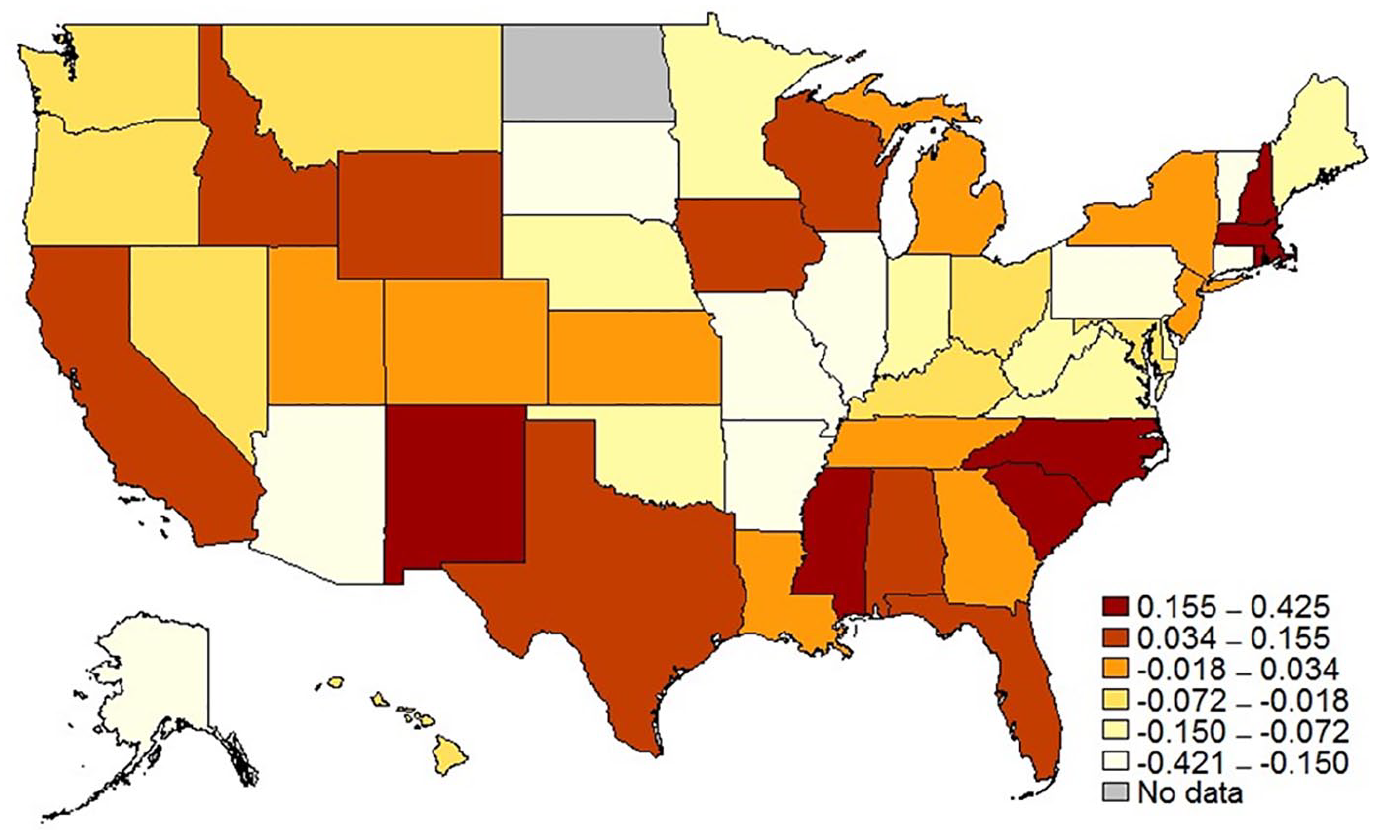
State-level average 12th grade PSM-related values.
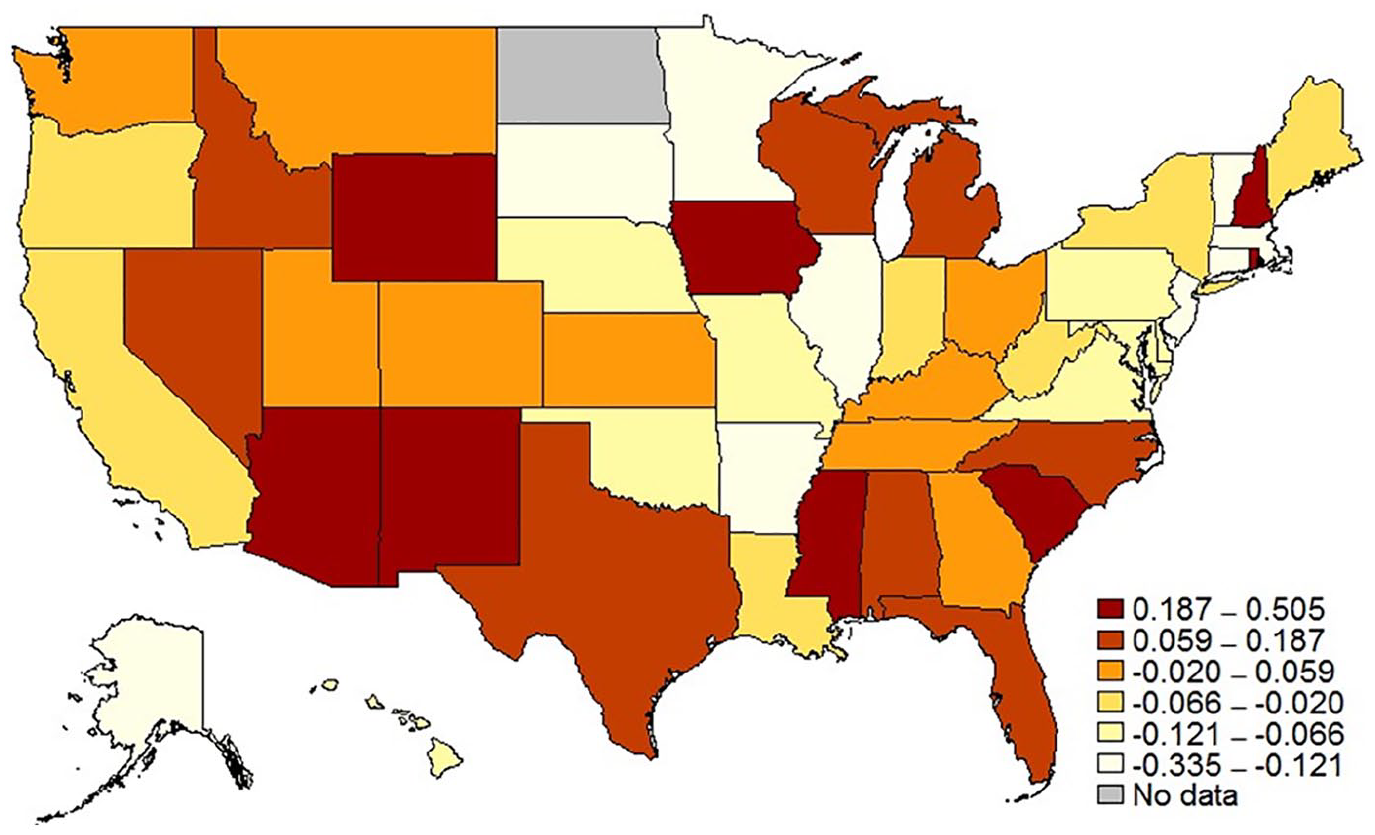
State-level average 12th grade PSM-related values conditional on race and religiosity.
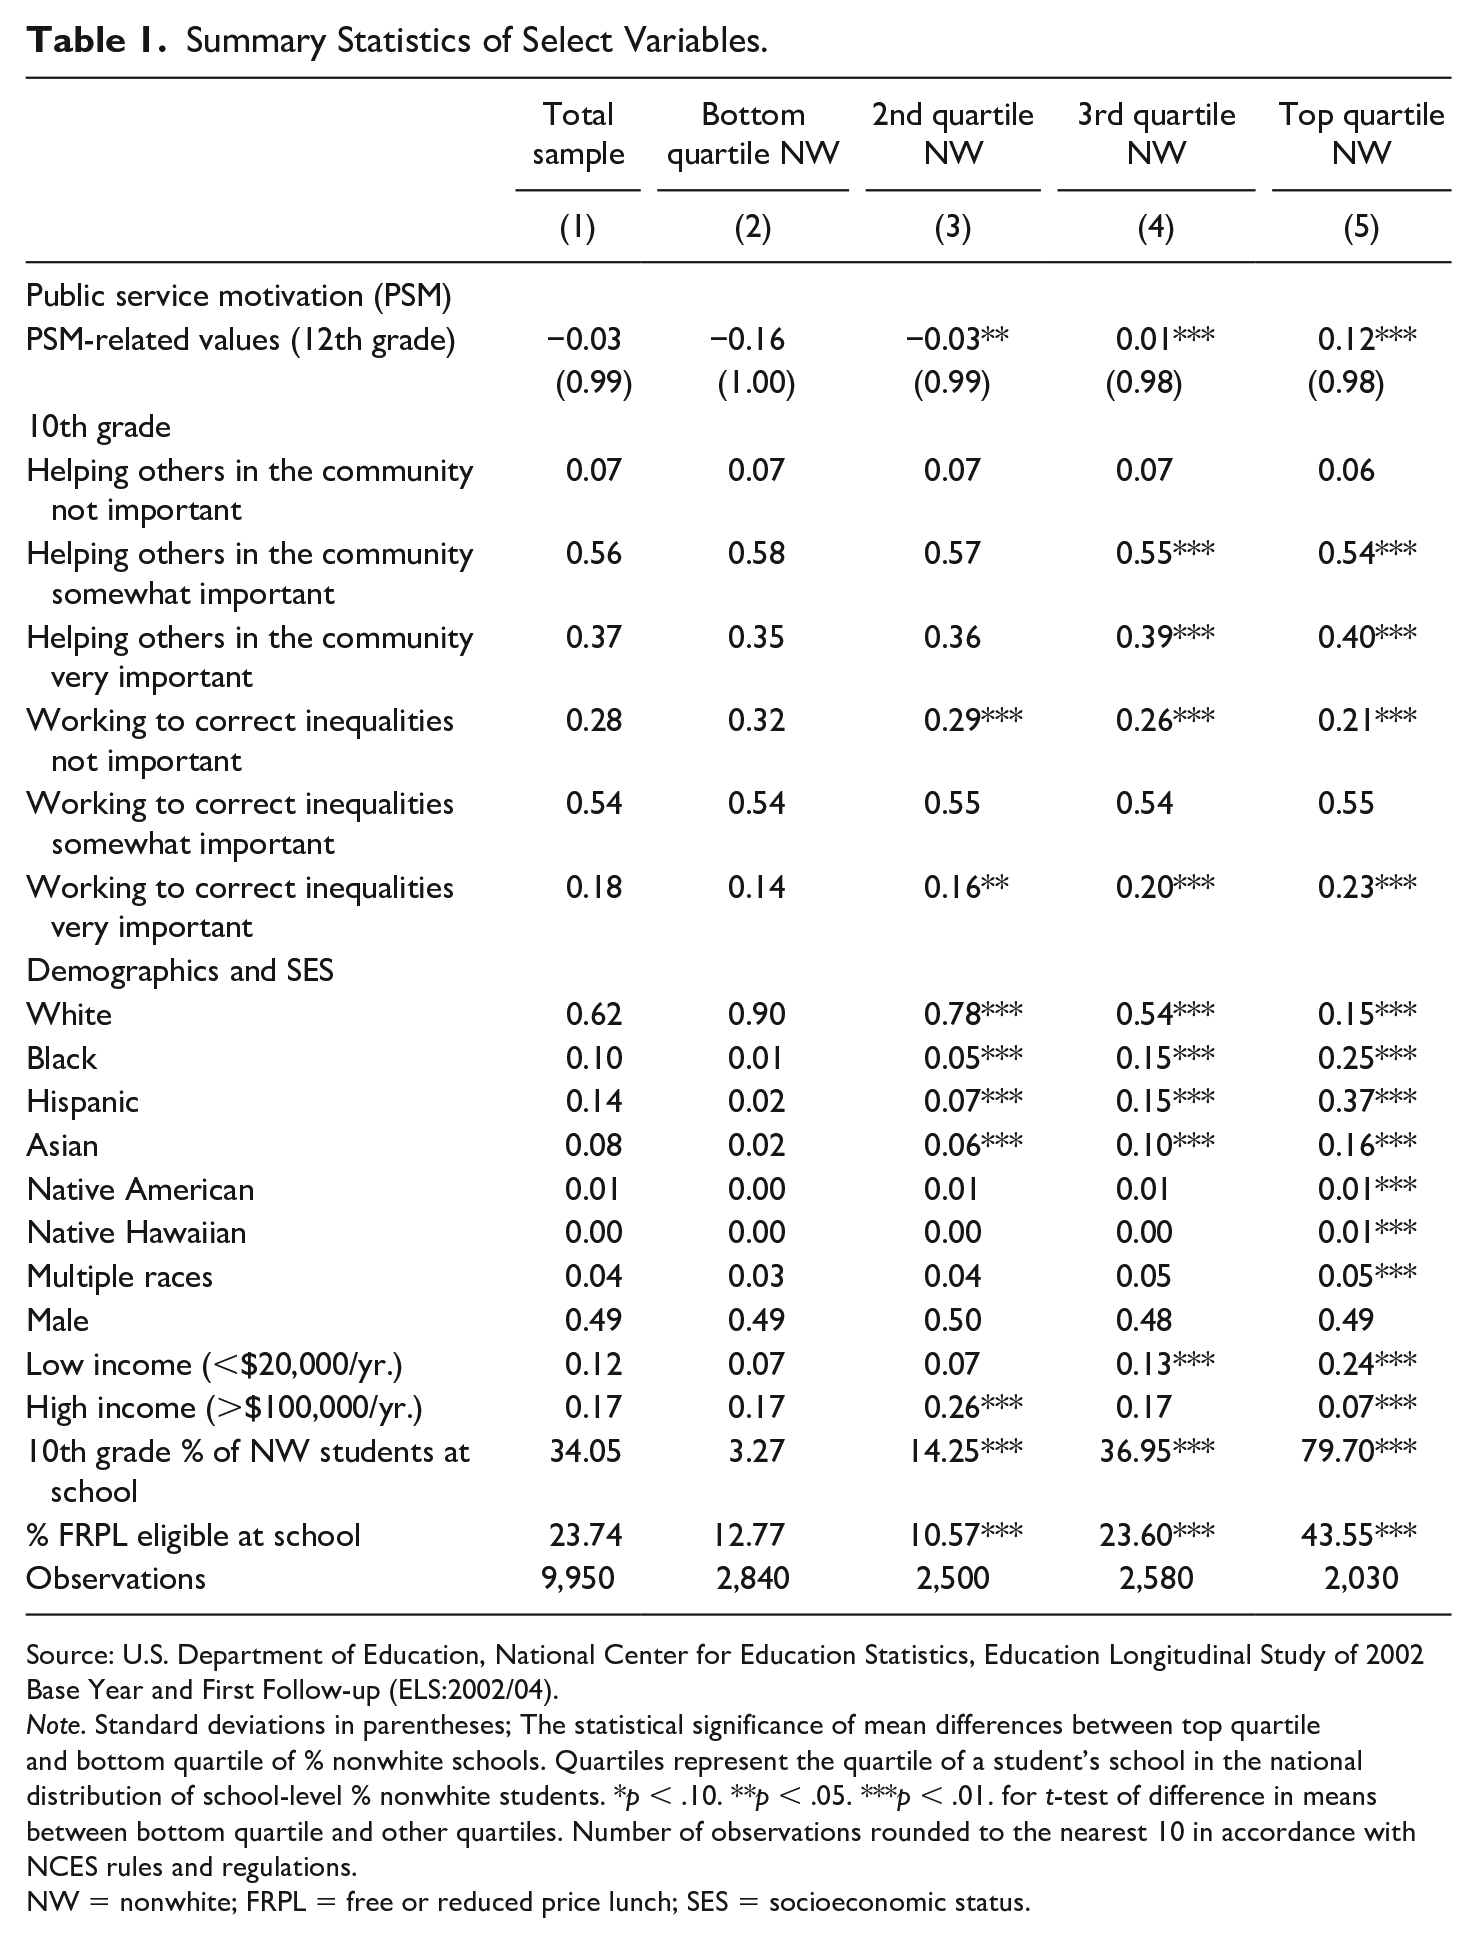
Table 1 summarizes the analytic sample, which includes all students with complete data at the individual- and school-level for all relevant measures. The final analytic sample contains about 9,950 students. As the demographics in column 1 show, the analytic sample resembles national estimates of student demographics. For the purposes of the current study, we use the proportion of nonwhite students in a school’s student body as an approximate measure of school diversity. 2
Summary Statistics of Select Variables.
Source: U.S. Department of Education, National Center for Education Statistics, Education Longitudinal Study of 2002 Base Year and First Follow-up (ELS:2002/04).
Note. Standard deviations in parentheses; The statistical significance of mean differences between top quartile and bottom quartile of % nonwhite schools. Quartiles represent the quartile of a student’s school in the national distribution of school-level % nonwhite students. *p < .10. **p < .05. ***p < .01. for t-test of difference in means between bottom quartile and other quartiles. Number of observations rounded to the nearest 10 in accordance with NCES rules and regulations.
NW = nonwhite; FRPL = free or reduced price lunch; SES = socioeconomic status.
Columns 2 through 5 separate the analytic sample into students attending schools in different quartiles of school diversity in the sample. Notably, students attending schools in the top quartile of proportion of nonwhite students report, on average, much higher levels of PSM-related values than students in the bottom quartile. On the other hand, a larger share of students in schools with a high proportion of nonwhite students also report higher levels of PSM-related values in 10th grade. 3 Consequently, the observed difference in senior-year PSM-related values may be attributable to differences in the students that sort into schools with more nonwhite students than those who sort into less diverse schools.
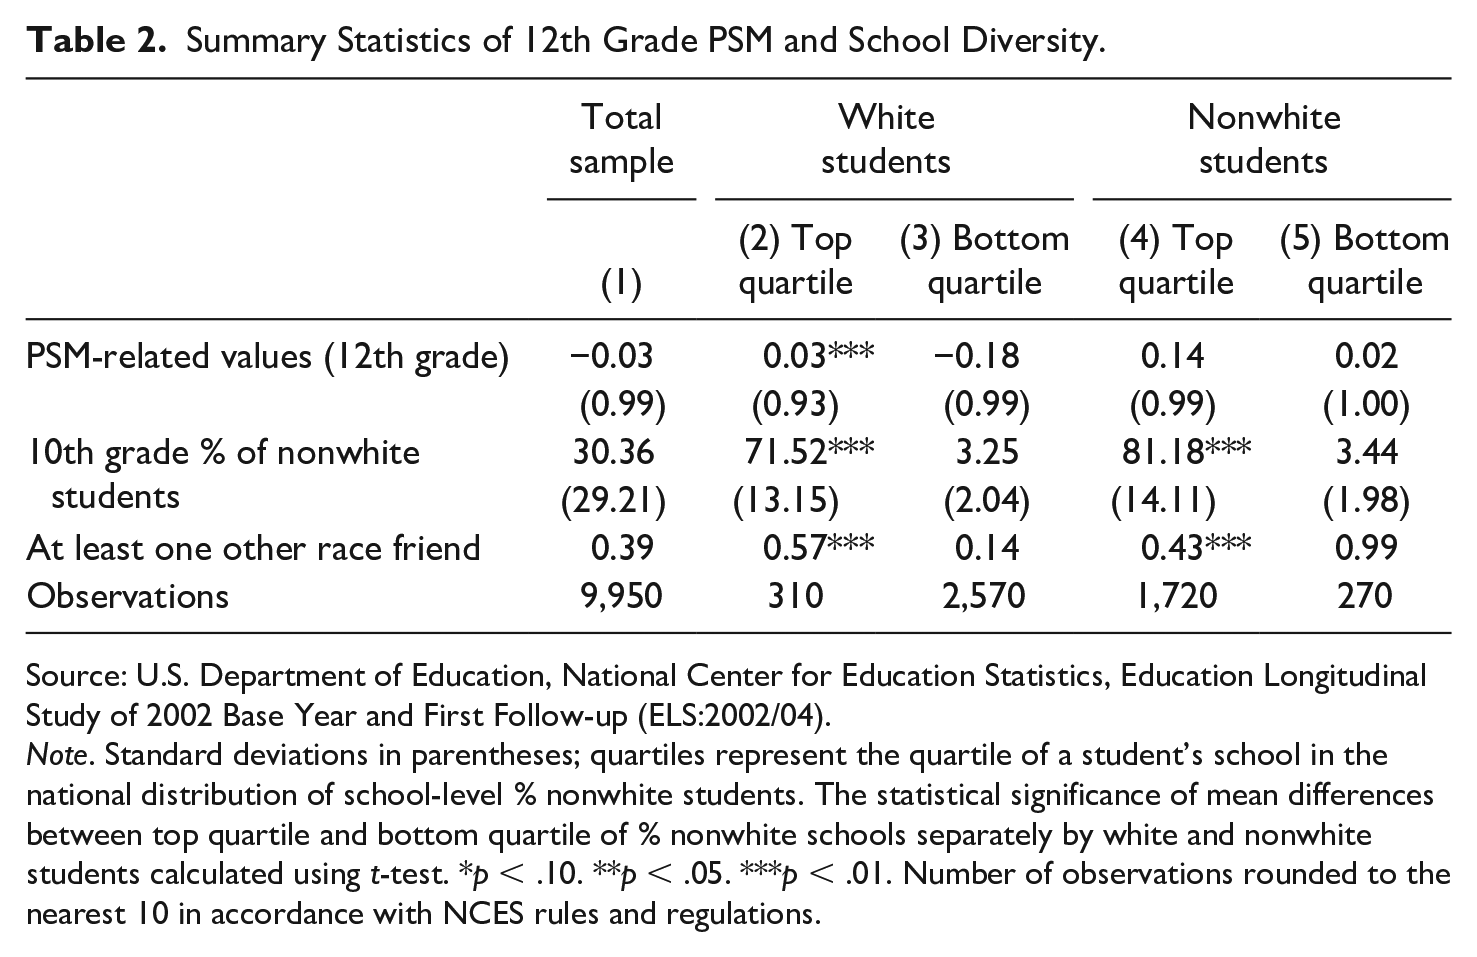
Table 2 describes senior year PSM-related values in the sample as well as the observed proportion of nonwhite students at the school levels in top and bottom quartile schools separately by white and nonwhite students. Splitting the sample along both student race and school diversity lines shows that, in this sample of high school students, white students exit high school with lower average PSM-related values than nonwhite students. For both groups, however, students attending a high school with a higher proportion of nonwhite students leave high school with higher levels of PSM-related values than same-raced students in predominantly white high schools. Moreover, while the size of the average gap in PSM-related values between the most and least nonwhite schools is similar for white and nonwhite students, the difference is only statistically significant among white students.
Summary Statistics of 12th Grade PSM and School Diversity.
Source: U.S. Department of Education, National Center for Education Statistics, Education Longitudinal Study of 2002 Base Year and First Follow-up (ELS:2002/04).
Note. Standard deviations in parentheses; quartiles represent the quartile of a student’s school in the national distribution of school-level % nonwhite students. The statistical significance of mean differences between top quartile and bottom quartile of % nonwhite schools separately by white and nonwhite students calculated using t-test. *p < .10. **p < .05. ***p < .01. Number of observations rounded to the nearest 10 in accordance with NCES rules and regulations.
Finally, the ELS asks students to report the race of their three closest friends, and an indicator for whether the student reports at least one close friend who is a different race is reported in the bottom row of Table 2. 4 Perhaps unsurprisingly, white students in schools with a larger share of nonwhite students are more likely to report having at least one other race friend among their closest friends than white students in predominantly white schools. Note, however, that at schools with a large proportion of nonwhite students, 43% of nonwhite students also report having an other-race friend. The large share of nonwhite students with other-race friends suggests that many schools in the top quartile of percent nonwhite students likely exhibit demographic diversity not captured by such a strict binary and may still experience a great deal of intergroup contact.
Methods
As previously noted, although students in more diverse schools leave school with, on average, higher levels of PSM-related values, those students also enter with higher levels of PSM-related values. In addition, the students differ demographically and socioeconomically in ways the preclude our ability to attribute the average difference in senior year PSM-related values to school diversity alone. We account for these differences by modeling PSM-related values of student i in school s at time t as the linear function:

where OtherRace represents a set of indicator variables that capture the quartile of % other race students at student i’s school s in their 10th grade year; X represents a vector of controls for student i’ demographics, socioeconomic status (SES), religiosity, academic ability, and measures of parental involvement; Z represents indicators for student i’s responses to PSM-related values questions in the 10th grade survey, as previously described; and θ represents a school fixed-effect (FE) that ensures differences are identified through within-school comparisons of students to account for time-invariant, school-specific factors that might affect students’ PSM.
In equation 1, β represents the parameter of interest to the study, and provides the estimated effect of attending school with higher levels of exposure to students of a different race relative to attending schools with lower levels of exposure to students of a different race. Of course, both high and low levels of different race students at a school can indicate relative demographic isolation at the school-level. Consequently, there will likely be nonlinear effects in the relationship between school-level exposure to different race students and PSM-related values. Thus, using the percentage of nonwhite students at a school, we first calculate the % of a school that is a different race. Using the % different race at the school-level, we calculate the quartile of different race exposure for each students’ school. Intuitively, this allows β to capture the change in PSM-related values of students attributable to attending a school in one quartile of exposure to different race students relative to attending a school in another quartile of exposure to different race students, accounting for time-invariant school-specific trends in PSM-related values, student characteristics, and PSM-related values in 10th grade. We estimate equation 1 using OLS with standard errors clustered at the school-level.
Results
We begin our analysis with OLS estimates of equation 1, as previously described, adding controls iteratively. Here, we examine students exposed to different levels of diversity. Levels of diversity here refers to the quartile, in terms of percent other-race students, into which an individual student’s school falls. This will vary within schools based on a student’s race (e.g., a black student at a largely white school will be in the top quartile while a white student in that school would be in the top quartile).
Table 3 presents our main results. First, column 1 presents descriptive regressions of the relationship between levels of diversity at school and students’ PSM-related values in 12th grade. The results suggest, relative to students at the lowest level of school diversity, students at higher levels of school diversity all report higher average PSM-related values in their senior year of high school. The difference is largest among students in the second and third quartiles, which reflect schools with a similar balance of white and nonwhite students. Second, columns 2 and 3 add the full set of controls for students’ observable characteristics and controls for students’ 10th grade PSM-related values, respectively. Notably, the strength of the relationship between school-level diversity and students’ 12th grade PSM-related values declines when we account for student characteristics and beginning PSM-related values, consistent with systematic sorting of students into different schools on both observable characteristics and initial levels of PSM-related values. If we compare students across schools who report the same PSM-related values in 10th grade, have similar academic ability, and come from similar socioeconomic and demographic backgrounds, the estimated difference in 12th grade PSM-related values decreases by half and is no longer statistically significant.
Estimated Associations Between Diversity Exposure on PSM-related Values.
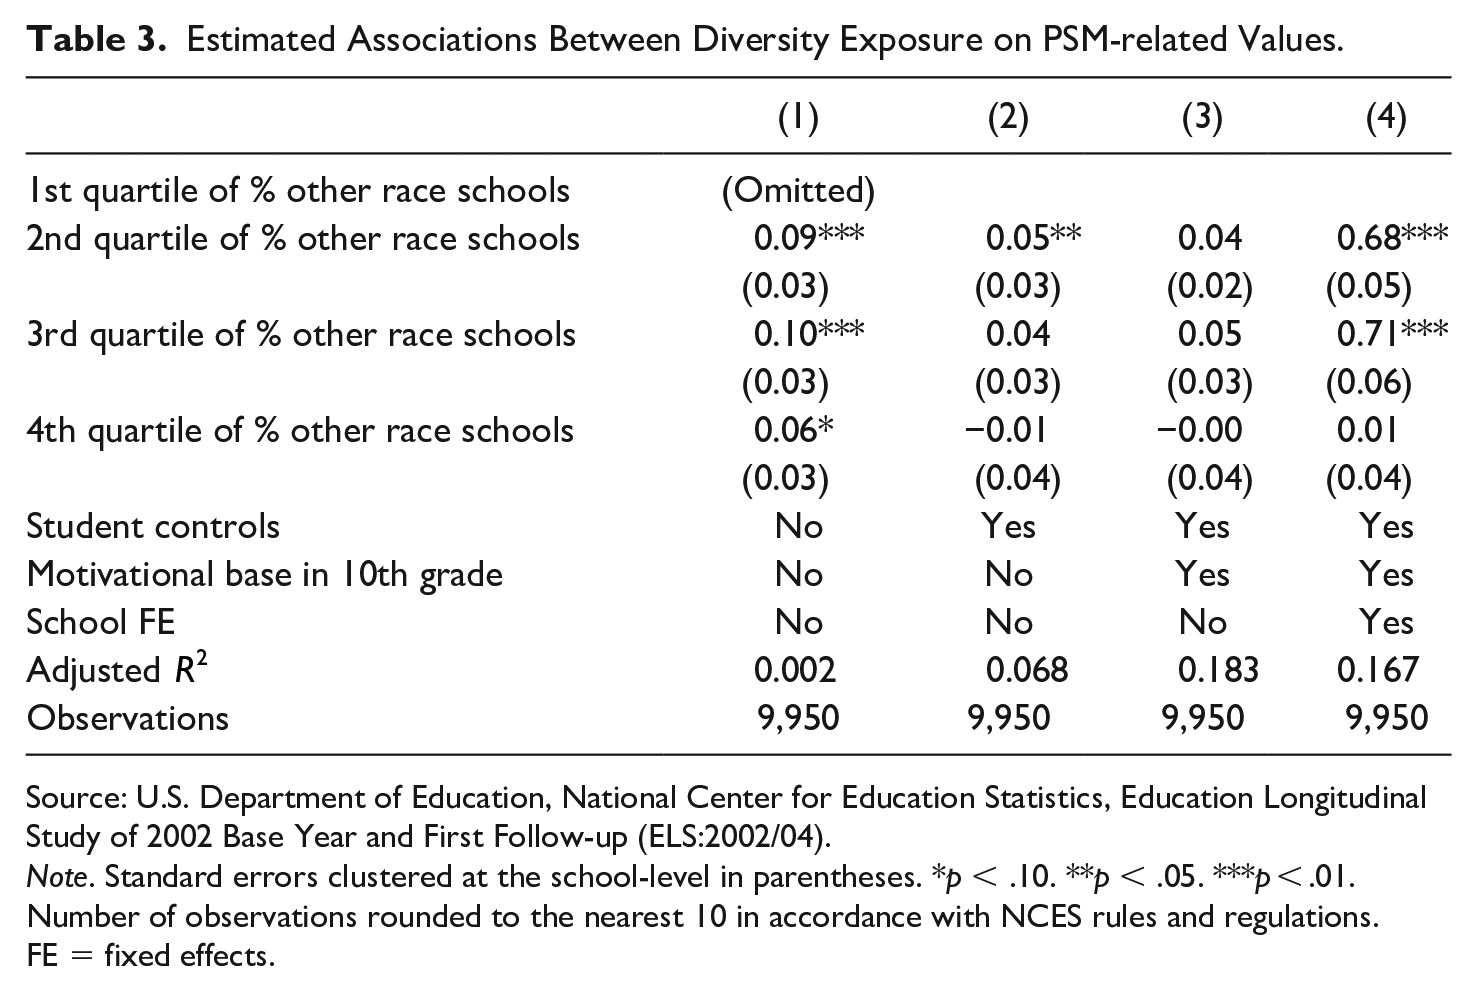
Source: U.S. Department of Education, National Center for Education Statistics, Education Longitudinal Study of 2002 Base Year and First Follow-up (ELS:2002/04).
Note. Standard errors clustered at the school-level in parentheses. *p < .10. **p < .05. ***p < .01. Number of observations rounded to the nearest 10 in accordance with NCES rules and regulations.
FE = fixed effects.
Of course, the schools themselves likely differ systematically in ways that influence both diversity and students’ PSM-related values upon graduating. We account for the systematic sorting of students into different schools in column 4 with the addition of school FE. More specifically, we compare students within the same schools, controlling for initial PSM-related values early in their high school experience and other student-level observable characteristics. We thus compare students exposed to different levels of diversity within the same school to account for school-specific contributions to senior year PSM-related values. The results show that after accounting for school contributions to PSM-related values, students at schools in the second and third quartiles of diversity report PSM-related values in 12th grade that are 0.69 and 0.71 standard deviations higher than students at the lowest level of school diversity. The second and third quartile coefficients are not significantly different from one another. Meanwhile, students at the highest level of diversity exposure show no significant difference in PSM-related values relative to students at the lowest level of diversity exposure.
We investigate the possibility that there may be heterogeneous effects across different demographics of students to the level of exposure to other race students with a modified version of our main effects. First, we calculate the quartile each school falls into in terms of the proportion of nonwhite students at the school. Second, we estimate our primary model in equation 1, without OtherRace, separately by each quartile. Finally, we estimate the marginal effect of student race to recover the conditional average 12th grade PSM-related values for each demographic group of students after accounting for student characteristics and school-specific effects. Figure 3 plots the conditional averages of each demographic group of students and 95% confidence intervals of each plot.
Two important points become obvious from the results in Figure 4. First, the effects of intergroup contact do not differ significantly by race. In each quartile of percent nonwhite students at the school-level, the level of PSM-related values reported by students in each demographic group is not significantly different from the PSM-related values reported by other demographic groups in the same quartile. Second, in general, the PSM-related values students report in 12th grade, controlling for observable characteristics and school-specific contributions, increases for each demographic group moving into each higher quartile of percent nonwhite students.
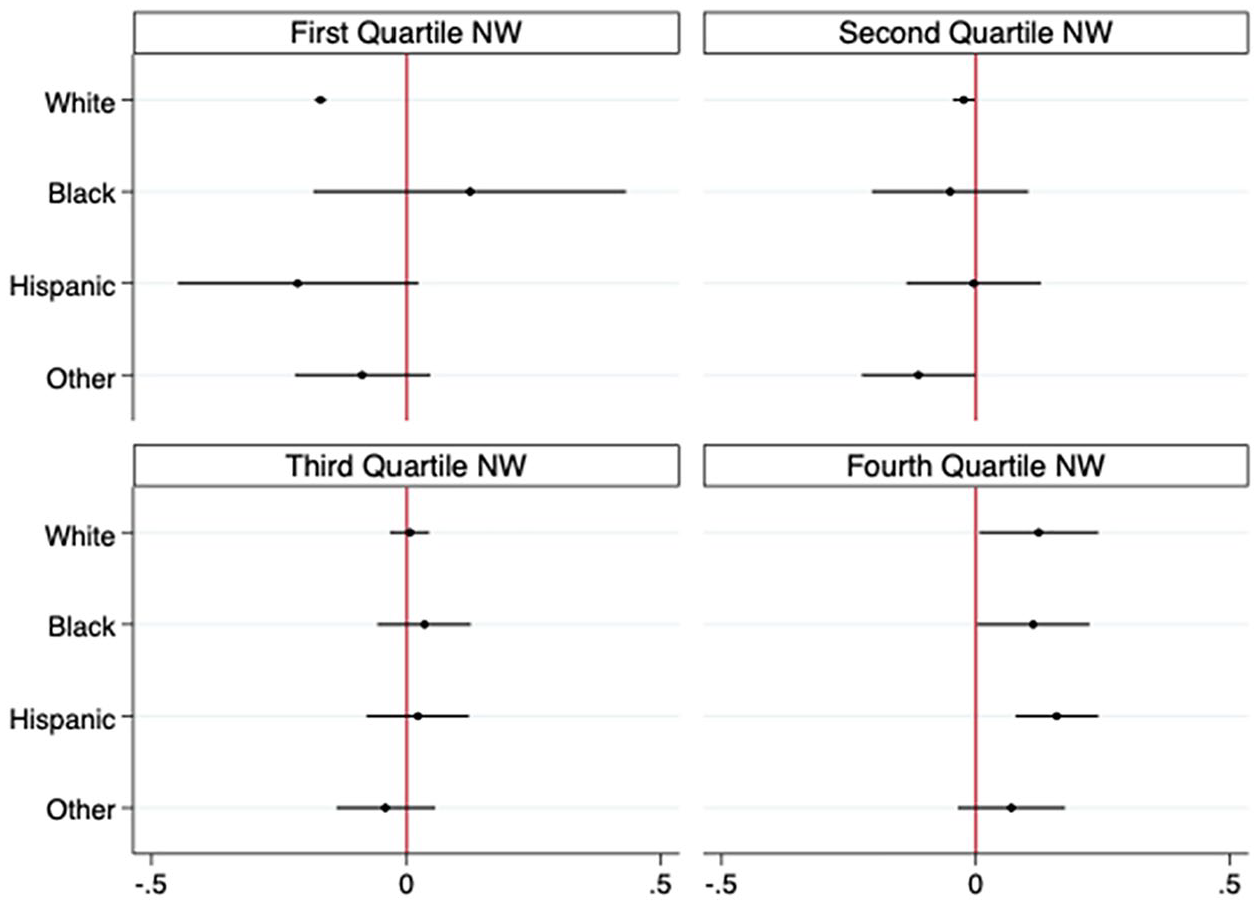
Conditional average 12th grade PSM by student race, separately by quartiles of % nonwhite students at school.
For instance, white students attending predominantly white schools have significantly lower PSM-related values than the national average. Meanwhile, white students in the second and third quartiles of percent nonwhite students in their schools report 12th grade PSM-related values near the national average, and white students in predominantly nonwhite schools report 12th grade PSM-related values significantly higher than the national average. Hispanic and other nonwhite students show a similar trend, although the estimated averages are less precise due in part to smaller subsample sizes. Black students show a modest exception: those in predominantly white schools report above average levels of PSM-related values while those in the second quartile of percent nonwhite students at the school report PSM-related values slightly below the national average. However, we encourage caution in interpreting this difference as the standard errors for both estimates are quite large.
Collectively, the results suggest both that intergroup contact with students from a different demographic background does increase students’ PSM-related values and that the benefits accrue to both white and nonwhite students. After accounting for school-specific trends in PSM-related values, student characteristics such as academic ability, socioeconomic background, and religiosity, and partial controls for PSM-related values in 10th grade, students of all races report higher average PSM-related values in 12th grade when attending schools in the top two quartiles of percent nonwhite students relative to their peers in less diverse schools.
Finally, we use a similar approach to examine the effects of exposure to students from a different socioeconomic background. In this case, we use the proportion of students eligible for free or reduced-price lunch (FRL) at a school, and again divide the schools into quartiles based on this proportion. Since federal poverty guidelines often determine FRL eligibility at schools in the United States, FRL eligibility is frequently used to proxy for measures of poverty at a given school. In Figure 5, we plot the marginal effects of students’ household income using four categories: low income (less than $20,000 per year), lower-middle income ($20,000 to $50,000 per year), upper-middle income ($50,000–$100,000 per year), and high income ($100,000 or more). Again, the results reflect conditional average levels of PSM-related values in 12th grade after accounting for student characteristics and school-specific factors.
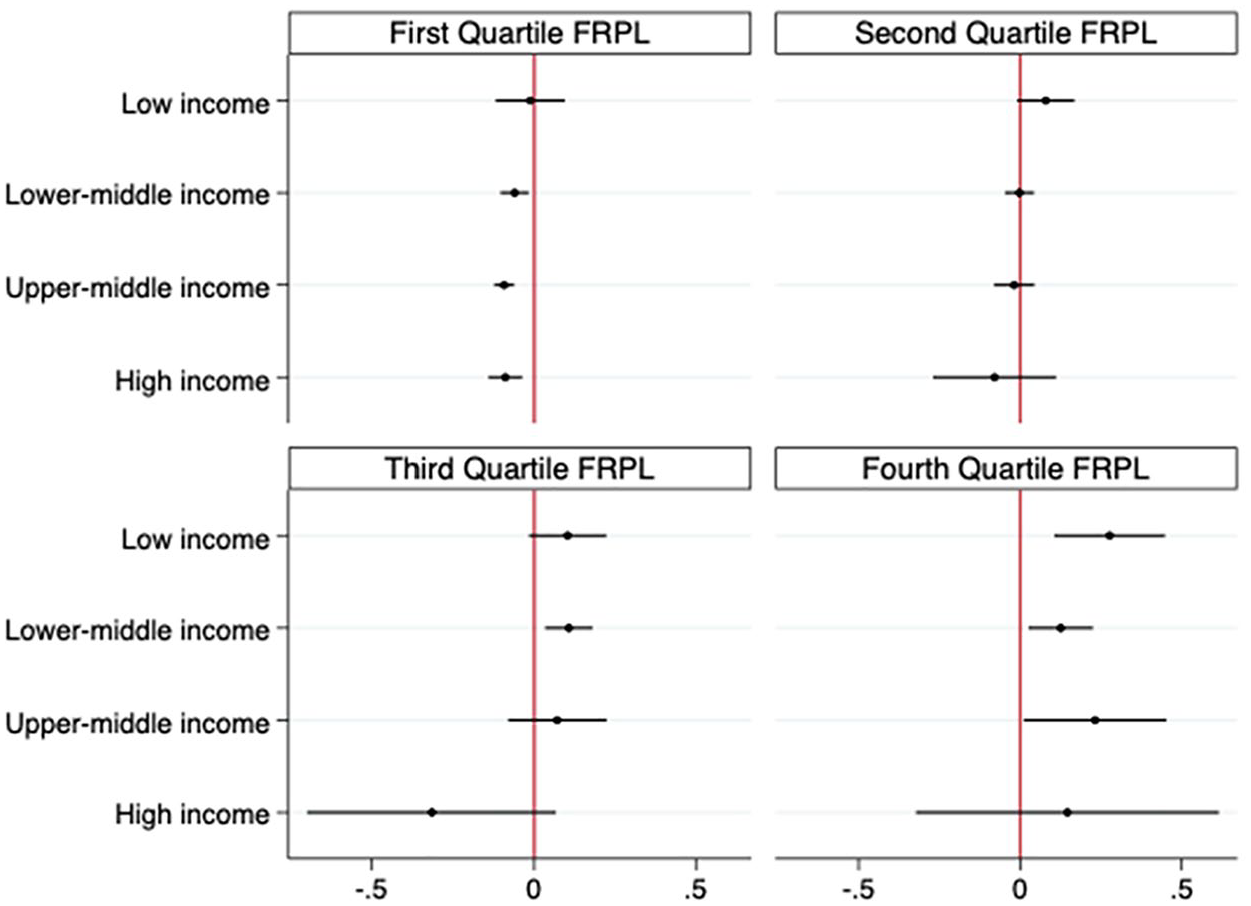
Conditional average 12th grade PSM by student household income, separately by quartiles of % FRL students at school.
Notably, students from middle- and high-income households attending schools with relatively few low-income students show lower levels of PSM-related values when leaving high school and these differences are statistically significant. Meanwhile, both low-income and middle-income students show higher levels of PSM-related values in 12th grade as the proportion of low-income students at a school increases. The estimates for students in high-income households become less precise as the portion of low-income students increases at the school level because very few high-income students in our national sample attend schools with high proportions of low-income students. Overall, the results are consistent with the possibility that exposure to students from a different socioeconomic circumstance increases students’ PSM-related values as they enter early adulthood.
Robustness Check
Despite our attempts to account for school-specific effects, our estimates may be compromised if students with higher levels of PSM-related values systematically select into more diverse schools. We do not observe sufficient information on students prior to selection into schools to account for this possibility; however, we do observe a subset of approximately 1000 students who move to a different school between their sophomore and senior years of high school. Of these students, 460 moved to a more diverse high school between 10th and 12th grade. 5
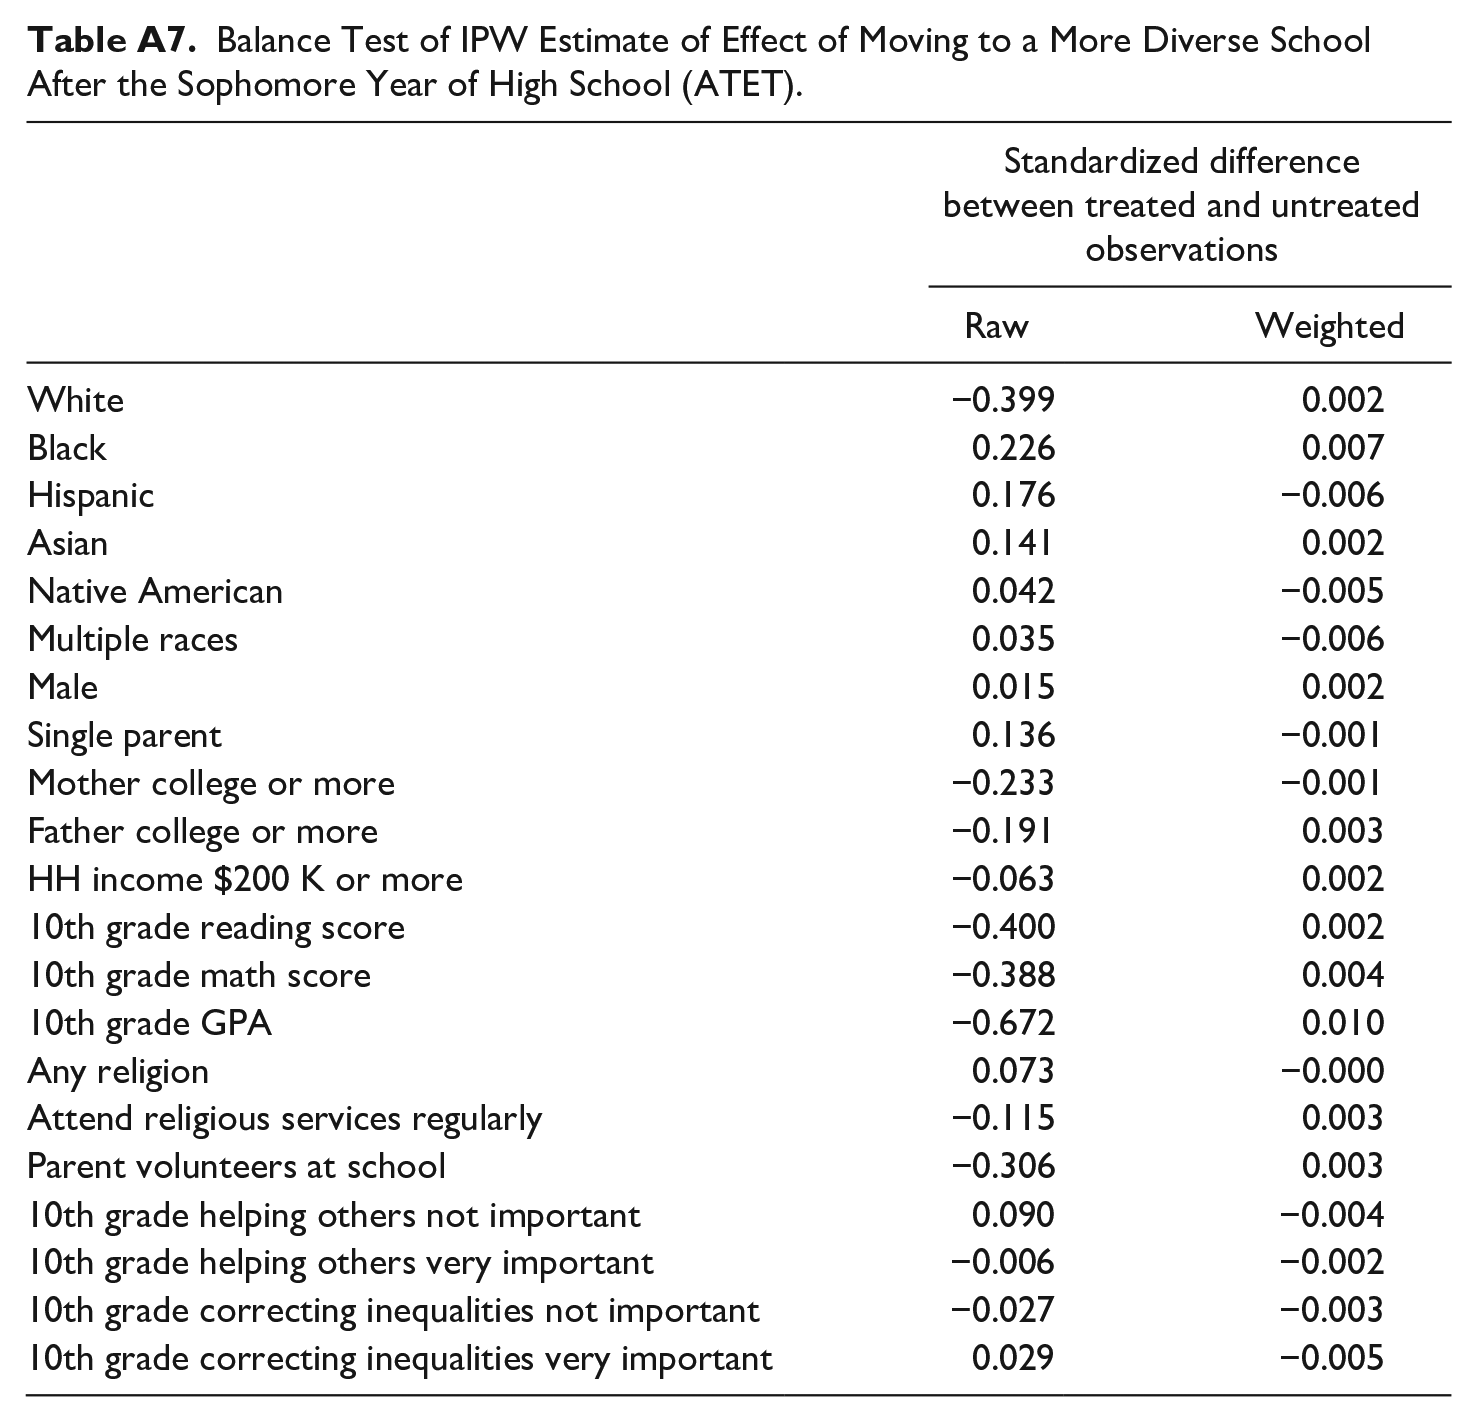
We complement our main findings with an analysis of the effect of moving to a more diverse school on 12th grade PSM-related values. Since we observe a range of academic, parental involvement, socioeconomic, and some PSM-related values in 10th grade, prior to the move, we can account for the impact of these pre-move characteristics on the likelihood a student receives the treatment (moving to a more diverse school). We implement an inverse propensity weighting (IPW) strategy to match students who moved to a more diverse school after 10th grade to students who were, based on their observable characteristics, equally likely to move to a more diverse school but did not. 6 Inverse propensity weighting discounts the impact of observations that were unlikely to ever receive a given treatment (in this case, moving schools) and partially accounts for non-random selection into the treatment. Moreover, IPW ensures the best treatment-control matched pairs contribute more to the estimated treatment effect.
The intuition of testing the effect of moving to a more diverse school on PSM is that moving to a more diverse school exposes students to more dissimilar students. A comparison of PSM-related values in 12th grade between students with this additional exposure to dissimilar students to their observationally identical peers who did not experience additional exposure provides an additional test of the theoretical link between PSM and intergroup contact.
Table 4 presents our IPW estimates average treatment effect and the average treatment effect on the treated of moving to a more diverse school. The results show those who moved to a more diverse school report, on average, PSM-related values in 12th grade that are about 0.26 standard deviations higher than observationally similar students who did not move to a more diverse school. While the matching strategy can remove selection attributable to observed differences such as, importantly in this case, pre-existing differences in PSM-related values, there may be unobserved factors that jointly predict moving to a more diverse school and PSM-related values in 12th grade that may still bias our estimated effect of intergroup contact on PSM-related values. Still, the results present complementary evidence that increased exposure to dissimilar students increases the PSM-related values students hold as they leave high school.
IPW Estimates of Effect of Moving to a More Diverse High-school between 10th and 12th Grade on 12th Grade PSM-related Values.
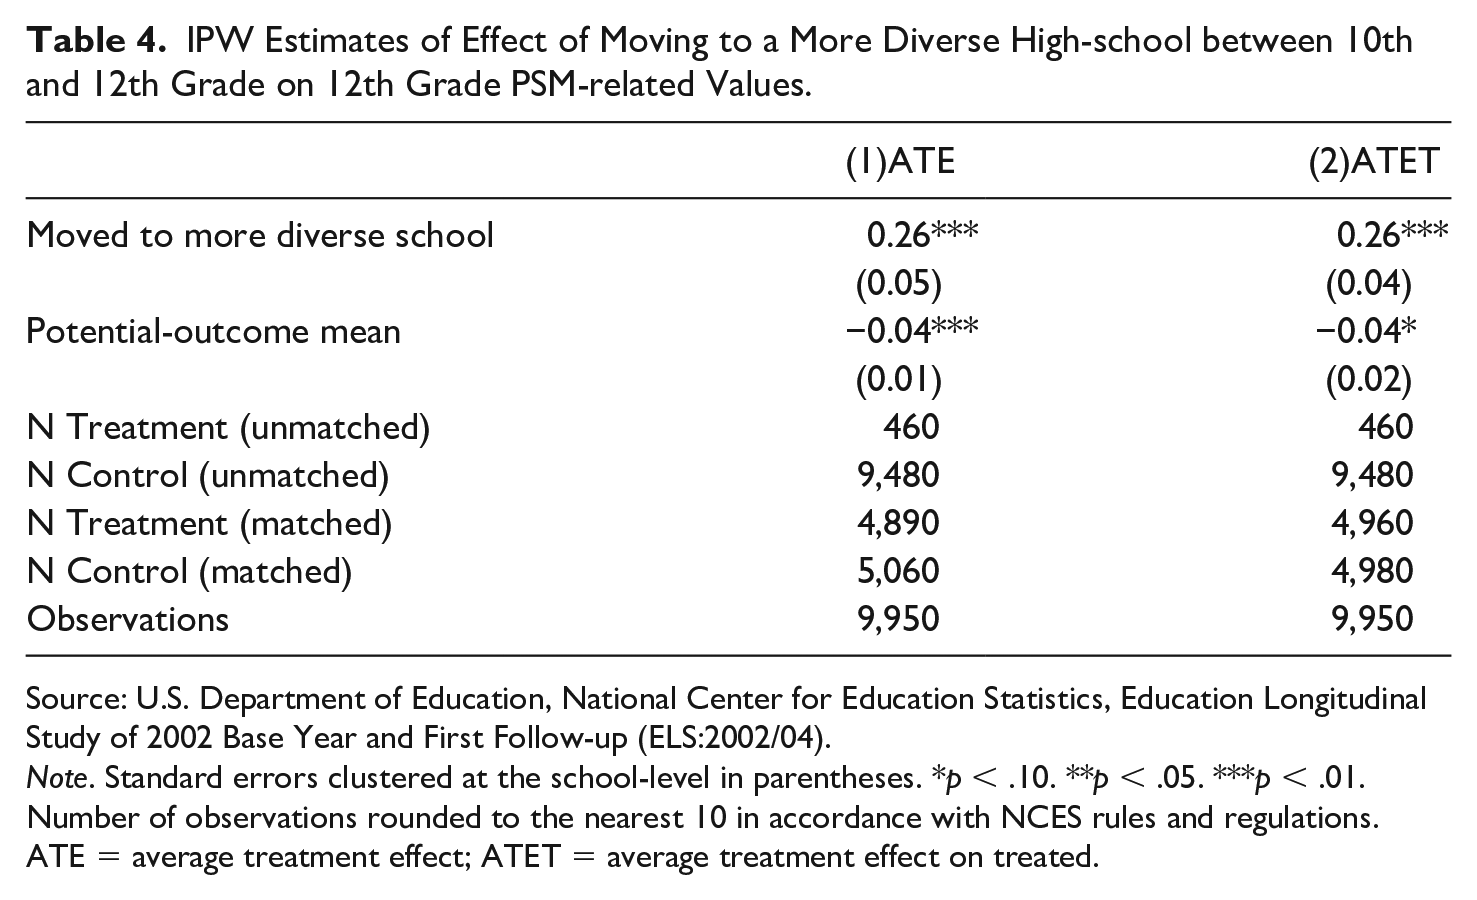
Source: U.S. Department of Education, National Center for Education Statistics, Education Longitudinal Study of 2002 Base Year and First Follow-up (ELS:2002/04).
Note. Standard errors clustered at the school-level in parentheses. *p < .10. **p < .05. ***p < .01. Number of observations rounded to the nearest 10 in accordance with NCES rules and regulations.
ATE = average treatment effect; ATET = average treatment effect on treated.
Limitations
As with all studies of complex social phenomena, our results should be interpreted with the limitations of our data in mind. First, we do not have information on the exact mix of demographic and socioeconomic groups at the school-level in our sample. Consequently, we cannot account for the precise levels of diversity students are exposed to in school. Second, as previously noted, our study relies on secondary data that does not include the exact items often used to measure PSM.
Finally, the 10th grade PSM-related items provide only a partial control for initial levels of PSM. While we have taken steps to account for school-specific trends in PSM-related values, we do not have data on students’ PSM-related values prior to high school. Consequently, we cannot give our estimates a causal interpretation since we cannot account for the systematic sorting of students into more or less diverse schools along pre-existing levels of PSM. It is possible parents who opt to send their kids to more diverse schools also systematically cultivate more PSM in the home in ways not accounted for by our controls for parental religion, education, and school-involvement.
Drawing on Oster’s (2016) partial identification framework, we note that the increased size of the effect of intergroup exposure after accounting for school-specific fixed-effects suggests unobserved school-specific effects gave our estimates a downward bias when omitted from the model. Implementing Oster’s bias bounded estimates suggests that unobserved factors would need to be negatively correlated with selection into diverse schools to nullify our results (delta of −0.10)—the opposite of what would be expected if selection bias entirely drove the positive association between intergroup contact and PSM-related values that we observe.
Moreover, as we show in appendix Tables A3 and A4, less diverse and wealthier schools offer, on average, more community service and civics programming. The differences suggest a downward bias attributable to school-specific differences, which is consistent with the change in estimates in our model after accounting for school fixed-effects. Although we cannot eliminate the possibility that unobserved factors bias our results, the weight of evidence suggests selection likely does not fully explain the positive link between intergroup contact and PSM-related values we observe in the ELS. Future research should investigate the link between intergroup contact and PSM-related values further.
Discussion and Conclusion
The evidence presented here is consistent with extant evidence that intergroup contact increases empathy for others and decreases discrimination (Paluck et al., 2018; Pettigrew & Tropp, 2006; Rao, 2019). We provide preliminary evidence that PSM and PSM-related values may also be produced by exposure to diversity. Put another way, in addition to becoming more empathetic, students exposed to more diversity in their early years may develop the motivation to serve their community. Our results suggest intergroup contact shapes PSM, consistent with our theoretical extension of the antecedents of PSM. More specifically, coming into contact with peers from different social, economic, and demographic backgrounds engenders a broader view of one’s community and gives rise to values that support community institutions. Future work should examine linkages between persistent exposure to community diversity, PSM, and the health of public institutions in the community. PSM may provide one means to estimate the social cost of increased homogeneity in residential neighborhoods and the schools that serve them.
The importance of schools and the education system in producing human capital and developing economically important skills has long been understood and received a great deal of attention from policymakers and researchers alike. However, from the founding of the U.S. and the earliest arguments put forward for a public education system, a functioning democracy and civil society served as the other intended outcome of our public education system (Kahlenberg & Janey, 2016). The latter goal, of course, is more difficult to assess empirically. PSM may provide one theoretical and empirical means for assessing the efficacy of public schools in triggering virtuous cycles of democracy and civic life. One might expect, for instance, that communities producing students with high levels of PSM will have a steady supply of individuals seeking to help their community and engaged with public life. Future work should seek to examine this possibility empirically.
A more practical implication of our work is that school superintendents, school board members, city managers, and city council members may anticipate some social cohesion returns from increasing school and neighborhood diversity. The student body at schools remains, at least in part, under the control of administrators and policymakers, who decide school attendance zone boundaries and school attendance policies. Administrators and policymakers concerned about the declining trust in public institutions and participation in civic groups should consider the potential benefits of policies that integrate schools and communities along socioeconomic and demographic problems. Such efforts at integration, though potentially politically costly (Parcel & Taylor, 2015) and more challenging as schools of choice increase in densely populated areas (Bischoff & Tach, 2018; Ladd et al., 2017; Marcotte & Dalane, 2019), may provide a catalyst for revitalizing public life. Increasing school diversity coupled with changes to curricula and opportunities for early engagement in public service (Holt, 2019) provides administrators and policymakers with several practical levers to increase average levels of PSM in their communities through the public education system. A broader question for researchers to continue to tackle are the dimensions of public life that are positively and negatively influenced by the average level of PSM in a given community, even beyond the confines of public sector worker performance.
Finally, our work speaks to the importance of considering the symbiotic relationship between public school systems and future public employees. Scholars studying public personnel have noted the difficulty in cultivating PSM after employees have been hired (see, for instance, Chen et al., 2019, in which on-boarding trainings had little direct effect on PSM). Instead, PSM seems to operate primarily through selection into the public sector (Clerkin & Coggburn, 2012) and is shaped more strongly by pre-labor market institutions (Vandenabeele, 2011). The difficulty of cultivating PSM in personnel after they are hired underscores the importance of understanding how public institutions can be arranged to support the production of PSM more broadly.
Similarly, scholars have regularly highlighted the importance of diversity management in public sector work (e.g., Pitts, 2006; Sabharwal et al., 2018). For instance, Feeney and Camarena (2019) find that, in municipal governments of small and mid-sized cities, public workers remain relatively homogeneous and report quite varied assessments of their organizations’ valuation of diversity. This portends trouble in achieving equity in the public workforce since nonwhites (and whites) report lower job satisfaction in predominantly white organizations (Choi, 2017).
Scholars and practitioners alike should consider the ways in which institutional arrangements produce (or fail to produce) public personnel both comfortable in diverse environments and motivated to serve the public. While we have examined the contributions of the secondary education system, future work should examine the effects of college and early career experiences with diversity and changes in PSM. Investigating the potential link between public workers’ PSM and successful recruitment of a diverse workforce or performance in serving a diverse array of members of the public remains an open question ripe for future work in this stream of research.
Footnotes
Appendix
Balance Test of IPW Estimate of Effect of Moving to a More Diverse School After the Sophomore Year of High School (ATET).
| Standardized difference between treated and untreated observations |
||
|---|---|---|
| Raw | Weighted | |
| White | −0.399 | 0.002 |
| Black | 0.226 | 0.007 |
| Hispanic | 0.176 | −0.006 |
| Asian | 0.141 | 0.002 |
| Native American | 0.042 | −0.005 |
| Multiple races | 0.035 | −0.006 |
| Male | 0.015 | 0.002 |
| Single parent | 0.136 | −0.001 |
| Mother college or more | −0.233 | −0.001 |
| Father college or more | −0.191 | 0.003 |
| HH income $200 K or more | −0.063 | 0.002 |
| 10th grade reading score | −0.400 | 0.002 |
| 10th grade math score | −0.388 | 0.004 |
| 10th grade GPA | −0.672 | 0.010 |
| Any religion | 0.073 | −0.000 |
| Attend religious services regularly | −0.115 | 0.003 |
| Parent volunteers at school | −0.306 | 0.003 |
| 10th grade helping others not important | 0.090 | −0.004 |
| 10th grade helping others very important | −0.006 | −0.002 |
| 10th grade correcting inequalities not important | −0.027 | −0.003 |
| 10th grade correcting inequalities very important | 0.029 | −0.005 |
Declaration of Conflicting Interests
The author(s) declared no potential conflicts of interest with respect to the research, authorship, and/or publication of this article.
Funding
The author(s) received no financial support for the research, authorship, and/or publication of this article.