
Abstract
A non-fire-retardant and a fire retardant polyurethane foam are tested under a nitrogen environment using thermogravimetry at different heating rates of 1, 5, 20 and 60 °C min−1 to obtain the foams’ decomposition behaviours. During decomposition, both foams experience two major mass loss reactions with the second reaction consuming most of the fuel. Three graphical techniques applied to calculate the kinetic properties governing each reaction are kinetic analysis, the Arrhenius plot method and the inflection point methods. In general, these methods are compatible with the pyrolysis model within Fire Dynamics Simulator Version 5 and Gpyro. A normalised version of the inflection point methods is also developed to improve the suitability of the kinetic properties with the simplest decomposition scheme of the pyrolysis model. A consistent trend is noted in the calculated kinetic properties of both foams regardless of the calculation techniques applied.
Introduction
The focus of this article is to use graphical techniques to develop the governing kinetic properties of polyurethane foam based on the decomposition in thermogravimetric analysis (TGA) experiments under a nitrogen environment. The developed parameters are activation energy (E in kJ mol−1), pre-exponential factor (A in s−1) and reaction order (n). These properties are often used as inputs to pyrolysis models that govern the thermal decomposition rate of a material. Hence, it becomes crucial to ensure that the graphical techniques applied to evaluate these parameters are compatible with the pyrolysis model incorporated in a specific combustion model. Other researchers1,2 have investigated the decomposition of polyurethane foam under an air environment. The decomposition behaviour under air is different than for nitrogen due to the additional oxidative reactions, which means the governing kinetic properties are also potentially different.
This article is part of a wider scope of research on the fire behaviour of polyurethane foam and the combustion modelling capability of Fire Dynamics Simulator Version 5 3 (FDS 5). In order to obtain a better comparison between experimental and simulated results, the inputs to FDS 5 are refined using a generalised pyrolysis model called Gpyro 4 with an inbuilt genetic algorithm. The algorithm is a search tool based on Darwinian evolution theory that is capable of finding the optimal solutions to non-linear problems with multiple dimensions such as material decomposition governed by several kinetic properties. This article discusses the graphical techniques used to develop the kinetic properties of polyurethane foam, whereas the results of FDS 5 and Gpyro are presented in the dissertation of the research. 5
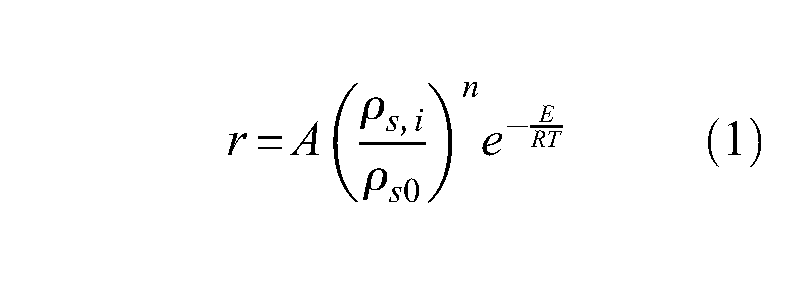
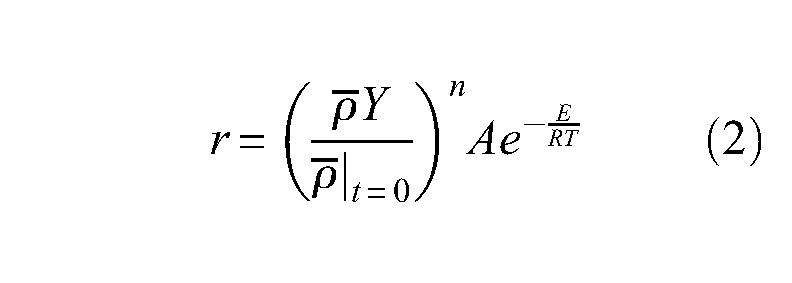
The pyrolysis model of FDS 5 and Gpyro calculates the rate of decomposition through an Arrhenius equation that is a temperature-dependent model and an nth order reaction model that is mass dependent. 3 The rate of decomposition for FDS 5 is represented by equation (1) and that for Gpyro is showed in equation (2). Despite the difference in notation, the pyrolysis model in FDS 5 and Gpyro is essentially equivalent
Three different graphical techniques using similar relationships as equations (1) and (2) are selected for this study, and they are kinetic analysis, the Arrhenius plot method and the inflection point methods. The repeatability of the TGA results and the calculated kinetic properties are also addressed. Further application of these properties in FDS 5 and, therefore, their suitability as model inputs is discussed more in the dissertation of this research. 5
Published kinetic properties and pyrolysis models of polyurethane foams
A number of studies in the literature have estimated the kinetic properties of polyurethane foam decomposition from TGA experiments. Various techniques are used to obtain these properties including the graphical techniques and the computational-based optimisation programs. Table 1 summarises the kinetic properties from the literature on foam decomposition under a nitrogen environment. Despite being recognised as the fundamental material properties of polyurethane foam, there are differences among the values reported that are caused by the variation in polyurethane foams studied, the application of different methods to establish the kinetic properties and the multidimensionality aspect of foam decomposition. In Table 1, the subscripts ‘1’ and ‘2’ denote the first and second reactions, respectively; ‘pre’ denotes the pre-first reaction and ‘NFR’ and ‘FR’ indicate non-fire-retardant and fire retardant.
Published kinetic properties of polyurethane foam decomposition under nitrogen environment
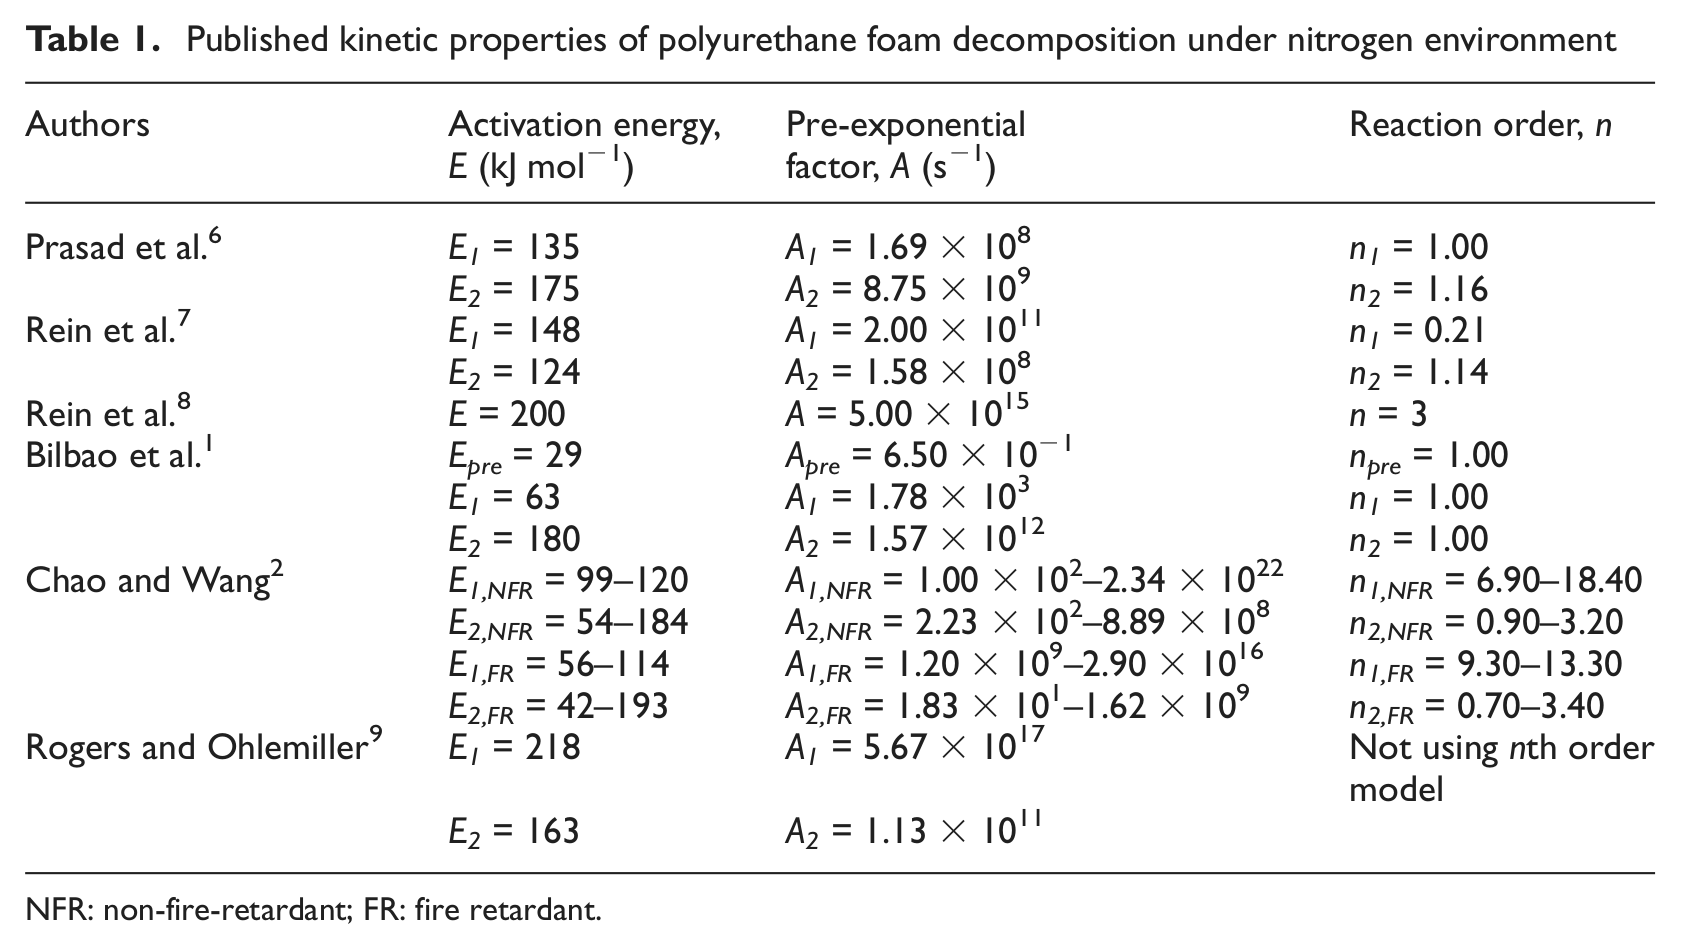
NFR: non-fire-retardant; FR: fire retardant.
Prasad et al.
Prasad et al. 6 used the FDS 5 pyrolysis model to simulate the decomposition of flexible polyether polyurethane foam in the TGA experiment. The research also simulated the foam burning behaviours in cone calorimeter and medium-scale flame spread slab experiments. The dimension of heat transfer is different for these experiments where TGA experiment is a lumped capacitance system, cone calorimeter is one-dimensional and slab experiment is two-dimensional. In their research, the genetic algorithm of Gpyro was applied to search for the kinetic properties within a defined search boundaries before using as inputs to FDS 5. The constraints of the algorithm are the allocated search duration and boundaries, both of which potentially have a significant influence on the final set of properties obtained.
Rein et al.
Rein et al.7,8 investigated the smouldering combustion of open-cell, flexible polyurethane foam under microgravity. Smouldering combustion consists of two mechanisms, namely, pyrolysis and oxidation. The kinetic properties relating to the former are listed in Table 1. The pyrolysis mechanism is commonly represented by two reactions but Rein et al. have also employed a single reaction scheme in their research. A numerical model was used to simulate the foam decomposition in lumped model TGA experiments and also the foam smouldering in one-dimensional microgravity experiments. The pyrolysis model of the numerical model is presented in equation (3)
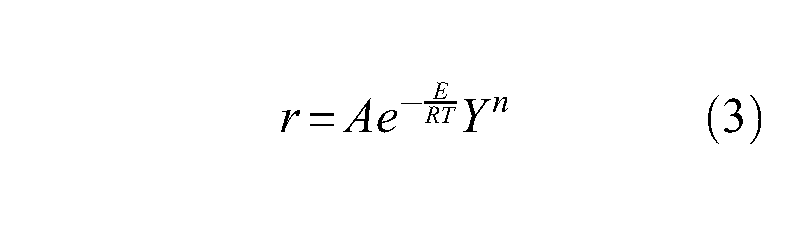
The kinetic properties were estimated with a genetic algorithm called ‘Genetic Algorithms for Optimisation Toolbox’ (GAOT). 10 Unlike Gpyro that has an inbuilt pyrolysis model, GAOT provides the flexibility to incorporate a user-defined pyrolysis model; thus, the numerical model in equation (3) is used.
Bilbao et al.
In a study on the decomposition of polyurethane foam in a nitrogen environment and an air environment, Bilbao et al. 1 conducted TGA experiments in dynamic and isothermal modes to estimate the kinetic properties. The dynamic mode is a more common selection where the decomposition occurs across a range of temperatures. In the isothermal mode, the temperature is held constant once a set point temperature is reached. The foam studied was made from diisocyanate and polyether-type polyol. The pyrolysis model used for calculating the kinetic properties is presented in equation (4) where the reaction order, n, is assumed to be 1
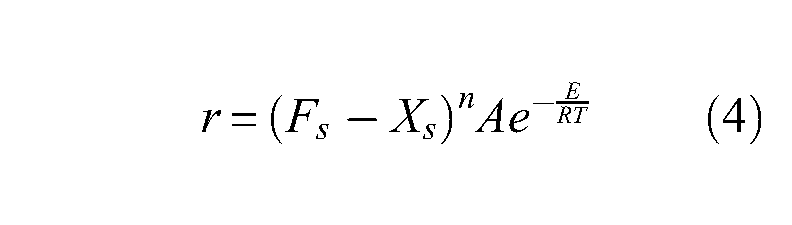
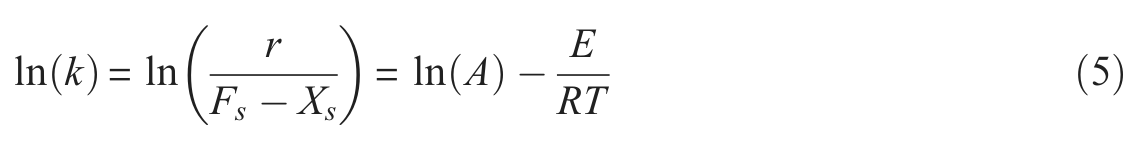
To estimate A and E, other variables in equation (4) are found from the dynamic experiments except for Fs that is obtained from the isothermal experiments, and by rearranging, equation (5) is obtained. By plotting ln(k) versus 1/T, the foam decomposition was classified by Bilbao et al. into pre-first reaction, first reaction and second reaction regions. Subsequently, the kinetic properties for each region were graphically determined from the slope and y-intercept of the plot
Chao and Wang
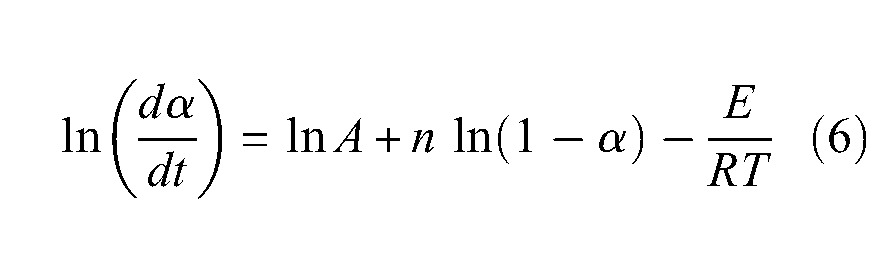
Chao and Wang 2 investigated the decomposition of non-fire-retardant and fire retardant open-cell flexible polyurethane foam in a nitrogen environment and also an air environment. The pyrolysis model used is represented by equation (6), and the kinetic properties were estimated from the slope and y-intercept of ln(dα/dt) versus 1/T plot
Rogers et al.
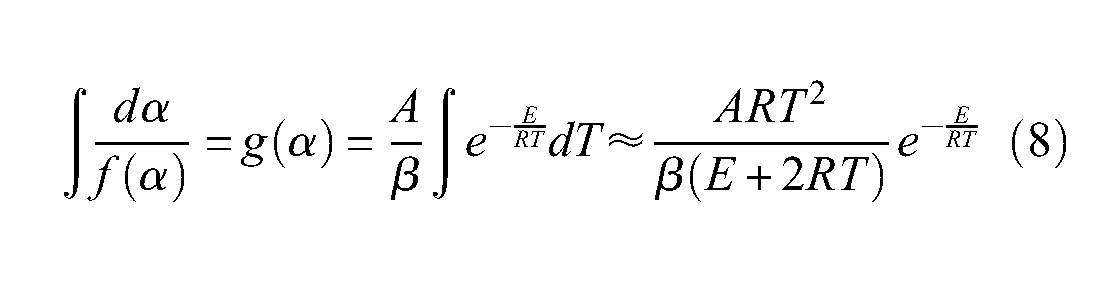
Instead of using a reaction order, n, Rogers et al. 9 used two different rate laws to graphically evaluate the kinetic properties governing the decomposition of flexible polyurethane foam, which is known to demonstrate a tendency to smoulder. From 16 rate laws available, Rogers et al. performed a ‘reduced rate’ assessment on each in order to select those suitable for the foam decomposition. Following the assessment, the first reaction was represented by a two-dimensional diffusion-controlled rate law, while the second reaction was represented by a random nucleation rate law. The parameter evaluation started from a generalised rate equation, as shown in equation (7)

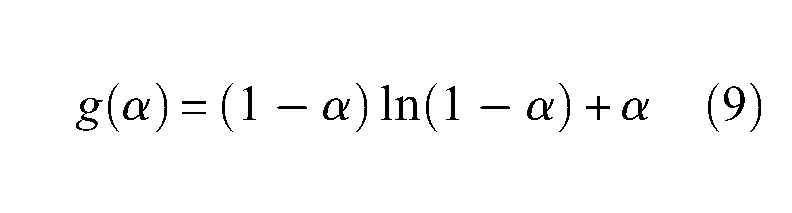
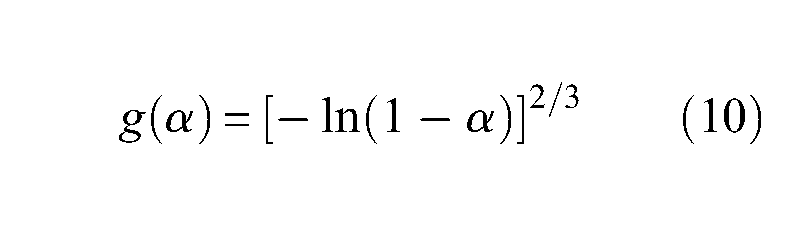
After some rearrangement and adopting the Gorbachev approximation for the exponential integral, equation (8) is obtained. 11 For the first reaction, g(α) is defined by equation (9), while for the second reaction, it is represented by equation (10). The kinetic properties were estimated through the slope and y-intercept of ln[g(α)/T2] versus 1/T plot
TGA experiments
The equipment used to conduct the decomposition experiments is a DSC–TGA Q Series™ instrument, SDT Q600 manufactured by TA Instruments. The TGA experiments are carried out in dynamic mode where the foam sample is subjected to a constant heating rate within a gas purged furnace from room temperature (∼20°C) up to the maximum temperature of 600°C. A sample mass between 3 and 4 mg is prepared by shredding the polyurethane foam into fine fragments so as to half-fill a 90 µL alumina cup. Inside the furnace, the sample and reference cups are placed on the platinum platform of the sample and reference balance beams, respectively. The equipment also simultaneously performs differential scanning calorimetry (DSC) that records the changes in enthalpy during sample decomposition. The DSC results for foam decomposition are discussed in the dissertation of this research. 5
The heating rates selected are 1, 5, 20 and 60 °C min−1, and these are chosen based on the temperature variation of a polyurethane foam smouldering front, reported to range between 1 and 150 °C min−1. 7 The chosen rates are also below the maximum allowable limit of 100 °C min−1 for the equipment. The purge gas used is nitrogen, which is delivered at a constant rate of 100 mL min−1, and since nitrogen is non-reactive, the foam decomposition is solely influenced by heat.
Decomposition of polyurethane foams
Two polyurethane foams are discussed to introduce the graphical techniques for estimating the kinetic properties, and three repetitions at each heating rate are conducted. Table 2 provides a general description of the selected foams that are referred to as NFR-SB-31 and FR-Y-36. According to the manufacturer information, the polyurethane foams are made from the reaction of mainly toluene diisocyanate, water and polyalkoxy polyether polyol. The polyol also contains styrene and acrylonitrile polymer. Other ingredients in smaller quantity include inorganic fillers, plasticisers, extenders, antimicrobial agents and pigments. The fire retardant FR-Y-36 contains melamine and halophosphate as fire retardant additives. The exact concentration of these additives is unavailable for commercial reasons but according to the literature, certain formulation contains as much as 10% melamine by weight. 12
General description of NFR-SB-31 and FR-Y-36
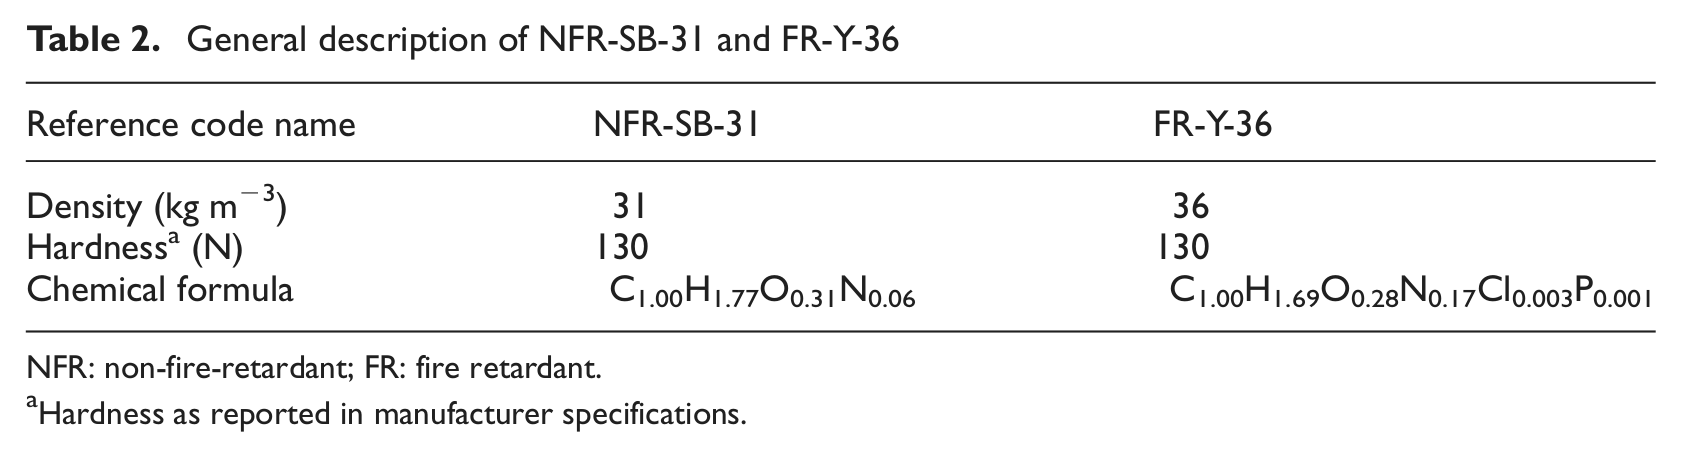
NFR: non-fire-retardant; FR: fire retardant.
Hardness as reported in manufacturer specifications.
NFR-SB-31 is commonly used in domestic and commercial furniture and also in vehicle seating. FR-Y-36 is tested to BS 5852:2006, 13 AS/NZS 1530.3:1999, 14 Technical Bulletin 117 15 and § 25.853 of the Federal Aviation Regulations. 16 The application of FR-Y-36 includes public auditorium seating, public transport seating (including aviation) and hospital seating. The elemental analysis results show the presence of carbon, hydrogen, oxygen and nitrogen in both foams, while a small amount of chlorine and phosphorus are found in FR-Y-36. Chlorine and phosphorus detected originate from halophosphate added into the formulation, and the higher nitrogen content of FR-Y-36, as shown in Table 2, is indicative of the presence of melamine. 17 The chemical formulae of both foams are similar with those found in the literature.18–20
Upon decomposition, halophosphate breaks down into a phosphate structure and releases chlorine. Chlorine is able to combine with the highly reactive radicals released by the foam decomposition to form inactive molecules that inhibit the fire. 21 While chlorine functions as a gas phase fire retardant, phosphorus performs in the solid phase. The phosphate structure creates an acidic environment through the formation of phosphoric acid.22,23 The acidic environment catalyses the hydrolysis of the phosphate structure resulting in a cross-linking mechanism that leads to the formation of thermal insulating residue that slows the decomposition. The gaseous isocyanate that evolves from the polyurethane foam decomposition is known to react with the phosphate structure and acid to produce secondary products and residues. As a result, the amount of isocyanate released directly into the gas phase for immediate combustion is reduced. 23
The other fire retardant additives, melamine 24 (C3H6N6), is able to function in both the gas and the solid phases. Melamine initially sublimes and when heated further, it releases ammonia and nitrogen gas that are thermally stable thus diluting the combustible gases. The remaining melamine reacts with the phosphoric acid produced from halophosphate breakdown to form thermally stable cross-linked residues, melam at 350°C, melem at 450°C and melon at 600°C. 17 According to Price et al., 12 melamine is reactive towards isocyanate above 250°C and from the resulting reaction, a polymeric structure is formed, which later further degrade into char.
Figure 1 shows the changes in the mass of NFR-SB-31 during its decomposition in the nitrogen environment at 1, 5, 20 and 60 °C min−1. The measured sample mass is plotted against the sample temperature. NFR-SB-31 fully decomposed over two regions of significant mass loss, and for each heating rate, the repeated results are reproducible. A transition region with a smaller mass loss exists between the two decomposition regions as indicated on the results at 1 °C min−1 in Figure 1. With increasing heating rate, the decomposition of NFR-SB-31 shifts towards higher temperature while its overall trend remains consistent with only minute changes in the mass loss over each region. As shown in Figure 1, 23%–26% of the sample mass is lost during the first reaction, while in the transition and second reaction, 4%–6% and 69%–71% of the sample mass is lost, respectively.
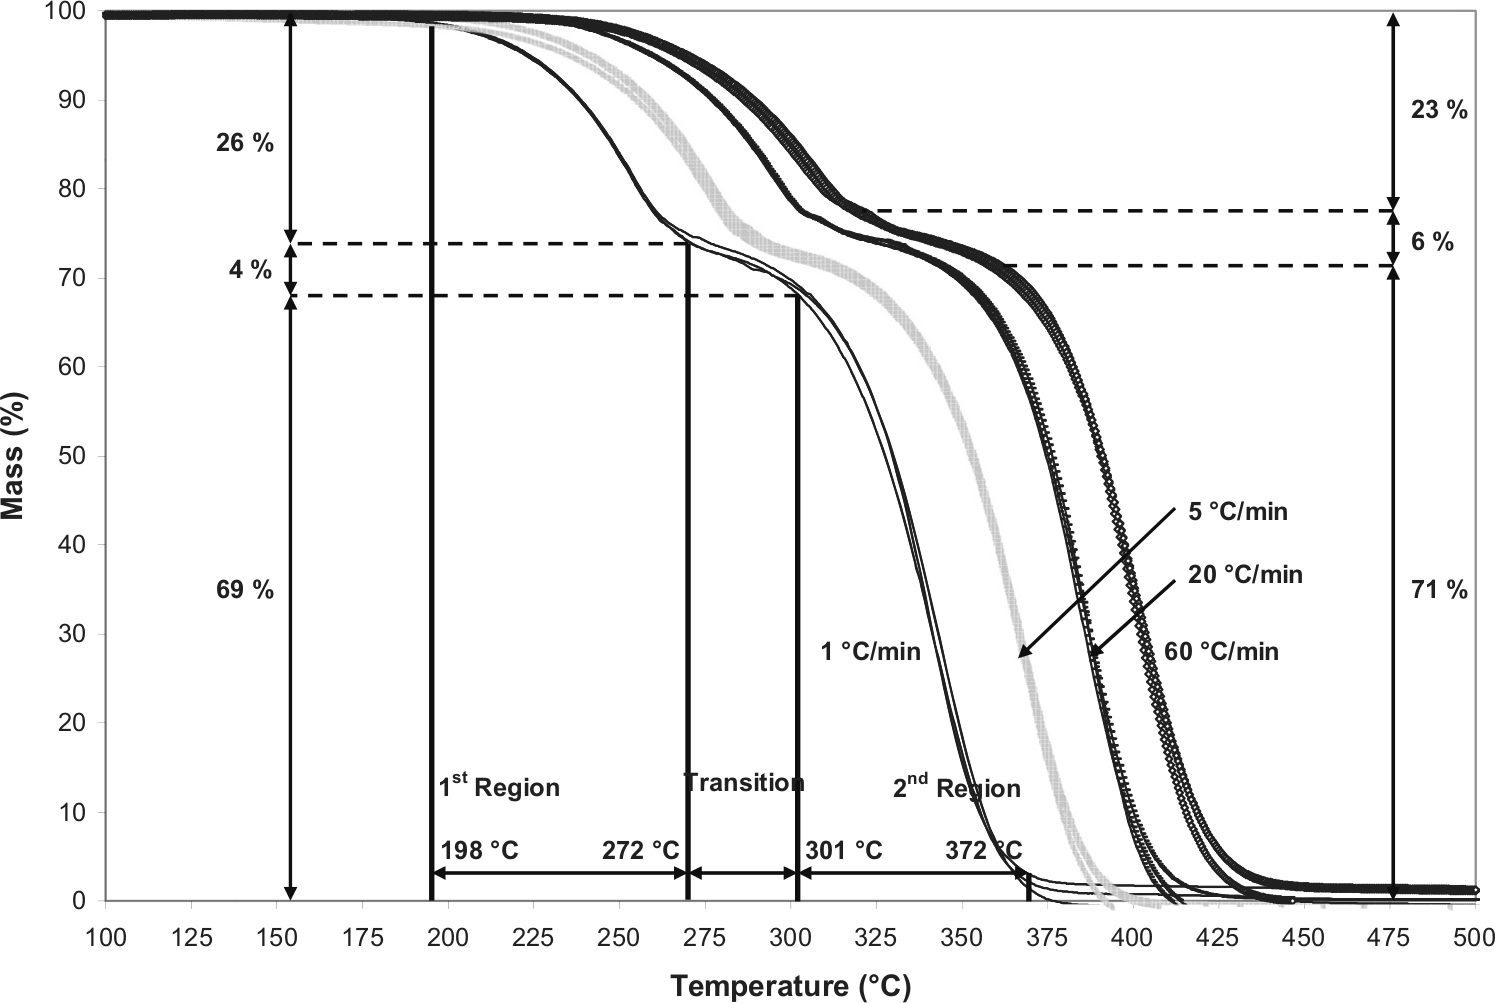
Sample mass versus temperature of NFR-SB-31 at heating rates of 1, 5, 20 and 60 °C min−1.
FR-Y-36 also decomposed via two significant mass loss reactions, as shown in Figure 2. The overall decomposition trend is similar to NFR-SB-31 except the changes in heating rate have more impact on the amount of sample decomposed during the first reaction and transition. From Figure 2, during the first reaction, 19%–31% of the sample mass is lost, while during the transition and second reaction, 6%–15% and 63%–66% of the sample mass is lost, respectively. For NFR-SB-31, the first reaction and transition show negligible changes in sample decomposition, changing by 3% and 2%, respectively, over different heating rates but for FR-Y-36 these changes are more significant, varying by 12% and 9%, respectively.
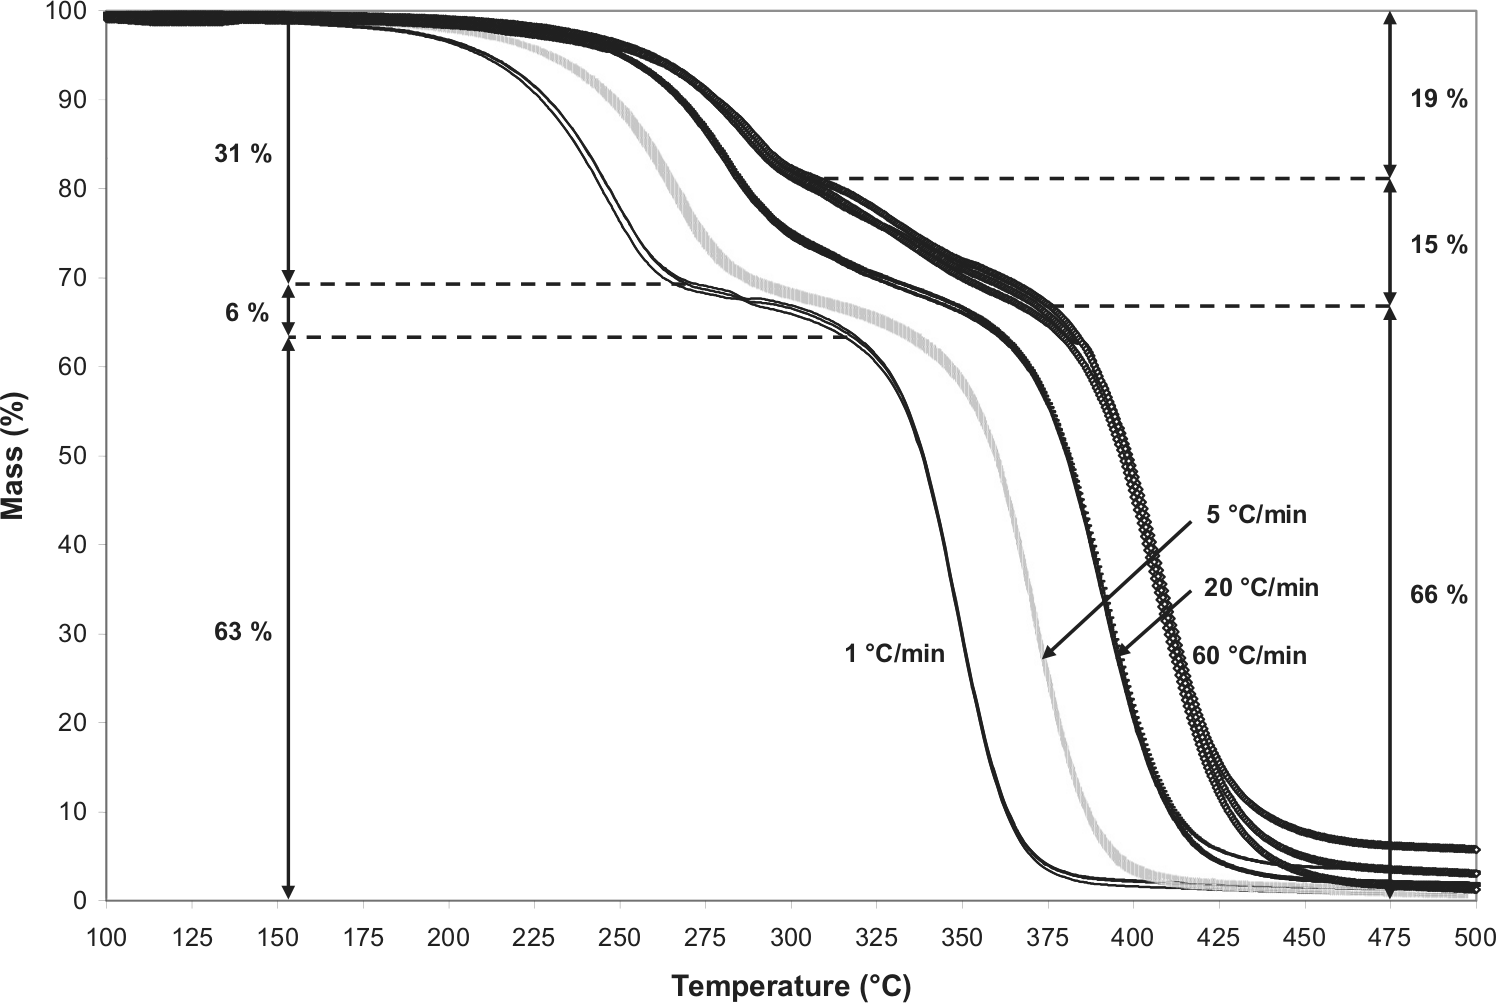
Sample mass versus temperature of FR-Y-36 at heating rates of 1, 5, 20 and 60 °C min−1.
Figure 3 shows the mass loss per degree Celsius versus sample temperature of NFR-SB-31 for all four heating rates. Two significant mass loss reactions are seen as the prominent protuberances in Figure 3, and the peak of reaction occurs at the temperature where the maximum mass loss per degree Celsius is recorded. The peak magnitude of the second reaction is approximately three times greater than the first reaction, and when the heating rate increases, the peak of the first reaction decreases while that of the second reaction remains effectively constant.
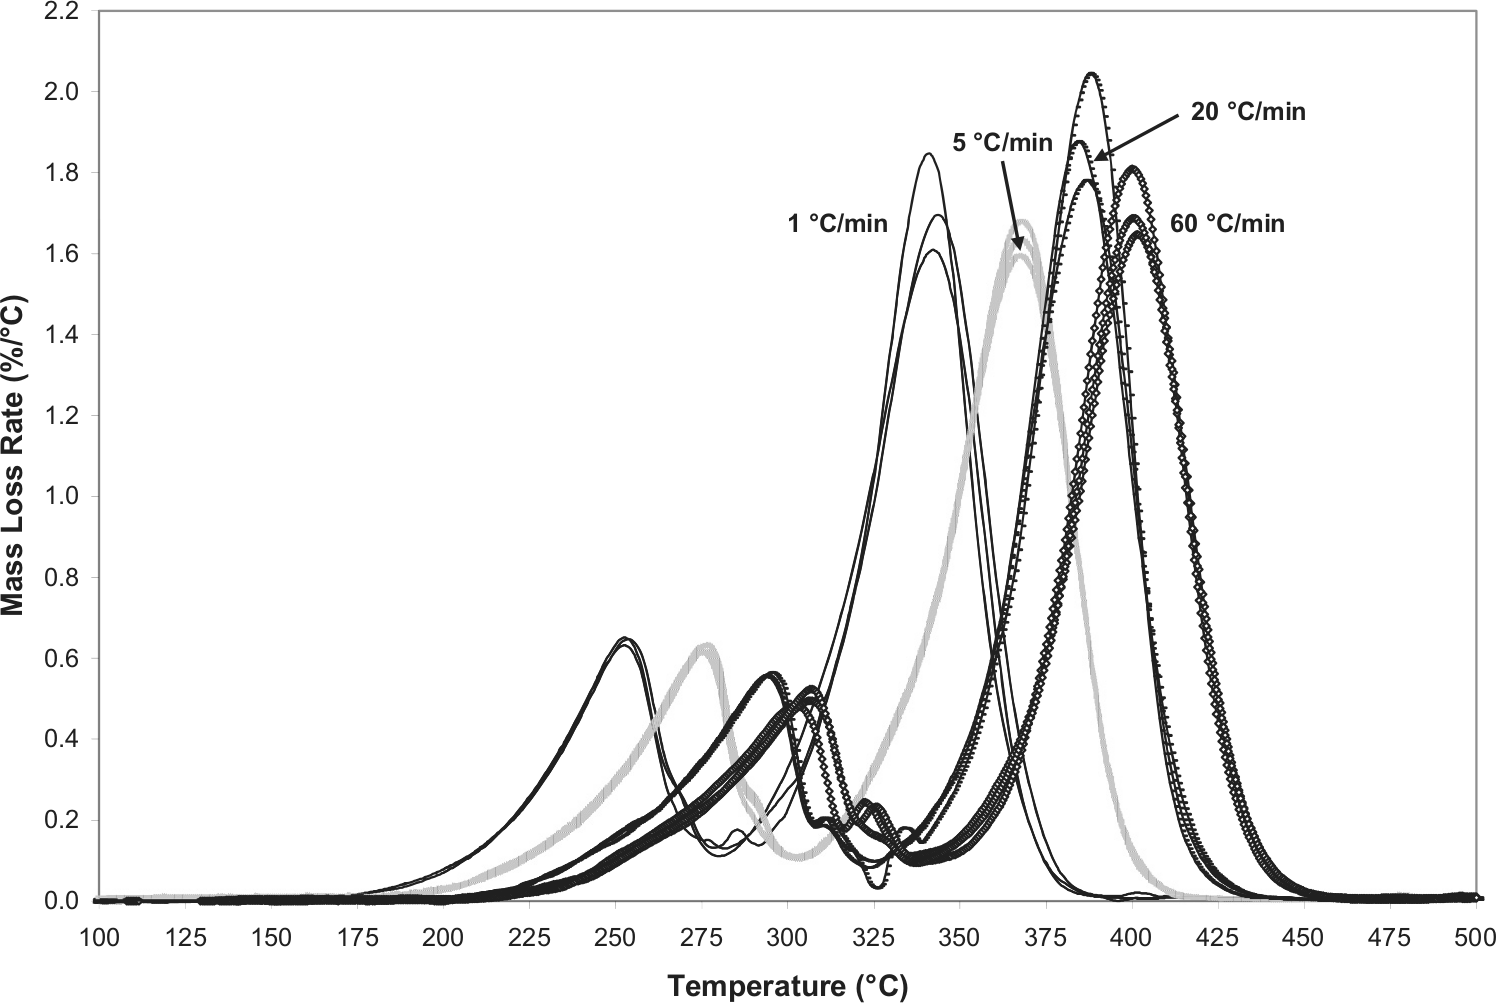
Mass loss per degree Celsius versus temperature of NFR-SB-31 at heating rates of 1, 5, 20 and 60 °C min−1.
For FR-Y-36, the peak in both reactions decreases with increasing heating rate as seen from the mass loss per degree Celsius versus sample temperature plot in Figure 4. The systematic decrease in the peak magnitude is accompanied by a progressive increase of the overall magnitude during transition, which is not observed in NFR-SB-31. At 60 °C min−1, the mass loss per degree Celsius during transition has increased to more than 0.2% per degree Celsius, doubling the magnitude at 1 °C min−1.
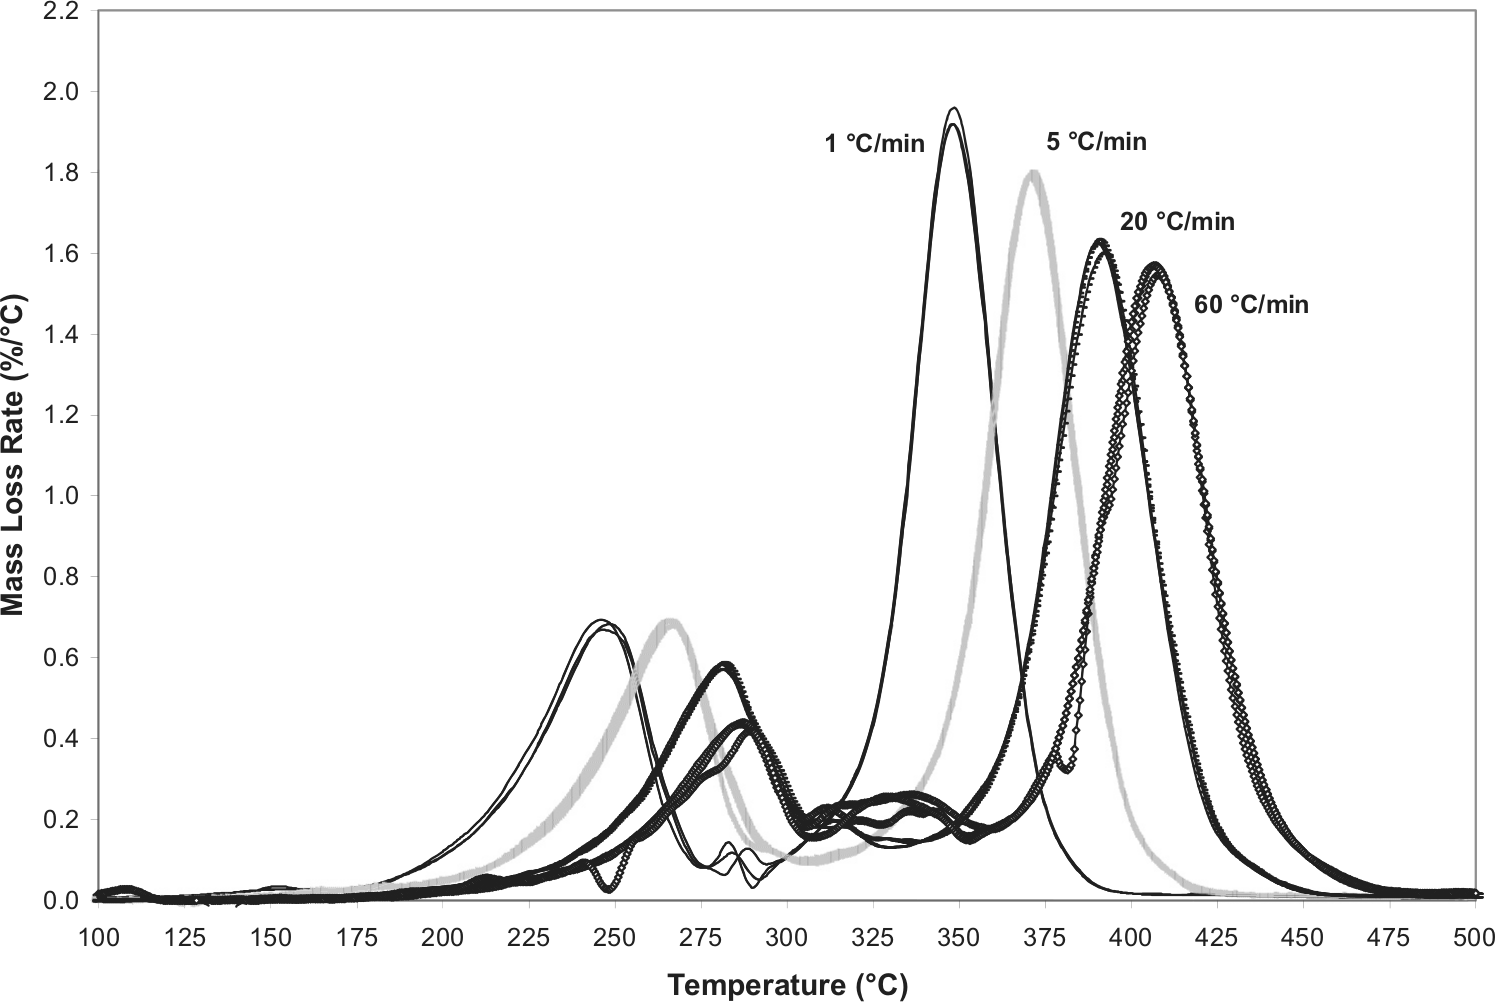
Mass loss per degree Celsius versus temperature of FR-Y-36 at heating rates of 1, 5, 20 and 60 °C min−1.
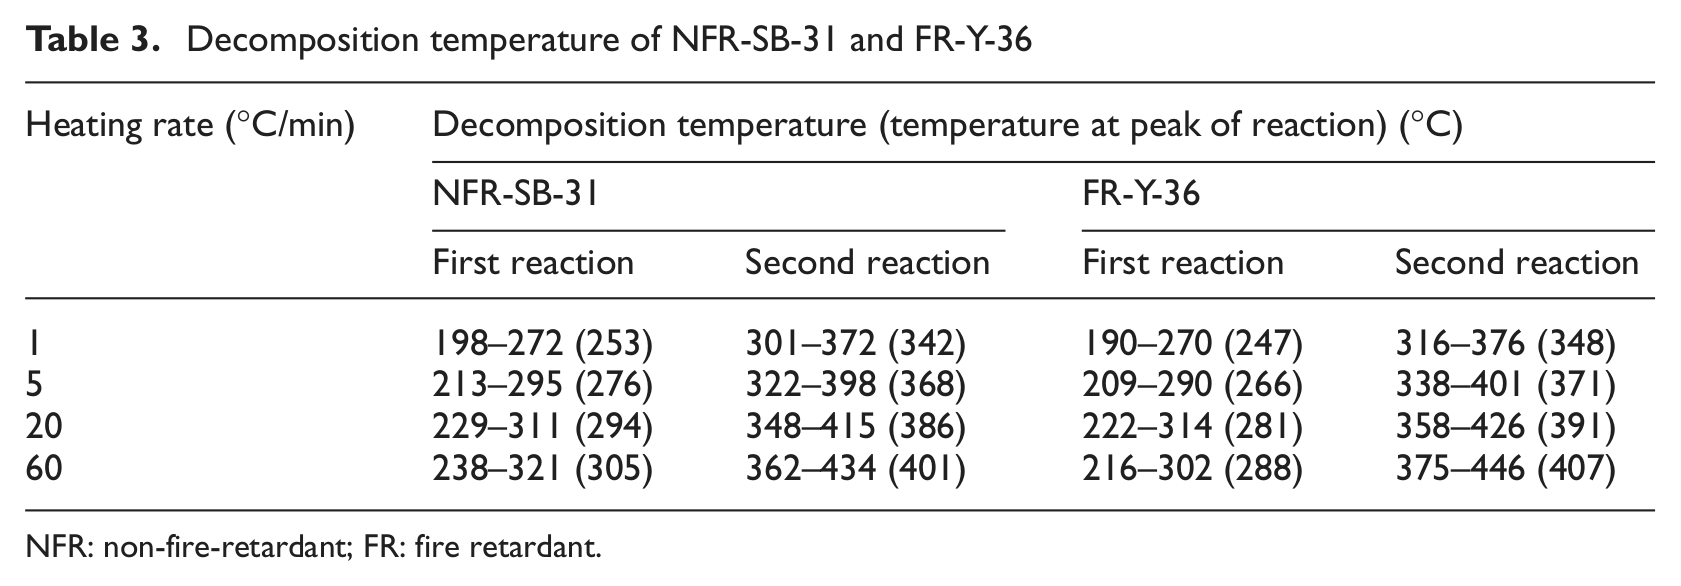
Table 3 shows the decomposition temperature range of each reaction for NFR-SB-31 and FR-Y-36. The values presented are the average of the three repeated experiments, and the values in brackets are the temperature where the maximum mass loss per degree Celsius is recorded. Based on the observed trend in Figures 3 and 4, the start and end temperatures of the decomposition are quantified as the temperature where the mass loss per degree Celsius is 10% of the difference between the minimum and maximum of the specific reaction.
Decomposition temperature of NFR-SB-31 and FR-Y-36
NFR: non-fire-retardant; FR: fire retardant.
Over the range of heating rates tested, the consistently lower start and peak temperatures of the first reaction for FR-Y-36 indicate that it decomposes earlier than NFR-SB-31. According to Grassie et al.22,23 and Price et al., 12 the decomposition of fire retardant foam occurs at lower temperatures because the overall process is catalysed by the acidic environment created and the presence of ammonia following the breakdown of halophosphate and melamine, respectively. The early decomposition of FR-Y-36 leads to the formation of residue that impacts the remainder of the decomposition process.
Comparing the decomposition behaviours of NFR-SB-31 with FR-Y-36, the latter demonstrates greater resistance to decomposition as a result of the formation of thermal insulating residue from halophosphate and melamine. From Table 3, the transition region where the decomposition rate is minimal is wider for FR-Y-36, 44°C–73°C compared to 27°C–41°C for NFR-SB-31. According to the TGA results, the majority of the fuel is consumed during the second reaction thus in the event of fire, the decomposition of FR-Y-36 will have to overcome a greater temperature barrier due to the widened transition before the second reaction can initiate, thus delaying the onset of significant fuel consumption. Figure 2 shows that the widening of transition also reduces the amount of sample decomposed during the first reaction from 31% at 1 °C min−1 to 19% at 60 °C min−1; thus, the fuel gas released under a high heating rate has reduced.
For NFR-SB-31, the peak magnitude of the second reaction remains constant with increasing heating rate, as shown in Figure 3. Due to residue formation of FR-Y-36 that interferes with the release of pyrolysates, the peak magnitude of the second reaction in Figure 4 actually decreases with the increasing heating rate. This indicates a reduction in the fuel gas released per increase of the material temperature. In terms of the total amount of fuel gas released, FR-Y-36 in Figure 2 is also 5%–6% less than NFR-SB-31 in Figure 1 when compared over the second reaction that is the major mass loss region. This shows the effectiveness of residue formation in reducing the release of pyrolysates into the gas phase.
From the reduction in peak magnitude and in the amount of fuel consumed during the second reaction and also the widening of transition region, FR-Y-36 has demonstrated greater resistance towards decomposition than NFR-SB-31. This shows that the halophosphate and melamine in FR-Y-36 are able to form a residue that provides some level of thermal insulation and at the same time restricts the release of pyrolysates. The fire retardant mechanisms are consistent with the descriptions provided in the literature, and the differences seen in the decomposition pattern between NFR-SB-31 and FR-Y-36 are also compatible with the NFR and FR foams reported by Price et al. 12
Determination of kinetic properties using graphical techniques
Three graphical techniques are employed on the TGA results for NFR-SB-31 and FR-Y-36 to evaluate the kinetic properties, E, A and n for the first and second reactions. First of these methods is kinetic analysis, 25 also known as the ‘model free’ method, 26 which calculates a set of global kinetic properties for all experiments. The other two methods, the Arrhenius plot method 25 and the inflection point methods, 27 determine the kinetic properties specific to each experiment. The individual kinetic properties are later involved in the assessment of their repeatability. To demonstrate the calculation involved, the experimental results of NFR-SB-31 are used.
Kinetic analysis or ‘model free’ method
Equation (11) is the general kinetic equation 25 and is assumed to be an adequate representation of the thermal decomposition of polyurethane foam. The temperature-dependent rate constant, k, is represented by the Arrhenius equation, as shown in equation (12). The decomposition chemistry represented by the kinetic model, f(W/W0), is independent of temperature and solely a function of the instantaneous sample mass. The first kinetic parameter determined is E, and since no knowledge of f(W/W0) is required at this stage, this method is considered ‘model free’ 26
Substituting equation (12) into equation (11) and taking the natural logarithm give equation (13)
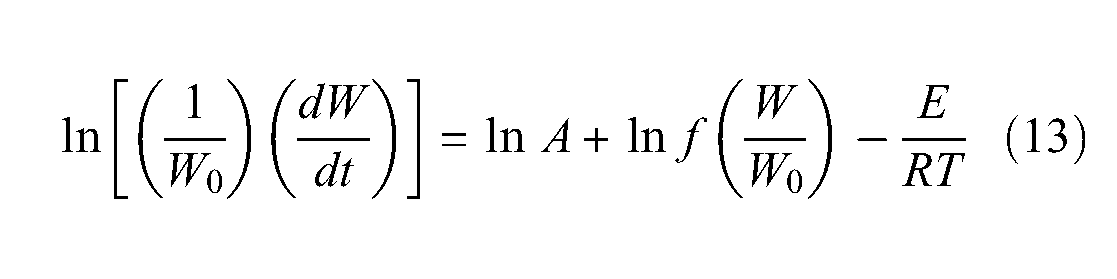
Figure 5 shows the relationship between ln[(1/W0)(dW/dt)] and 1/T for NFR-SB-31. The data are plotted for W/W0 ranging between 0.95 and 0.05, at the interval of 0.01. The initial and final 5% of the data are excluded to eliminate the uncertainties due to baseline offset while still retaining sufficient points for further analysis. Each line in Figure 5 corresponds to a specific W/W0 and each point on a line represents the average of three repeated experiments at a given heating rate. At each W/W0, E is determined from the slope, E/R; thus, it is a value dependent on the number of heating rates included in the analysis, in this case 1, 5, 20 and 60 °C min−1.
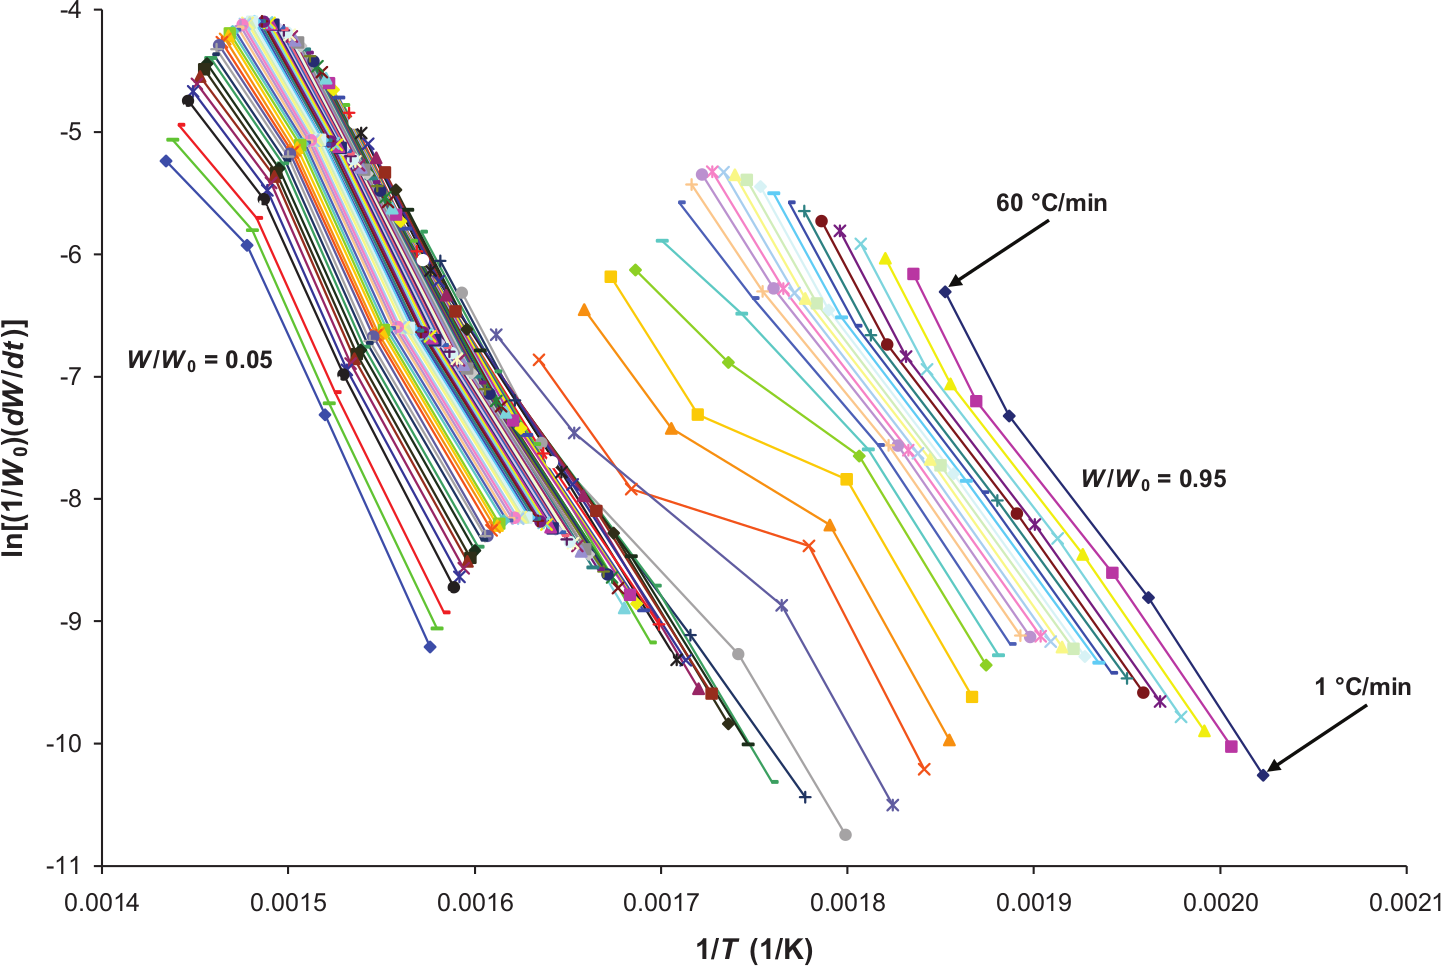
ln[(1/W0)(dW/dt)] versus 1/T plotted for W/W0 from 0.95 to 0.05 of NFR-SB-31.
Figure 6 shows E plotted against W/W0 where there are two regions in which E becomes relatively constant. The global E for each decomposition reaction is determined as the average of the respective regions. Since E varies from approximately 120–240 kJ mol−1, selecting the data points for calculating the global E uses the R2 values from ln[(1/W0)(dW/dt)] versus 1/T of at least 0.99 and the difference in E between the adjacent W/W0 not exceeding 5 kJ mol−1. Based on such selection criteria, the first decomposition reaction is determined to range from W/W0 of 0.94 to 0.79 and the second reaction ranges from 0.61 to 0.07. The global E for the first and second reactions is 179 and 231 kJ mol−1, respectively. In the region between 0.78 and 0.62, E changes rapidly as the first reaction transitions into the second reaction.
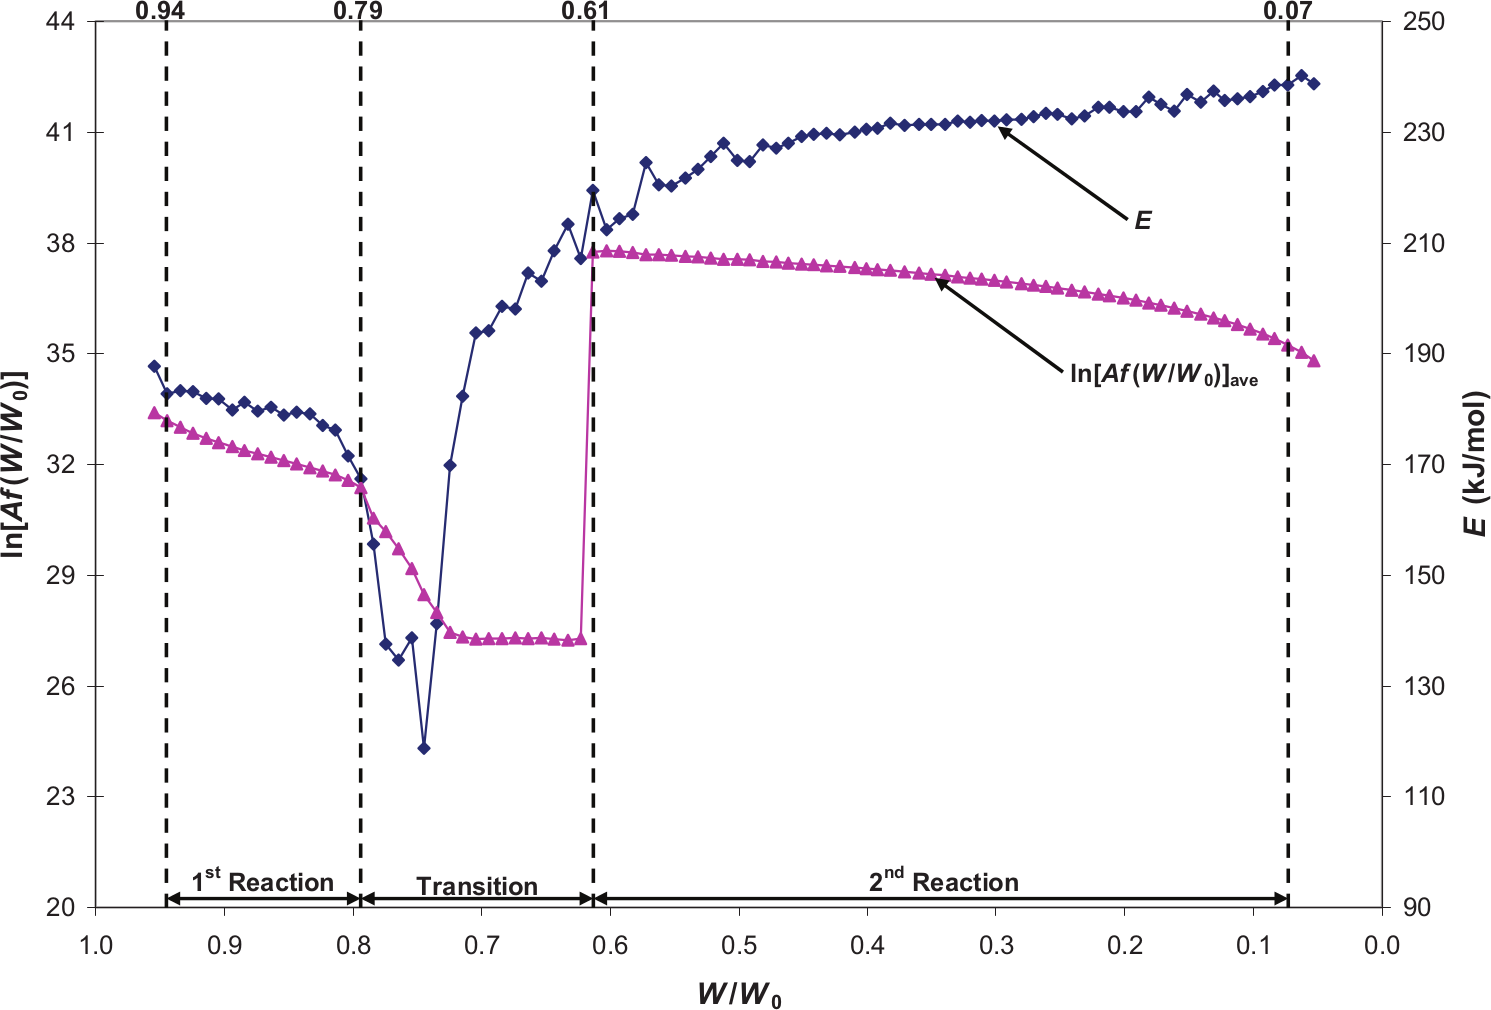
E and ln[Af(W/W0)] ave versus W/W0 of NFR-SB-31.
With E determined, n and A are calculated simultaneously. For each heating rate and each W/W0, ln[Af(W/W0)] is evaluated by substituting the global E into equation (13). At each W/W0, ln[Af(W/W0)] ave , which is the average for all heating rates, is calculated and plotted in Figure 6. At this stage, a kinetic model is required, and the nth order kinetic model in equation (14) is assumed for the polyurethane foam decomposition
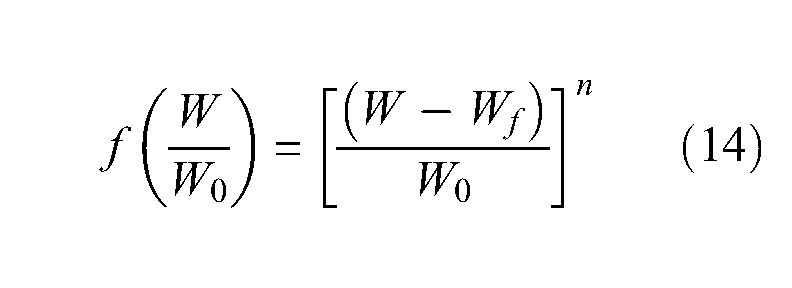
This kinetic model is applicable for modelling a solid reactant converting into a constant ratio of gaseous and solid product. 25 This is the case with polyurethane foam as the TGA results show the mass fraction of products from the first and second reactions is consistent with respect to the heating rates included within the analysis. Multiplying both sides of equation (14) by A and taking the natural logarithm yield equation (15)
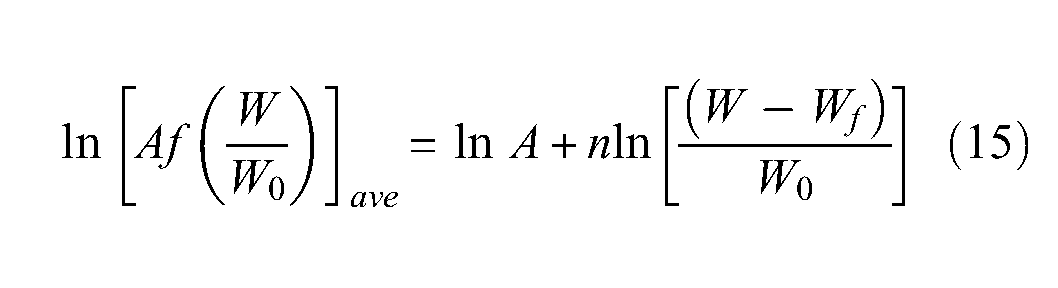
In Figure 7, ln[Af(W/W0)] ave versus ln[(W − Wf)/W0] is plotted for all three regions. Calculating the slope and y-intercept, the global n and A are determined. For the first and second reactions, n are 9.51 and 1.23, respectively, while A are 3.61 × 10¹⁴ and 4.72 × 10¹⁶ s−1, respectively.
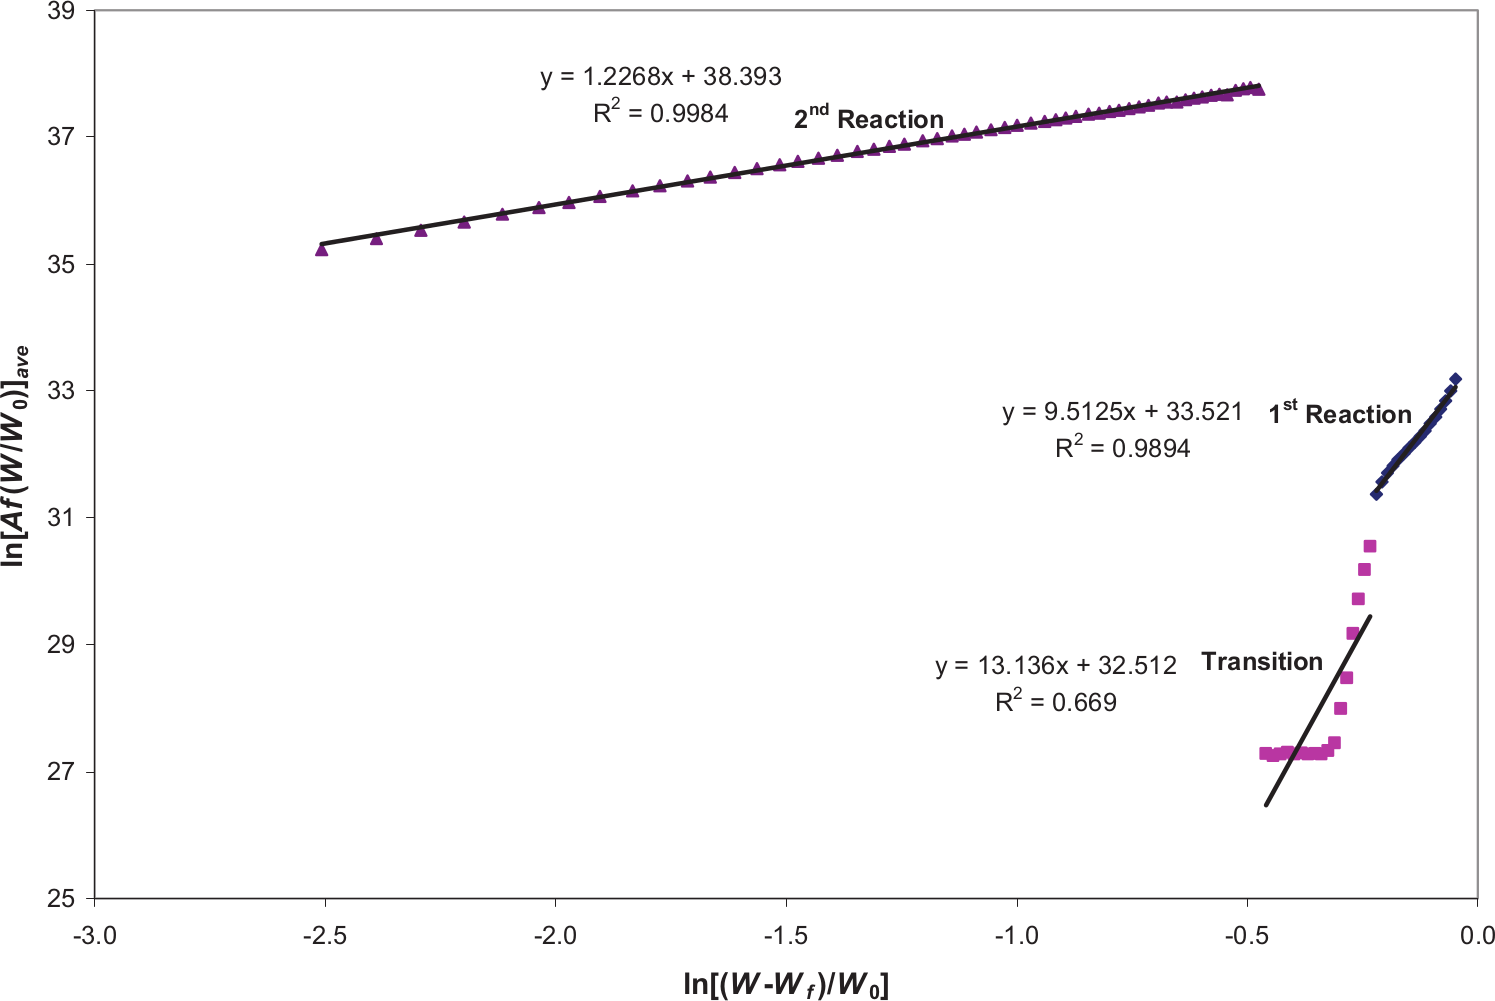
ln[Af(W/W0)] ave versus ln[(W − Wf)/W0] of NFR-SB-31.
As demonstrated, a single set of kinetic properties is derived using kinetic analysis on the TGA results over a range of heating rates, and therefore, these properties are considered as the global representation of the polyurethane foam decomposition. Being global also means that these properties are influenced by the heating rates included within the analysis.
Arrhenius plot method
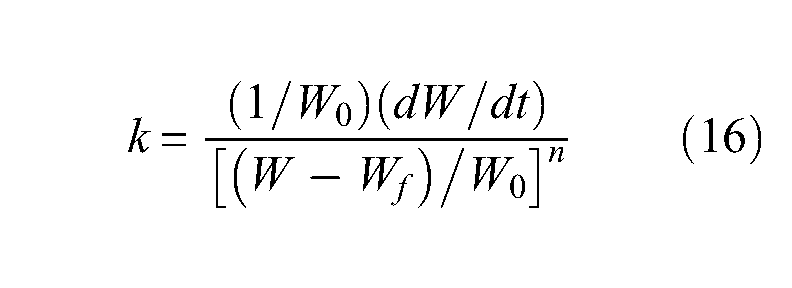
Besides the global values derived earlier, the kinetic properties specific to each experiment are also estimated using the Arrhenius plot method, 25 which utilises the global n from kinetic analysis. Using the general kinetic equation in equation (11) and assuming nth order kinetic model in equation (14), k is redefined in equation (16)
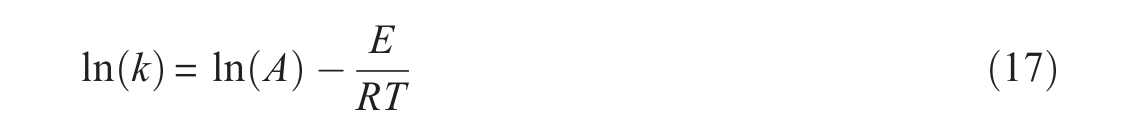
For each repeated experiment, k is evaluated by applying the global n found in kinetic analysis over the respective W/W0 range of the first reaction, transition and second reaction. The natural logarithm form of the Arrhenius equation is given in equation (17), and ln(k) is plotted against 1/T to estimate E and A from the slope and y-intercept, as shown in Figure 8
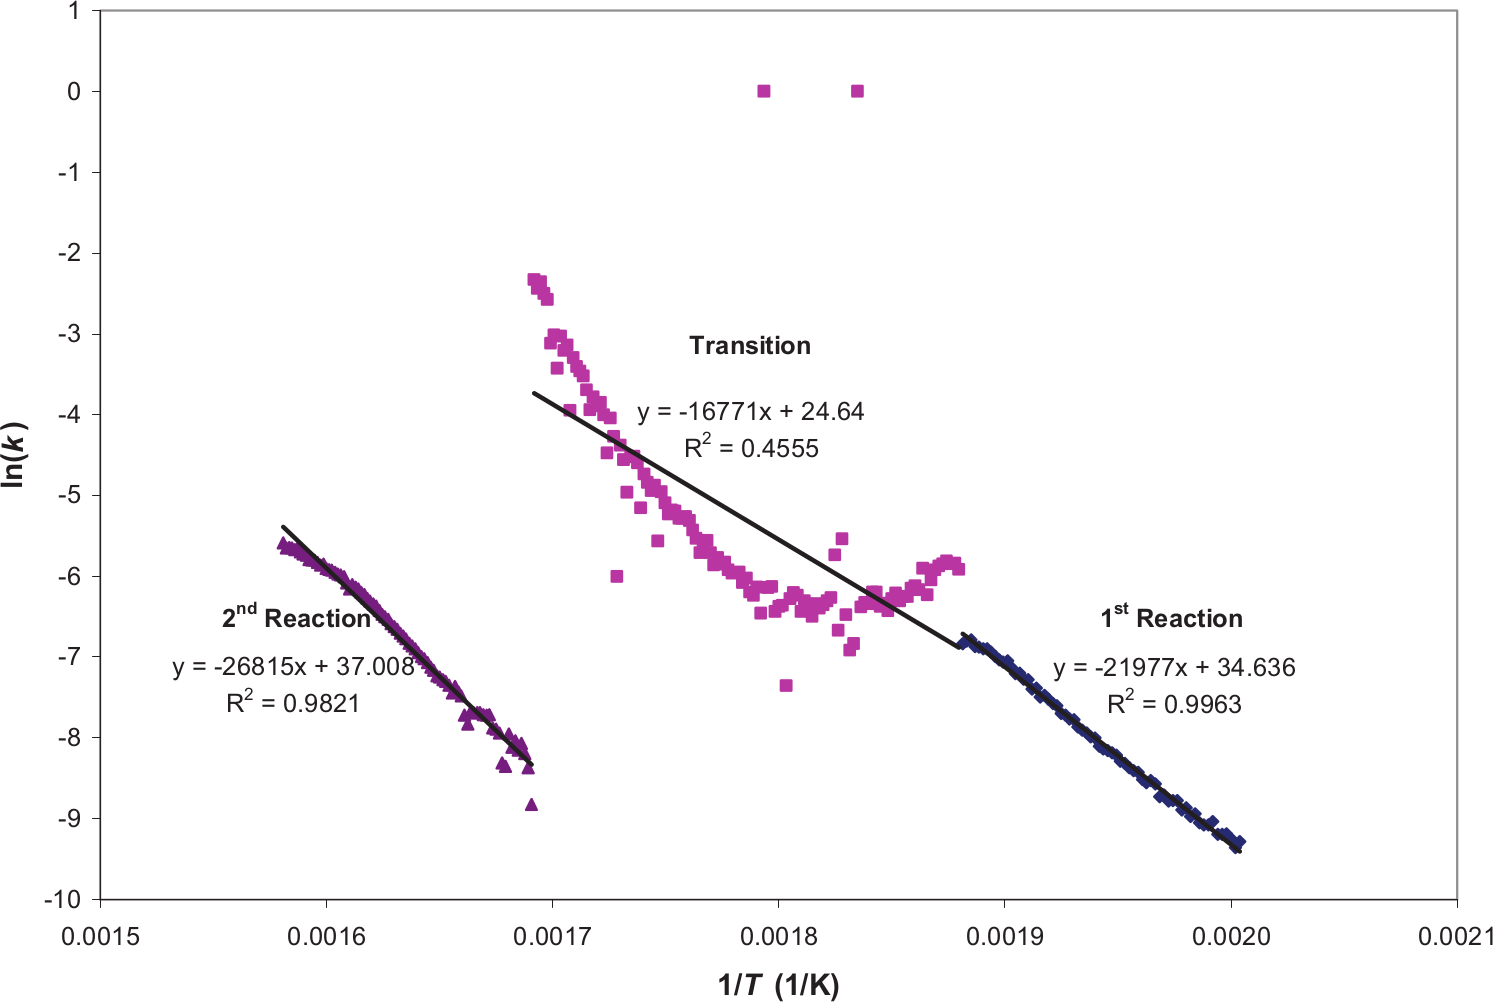
ln(k) versus 1/T at 1 °C min−1, first repetition of NFR-SB-31.
Again using NFR-SB-31 as an example, from the first repetition at 1 °C min−1, E and A of the first reaction are 183 kJ mol−1 and 1.10 × 10¹⁵ s−1, respectively, while those of the second reaction are 223 kJ mol−1 and 1.18 × 10¹⁶ s−1, respectively. Using the global n and analysing over the identical regions as described in kinetic analysis, the kinetic properties found from the Arrhenius plot method are expected to be close to kinetic analysis. The values of E and A for other repetitions are also determined using the outlined approach, and these properties are discussed later. Starting with the Arrhenius plot method and later with the inflection point methods, the determination of kinetic properties for each TGA experiment provides further details regarding the repeatability and trend of these properties.
Inflection point methods
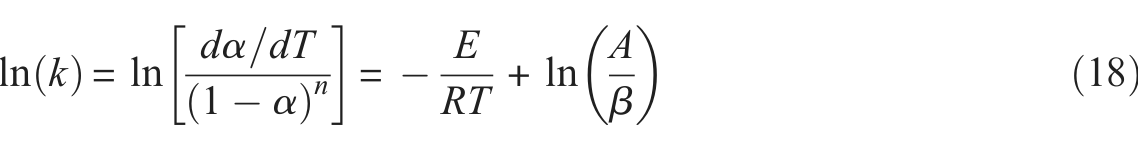
Like the Arrhenius plot method, the inflection point methods 27 are applied to evaluate the kinetic properties of each experiment. However, as an independent technique, the calculation methods and the analysis regions are different to the graphical approaches, as discussed previously. From equations (11) and (16), k is defined as the decomposition rate divided by the mass-dependent kinetic model. Based on the same definition, k in equation (18) is represented as the temperature based decomposition rate, dα/dT divided by the nth order kinetic model, (1 − α) n which is a function of the fraction decomposed, α. Comparing k of equations (11) and (16) with equation (18), the former are time based and they are defined in terms of fraction remaining, while the latter is temperature based and it is defined in terms of fraction decomposed, α. On the right-hand side of equation (18), the equation is converted into a temperature basis by dividing A with the constant heating rate, β of an experiment
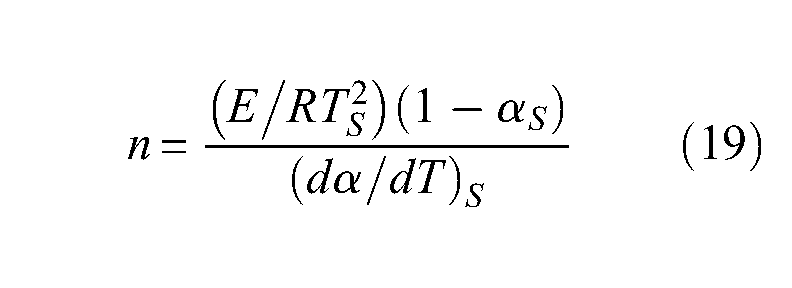
During the peak or maximum inflection point of mass loss per degree Celsius, dα/dT is a maximum while d 2 α/dT 2 is 0, and through solving these conditions, n is defined in equation (19). The parameters with subscript S denote the values at the maximum inflection point
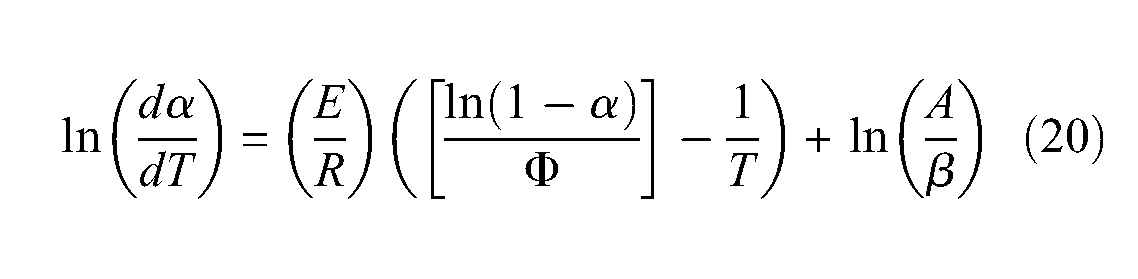
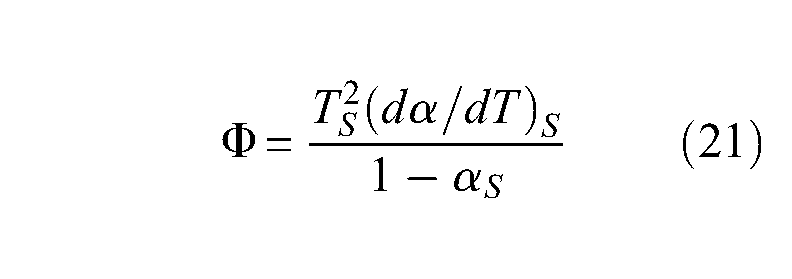
Substituting equation (19) into equation (18) yields equation (20), and the parameter Φ is calculated in equation (21)
The analysis region of each reaction needs to be defined before solving for any parameters. The data points are plotted from the ‘start of a reaction’ to the peak dα/dT, and ‘start of a reaction’ is defined as the temperature where dα/dT is 10% of the difference between the maximum and minimum dα/dT. Figure 9 shows the defined analysis region of the first and second reactions from the first repetition at 1 °C min−1 for NFR-SB-31.
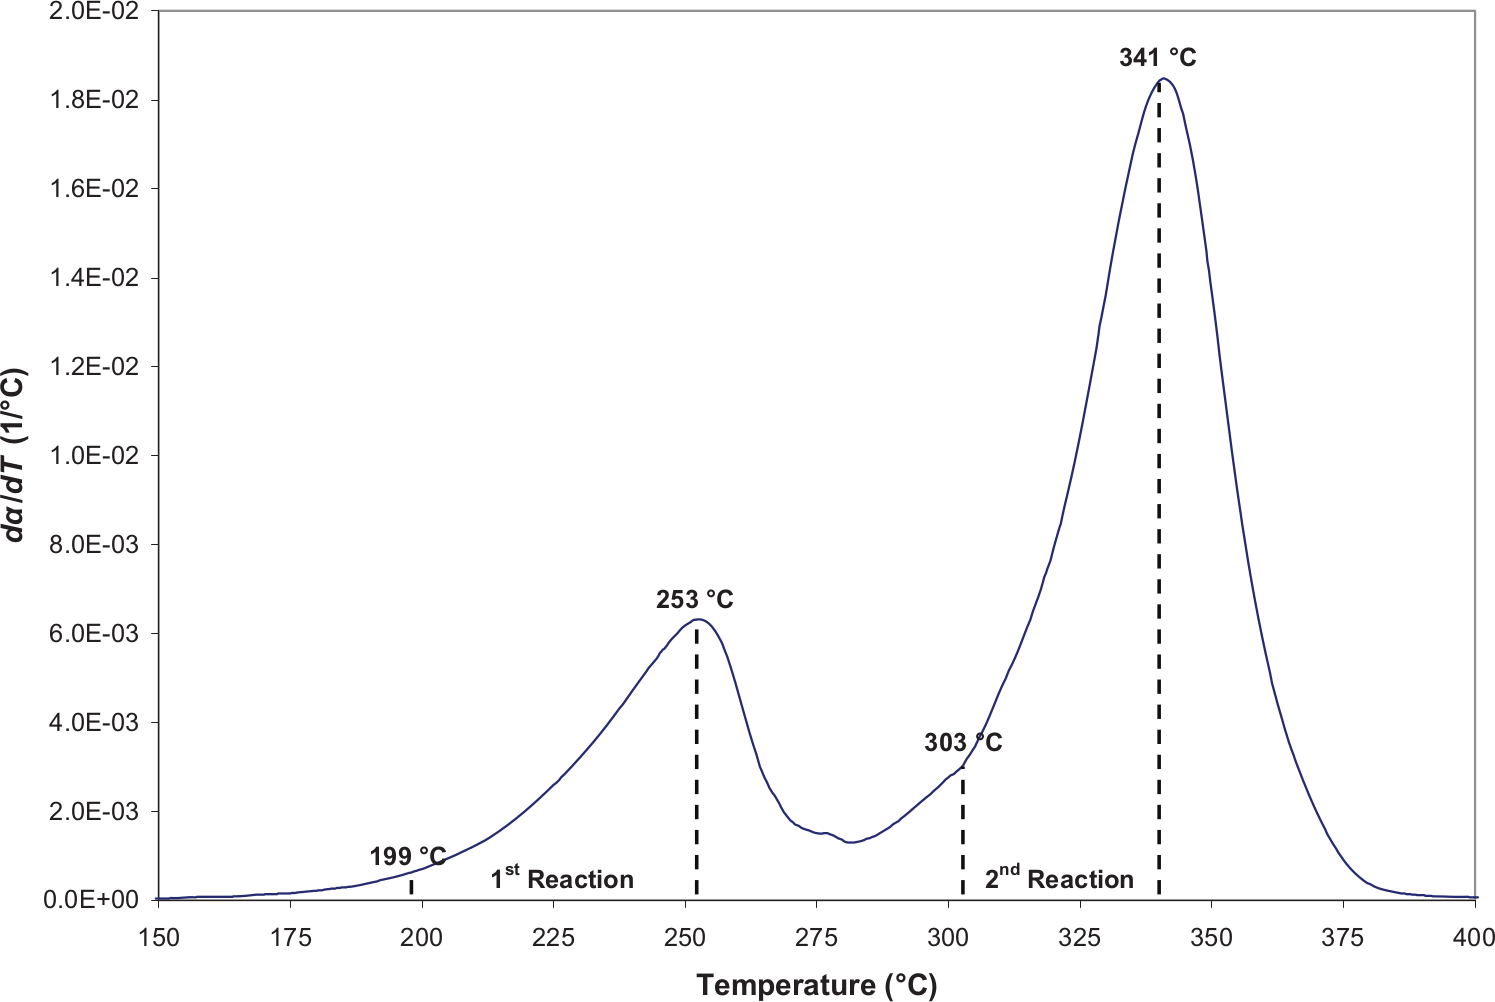
dα/dT versus temperature at 1 °C min−1, first repetition of NFR-SB-31.
Based on the analysis regions, ln(dα/dT) against [ln(1 − α)/Φ] − 1/T is plotted in Figure 10, and E/R is determined from the slope. With E/R of the two reactions found, n values are calculated using equation (19), and it is 7.92 and 1.07 for the first and second reactions, respectively.
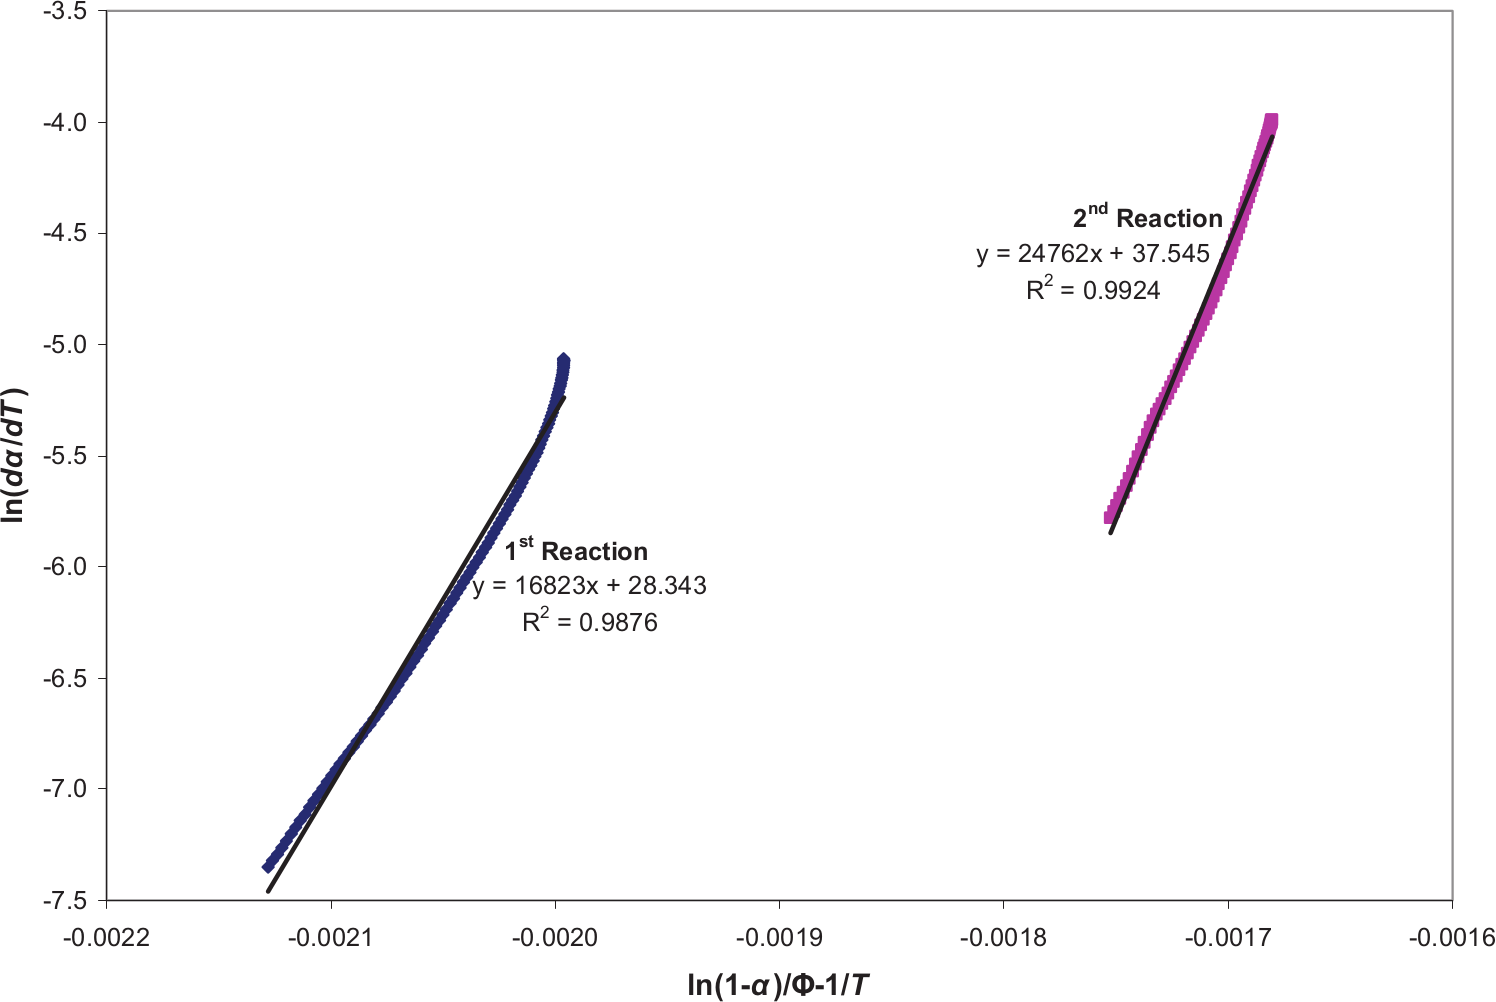
ln(dα/dt) versus [ln(1 −α)/Φ] − 1/T at 1 °C min−1, first repetition of NFR-SB-31.
Substituting n into equation (18), ln(k) is evaluated and plotted against 1/T, as shown in Figure 11. From the slope and y-intercept, E and A are evaluated. For the first reaction, E is 142 kJ mol−1 and A is 5.45 × 10¹⁰ s−1, while for the second reaction, E and A are 208 kJ mol−1 and 4.80 × 10¹⁴ s−1, respectively.
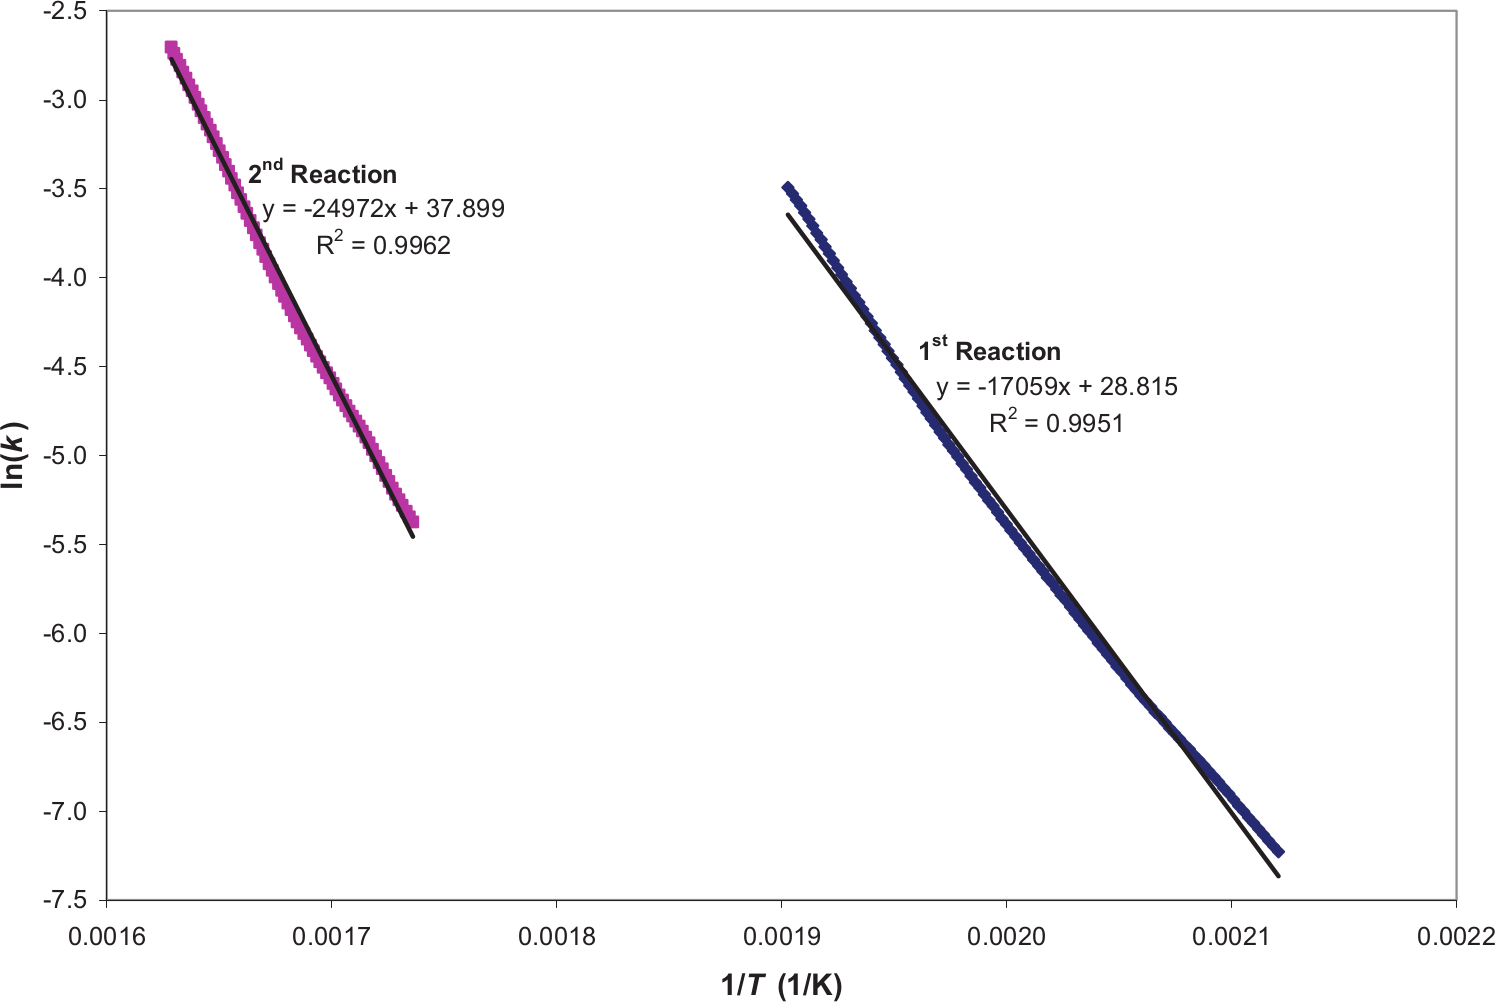
ln(k) versus 1/T at 1 °C min−1, first repetition of NFR-SB-31.
Normalisation of inflection point methods
The flexibility of the pyrolysis model in FDS 5 and Gpyro allows the user to design various schemes to represent the intended type of decomposition. Despite the varying schemes, the decomposition rate of each scheme is still solved using the same equations, equations (1) and (2). From all of the graphical techniques employed so far, the decomposition of polyurethane foam is represented by equation (11) where the decomposition rate is partially influenced by A and E within the temperature-dependent model, k, and also partially via n within the mass-dependent model, f(W/W0). Subsequently, the calculated kinetic properties are suited to the more complex schemes where the solid fuel forms fuel gas and also solid residue or have material components that are not reacting during decomposition.
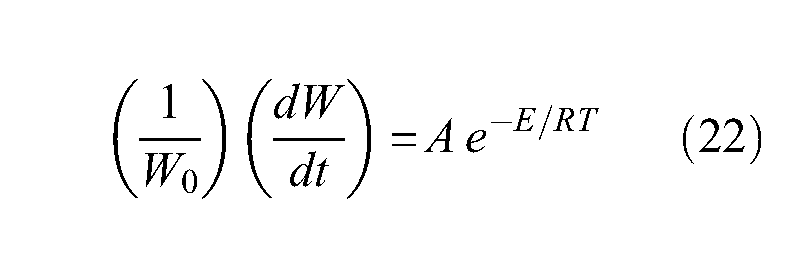
On the other hand, the simplest scheme involves the solid fuel completely converting into fuel gas causing the solid phase cells to shrink to maintain a constant solid density. Density preservation forces ρs,i/ρs0 in equation (1) to unity as ρs,i = ρs0 causing n to become a redundant parameter. Thus, equation (11) simplifies into equation (22) that becomes solely temperature dependent
In this case, E and A need to be reassessed to include the decomposition effect previously shared by n. To achieve this, an alternate form of the inflection point methods is employed where f(W/W0 ) is normalised by setting n = 0 for both reactions. This effectively brings f(W/W0 ) to unity, achieving the same effect as the density preservation in FDS 5 and Gpyro. Having n = 0 and once again utilising equation (18), ln(k) against 1/T is plotted in Figure 12 for NFR-SB-31.
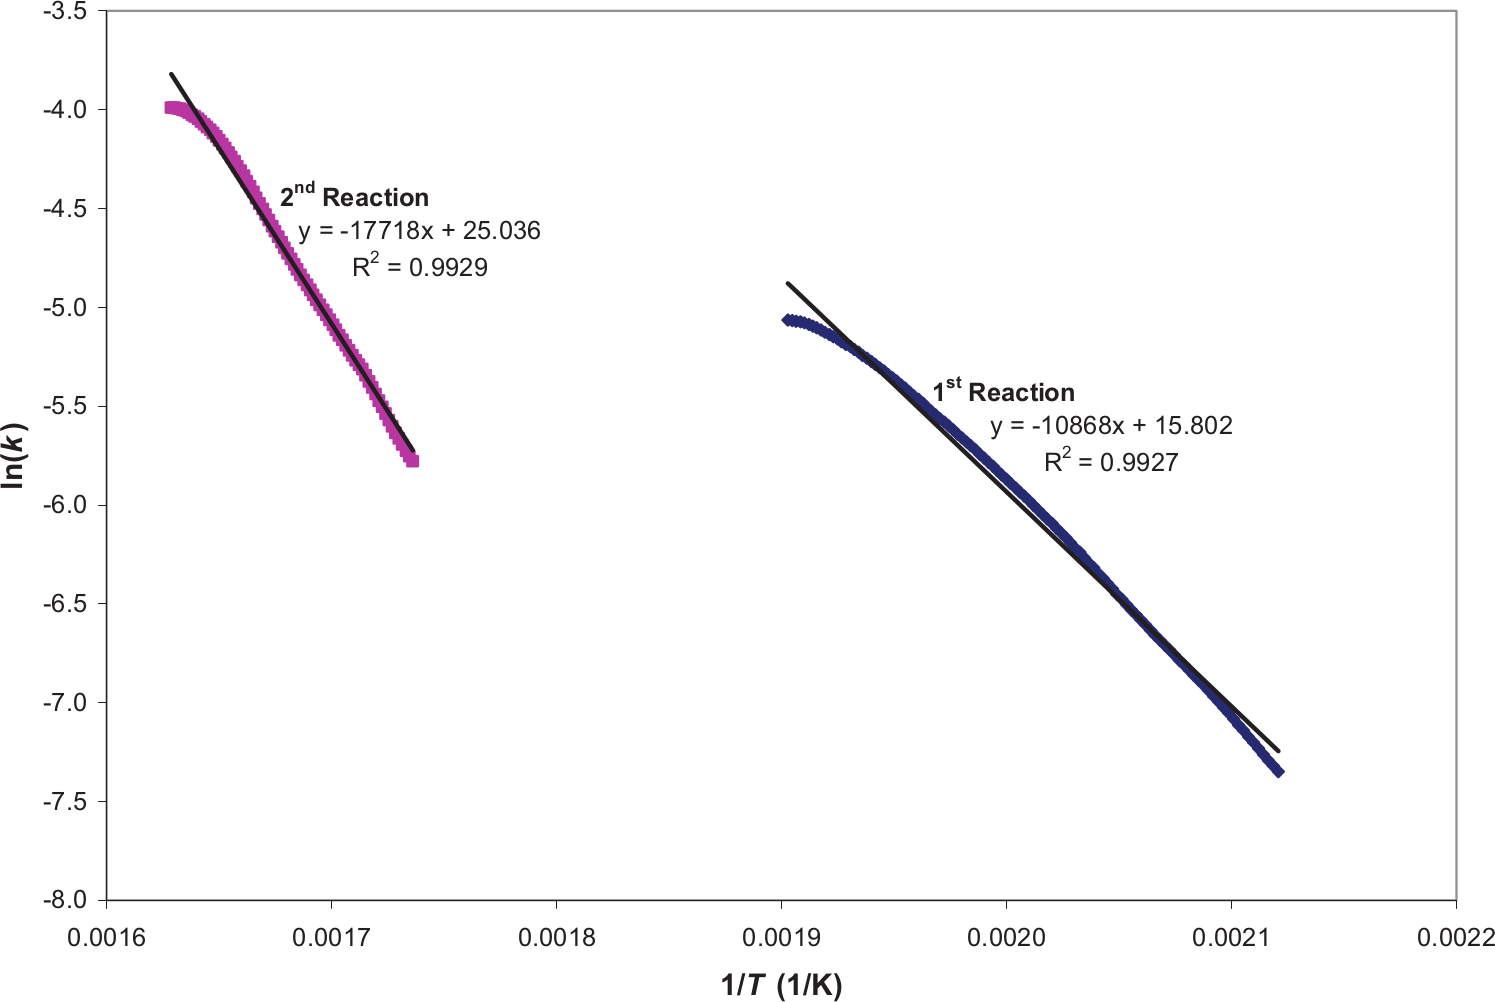
ln(k) versus 1/T at 1 °C min−1, first repetition of NFR-SB-31.
For the first repetition at 1 °C min−1, E and A for the first and second reactions are 90 kJ mol−1 and 1.21 × 10⁵ s−1 and 147 kJ mol−1 and 1.24 × 10⁹ s−1, respectively. Hence, besides the general compatibility of a graphical technique with a pyrolysis model, the intricate details of the decomposition schemes involved are also a crucial aspect affecting the kinetic properties calculated.
Kinetic properties of polyurethane foams
The kinetic properties, E, A and n, determined by each method and their trend with different heating rates are presented and discussed in this section. Figure 13 shows E of NFR-SB-31 for the three repeated experiments calculated using the Arrhenius plot method. For the repeatability study, the standard deviation as percentage of the average is included for each set of three repetitions. A larger spread is noted in the experiments with higher heating rates, 20 and 60 °C min−1. Over different heating rates, E of the second reaction is consistently higher than the first reaction, ranging between 209 and 292 kJ mol−1 compared to 142 and 186 kJ mol−1.
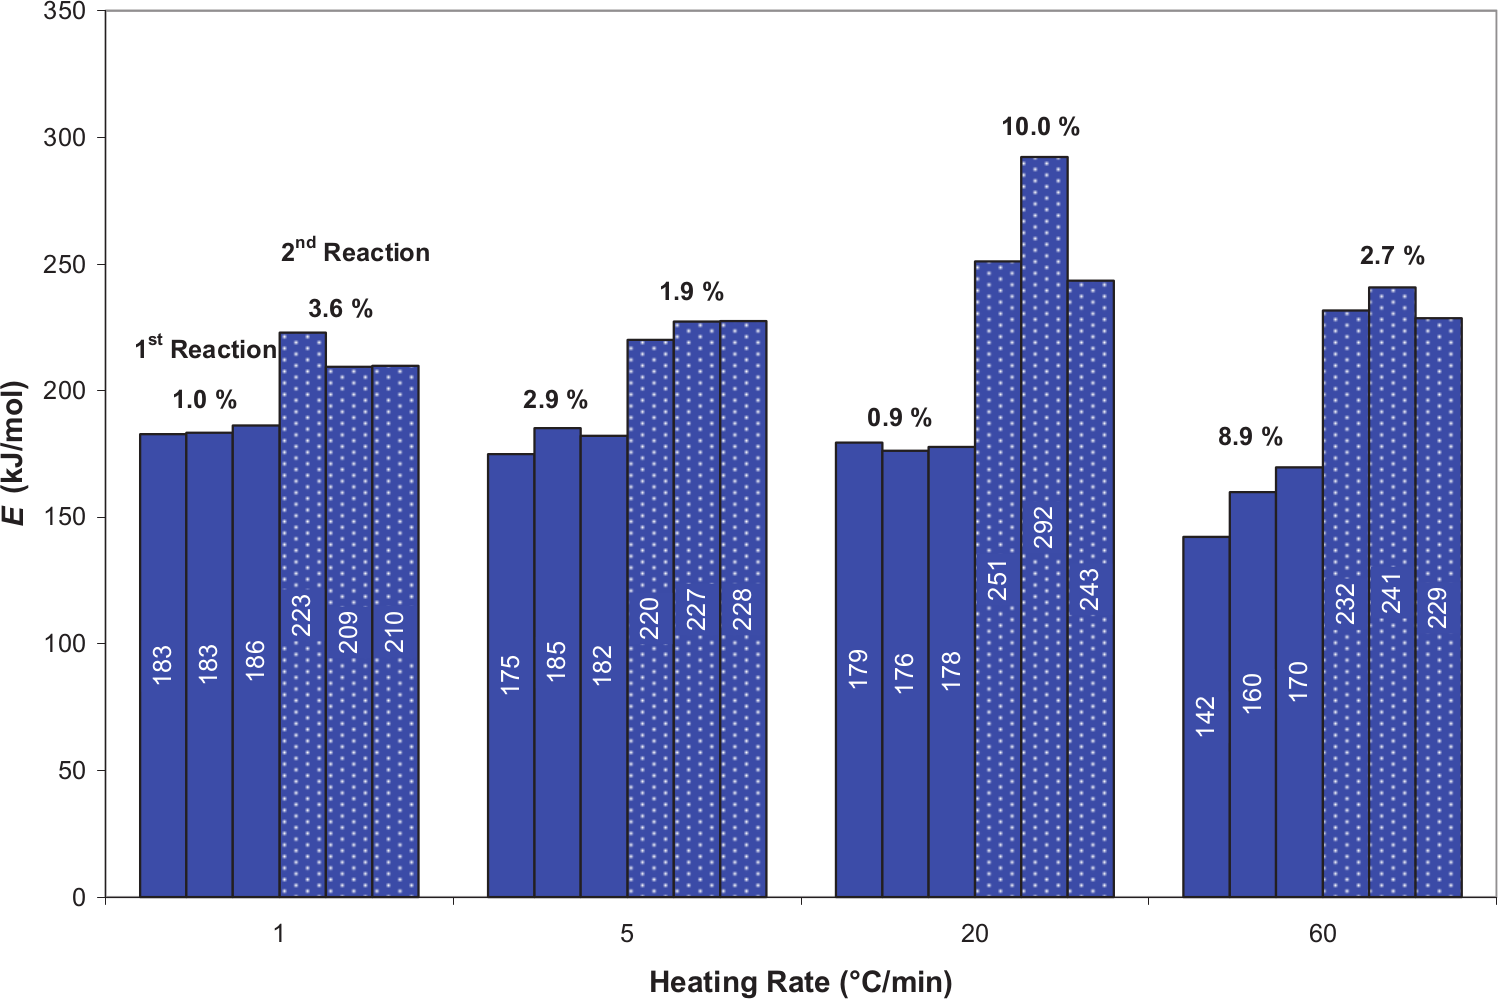
E of NFR-SB-31 from the Arrhenius plot method.
Since A relates to E through the natural logarithm, ln(A) of NFR-SB-31 from the Arrhenius plot method is shown in Figure 14. The trend and standard deviation of ln(A) are similar to those seen in E because within the Arrhenius equation, E and A function as a pair to model the temperature-dependent aspect of the decomposition. From all the graphical techniques used, E is determined from the slope of the relationship between the rate and temperature while A is found from its y-intercept. The TGA results also show a consistent decomposition behaviour over different heating rates; thus, in order to model this, any increase in E is matched by an appropriate increase in A. This trend is known as the kinetic compensation effect, and it is seen in all the parameters calculated. Since E and ln(A) share a similar trend, the subsequent discussions will focus solely on E.
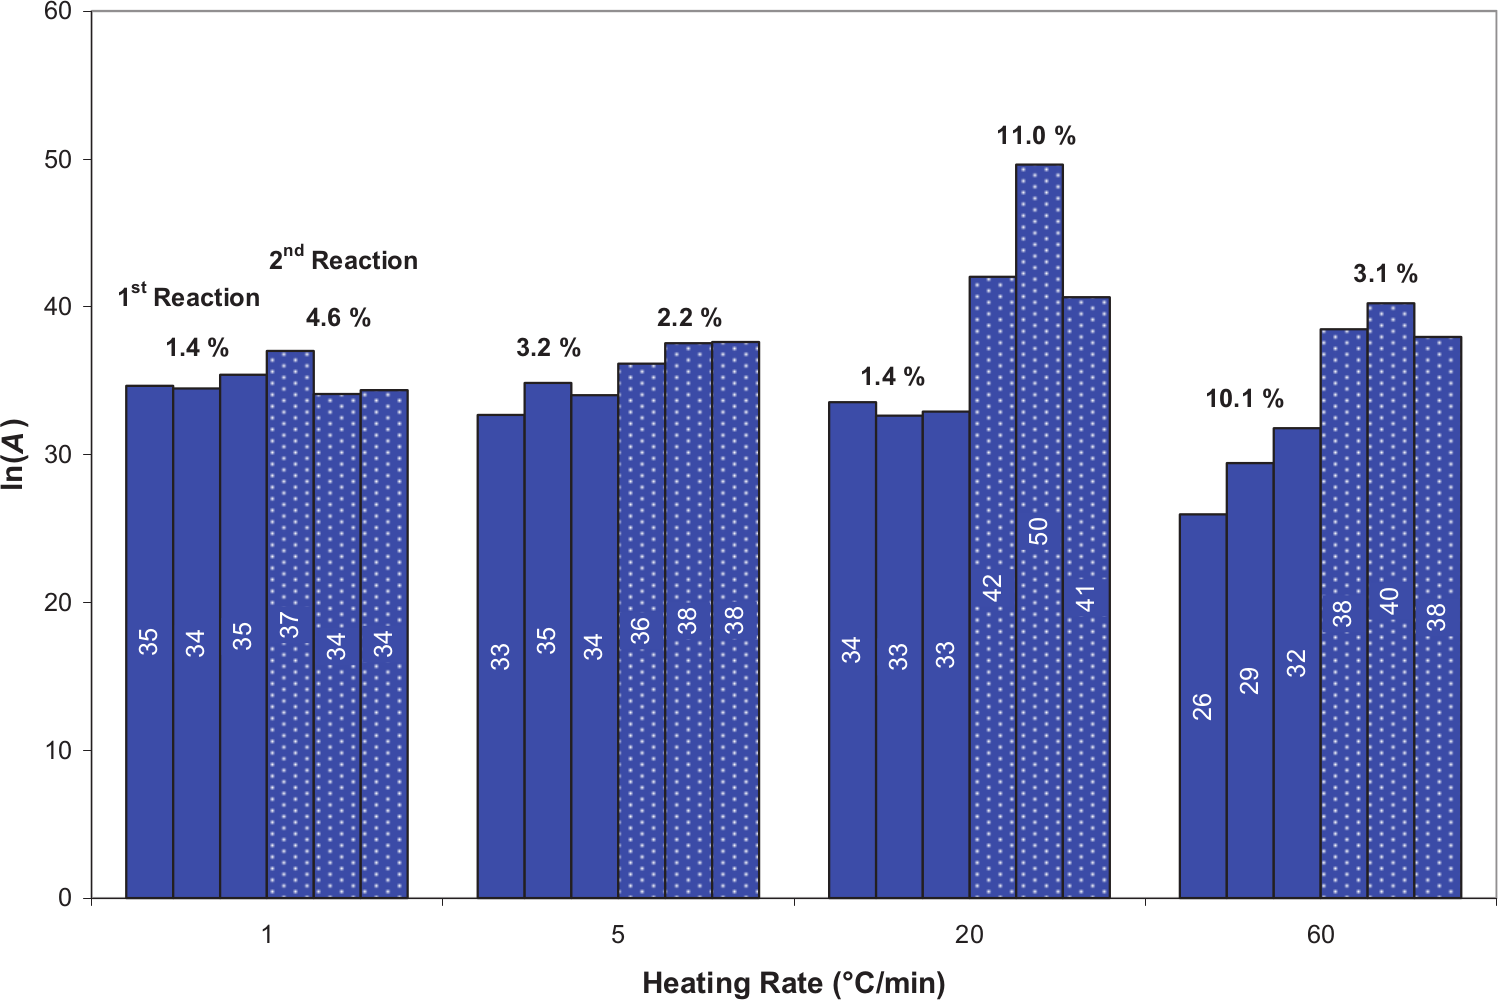
ln(A) of NFR-SB-31 from the Arrhenius plot method.
Figure 15 shows E of NFR-SB-31 determined using the inflection point methods, and they are different than those from the Arrhenius plot method. Nevertheless, the common trend where E of the second reaction is larger than the first reaction is still observed. The parameter has a greater deviation at the lowest and highest heating rates, 1 and 60 °C min−1, and also for the second reaction in comparison with the first reaction.
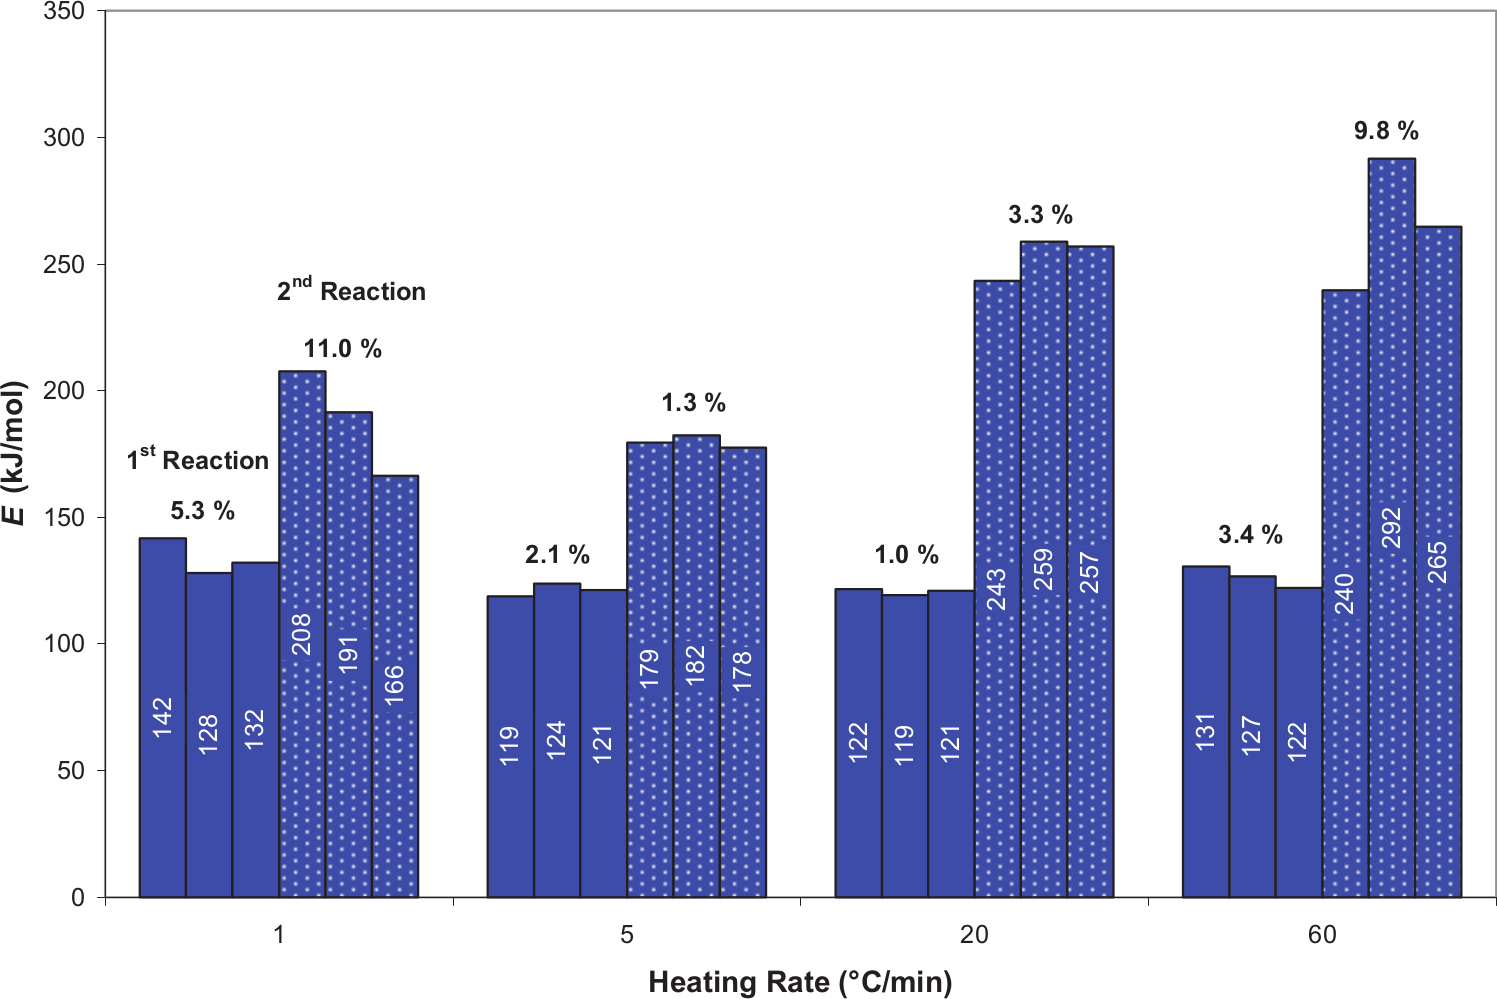
E of NFR-SB-31 from inflection point methods.
From Figure 16, the application of the inflection point methods with normalised kinetic model on the TGA results has the effect of reducing E and its spread while preserving a trend identical to that with nth order kinetic model.
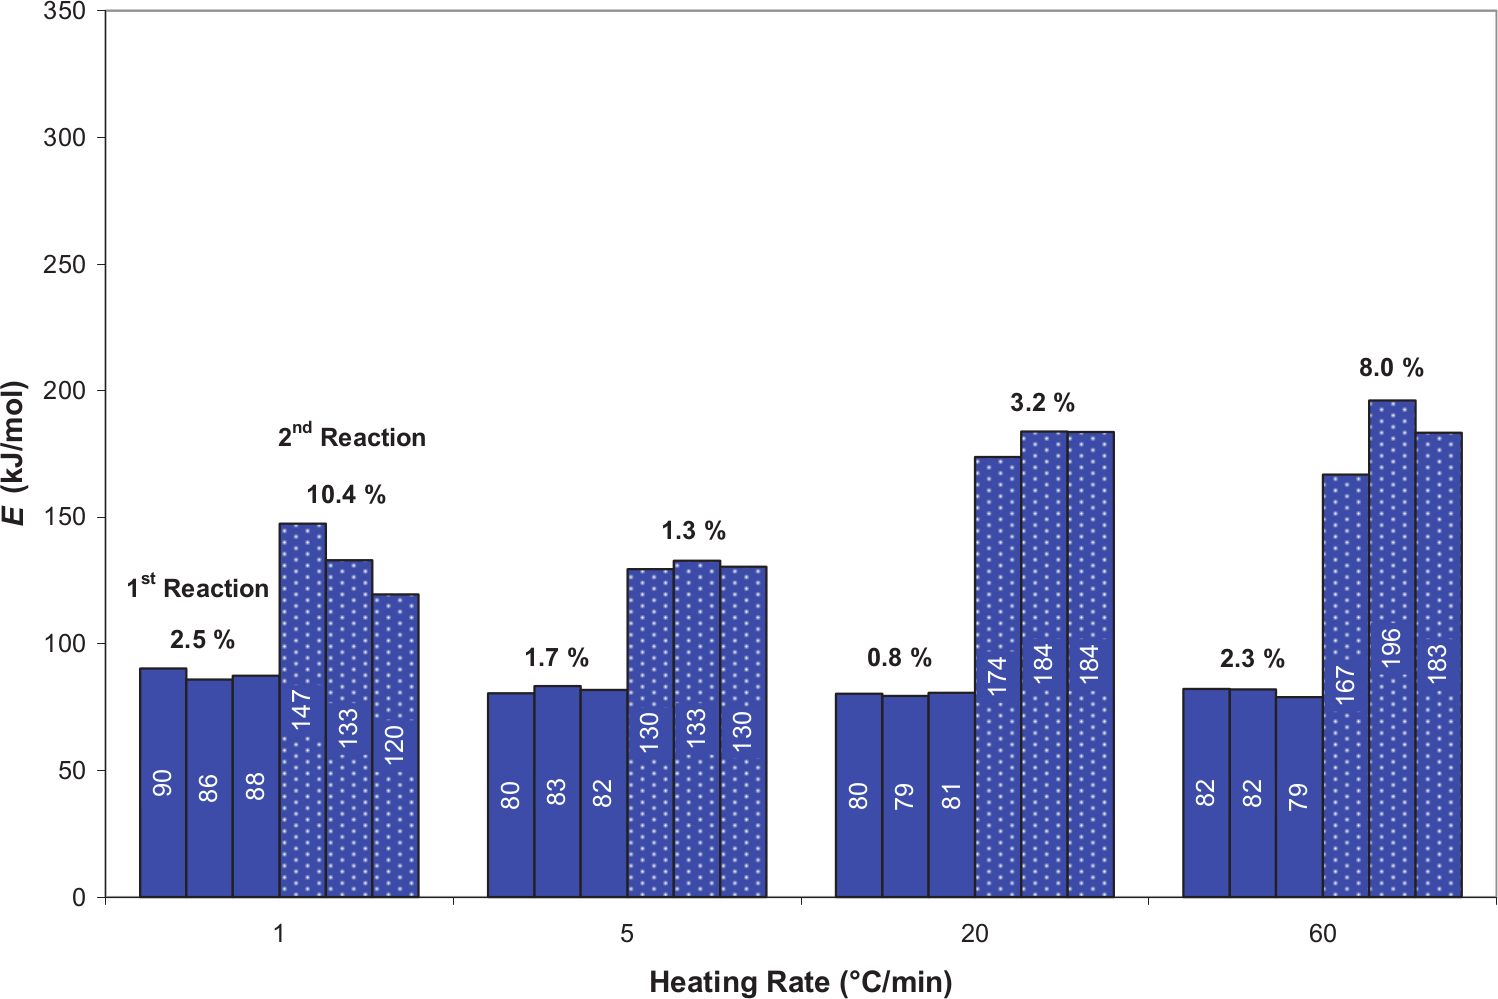
E of NFR-SB-31 from inflection point methods with normalised kinetic model.
Within the literature, the temperature-dependent aspect of decomposition has been frequently described using the Arrhenius equation but the mass-dependent aspect has been modelled by various types of kinetic model and the nth order model used is one of many. In this study, the inflection point methods calculate n for each experiment while kinetic analysis calculates the global n that is then applied in the Arrhenius plot method. Figure 17 shows n of NFR-SB-31 determined using the inflection point methods. At each heating rate, n from the first reaction is consistently greater than the second reaction, in the range of 6.09–8.13 compared with 0.89–1.45. According to the percentage deviation, the data spread appears greater at the lowest and highest heating rates, 1 and 60 °C min−1. In terms of absolute value, the deviation in the first reaction is greater than the second reaction.
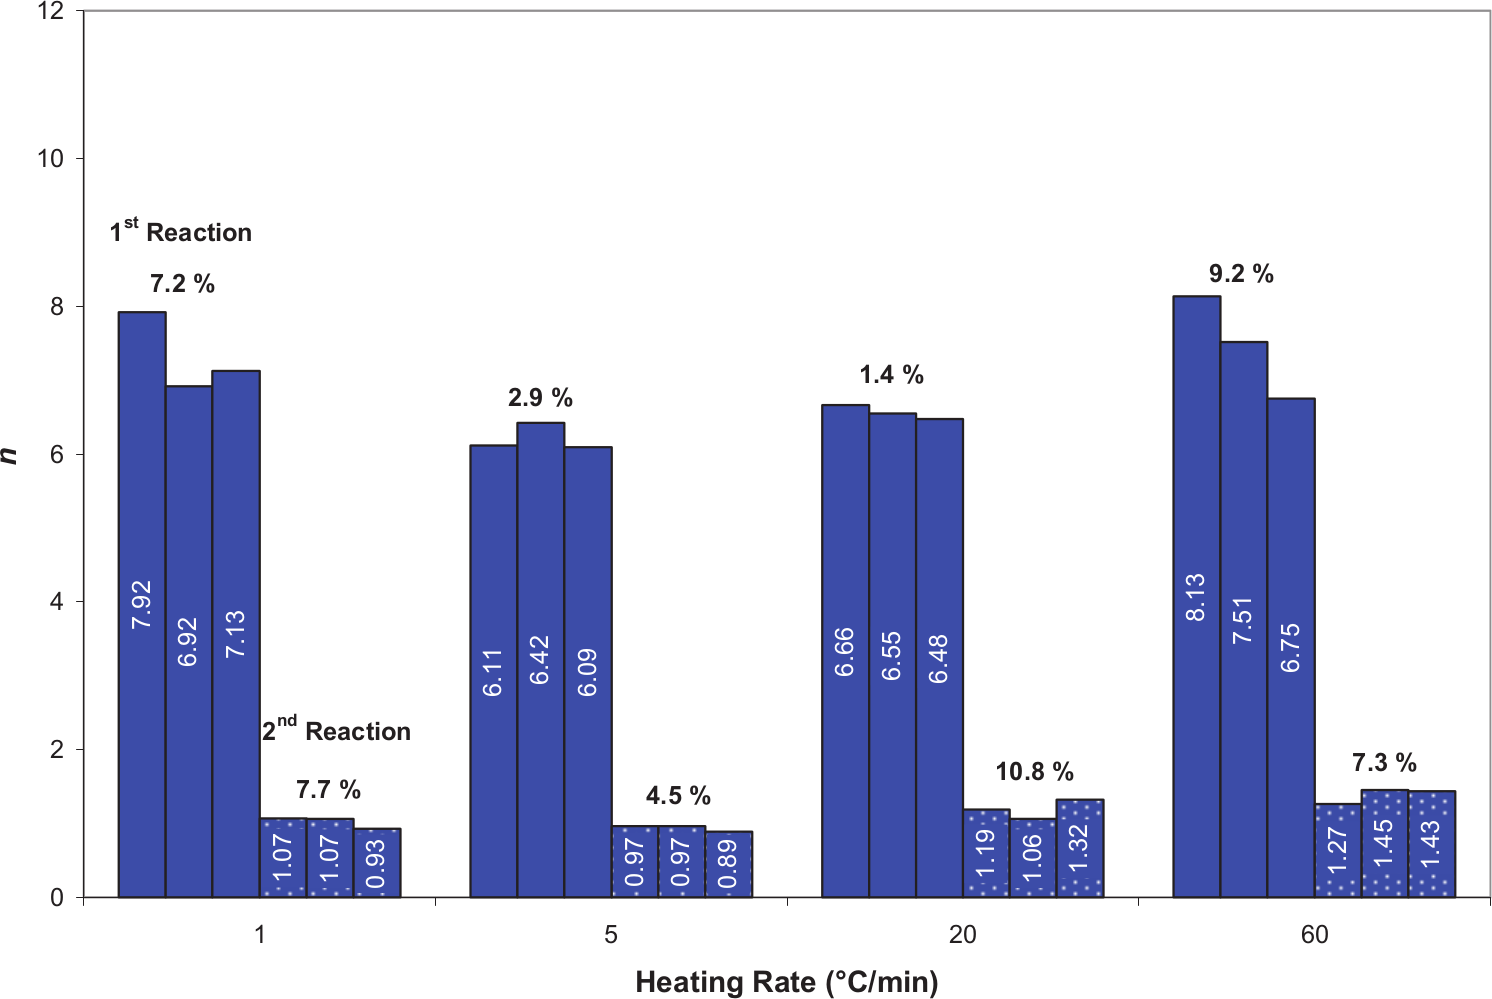
n of NFR-SB-31 from inflection point methods.
Thus far, the individual kinetic properties of NFR-SB-31 are presented, and since FR-Y-36 shows a similar trend, its individual results are not repeated. For the comparison between different graphical techniques, Figure 18 shows the average E of NFR-SB-31 and FR-Y-36 calculated by each approach. The reported values are taken as the average over 1, 5, 20 and 60 °C min−1. The values from the literature, reported by Chao and Wang, 2 on NFR and FR foams are also included in Figure 18, and the heating rates tested are 5, 10 and 20 °C min−1.
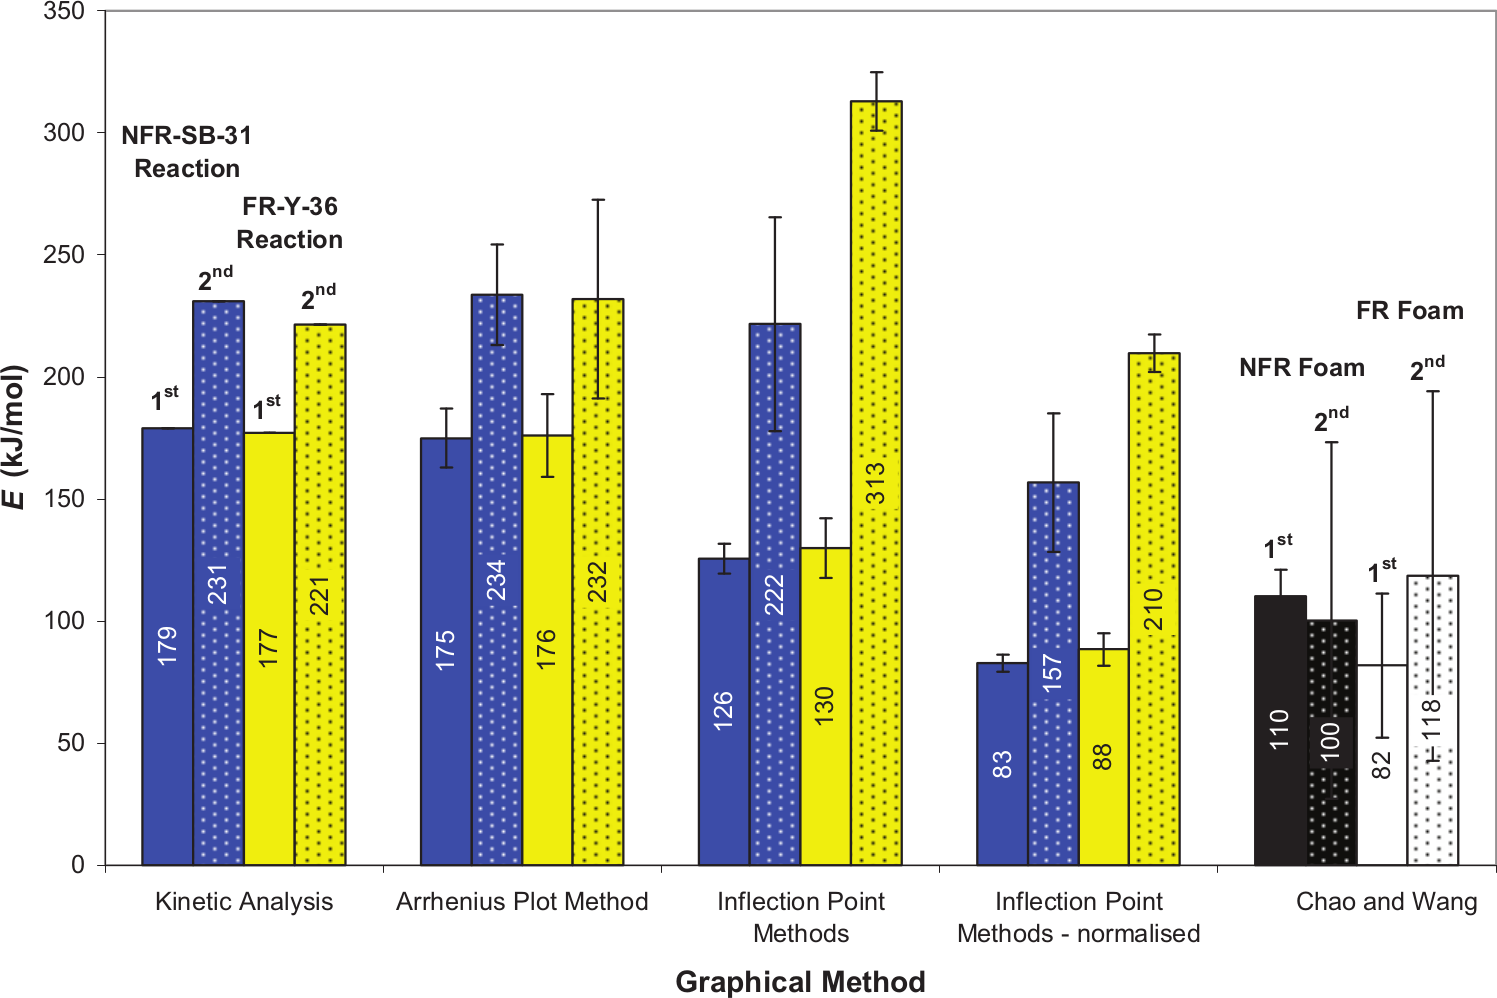
Comparison of average E of NFR-SB-31 and FR-Y-36 from different graphical techniques and values reported in the literature.
The global values from kinetic analysis fall within one standard deviation of the average values from the Arrhenius plot method as the latter utilises the global n and also the similar analysis regions as kinetic analysis when calculating the kinetic properties. Due to the difference in the calculation method applied and also in the region analysed, the values from the inflection point methods are different than those of kinetic analysis and the Arrhenius plot method. Nevertheless, these differences are similar to the variation reported by Matala et al. 28 in their assessment on the performance of different analytical methods for evaluating kinetic properties. Comparing between the original and normalised inflection point methods, the normalised version resulted in lower E. Despite the differences in value, the overall trend between both foams is consistent for the different graphical techniques considered whereby the second reaction has higher E. In terms of spread, the standard deviation indicates the second reaction has the greater variation with respect to the changes in heating rate.
The effort to make a thorough comparison with the kinetic properties within the literature is complicated by the different methodologies and different polyurethane foams used by different research. When compared with the E from Chao and Wang, 2 the trend observed is different where no distinct variation is noted between the E of the first and second reactions of Chao and Wang. The analysis in this research is performed over a wider range of heating rates from 1 to 60 °C min−1, while the heating rate in Chao and Wang ranges from 5 to 20 °C min−1. Despite having a greater range of heating rate, the deviation in E determined in this research is smaller.
The average ln(A) of NFR-SB-31 and FR-Y-36 calculated from all graphical techniques is plotted in Figure 19. Since E and A function as pairs, the average ln(A) shares a same trend as the average E in Figure 18. Again comparing with Chao and Wang, 2 a different trend in ln(A) is noted, and the deviation determined by Chao and Wang is greater compared to those found in this research.
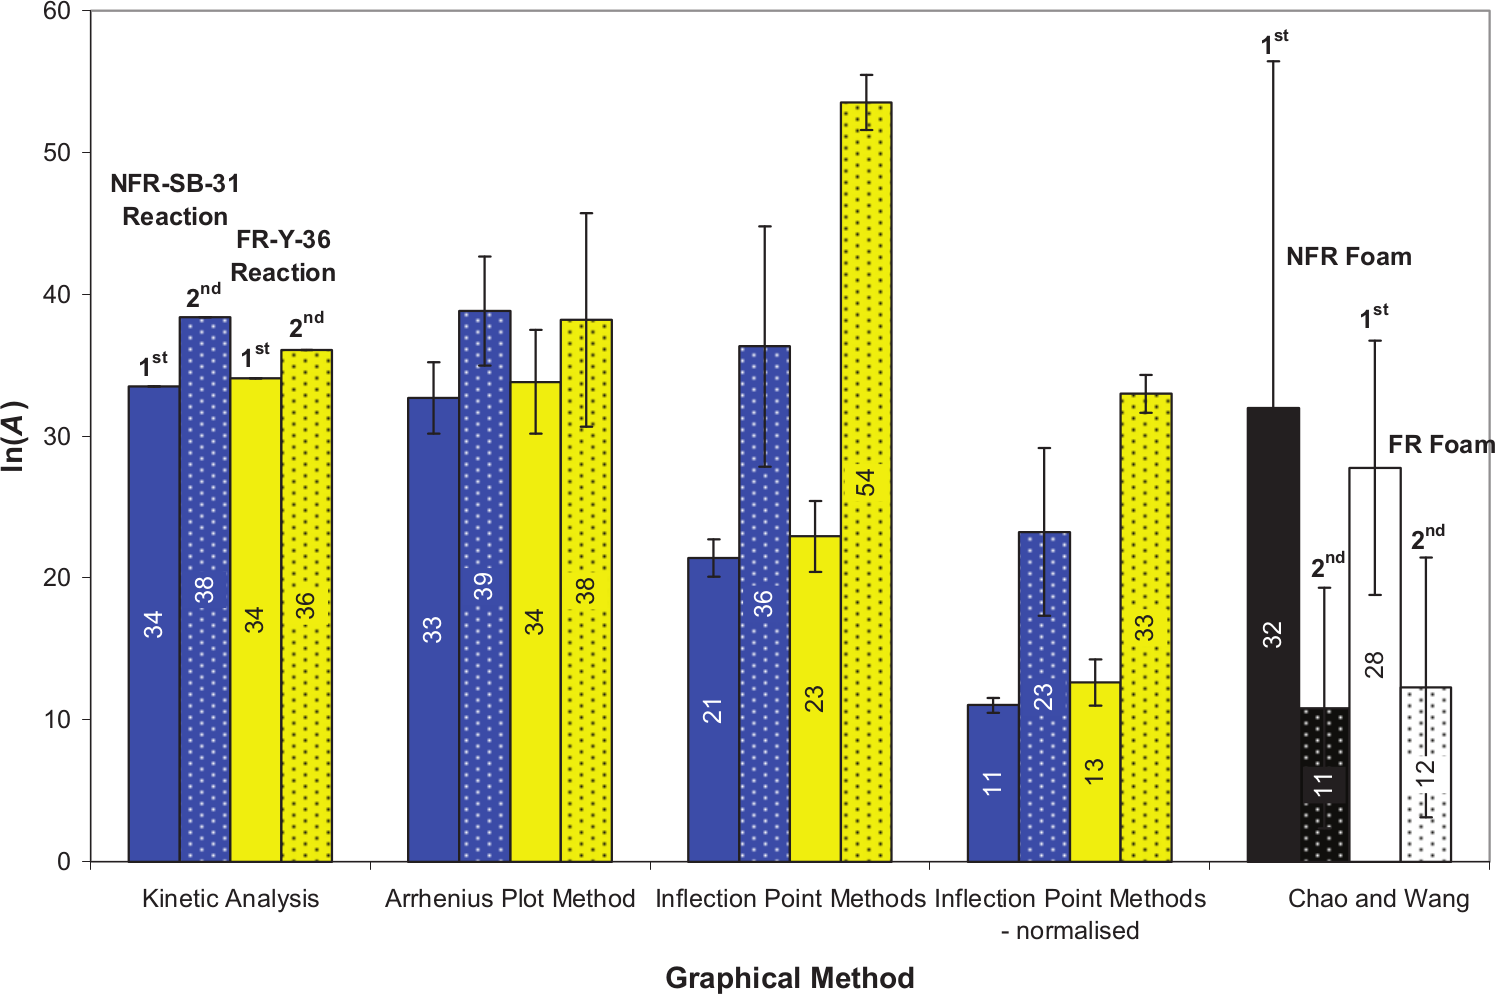
Comparison of average ln(A) of NFR-SB-31 and FR-Y-36 from different graphical techniques and values reported in the literature.
Figure 20 shows the global n from kinetic analysis and the average n from the inflection point methods. Although different values are obtained due to the application of different calculating methods, the trend between both methods remains identical where the first reaction has greater n. Over different heating rates, both foams show that the spread of value among the first reaction is greater than the second reaction. The magnitude and deviation of n obtained by Chao and Wang 2 are greater than those reported in this research. Previously, the trend of E and ln(A) from Chao and Wang differs from this research but for n, the trend is noted to be similar.
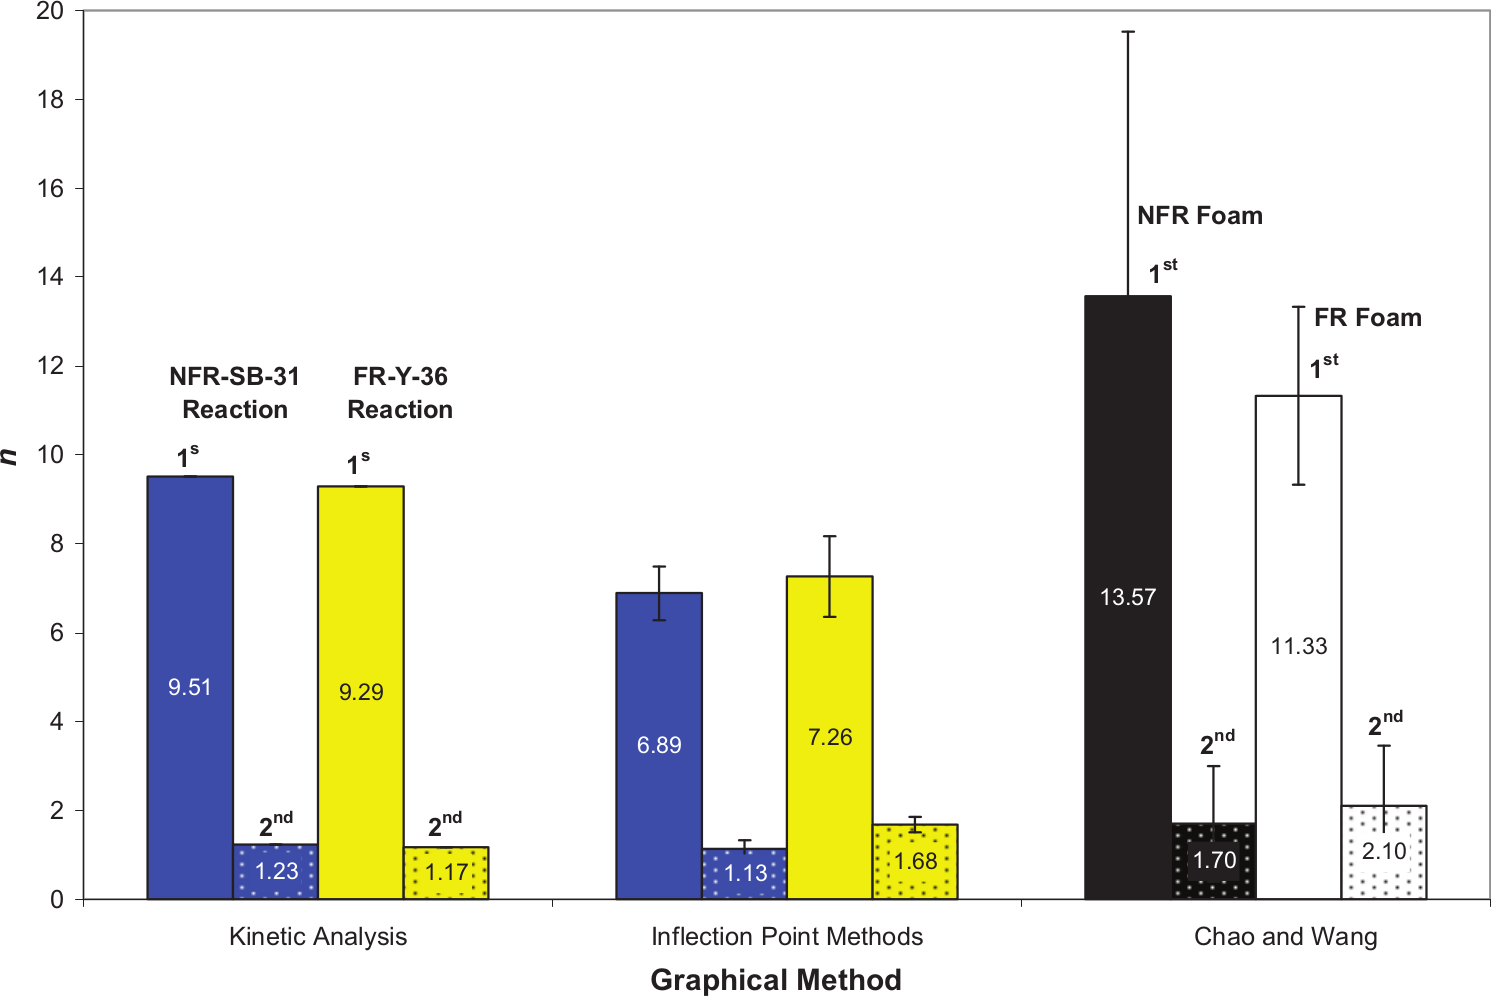
Comparison of average n of NFR-SB-31 and FR-Y-36 from different graphical techniques and values reported in the literature.
Table 4 provides a summary of the kinetic properties of the polyurethane foams calculated via the graphical techniques, as discussed previously. The different relationships involved in estimating these properties have shown correlations with an average R2 value ranging between 0.95 and 1.00. In Table 4, ‘HR’ denotes the heating rate used in degree Celsius per minute, and ‘Average’ denotes the average value over all heating rates and also the global value determined by kinetic analysis.
Kinetic properties of NFR-SB-31 and FR-Y-36 developed using graphical techniques
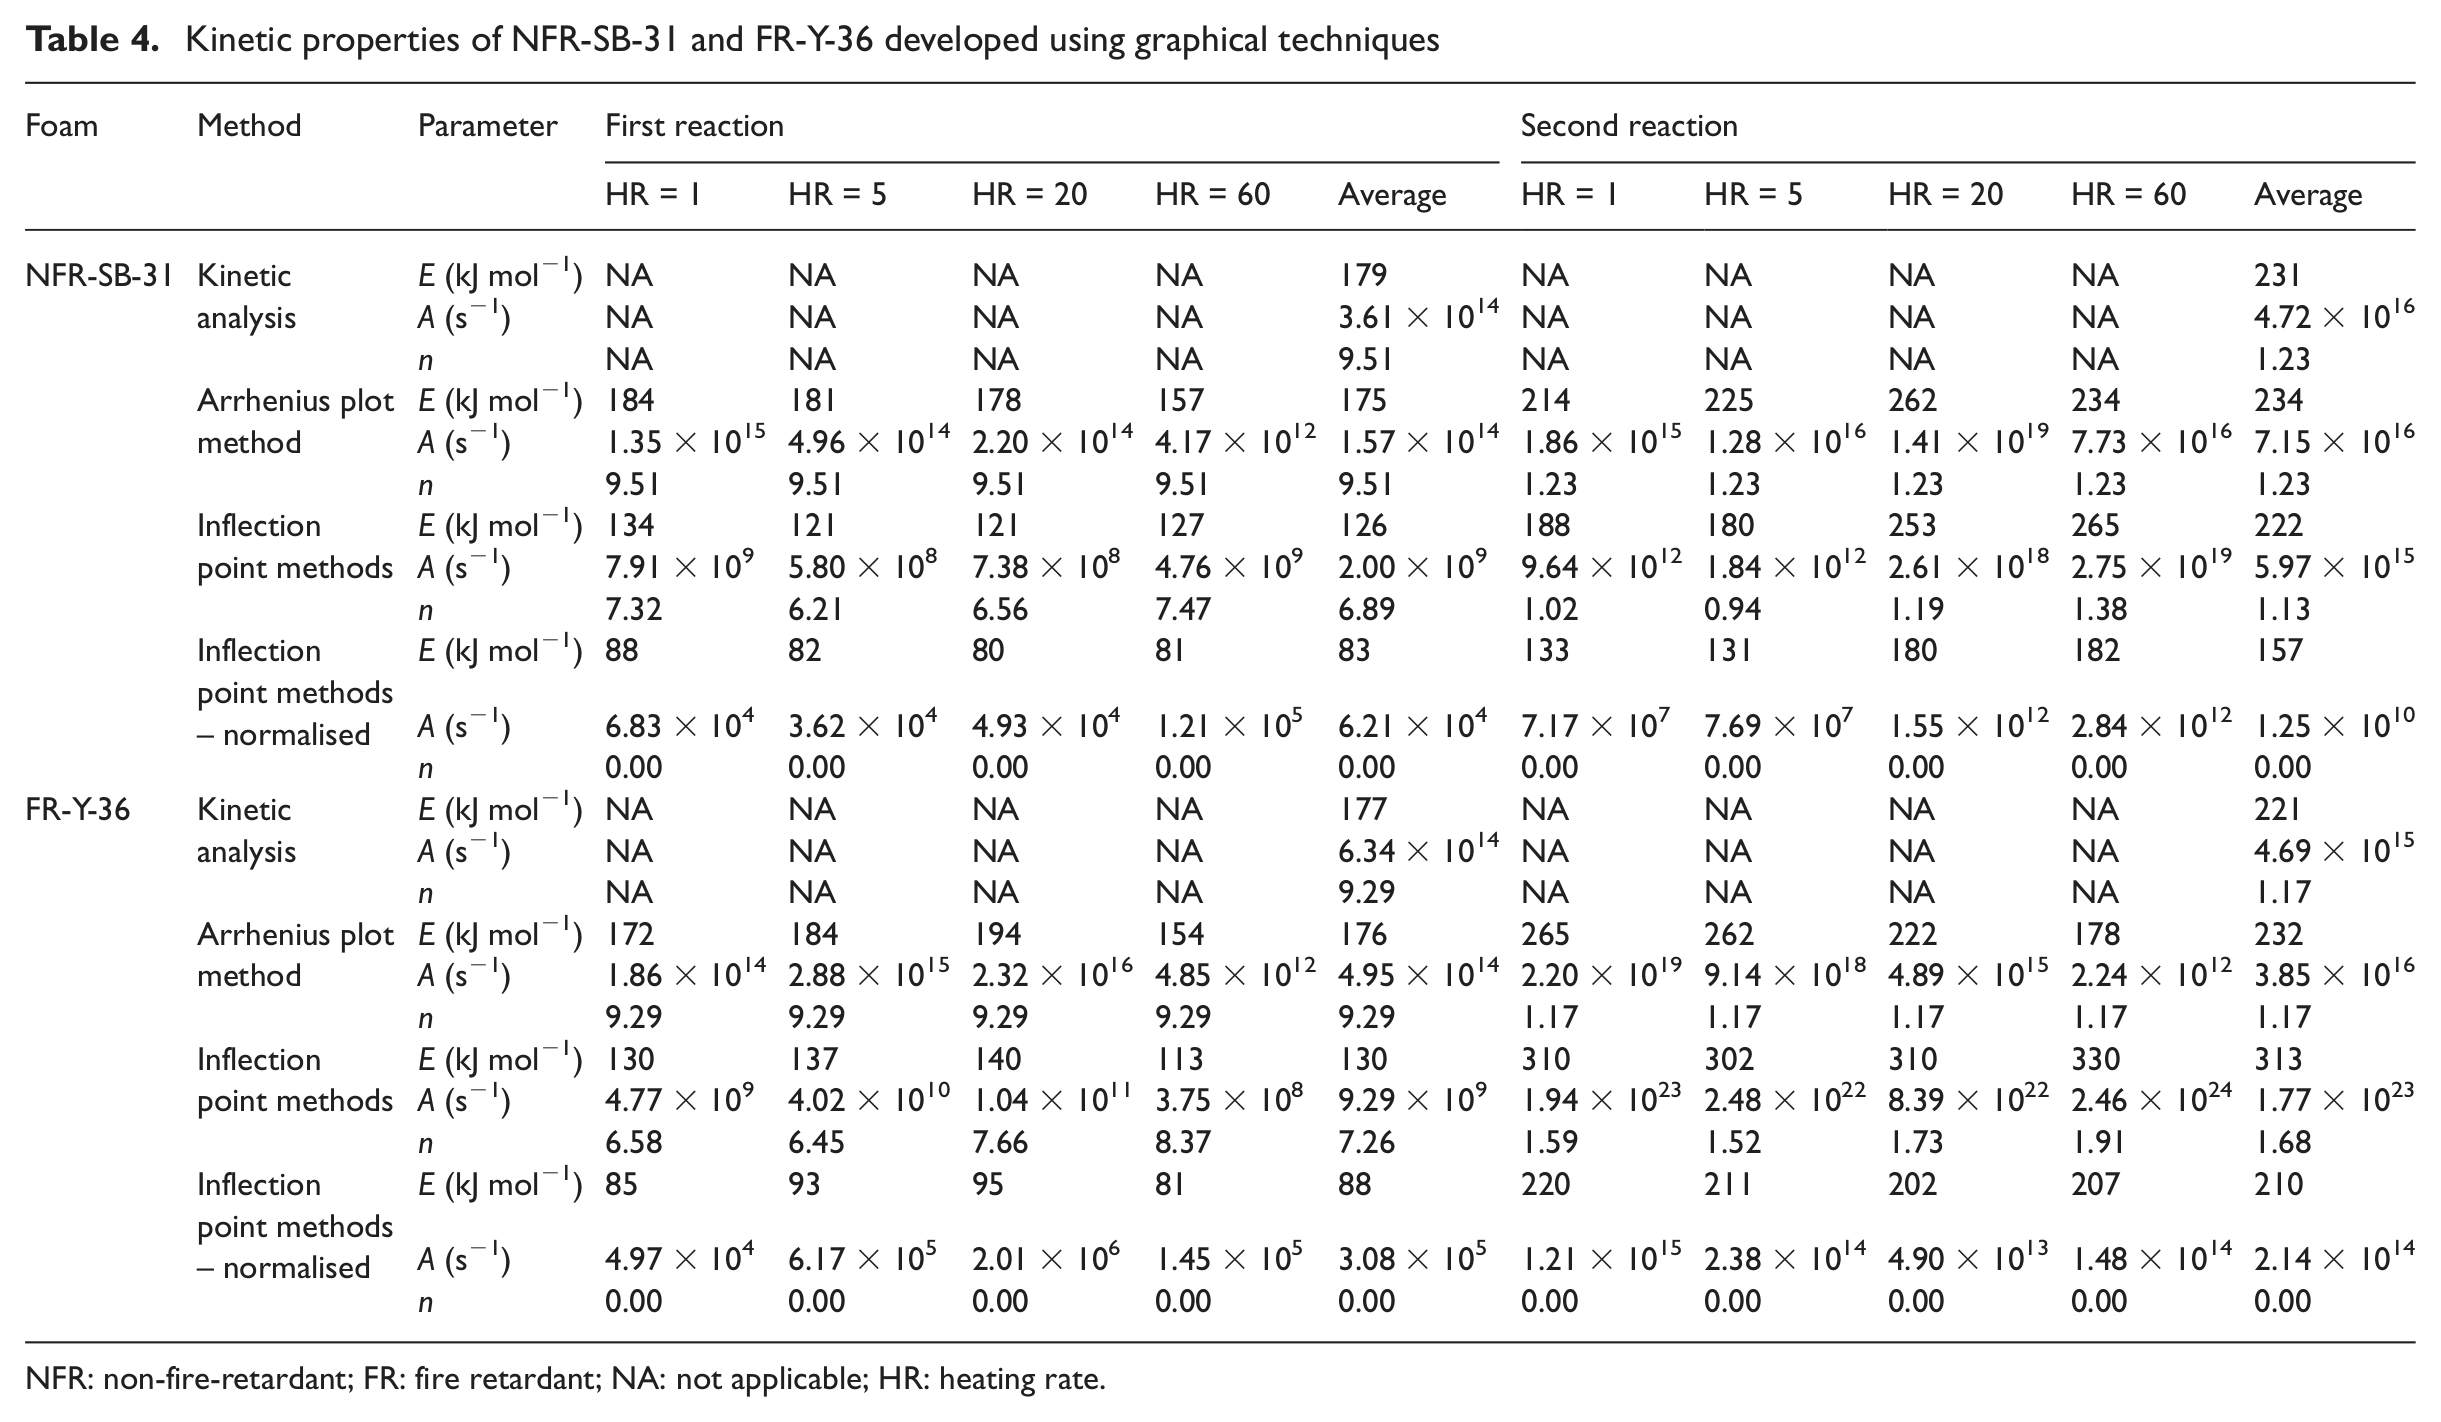
NFR: non-fire-retardant; FR: fire retardant; NA: not applicable; HR: heating rate.
The graphical techniques presented in this article are applicable to reactions that do not overlap. However, these methods will struggle to produce meaningful properties for the reactions that are not separable and have closely spaced peaks such as during foam decomposition in air where the additional oxidative reactions overlap with the pyrolysis reactions. In this case, the kinetic properties evaluated are expected to be different than those in nitrogen. Table 5 provides a short description regarding the type of kinetic properties, the selection of data points for analysis and the compatibility with pyrolysis model for each of the method described in this article.
Summary on the features of kinetic analysis, Arrhenius plot method and inflection point methods
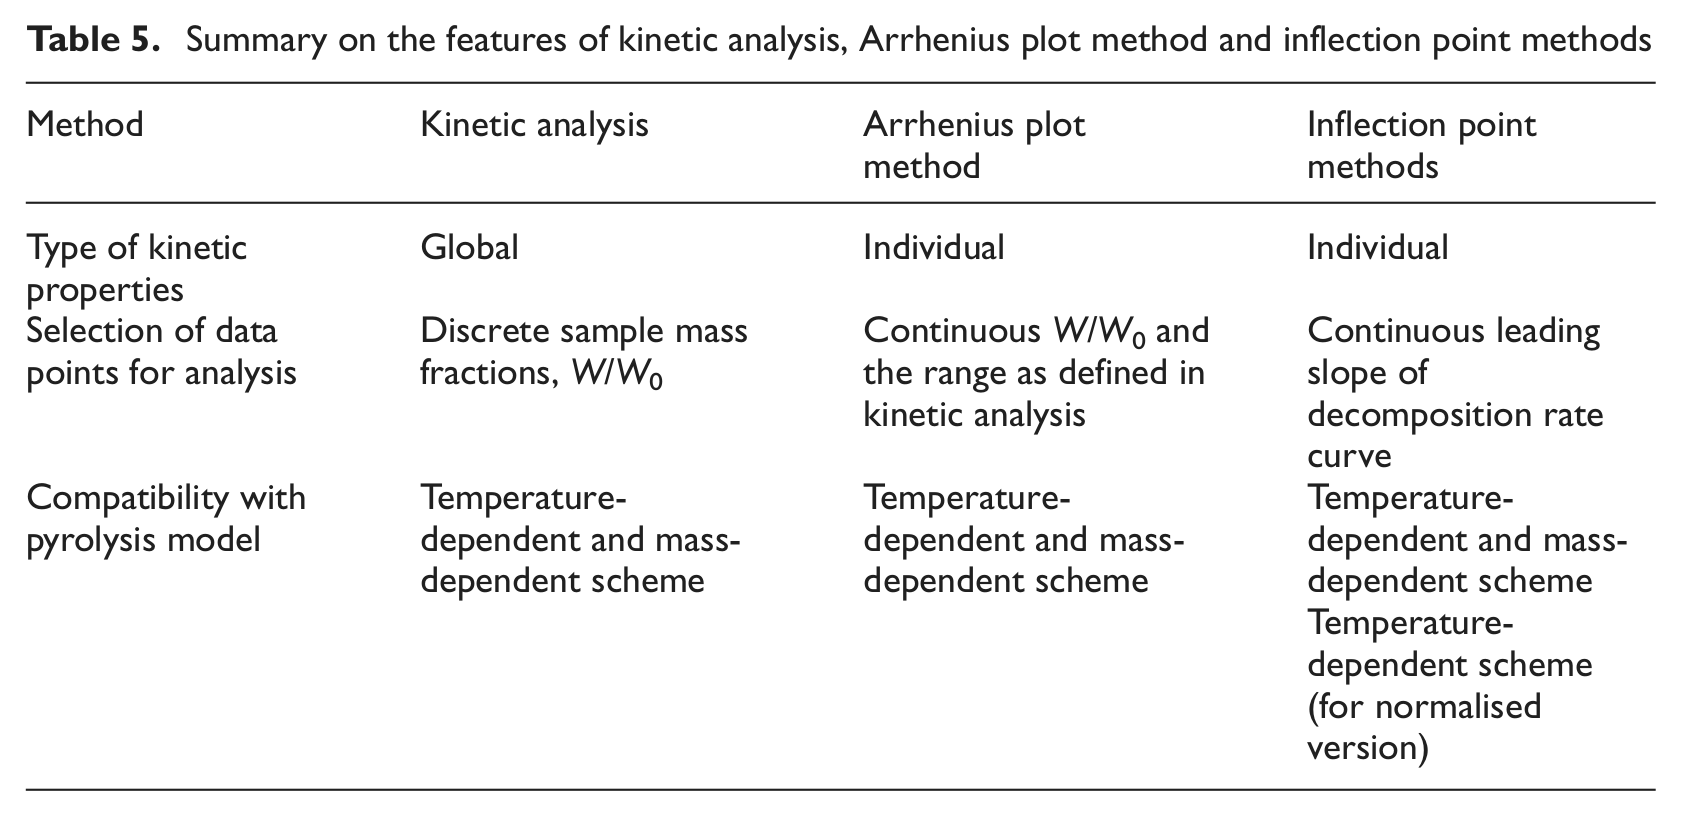
Kinetic analysis produces a set of global properties for the range of heating rates analysed while the Arrhenius plot method and the inflection point methods calculate properties for each experiment. Kinetic analysis utilises discrete W/W0 in terms of selecting data points for analysis. The Arrhenius plot method and the inflection point methods, on the other hand, use a continuous range of data points. The former uses continuous W/W0 which range is defined in kinetic analysis and the latter analyses the leading slope of the decomposition rate curve. As mentioned previously, the compatibility of the kinetic properties found depends on the pyrolysis model and the decomposition scheme selected. From the equations discussed, the properties from all three methods are suitable for the pyrolysis model that is both temperature and mass dependent. However, properties from the normalised version of the inflection point methods are more suited to the pyrolysis model that is temperature dependent only.
Conclusions
From the repeated TGA experiments of the NFR and FR polyurethane foams, the mass loss and mass loss per degree Celsius show good repeatability at heating rates from 1 to 60 °C min−1. Consistent with the literature, the results show that the foam decomposition under nitrogen environment occurs via two primary reactions with the second reaction consuming the majority of the fuel. Three graphical techniques compatible with the pyrolysis model in FDS 5 and Gpyro are used to estimate the kinetic properties governing the foam decomposition. These approaches are kinetic analysis, the Arrhenius plot method and the inflection point methods. The constants of the Arrhenius equation, E and A, are evaluated in all the methods while n is only calculated in kinetic analysis and the inflection point methods as the Arrhenius plot method uses the global n from kinetic analysis.
The flexibility of the pyrolysis model of FDS 5 and Gpyro allows the user to design various decomposition schemes. The kinetic properties evaluated from the original graphical techniques are suitable for the complex schemes. These schemes involve the production of fuel gas and also solid residue or have non-reacting material components during the decomposition. However, the simplest scheme involves the solid fuel converting entirely into fuel gas, and this causes n to become a redundant kinetic parameter. From the perspective of developing kinetic properties, this simplifies the original inflection point methods where the mass-dependent kinetic model is normalised by setting n = 0. In this normalised version, the decomposition rate becomes solely temperature dependent. Therefore, despite achieving the compatibility between the graphical techniques and the pyrolysis model, the suitability of the calculated kinetic properties also depends on the type of decomposition schemes adopted within the pyrolysis model. Further research will address the suitability of these properties via their application in the FDS 5 pyrolysis model.
The calculated kinetic properties for each experiment under the same method are repeatable but the deviation has been observed to increase especially at the two extreme heating rates of 1 and 60 °C min−1 used in this research and also for the properties with greater magnitude; for instance, E of the second reaction with a greater magnitude has larger deviation than E of the first reaction with a smaller magnitude. When the different methods are used, the calculated parameters are noted to be different. However, the general trend for the first and second reactions is consistent among all methods, whereby E and A of the first reaction are 10%–60% smaller in magnitude than the second reaction and n of the first reaction has magnitude between 400% and 800% greater than the second reaction. Comparing with the literature, the kinetic properties developed for polyurethane foam in this research show better consistency and have smaller deviation over a greater range of heating rates tested. Future research will utilise the range of kinetic properties found as the search boundaries of Gpyro’s genetic algorithm in finding the optimal inputs for FDS 5 modelling.
Footnotes
Appendix 1
Funding
This research received no specific grant from any funding agency in the public, commercial or not-for-profit sectors.