
Abstract
Heat transfer and smoke flow filling progress in a super-high atrium is studied in this article. The influences of heat release rate and fire source height were considered. It was found that the fire smoke layer could not reach the top of the atrium when the heat release rate was very low and the fire source was located at the bottom of the atrium. The temperature of smoke layer interface and ΔTmax were linearly positively related to Q2/3, while ΔPmax was quadratically positively related to Q2/3. At the top of the atrium, the temperature rise and fire source height were consistent with the Boltzmann model. As the fire smoke rose with a velocity, a relatively low-pressure area was generated below. The pressure variation in this area was negatively index-related to the fire source height.
Introduction
Atriums are normal structures in modern high-rise buildings, which usually have very large volumes and contain large amounts of materials and people. If a fire breaks out in a building with an atrium, it may cause great damage and casualties. The atrium has been studied by a number of researchers, and many of them were focused on the filling progress of smoke during a fire. Cooper et al. 1 described an experimental study of the dynamics of smoke filling in realistic, full-scale, multiroom fire scenarios. The temperature data of the longitudinal temperature field in an atrium were measured. A layer interface was identified and its position as a function of time was determined through the n-percentage rule to calculate the temperature of the fire smoke layer interface, and the height of the interface was calculated through the interpolation calculation method. Chow and Wong 2 surveyed general shapes of atrium buildings and the atriums were classified into three types: cubic, flat, and high. They had done a lot of work in a full-scale atrium; they simulated and compared the smoke filling process in the three types of atriums; 3 studied natural smoke filling and measured transient mass of the burning fuel, vertical temperature distributions, descending time of the smoke layer and the smoke layer interface heights;4,5 and proposed a time constant to specify the smoke filling time. 6 The results in the full-scale atrium were compared with those predicted by the zone model, and was found to give quite an accurate prediction on smoke filling during most of the burning period. 7 R. Huo et al. 8 studied natural smoke filling in an atrium experimentally through burning tests. Two plume models for smoke spilling out of a shop fire inside an atrium were proposed and assessed. An equation on studying the smoke layer interface height with a two-layer approach was derived. C.L. Shi et al. 9 reported an investigation on the scenarios of the spill plume and the resultant natural filling in an atrium mock-up due to a retail shop fire. It was found that a typical spill plume contains three regimes: the curved section out of the retail shop door, the line plume in the near field, and the axisymmetric plume in the far field. Predictions from the proposed empirical model for the spill plume and the resultant improved zone model compared favorably with the experiments. C. Gutiérrez-Montes et al. 10 studied the fluid dynamics of the make-up air at the vents in the case of an atrium fire, its influence on the fire-induced conditions, and the necessity of properly modeling it to obtain a reliable numerical prediction. In sum, these studies were focused on cases in which the fire source had a fixed heat release rate (HRR) and the fire source was located at the bottom of atriums. The influence of fire source characteristics (HRR, height) on fire smoke filling progress and distributions in atriums was not considered.
On the other hand, atriums were usually studied as shafts which have a similar structure. A number of numerical11–15 and experimental16,17 models have been developed to describe the thermal behavior of fire smoke in shafts. In shafts, stack effect18–23 is an important factor that drives the fire smoke movement, which has been investigated extensively in studies. Yanqiu Chen et al. 24 studied the temperature distribution in ventilation vertical shafts. WX Shi et al. 25 studied the influence of stack effect on fire spread in the compartment adjacent to a stairwell; they found that the velocity of air flow into the fire room was proportional to 1/3 power of HRR. Natural smoke filling process and spill plume development in shafts were also predicted. Tanaka et al. 26 analyzed fire smoke natural filling process through small-scale experiments in an exponential growth fire, and put forward a formula to describe the change in the smoke layer height inside the shaft. Marshall 27 analyzed the air entrainment characteristics in the lower part of the shaft, and established an air entrainment model based on experiments. This model summarized the characteristics of the free plume and the entrainment plume on both sides in the literature, and improved the smoke plume entrainment coefficient in the shaft according to experiments. However, the influence of locations of the fire source on pressure distributions and temperature distributions in shafts was not investigated in these studies. In reality, fire cases when the fire source is located beyond the bottom of the shaft are very normal. Hadjisophocleous et al. 28 described fire smoke movements in a 10-story building in both experimental and numerical models through temperature and O2,CO2, and CO concentrations. In sum, some of these studies have considered the influence of HRR on smoke movement in vertical shafts. However, the influence of fire source height has not been studied.
Very few works have considered the influence of the height of the fire source in atrium fires. In order to conduct a comprehensive analysis on the influence of the fire source characteristics on the fire smoke movement in atriums, this study investigated the heat transfer and smoke flow filling progress in a super-high atrium under different HRR and fire source locations. First, experiments were conducted on a small-scale platform under different HRR and fire source heights. Temperatures in the atrium were measured. Then, simulations were calculated in a full-scale numerical model. Pressure in the atrium was calculated. Through experimental data and numerical results, temperature distributions under different HRR were analyzed and the height of the smoke layer interface was calculated. In addition, pressure distributions were compared. Through the temperature distributions and pressure distributions under different HRR, the influence of HRR on the fire smoke movement was analyzed. Similarly, the influence of the fire source location was analyzed as well through the HRR variation, temperature distributions, and pressure distributions.
Research method
Experiment setting
A 1/10 scale super-high atrium platform was built based on an actual 117.0 m high atrium building. The whole platform was built with steel except the front face which was built with fire proof glass. The front view of the platform is shown in Figure 1, and the structure diagram of the platform is shown in Figure 2. This platform has 24 floors and it is 11.7 m high, 4.12 m wide, and 4.12 m long. The height of each floor is listed in Table 1. An atrium is in the center of the platform, which vertically connects floors 1–24. The first floor is a large hall. In the top center of the atrium on the platform, there is an exhaust fan (0.35 0.35 m2) installed. The influence of ventilation was not considered in this study, and the exhaust fan was not put on during all the experiments.
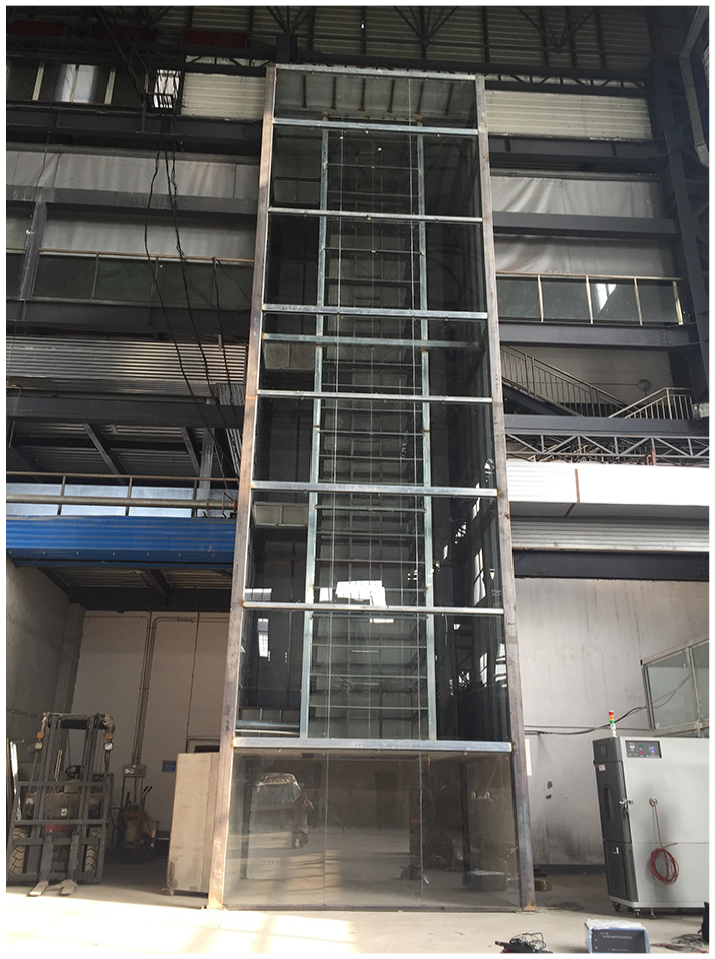
Front face of the scaled experiment atrium platform.
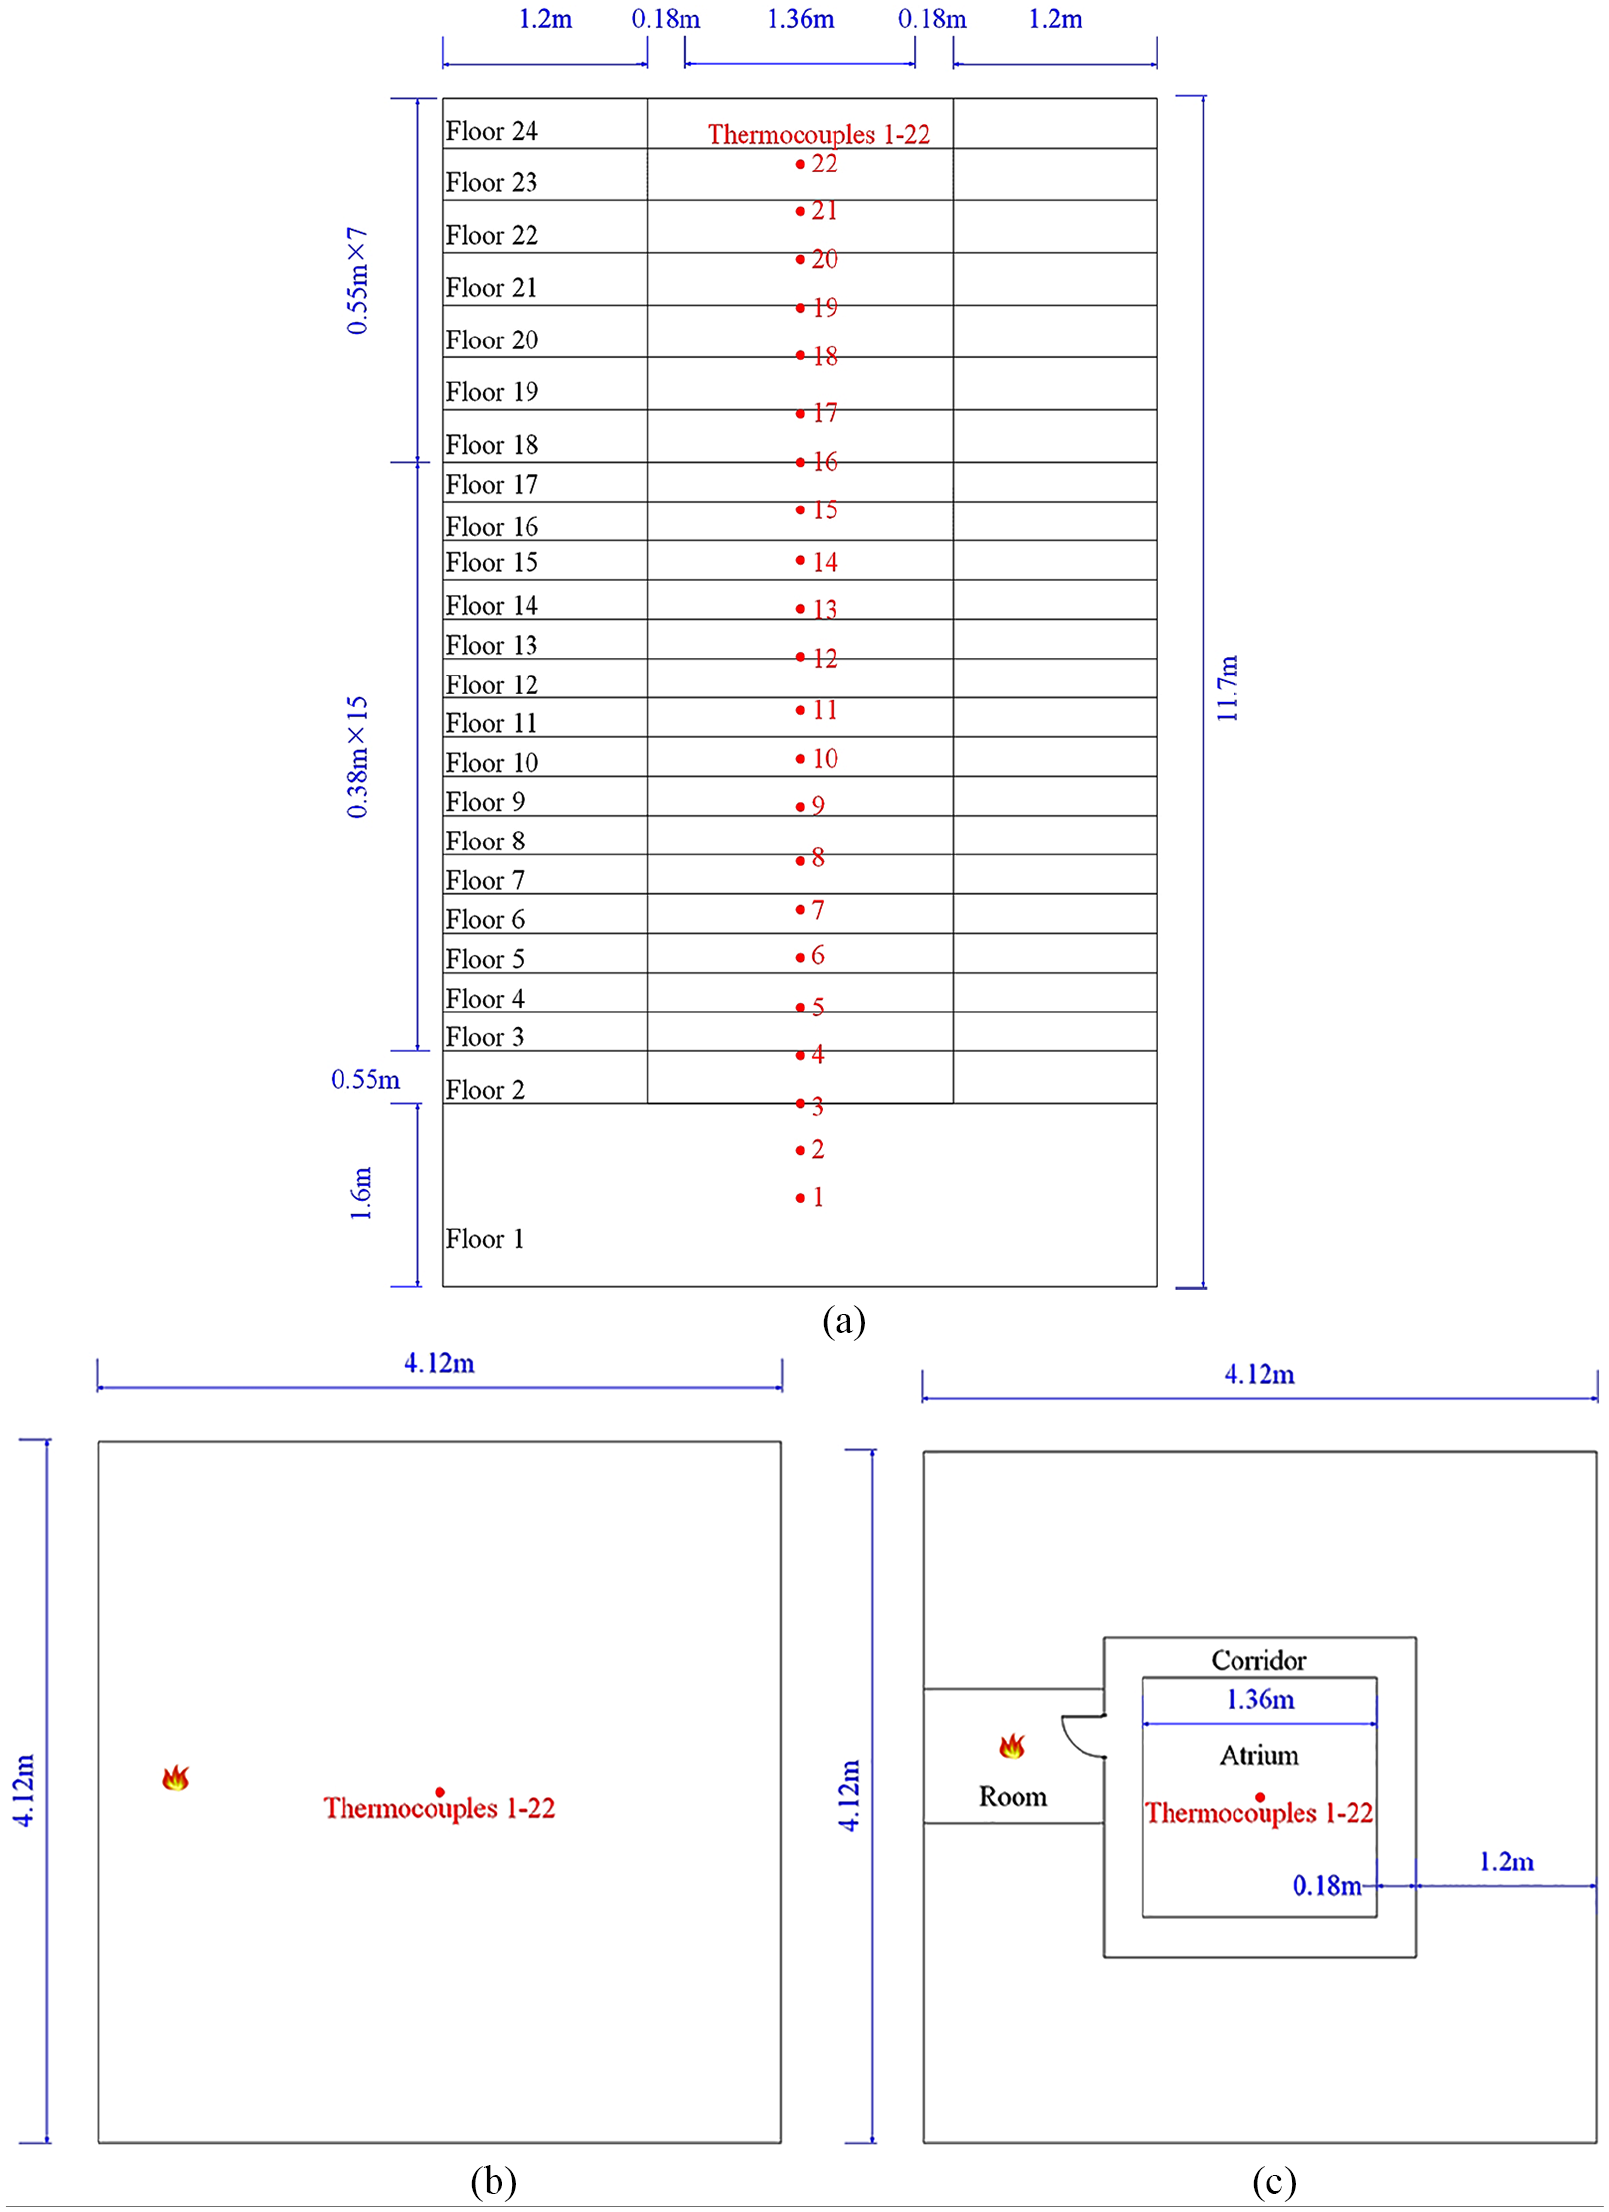
Structure diagram of the platform. (a) Side view of the platform. (b) Layout of floor 1. (c) Layout of floors 2–24.
Height of each floor on the experiment platform.
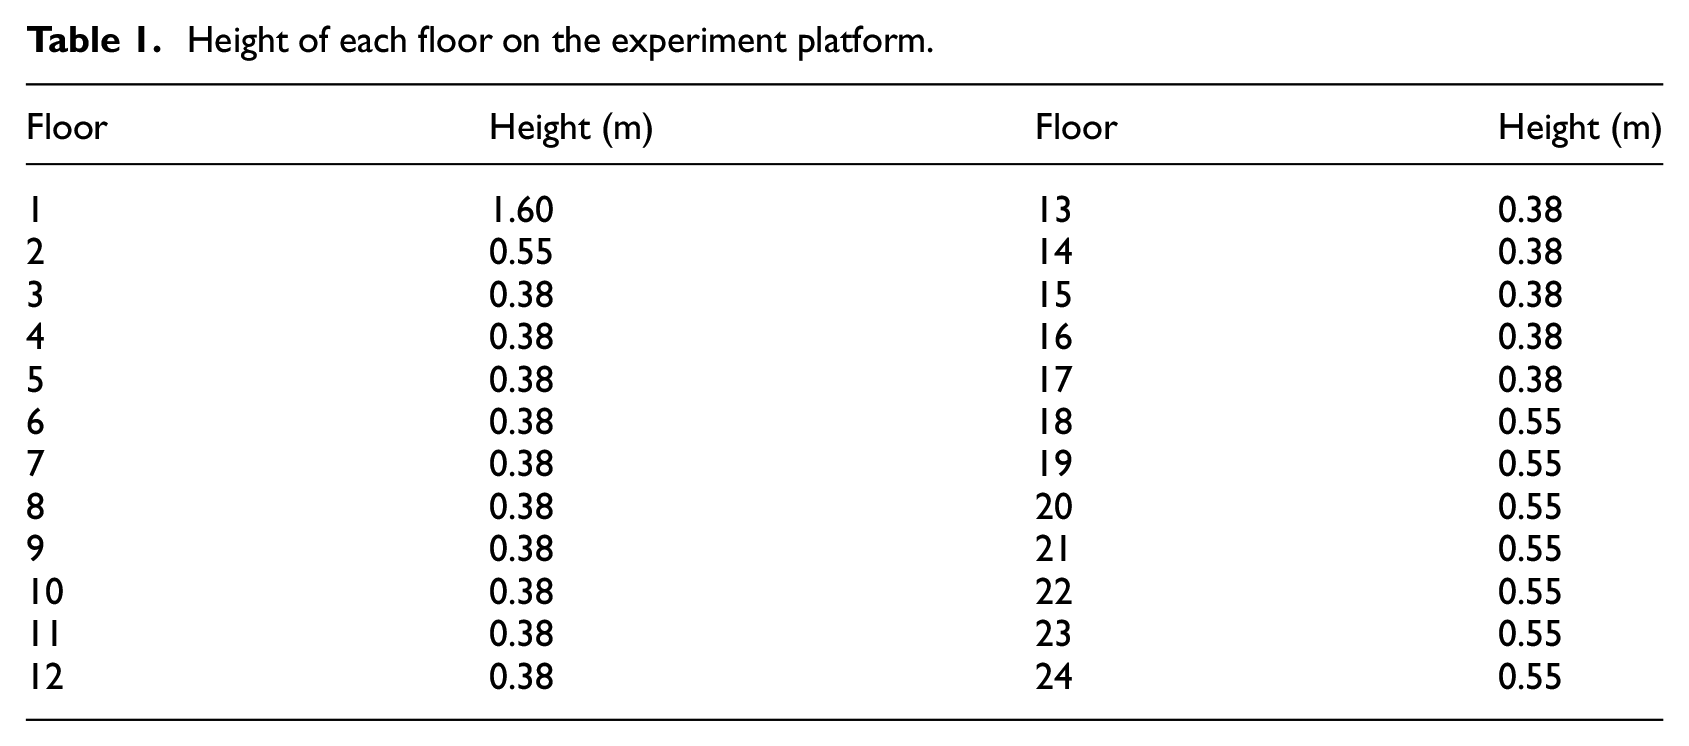
In order to study the influence of HRR (Q) on fire smoke movement in the atrium, four oil pans with different sizes were applied: 10 × 10 cm2, 20 × 20 cm2, 20 × 30 cm2, 30 × 30 cm2. In each experiment, an oil pan was located on the first floor, as shown in Figure 2(b). The HRR in the experiments was measured and calculated according to the fuel consumption and the time the fire lasted. The weight of the fuel as a function of time is plotted in Figure 3. According to the experiment tests, the average HRR of the four fire sources was, respectively, 11.3, 25.4, 53.1, and 81.6 kW.
Weight of fuel as a function of time when the oil pan was 20 × 20 cm2.
In order to study the influence of the fire source height on fire smoke movement in the atrium, an oil pan was located in the center of the rooms on six different floors (Floors 1, 2, 9, 16, 23, and 24), as shown in Figure 2(b) and (c). The horizontal locations of the oil pans were exactly the same. As the rooms on Floors 2–24 on the experiment platform were very small, they could not bear a large fire. Thus, to ensure the safety in the experiments, the size of the oil pans was chosen as the smallest one, 10 × 10 cm2.
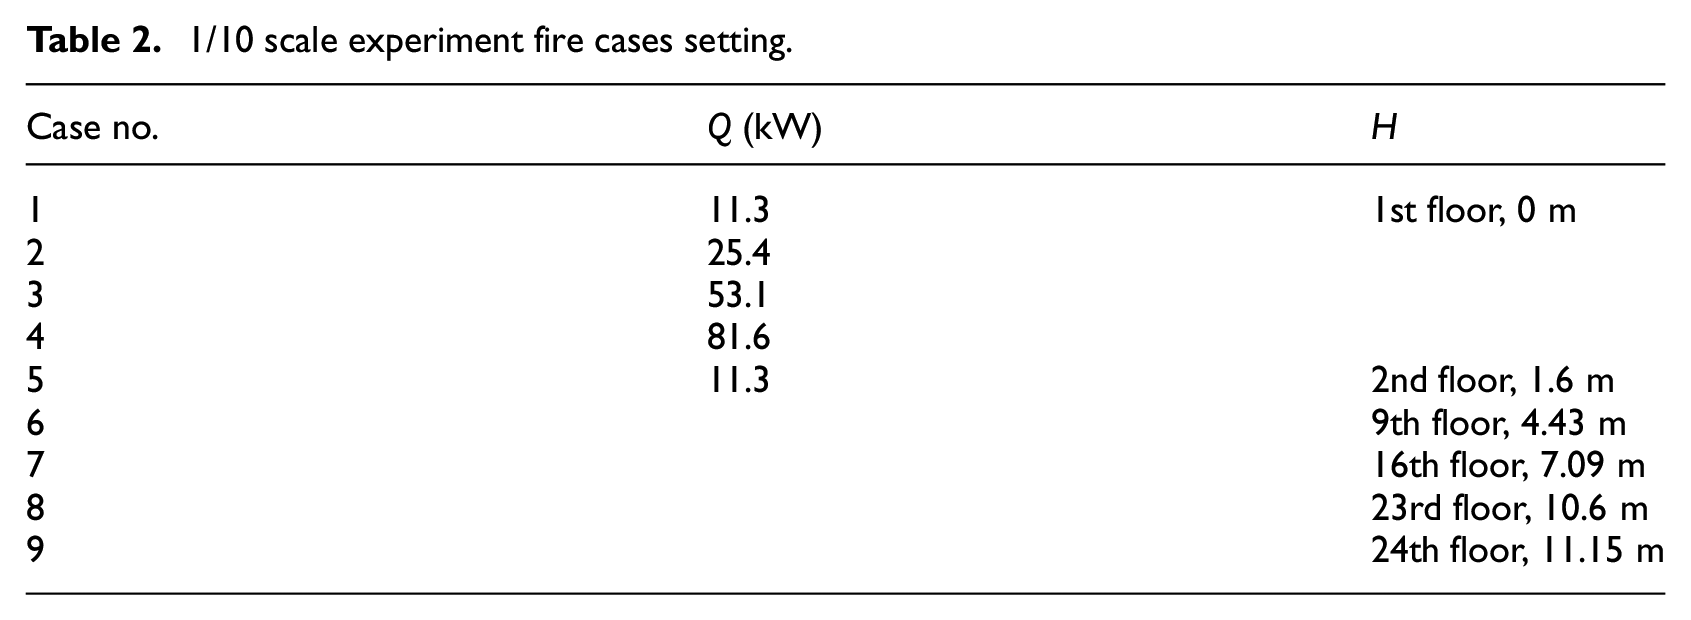
In sum, a total of nine fire cases were designed in this article, as shown in Table 2. Each case lasted for 600 s and was repeated thrice. The environmental temperature in the experiments was 14 oC. In the table, h is the height of the fire source.
1/10 scale experiment fire cases setting.
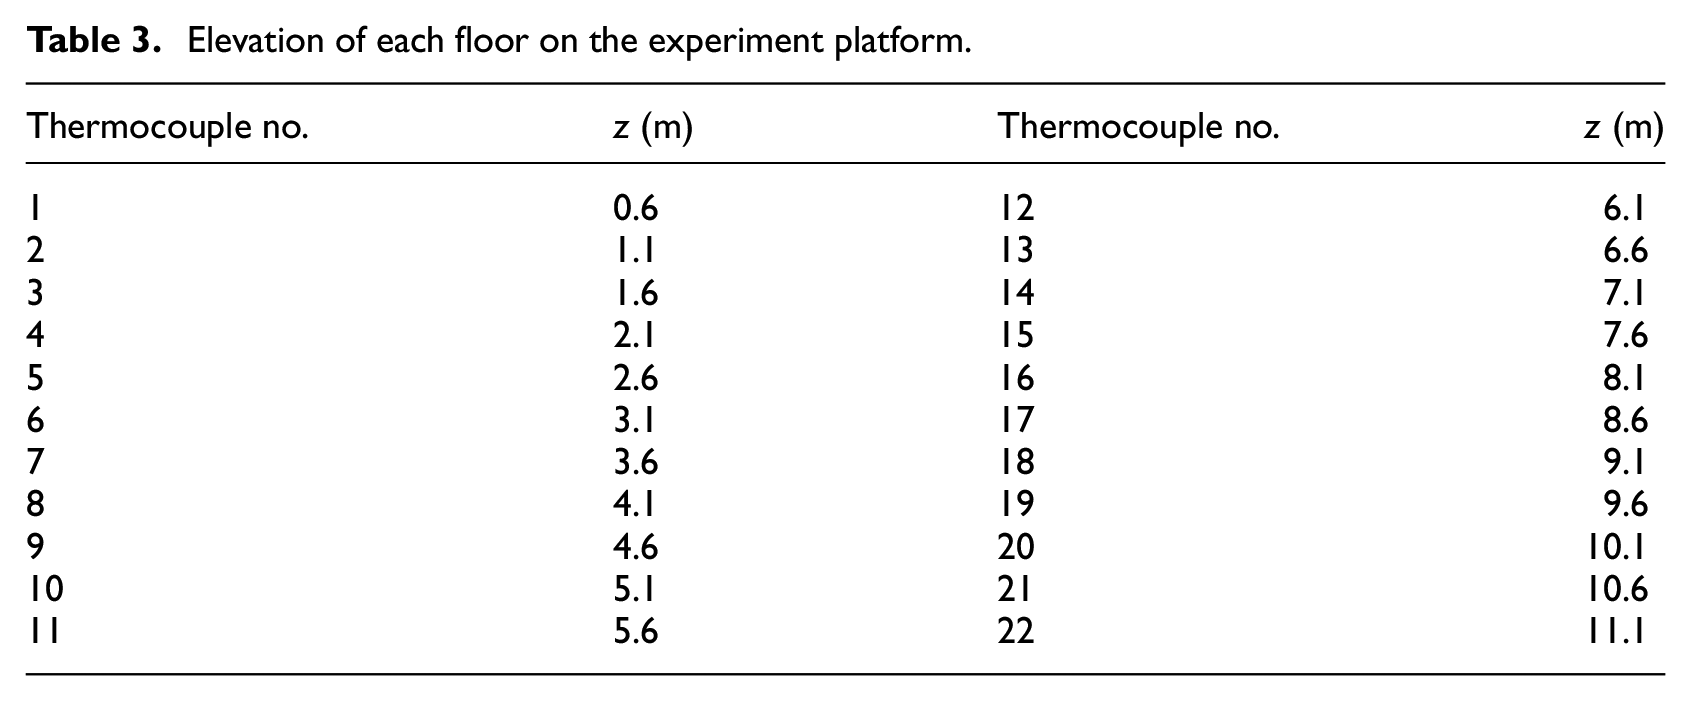
K-thermocouples were used to measure the temperature in the atrium. Locations of all the thermocouples are shown in Figure 2 (red dots). The vertical distance of every two thermocouples was 0.5 m. The elevation (z) of each thermocouple is listed in Table 3.
Elevation of each floor on the experiment platform.
Numerical setting
In the experiments, only the temperature was measured. In order to understand fire smoke movement in the atrium, more characteristics need to be analyzed. Thus, based on the experiment platform, a full-scale numerical model was built through fire dynamics simulator (FDS) 6.129–31, which was developed by the National Institute of Standards and Technology. Boundaries of the model were set as open. To refer to relative pressure, environmental pressure in the model was set as 0 Pa. FDS solves the motion of fire smoke movement through large-eddy simulation (LES). Through LES, turbulent motions were separated into large eddies and small eddies through a filter. A mixing-limited infinitely fast reaction combustion model was used in this study. All the numerical settings were the same as the experimental conditions: the environmental temperature was set at 14 oC, the material of the platform was steel, the fuel was heptane, the sizes of the heptane pans were the same as that in the experiments, and the HRR in the stabilization stage in the simulations was set according to the average values measured in the experiments. The temperatures and pressure were measured in the atrium.
The method of scaling being used in the model is Froude scaling. HRR can be scaled according to equation (1) as 32
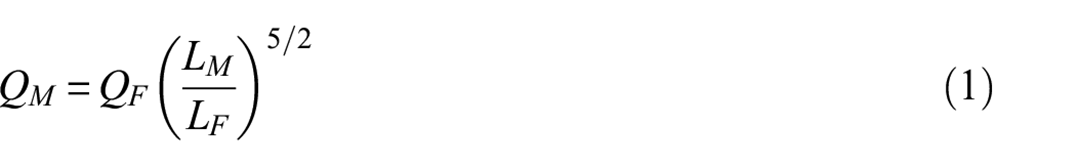
where Q is HRR, L is the characteristic length, M refers to the small-scale model, and F refers to the full-scale model. In this study, LM/LF = 1/10. According to Table 2, the HRR in the full-scale FDS model should be 3573.4, 8038.5, 16777.3, and 25810.5 kW.
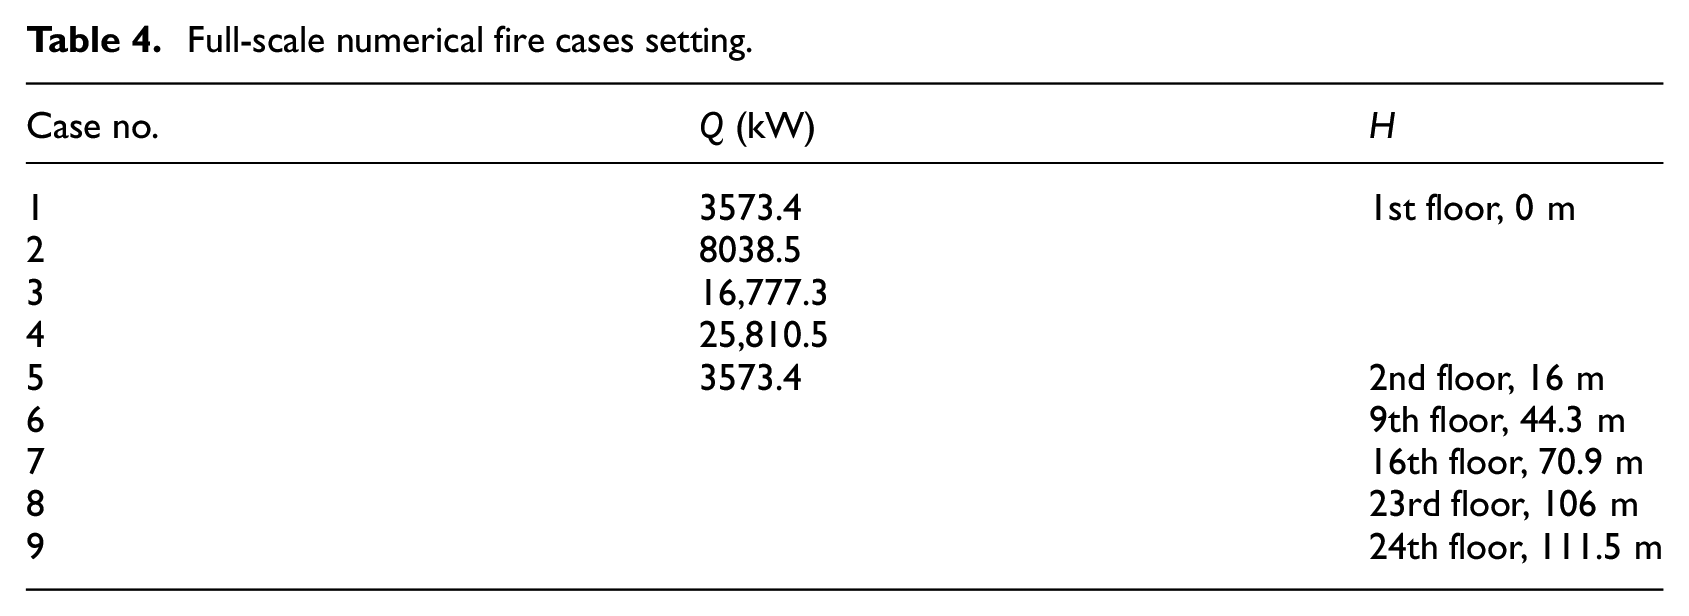
In sum, in the full-scale numerical model, the nine corresponding experiment fire cases in Table 2 should be scaled according to Table 4.
Full-scale numerical fire cases setting.
The grid size is very important for the calculation accuracy. For simulations involving buoyant plumes, a measure of how well the flow field is resolved is given by the nondimensional expression D*/δx, where D* is a characteristic fire diameter 29
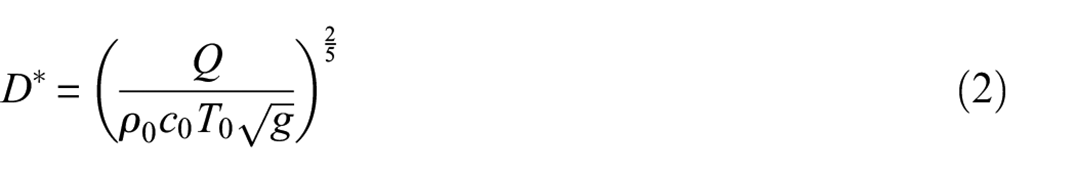
where
D* and δx of four fire sources in numerical models.
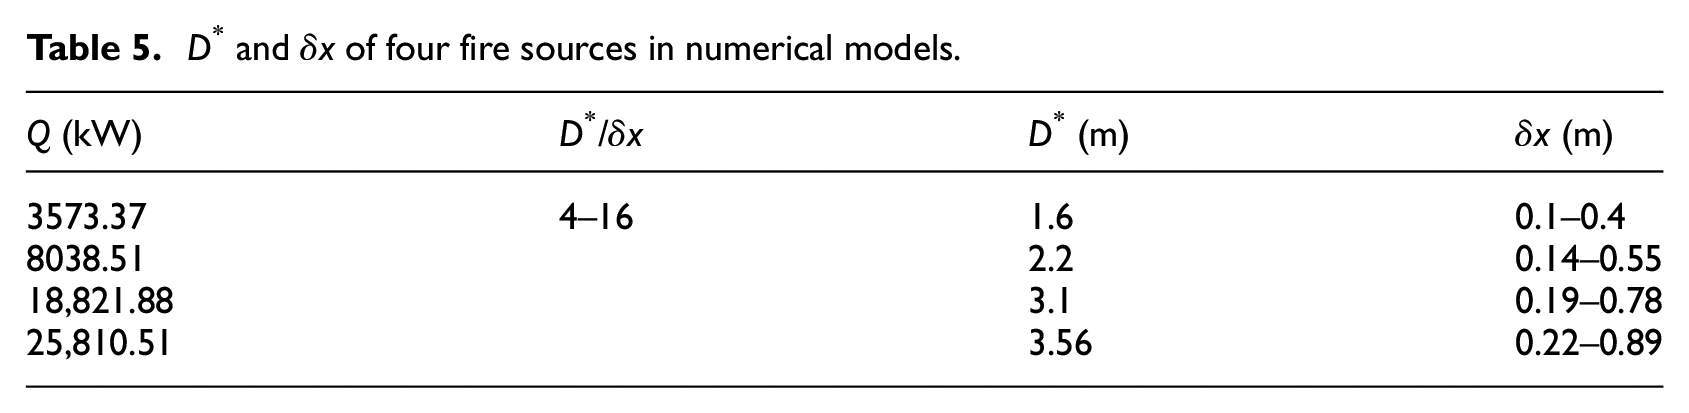
According to Table 5, the grid smaller than 0.4 m satisfies all the cases. However, the full-scale numerical model is very large, which is 117 m high, 41 m wide, and 41 m long. A calculation case with too many grids costs too much time. Thus, a grid sensitivity study was conducted between 0.2 and 0.5 m grid. Temperature and pressure in the atrium were compared in the two conditions for case no.1. For example, the temperature and pressure at the bottom (thermocouple 3) and the top (thermocouple 22) of the atrium were compared in Figure 4. It was found that they were similar. Thus, 0.5 m grid was used in the numerical model.
Temperature and pressure variation with time in the atrium between 0.2 and 0.5 m grid. (a) Temperature, bottom. (b) Pressure, bottom. (c) Temperature, top. (d) Pressure, top.
Results and discussion
In order to study the heat transfer and smoke filling progress in the atrium under the influence of HRR and height of the fire source, temperature distributions, pressure distributions, actual HRR variations, and velocity variations under different conditions were analyzed and compared. As thermocouples 1–2 were close to the flame and they were easily affected by the flame, the temperature data were quite unstable. Thus, only thermocouples 3–22 were analyzed.
Influence of HRR
In order to study the influence of HRR on the fire smoke movement, case nos. 1–4 were conducted and compared. Each experiment was conducted thrice times, and the average value was analyzed in this article.
Temperature
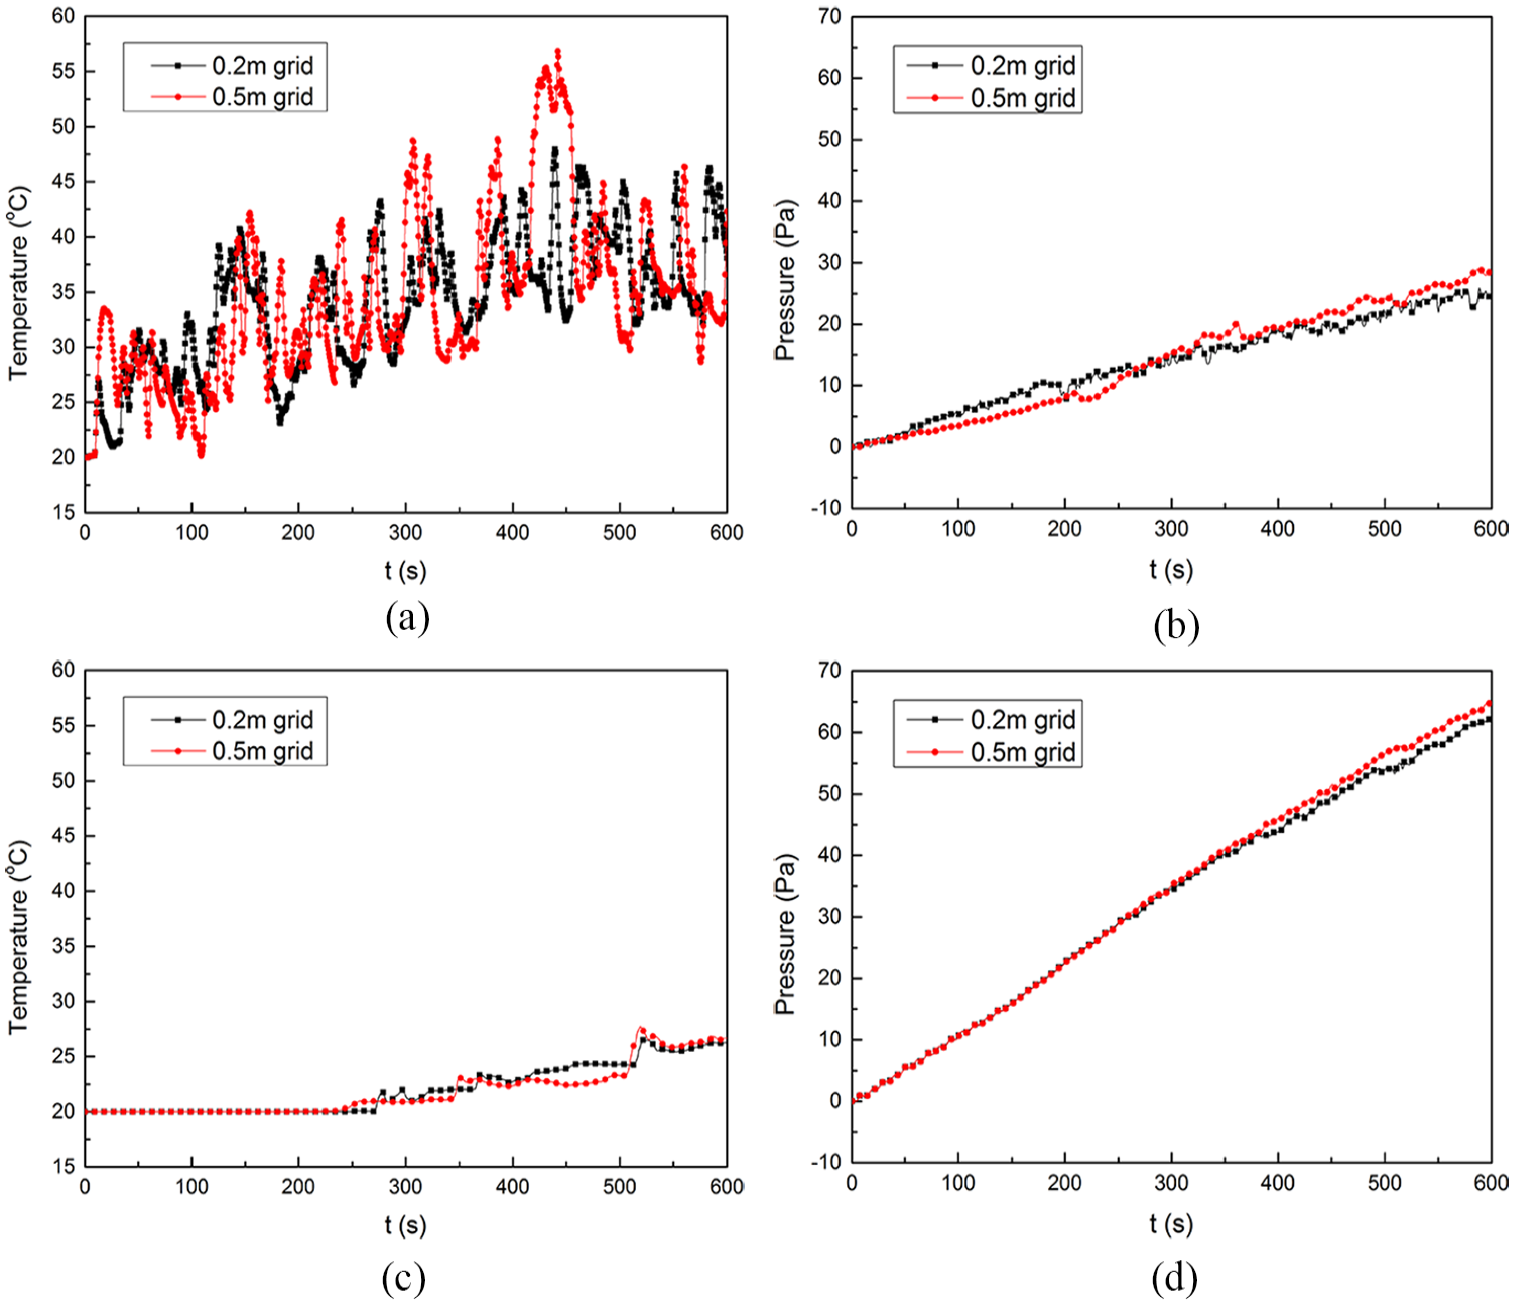
Temperature evolution at different locations in case nos. 1–4 are plotted in Figure 5. It was found that the extinguish time decreased with HRR. The fire extinguished around 540, 480, 460, and 300 s in case nos.1, 2, 3, and 4.
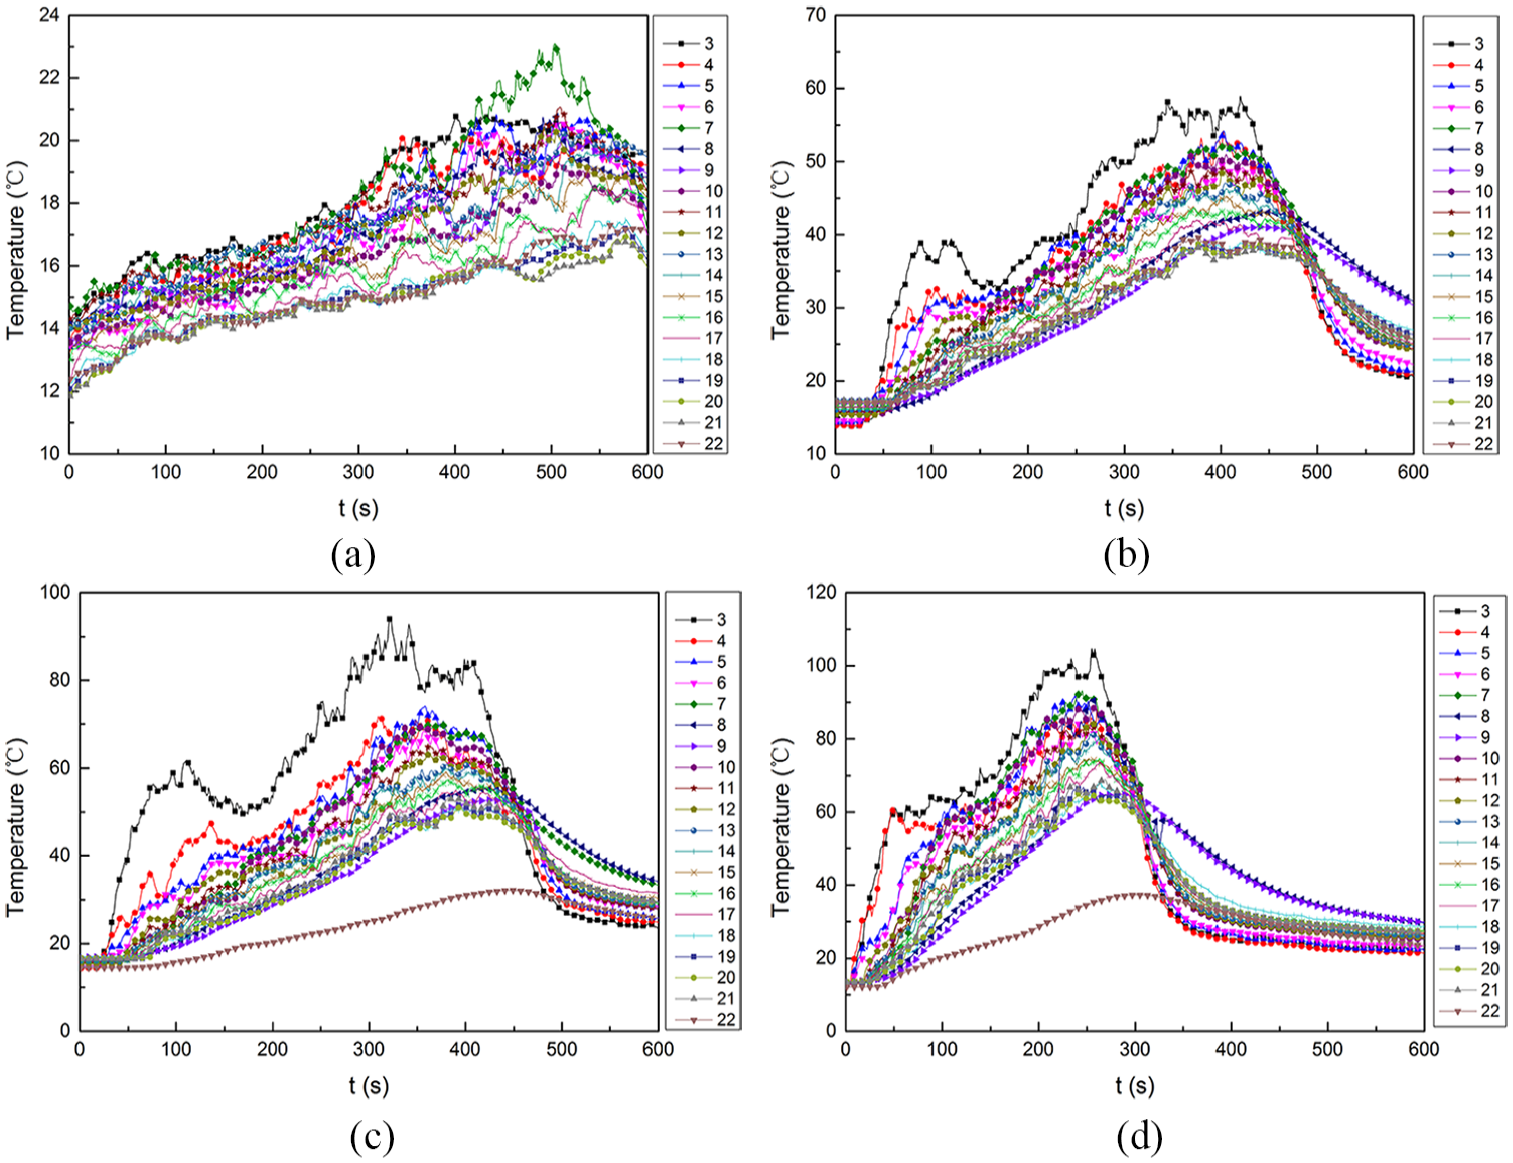
Temperature evolution at different locations in the atrium. (a) Case no. 1. (b) Case no. 2. (c) Case no. 3. (c) Case no. 4.
Under different HRR conditions, the average temperature distributions in the atrium between 290 and 310 s are compared in Figure 6. And the results were compared to the average temperature distribution between 285 and 315 s in the full-scale experiments conducted by W.K. Chow et al. 5
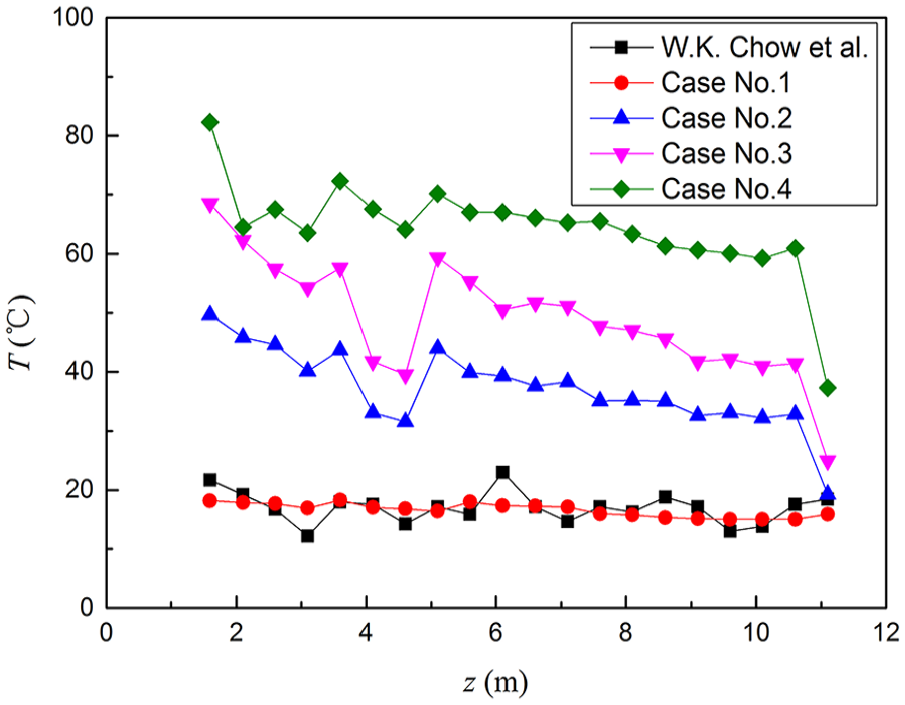
Temperature distributions in the atrium under different HRR.
According to Figure 6, the temperature distribution in the full-scale experiments conducted by W.K. Chow et al. 5 was very close to the results in case no.1. The temperature in the atrium increased with HRR. When HRR was increased by 622.1% from 11.3 to 81.6 kW, the highest temperature in the atrium increased by 349.7% from 18.3 oC to 82.3 oC. It was noticed that the temperatures experienced a drop at 4.6 m. This was due to the instability of fire smoke plumes. When HRR was 11.3 kW, the temperature in the atrium at every height was very close to the environment temperature. This was due to that the HRR was very small compared to the large volume of the platform. Thus, when the smoke rose up to the location of thermocouple 3, the temperature had been very low. This can be read from Figure 5(a). To estimate whether the smoke layer had reached the top of the atrium in this condition, the temperature and the height of the fire smoke layer interface were calculated. Usually, the N-percentage rule proposed by Cooper et al. 1 is used to calculate the temperature of the hot smoke layer interface. According to the rule
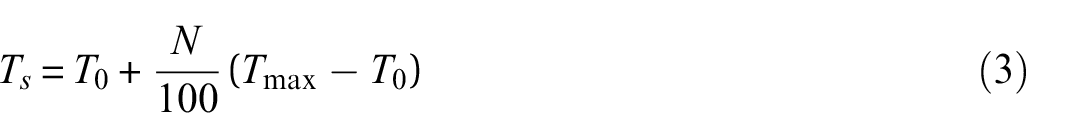
where Ts is the temperature of the hot smoke layer interface, Tmax is the highest temperature, and the value of N is usually between 10 and 20. In this study, T0 was 14 oC, and N was selected as 20. In case no.1, the temperature of the smoke layer (Ts) as a function of time was calculated and is plotted in Figure 7.
Temperature of the smoke layer as a function of time in case no.1.
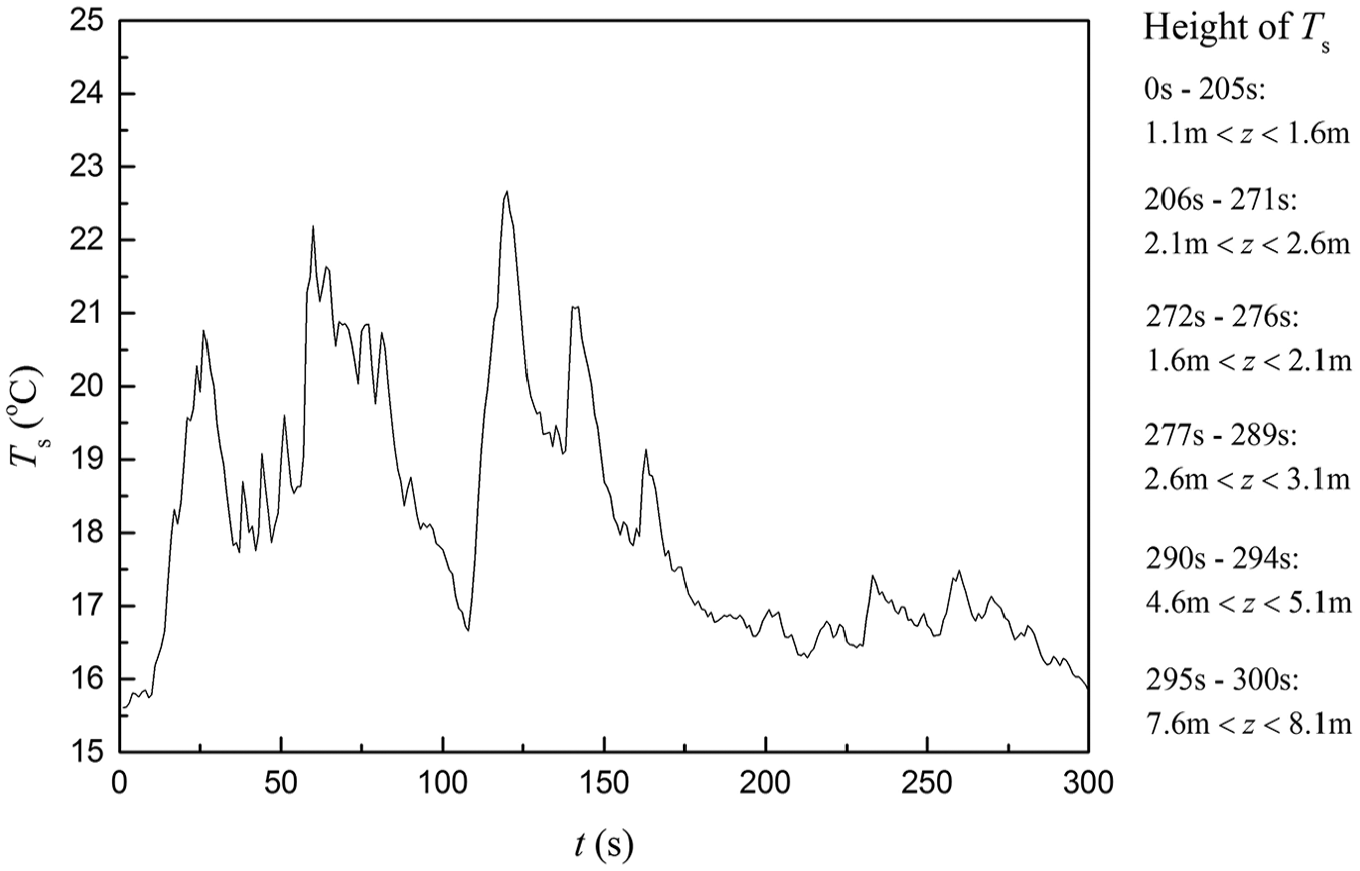
The corresponding height of Ts is the height of the fire smoke layer interface. According to the experimental data, when 0 s ≤ t ≤ 205 s, the height of the fire smoke layer interface was between 1.1 and 1.6 m; when 206 s ≤ t ≤ 271 s, the height of the fire smoke layer interface was between 2.1 and 2.6 m; when 272 s ≤ t ≤ 276 s, the height of the fire smoke layer interface was between 1.6 and 2.1 m; when 277 s ≤ t ≤ 289 s, the height of the fire smoke layer interface was between 2.6 and 3.1 m; when 290 s ≤ t ≤ 294 s, the height of the fire smoke layer interface was between 4.6 and 5.1 m; when 295 s ≤ t ≤ 300 s, the height of the fire smoke layer interface was between 7.6 and 8.1 m. In sum, the height of the fire smoke layer interface kept rising during the fire, except at the time duration between 272 and 276 s. In this period, the height dropped a little. This was due to the instability of the fire smoke plumes. For example, when t = 300 s, Ts was 15.8322 oC. Temperatures at different heights in the atrium are listed in Table 6. The zone from height 10.6 to 11.1 m represents the top zone. In case no.1, the hot fire smoke did not rise to the top. Thus, the temperature in the upper layer was relatively low. However, the platform was constructed with steel and it was heated during the fire, including the steel roof of the platform. Due to heat radiation of the hot roof, the gas close to the roof got heated and the temperature in the top zone was a little higher than in the lower zone. Thus, the temperature varies abruptly from height 10.6 to 11.1 m. According to Table 6, Ts was between 7.6 and 8.1 m. Through interpolation method, the height of the smoke layer was calculated as 7.948 m.
Temperatures at different heights in case no.1.
Similarly, the temperature and the height of the smoke layer interface in other cases with different HRR were calculated, as shown in Table 7. Except in case no.1, the smoke layer in the other three cases all reached the top of the atrium.
The temperature and the height of the smoke layer interface at 300 s under different HRR.
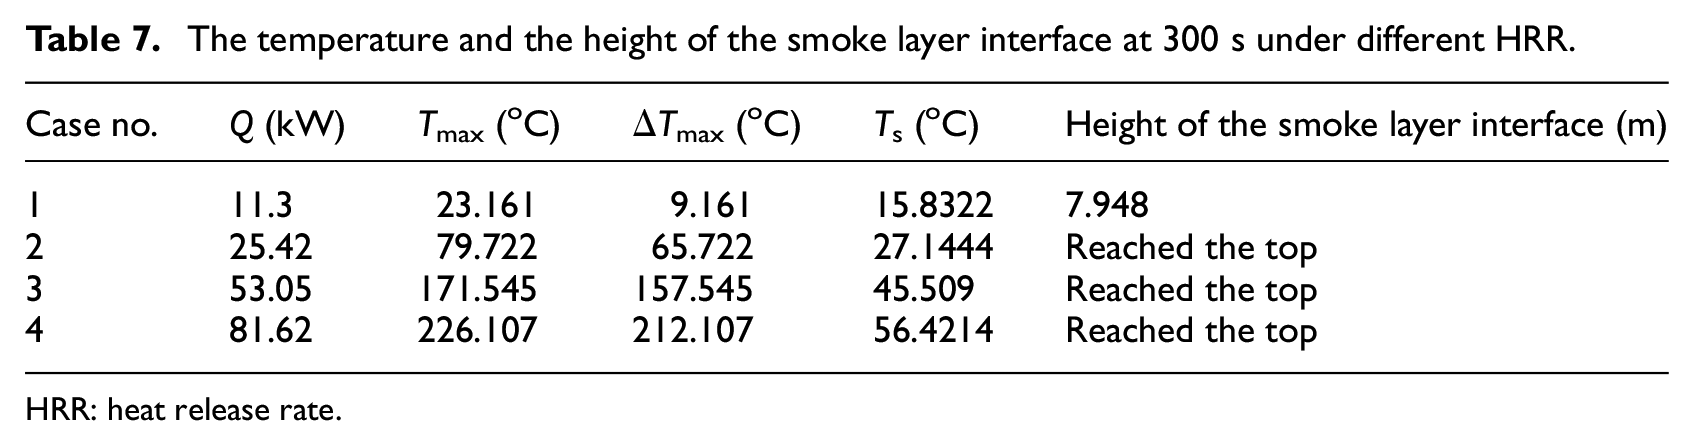
HRR: heat release rate.
Pressure
Pressure evolution at different locations in case nos. 1–4 are plotted in Figure 8. It was found that the pressure increased with time. When the fire extinguished, pressure increased at a lower speed.

Pressure evolution at different locations in the atrium. (a) Case no. 1. (b) Case no. 2. (c) Case no. 3. (c) Case no. 4.
Similar to temperature distributions, the average pressure distributions under different HRR conditions between 290 and 310 s are compared in Figure 9.
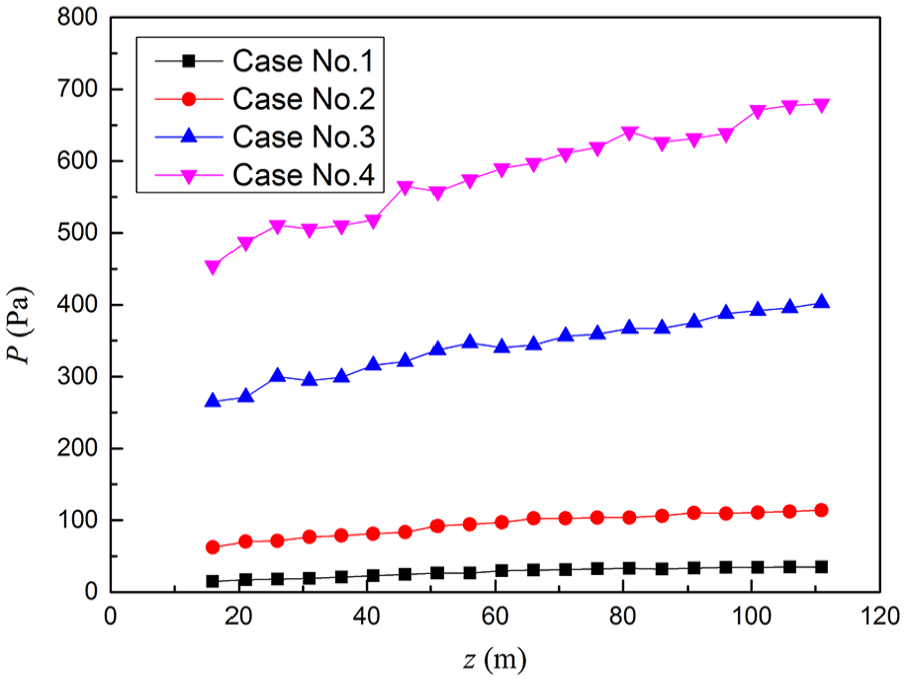
Pressure distributions in the atrium under different HRR.
According to Figure 9, the pressure in the atrium increased with HRR. In case no.1, the maximum pressure was 61.6 Pa. In case no.4, the maximum pressure was increased by 1000% to 678.1 Pa. On the other hand, the pressure increased with the height. In the top area, the pressure was the highest. The environmental pressure was set as 0 Pa in the model. The maximum variation of pressure (ΔPmax) under different HRR is listed in Table 8. The relationship between ΔPmax and Q2/3 under different HRR was analyzed and fitted, as shown in Figure 10. In addition, the relationship between ΔPmax and ΔTmax was fitted, as shown in Figure 11.
Maximum pressure in the atrium under different HRR.
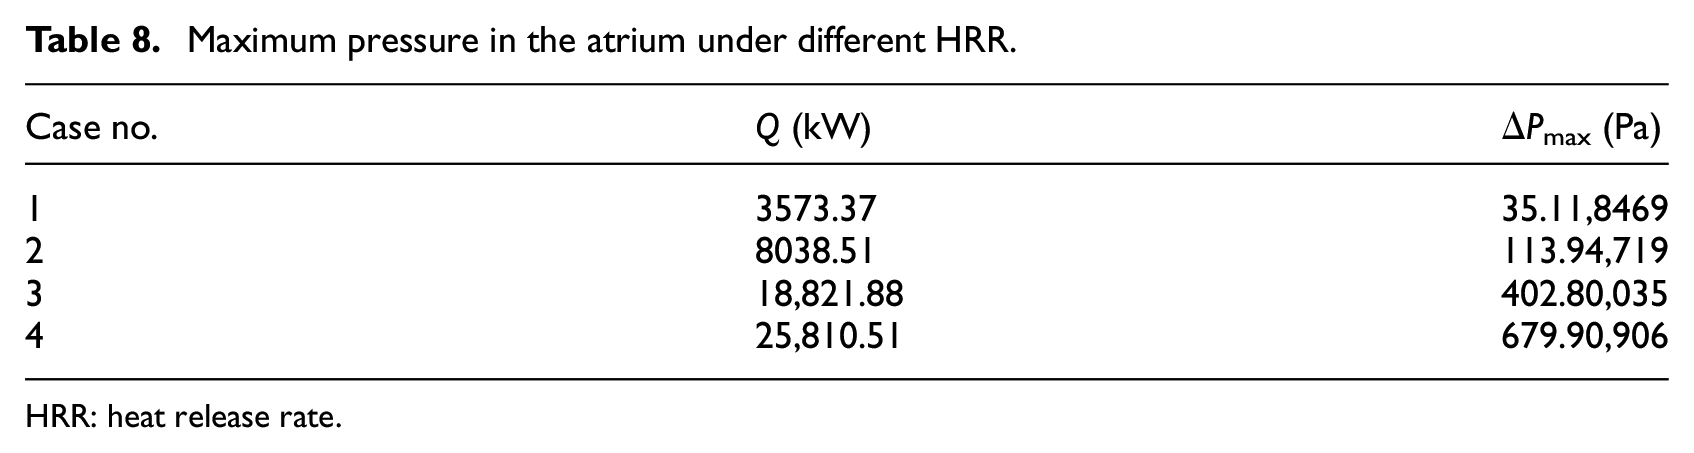
HRR: heat release rate.
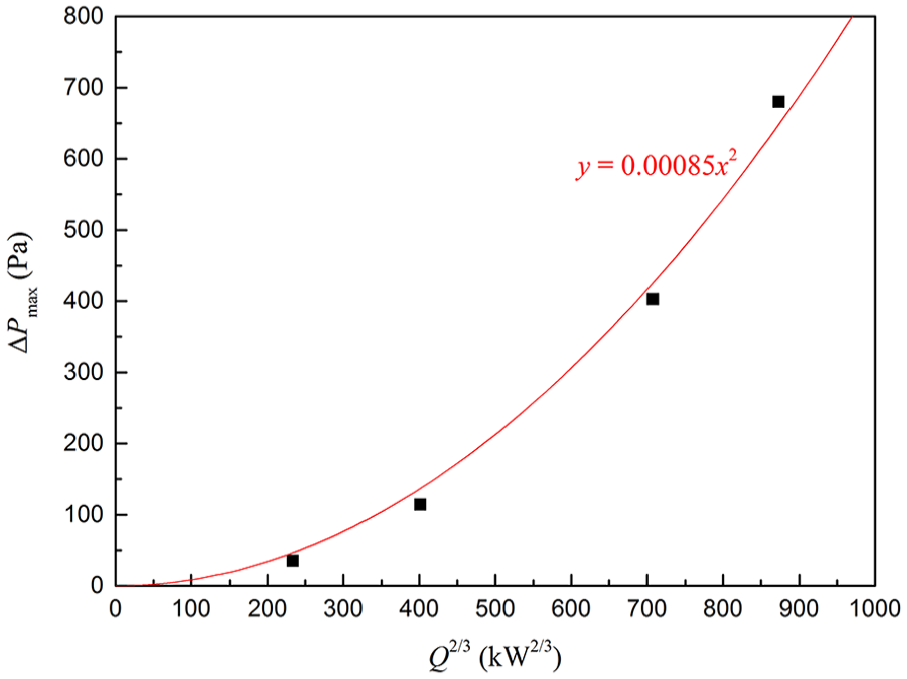
ΔPmax under different HRR.
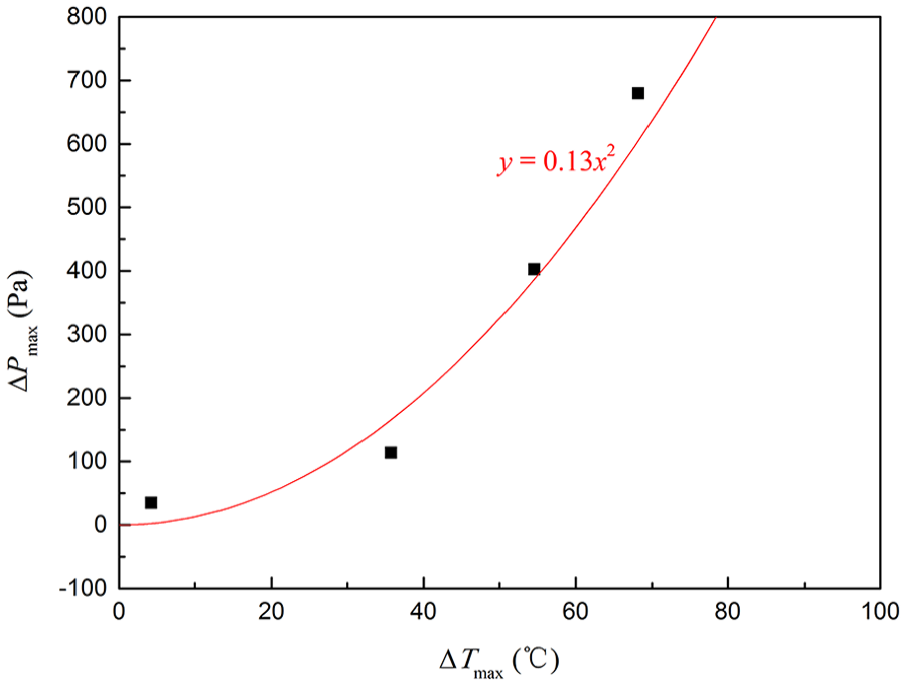
ΔPmax as a function of ΔTmax.
According to Figures 10 and 11, ΔPmax is quadratically positively related to Q2/3 and ΔTmax.
Influence of the fire source height
Similar to the influence of HRR, case no.1 and case nos. 5–9 were analyzed and compared to study the influence of the fire source height on fire smoke movement.
HRR
According to the numerical results, the actual HRR during the fire was significantly affected by the fire source height. HRR as a function of time was recorded in each case, as shown in Figure 10.
According to Figure 12, HRR basically stabilized around the preset value when the fire source was located at the bottom of the atrium. When the fire source was located on the second floor, HRR started to show fluctuation around the preset value and the amplitude of HRR was 1905 kW. When the location of the fire source kept rising, the amplitude of HRR was significantly increased. In case nos. 7–10, the amplitudes of HRR were increased to 4142–5361 kW. On the other hand, the higher the fire source was located, the sooner HRR started to fluctuate. In case no.7, HRR started to fluctuate at 566 s, 559 s in case no.8, 432 s in case no.8, and 304 s in case no.10. In sum, the higher the fire source was located, the larger the amplitude of HRR was and the sooner HRR started to fluctuate. The reason was that as the location of the fire source rose, the fire source was closer to the hot fire smoke gathering at the top of the atrium. The concentration of fire smoke was higher while the concentration of oxygen was lower. As the fire source was affected by the smoke, the combustion tended to be unstable and HRR tended to fluctuate earlier and more significantly.
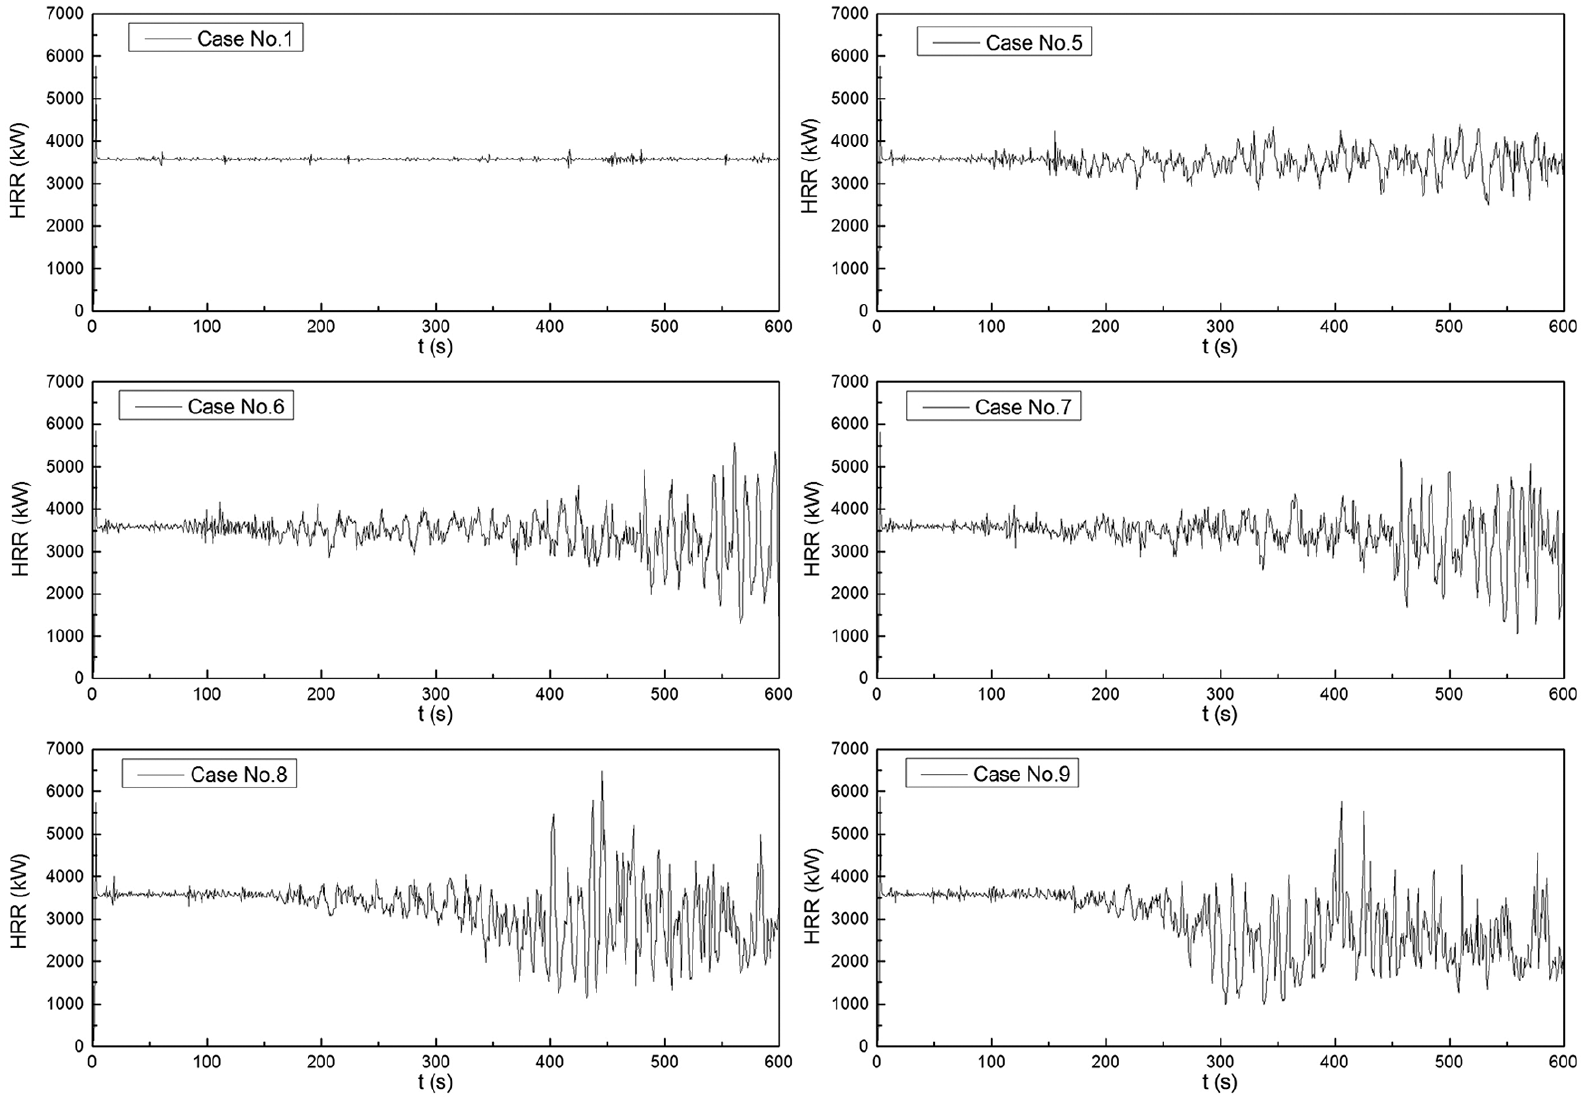
HRR as a function of time in cases with different fire source heights.
Temperature
Temperature evolution at different locations in case no.1 and case nos. 5–9 are plotted in Figure 13. It was found that the temperature at the bottom of the atrium was relatively higher when the fire source was located at the bottom. When the location of the fire source was higher, the temperature decreased at the bottom and increased at the top, which indicated that more hot fire smoke gathered at the top of the atrium and less smoke existed at the bottom.

Pressure evolution at different locations in the atrium. (a) Case no. 1. (b) Case no. 5. (c) Case no. 6. (d) Case no. 7. (e) Case no. 8. (f) Case no. 9.
The average temperature distributions between 290 and 310 s when the fire source was located at different heights are compared in Figure 14.
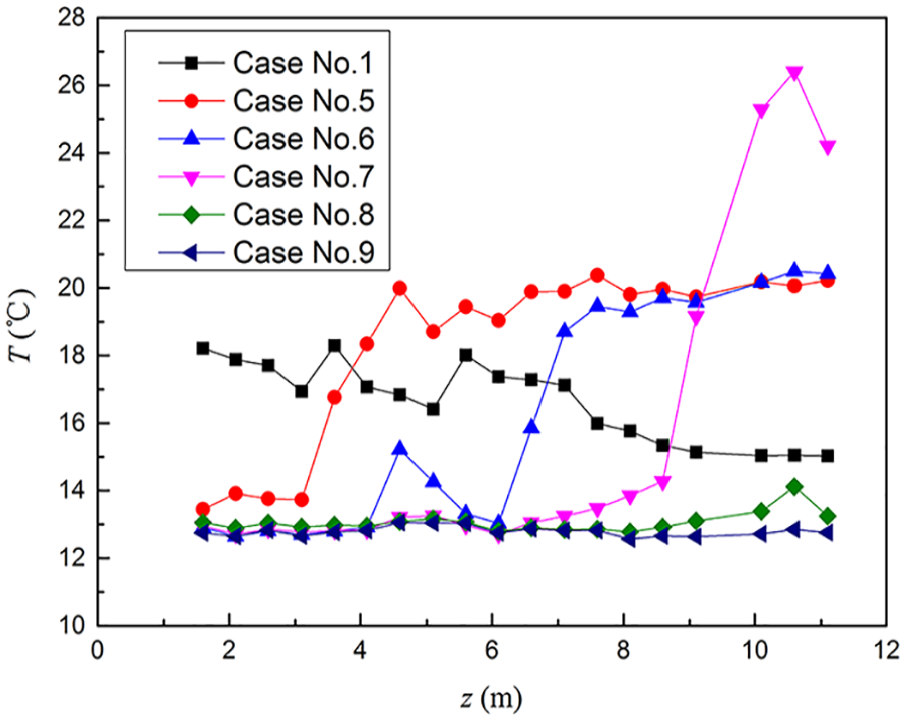
Temperature distributions in the atrium under different fire source heights.
According to Figure 14, when the fire source was located on the first floor (case no.1), the temperature in the atrium decreased as the height increased during the fire. This indicated that the fire smoke did not reach the top of the atrium, which was consistent with the calculation results of smoke layer interface in Table 8. When the fire source was located on the 2nd floor (case no.5), 9th floor (case no.6), or 16th floor (case no.7), the temperature in the atrium increased with the height in general. At the top of the atrium, the temperature was the highest. In the area below the fire source, the temperature did not increase significantly. This was because the volume of the atrium was very large and the fire smoke layer did not drop to the height of the fire source. Thus, the area below the fire source was not significantly affected by the hot smoke.
As the fire source was moved up to the top of the atrium (case nos. 8 and 9), almost all the smoke gathered at the top. As the highest thermocouple in the atrium had a distance to the top, all the thermocouples were below the hot smoke layer and they did not detect obvious temperature rise in the experiments. Thus, when analyzing the temperature at the top of the atrium, only case no.1 and case nos. 5–7 were compared. The temperature rise at the top of the atrium when the fire source was located at different heights is shown in Figure 15.
Temperature rise at the top of the atrium in cases with different fire source heights.
According to Figure 15, the temperature rise at the top of the atrium was positively related to the fire source height. The distribution was found to be consistent with the Boltzmann model. This indicated that when the fire source was located around the middle height of the atrium, the change in the fire source height affected the temperature change at the top of the atrium very significantly. However, when the fire source was located at the bottom or the top of the atrium, the effect was very small. When the fire source was located at the bottom of the atrium, it took a very long distance for the hot smoke to reach the top. During this path, most of the heat escaped. When the fire source was slightly raised, the path shortened slightly, which caused a small influence in the temperature change at the top. When the fire source was located at the top area, the gas at the top absorbed most of the energy and the temperature was relatively high. The small change in the fire source height did not change the temperature at the top significantly.
Pressure
Pressure evolution at different locations in case no.1 and case nos. 5–9 are plotted in Figure 16. It was found that the pressure increased with time. When the fire source was located at a higher level, pressure in the atrium was lower and it increased at a lower speed.
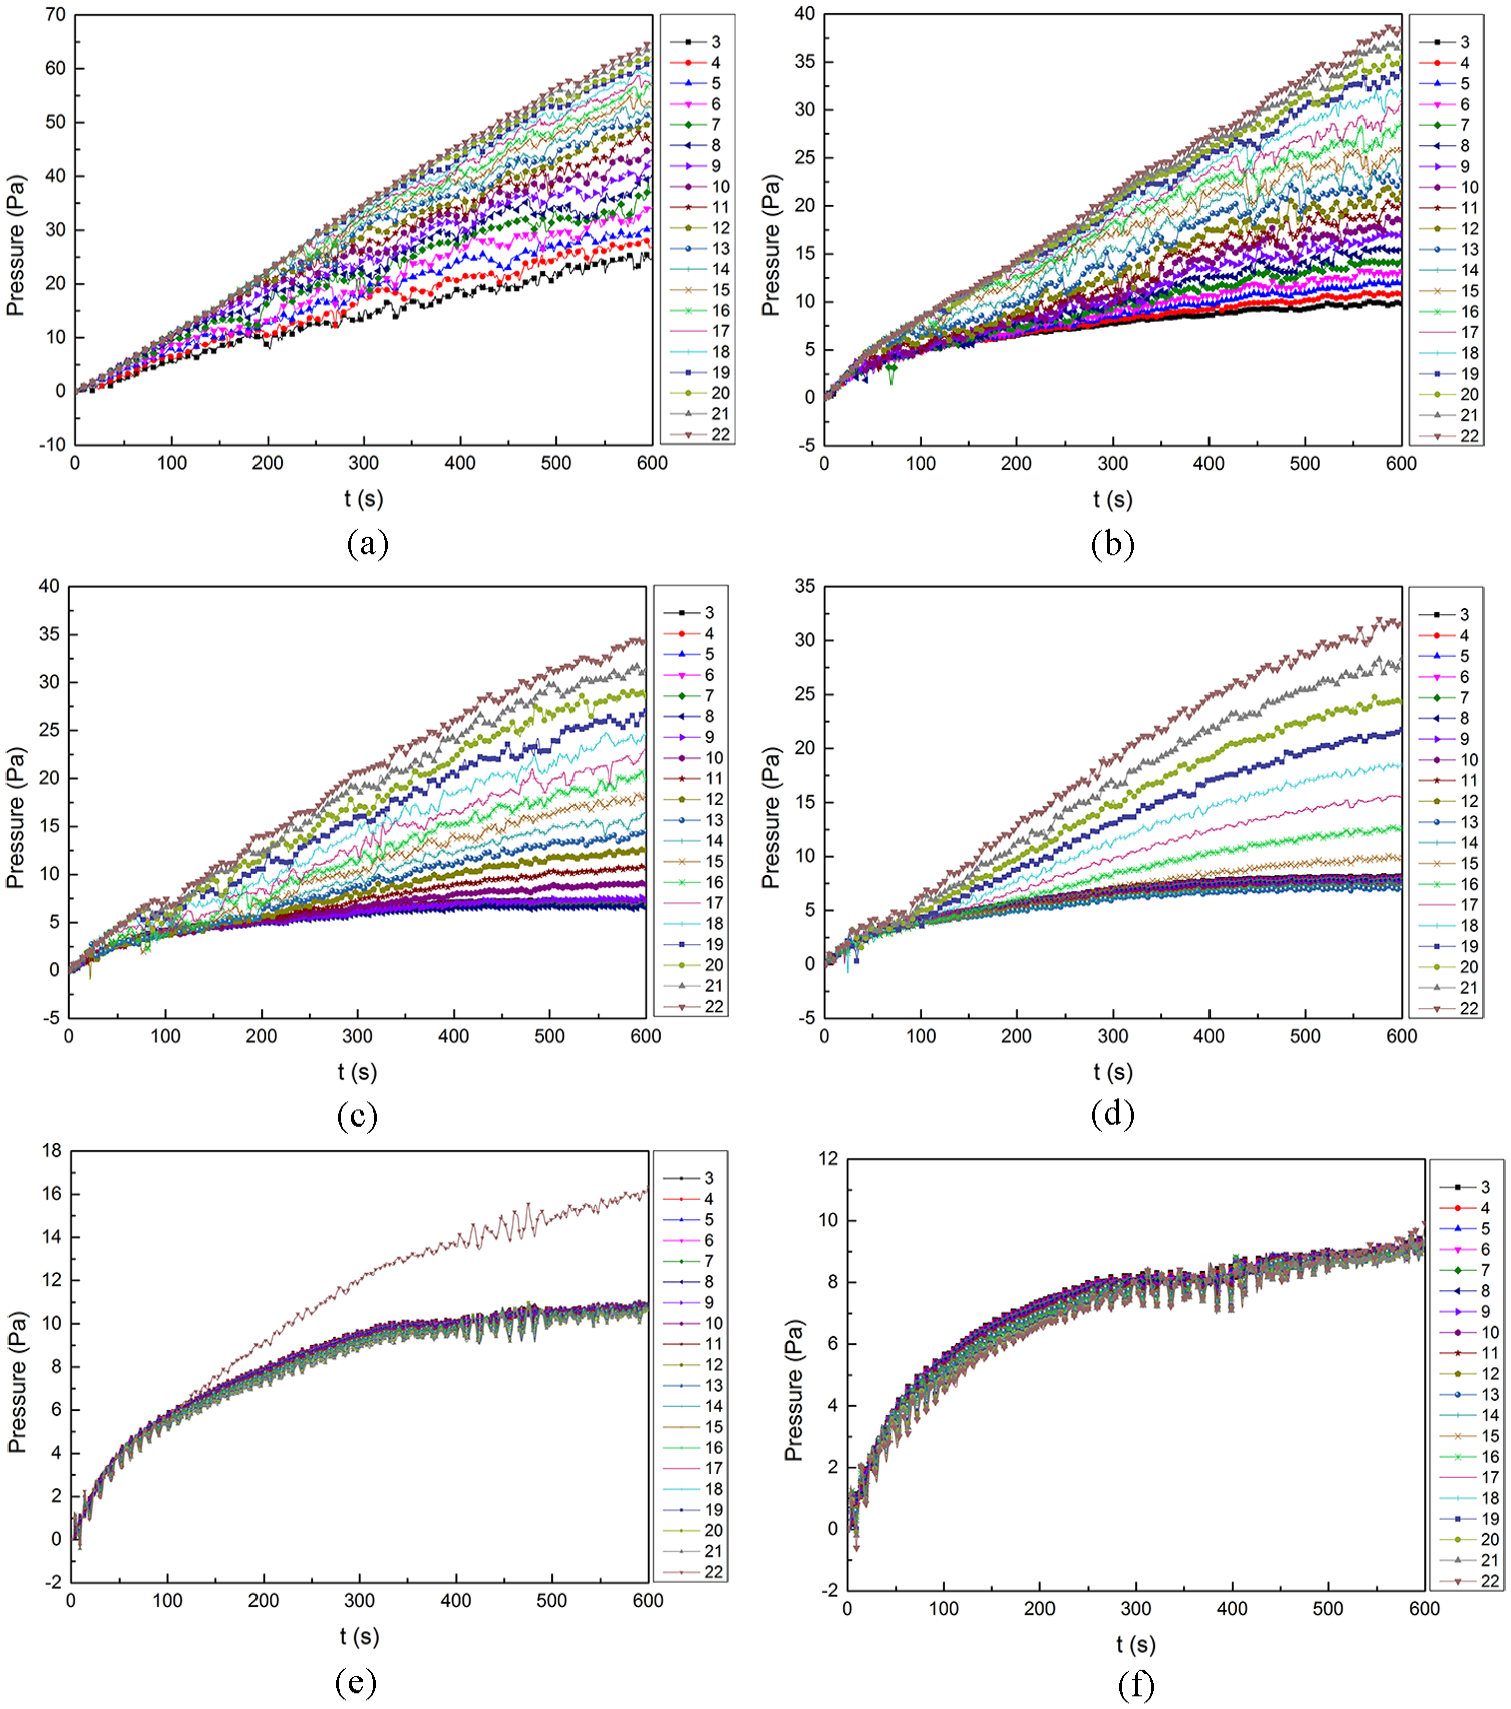
Pressure evolution at different locations in the atrium: (a) Case no. 1. (b) Case no. 5. (c) Case no. 6. (d) Case no. 7. (e) Case no. 8. (f) Case no. 9.
Similar to temperature distributions, the average pressure distributions under different fire source heights between 290 and 310 s are compared in Figure 17.
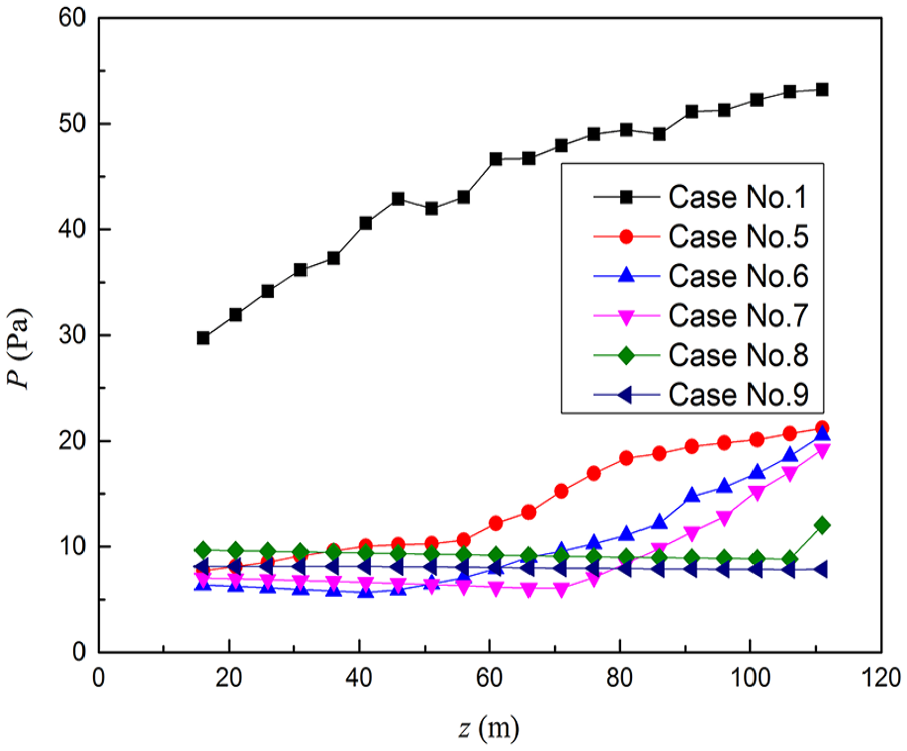
Pressure distributions in the atrium under different fire source heights.
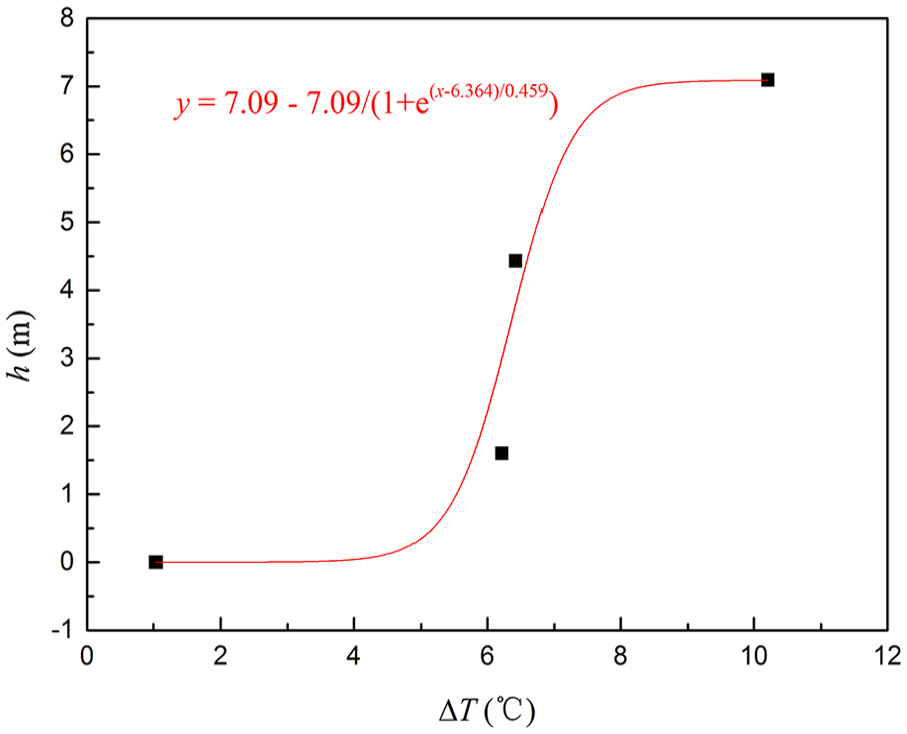
According to Figure 17, pressure in the atrium increased with height. At the top of the atrium, the pressure was the highest. Similar to the temperature, when the pressure at the top of the atrium was analyzed, only case no.1 and case nos. 5–7 were compared. When the fire source was located at different heights, the pressure change at the top of the atrium is as shown in Figure 18.
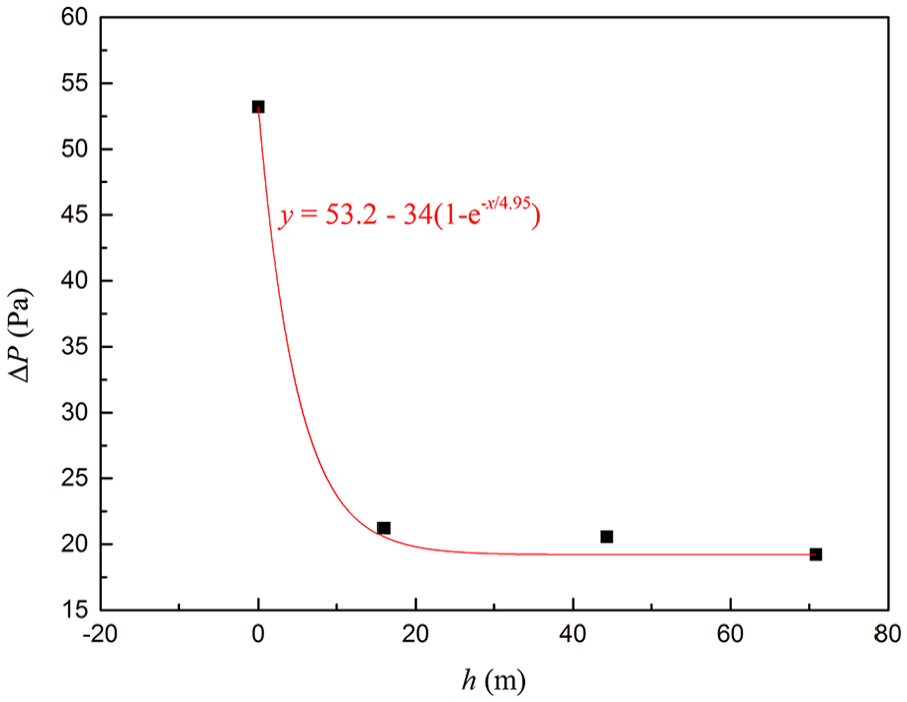
Pressure change at the top of the atrium in cases with different fire source heights.
According to Figure 17, the temperature at the top of the atrium was positively related to the fire source height. However, the pressure change at the top of the atrium was negatively index-related to the fire source height according to Figure 18. This was due to the smoke movement. During the fire, as the hot fire smoke raised up with a velocity (v), a relatively low-pressure area was generated below, as shown in Figure 19.
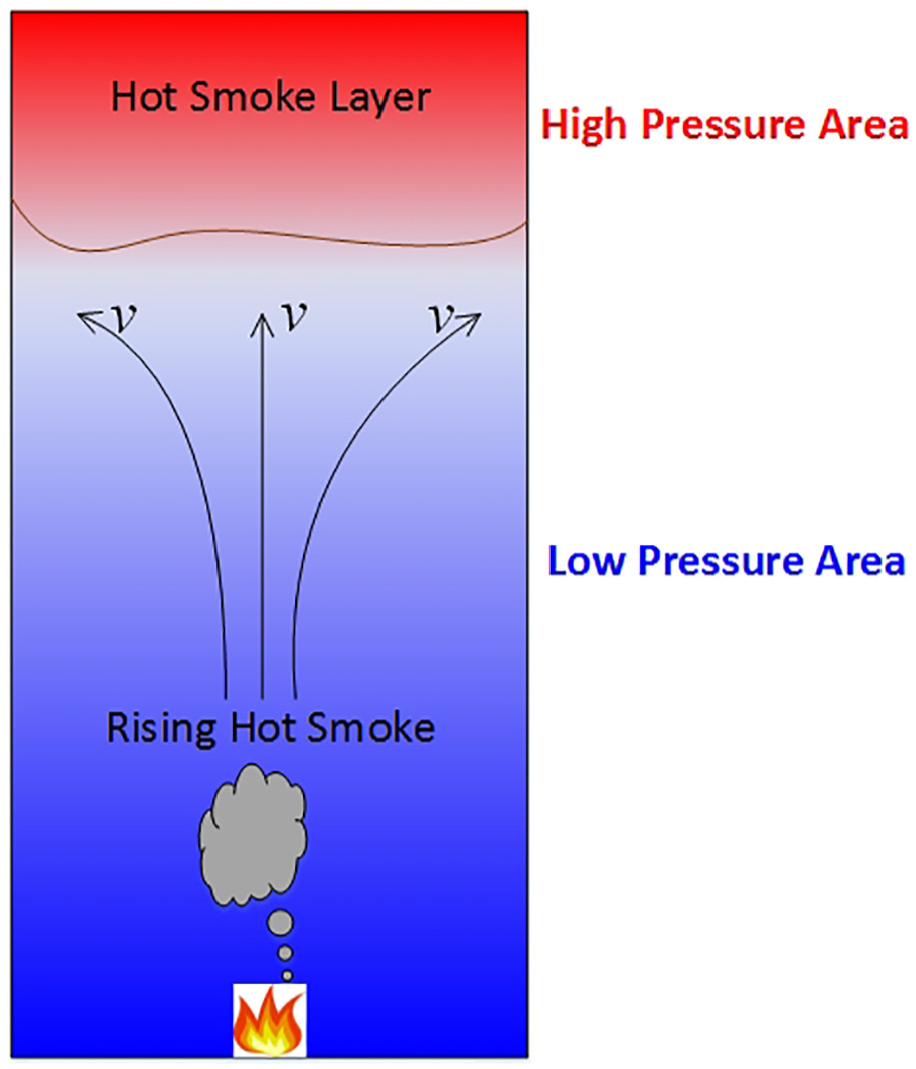
Low-pressure area generated from the hot smoke movement.
According to numerical results, the velocity of the fire smoke in the top area was higher as the fire source was moved up, as shown in Figure 20. This indicated that when the fire source was closer to the top of the atrium, the hot fire smoke had more energy to rise up. When the hot fire smoke rose up faster, the pressure in the low-pressure area was lower.
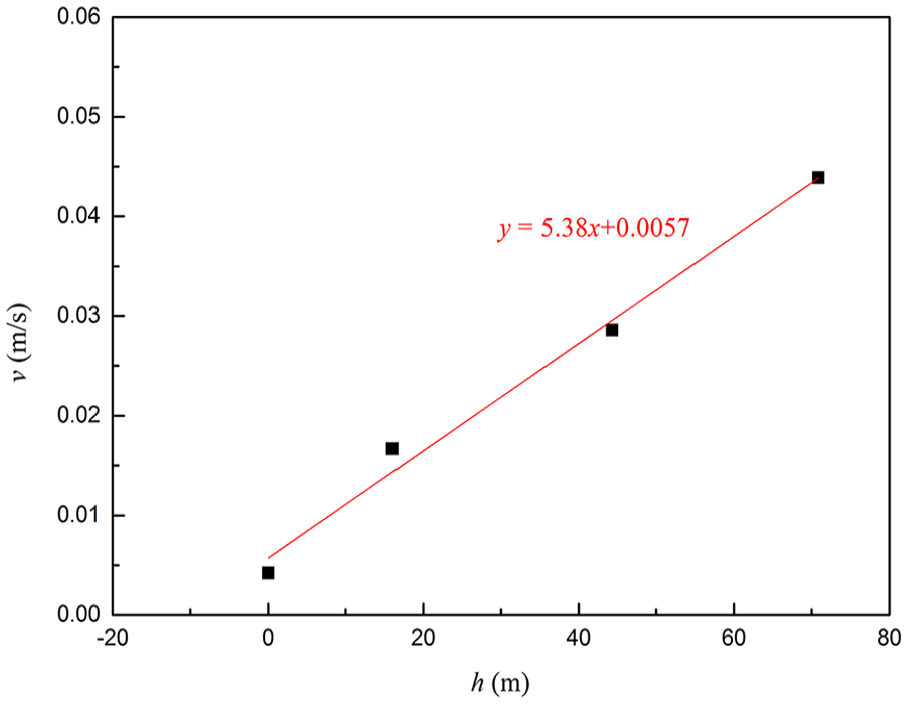
Velocity at the top of the atrium in cases with different fire source heights.
Conclusion
Through 1/10 scale experiments and full-scale numerical models, heat transfer and smoke flow filling progress in atriums was studied in this article. The following major conclusions were reached:
When the fire source was located at the bottom of the atrium, the actual HRR during a fire stabilized around the preset value. The higher the fire source was located, the larger the amplitude of HRR was and the sooner HRR started to fluctuate.
The temperature of the smoke layer interface was linearly positively related to Q2/3. When HRR was very low and the fire source was located at the bottom of the atrium, the fire smoke layer could not reach the top of the atrium. When designing smoke exhaust systems in atriums, the height of the smoke layer should be considered. If the smoke does not reached the top of the atrium but the exhaust outlet is designed at the top, the effectiveness of the smoke exhaust systems will be weaken, and the affecting zone of the fire will get enlarged as the fire smoke was exhausted from the top. This was not favorable for the smoke control. At best, the smoke exhaust vent is designed right at the height of the smoke layer.
When the fire source was located at the bottom of the atrium, the temperature in the atrium decreased with the height while the pressure increased with the height. In the atrium, ΔPmax was quadratically positively related to Q2/3. At the top of the atrium, the temperature rise was positively related to the fire source height and they were consistent with the Boltzmann model.
As the fire smoke flow rose up with a velocity, a relatively low-pressure area was generated below. The pressure was negatively index-related to the fire source height.
Footnotes
Declaration of conflicting interests
The author(s) declared no potential conflicts of interest with respect to the research, authorship, and/or publication of this article.
Funding
The author(s) disclosed receipt of the following financial support for the research, authorship and/or publication of this article: This work was supported by Sichuan Science and Technology Program (Grant No.2018FZ0098), the Opening Fund of State Key Laboratory of Fire Science (Grant No.HZ2018-KF01), and the Fundamental Research Funds for the Central Universities (Grant No.2682017CX079).