
Abstract
Storage grains before and after mildew are first subjected to thermal radiation experiments under different heat radiant flux conditions using a cone calorimeter. The chemical constitution, morphology, operational taxonomic unit analysis, and the degree of mildew of four disaggregated storage grains under the same proceeding conditions are studied. Normal grain and mildewed grain are significantly different in terms of the mounts and species of mold. The peak heat release rate and the total heat release of mildewed grains are higher than that of normal grains. Under different heat radiations, the fire performance index of mildewed grains tends to be lower than that of normal samples, while the fire growth index value is just the opposite. The higher the heat radiation, the less the effect of mold on the fire performance index difference. Besides, the reciprocal of the square root time of sample ignition has a linear relationship with the heat flux.
Introduction
Cereal grains such as rice, corn, soybean, and wheat, are the world’s most popular food crops and also are the basis of staple diet in most developing countries. 1 Besides consumption growth and continuing population, the global food demand will increase at the lowest for another 40 years. It is reported that by the year 2050, the global population is expected to reach 9.1 billion, and approximately 70% extra food production will be required.2–4 Around 2% of the world’s best croplands, mainly in Asia and Africa where cities are growing the quickest, will be lost. 5 Therefore, it is hard to produce food crops for everyone with the incremental world’s population and increased urbanization.6,7 Besides, a huge amount of moldy storage grains with inflammable characteristic feature increases the risk of fire hazards. A fire broke out in the Lindian storage in Heilongjiang Province, China (May 31, 2013). A total of 78 grain storage rafts were over-fired with a loss of 47,000 t of grains. On May 13, 2018, a fire broke out in shed No. 3 warehouse of Zhongliang Grain Hengyang that stored more than 6800 t of rice. Once a fire breaks, it will cause huge disasters and losses. So, it is imperative to study grain storage security.
Combustion of fuels such as peat, grasses, cotton, and polymers has been studied for decades, but there has been no comprehensive studies on storage grain fire.8–11 The causes of fires in stored grain can be divided into two categories: self-heating combustion and combustion caused by external ignition sources. The first category combustion of grain is caused by the heat liberation from the microbial metabolic activity of grain itself and microorganisms.12–14 The main environmental factors affecting metabolic activity of microorganisms are moisture and temperature.15–17 The second category flaming combustion is cause by external ignition sources such as high ambient temperature, flame or remote combustion object, static electricity, and so on. 18 The overwhelming majority of fire hazards including storage grain fire hazards are caused by external factors.19–21
Cone calorimeter (cone) is a new generation of combustion performance tester for materials based on the principle of oxygen consumption. The cone calorimeter has been considered as one of the most effective tools to analyze the smoke hazards and heat release of materials under different fire environments.22–24 The heat release rate (HRR) can be recorded by measuring product gas flow and the consumed oxygen from the oxygen concentration. 25 Therefore, the exothermic process of grain combustion can be recorded and analyzed with the aid of cone calorimeter.
In recent years, countries around the world have gradually attached importance to the development of security technologies of grain reserves. The U.S. Department of Agricultural Research Center has developed the Stored Grain Advisor system, which can monitor the temperature, moisture, and pest information of grain piles. Zhengzhou Cotton and Linen Engineering Technology Design Institute has developed a device, for automatic monitoring of temperature and humidity of cotton seed stacks, which has played a good role in preventing and controlling cotton stack fires. The Chinese Academy of Work Safety has studied the safety management and hidden danger−grading methods for cotton and linen grain reserves. However, the current research on grain heat disasters is mainly focused on the macro level, and its micro-mechanism is not clear. Thus, the chemical constitution, morphology, operational taxonomic units (OTUs) analyses, and degree of mildew of four disaggregated storage grains under the same proceeding conditions are studied. The combustion behavior and fire safety of storage grain before and after mildew have also been studied. This work provides a theoretical guidance for fire prevention and control in grain warehouses.
Experiment
Sample information
All samples which were stored in 2018 were gathered from the grain depot in Anhui Province. According to the GB5009.3-2016 standard, the initial moisture content of normal corn (NC), normal soybean (NB), normal rice (NR), and normal wheat (NW) are 12.46%, 7.71%, 10.15%, and 13.38%, respectively. Samples were selected and placed in a polypropylene bucket with an internal temperature of 30°C for 3 months to obtain mildewed grains. All samples were kept at a constant temperature of 30°C for 1 day before the test to ensure the same moisture content.
Experiment methods
According to the characteristics of the amplified region, based on the IonS5TMXL sequencing platform, a single-end method was used to construct a small fragment library for single-end sequencing. The Reads cut filter, OTUs clustering, and species annotation and abundance analysis can reveal the species composition of the sample.26,27
Under the condition of weak acidity, free fatty acid (FFA) reacts with copper salt to form copper soap, which has a characteristic absorption peak at 715 nm. In a certain range, the content of FFA has a linear relationship with the degree of color development. Wash the tissue with distilled water, absorb the surface water with absorbent paper, mash it, and then add reagent 1 with the mass rate (g) and extraction volume (mL) of 1:5–10. The system was extracted by shaking for 3 h, centrifuged at 4°C for 10 min and the supernatant was collected for testing.
During the process of growth and reproduction of stored grain fungi, an asexual spore, called conidia, is formed outside the cell. The conidia differs according to the type of fungus, which is one of the basis for fungal identification. Storage fungi produce a certain number of conidia. The spores in the fragment were replaced with water, and the number of spores was detected by counting using a microscope under specified conditions.28,29 The number of spores reflects the status of stored mold and is an important indicator of grain storage security.
Cone test was performed using a cone calorimeter (Fire Testing Technology, Sussex, UK), following the ISO5660-1 standard. 30 The schematic diagram of the experimental apparatus is illustrated in Figure 1. The sample surface is 25 mm below the bottom of the conical heater, and the electric spark is 15 mm above the sample surface. Besides, the cone heater can provide a constant heat radiation flux to a sample’s area of 100 mm × 100 mm. Before the experiment, the surface radiation of the cone calorimeter is calibrated. During the experiment, different temperatures for the experiment were set according to the calibration results. The samples were weighed into the reactor (10 cm × 10 cm × 20 cm) according to their stacking density and the ventilation rate is controlled at 24 L/min. Tin paper is placed on the bottom and sides of the sample container to play the role of carrier. Four kinds of grains were divided into eight groups according to whether they were mildewed or not. For corn, wheat, and soybean, 100 g for each sampling were taken, and 80 g for rice because of the large porosity.
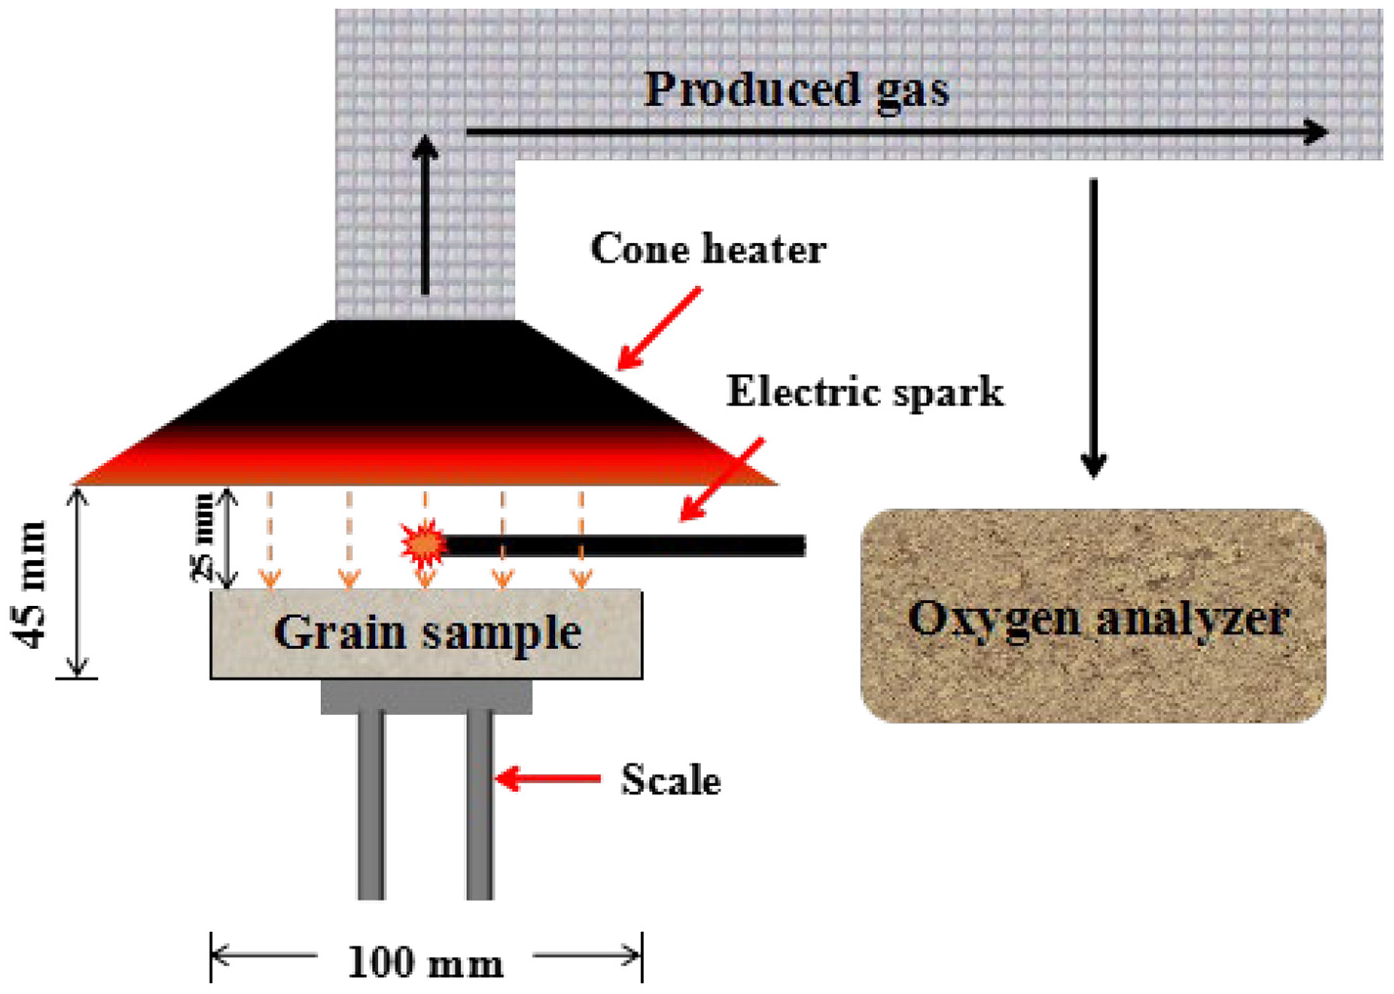
Schematic diagram of the cone calorimeter and sample.
Raman spectra were obtained by a SPEX-1403 laser Raman spectrometer (SPEX Co., O’Fallon, MO, USA) with a 514.5-nm argon laser line. Morphology of normal and mildewed grain was monitored using a FEI Sirion 200 scanning electron microscope (SEM; JEOL Co., Ltd., Tokyo, Japan) with an acceleration voltage of 5 kV.
Results and discussion
Analysis of four storage grains before and after mildew
Table 1 shows the main chemical component analysis of the following samples: NC, MC, NB, MB, NR, MR, NW, and MW. MC, MB, MR, MW represent moldy corn, moldy soybean, moldy rice, and moldy wheat, respectively. The starch and fat content of moldy grain are lower than that of normal grain, while the cellulose and protein content are just opposite, which may be due to the fat hydrolysis in the moldy process, and the reproduction of fungus promotes the protein generation. Furthermore, soybean has higher protein and fiber content and lower starch content than other samples. Nevertheless, for corn, rice, and wheat, the major chemical components such as starch, protein, crude fiber, and fat differ slightly to some extent.
Main chemical component analysis of samples.
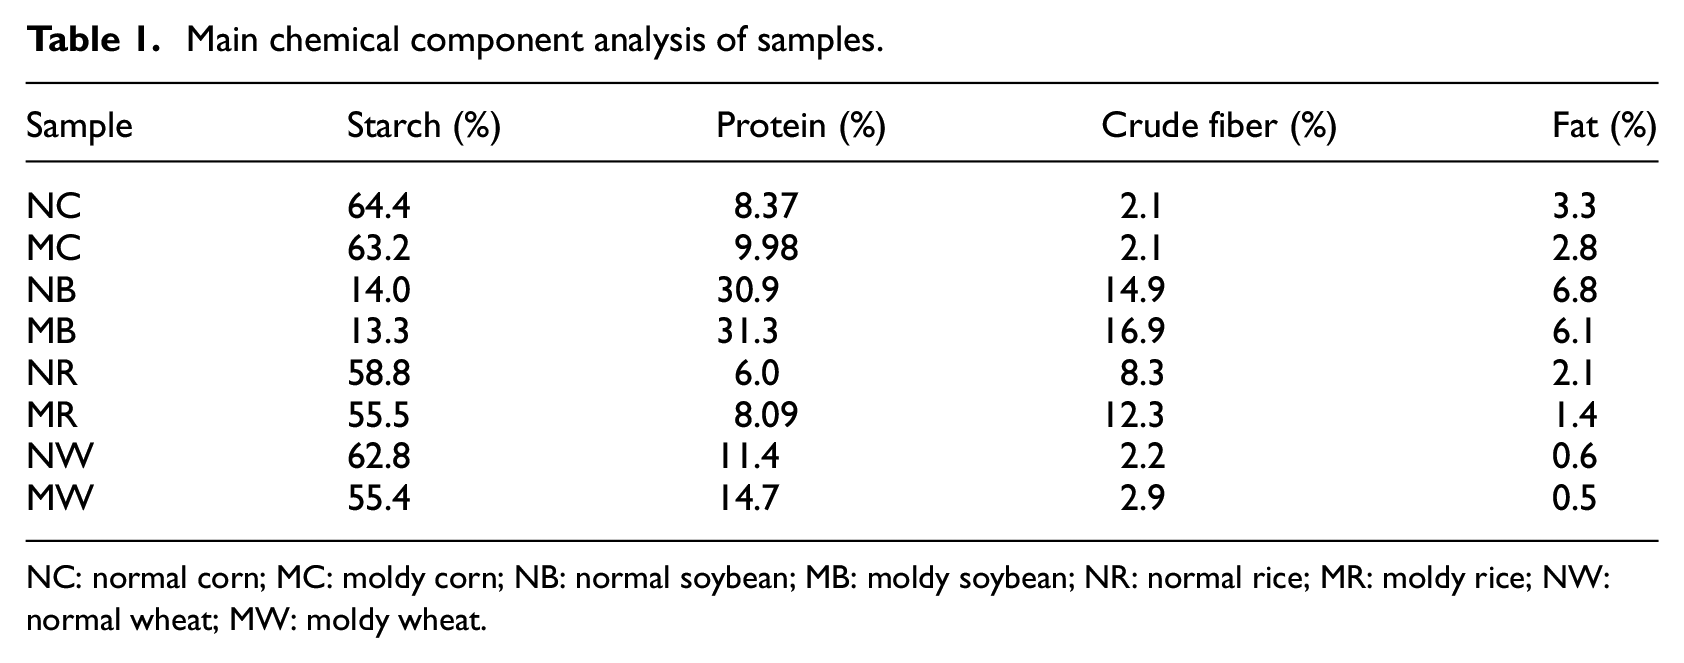
NC: normal corn; MC: moldy corn; NB: normal soybean; MB: moldy soybean; NR: normal rice; MR: moldy rice; NW: normal wheat; MW: moldy wheat.
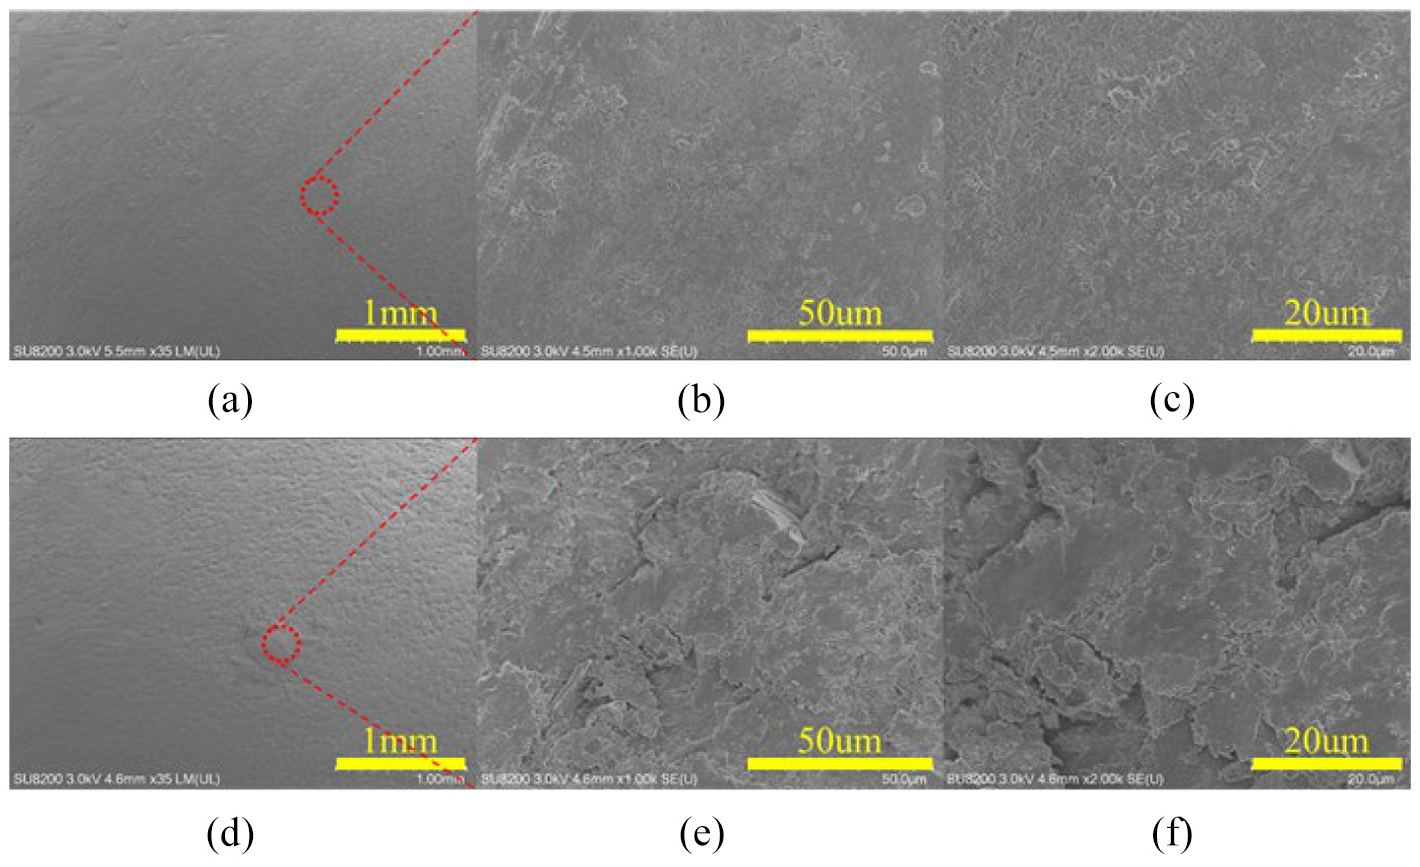
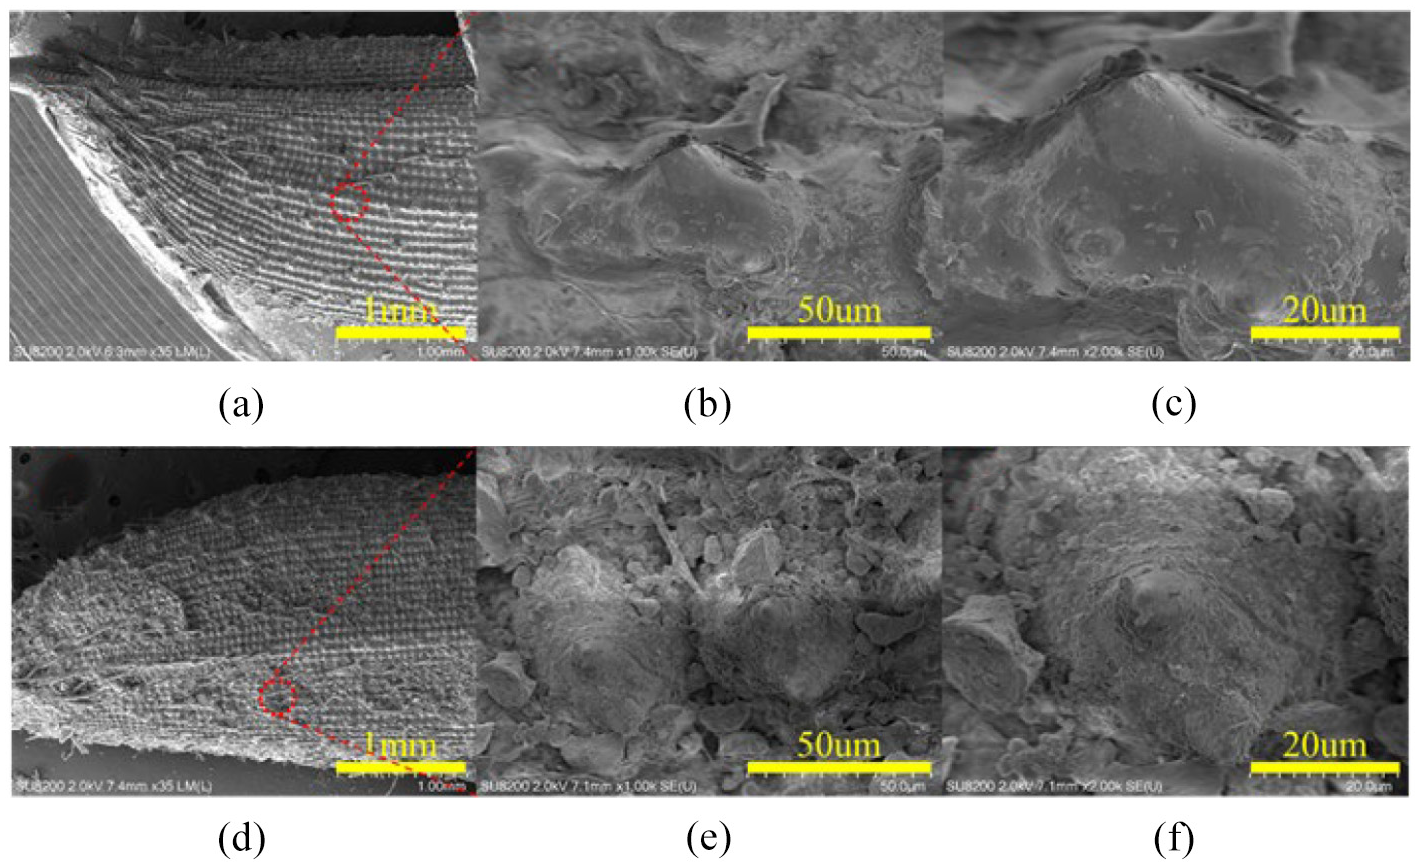
Figures 2 to 5 show the SEM images of normal grain and mildewed grain. From the figure, we can see that the surface of normal grain is smooth, and there is no obvious colony after magnification observation. However, after the mildew of grain, the surface becomes rough and a large number of fungus can be observed after amplification. When the fire starts, the protective layer on the surface of moldy grain is more easily damaged, due to the change of grain’s surface structure, which may have negative impact on the fire security of storage grain.
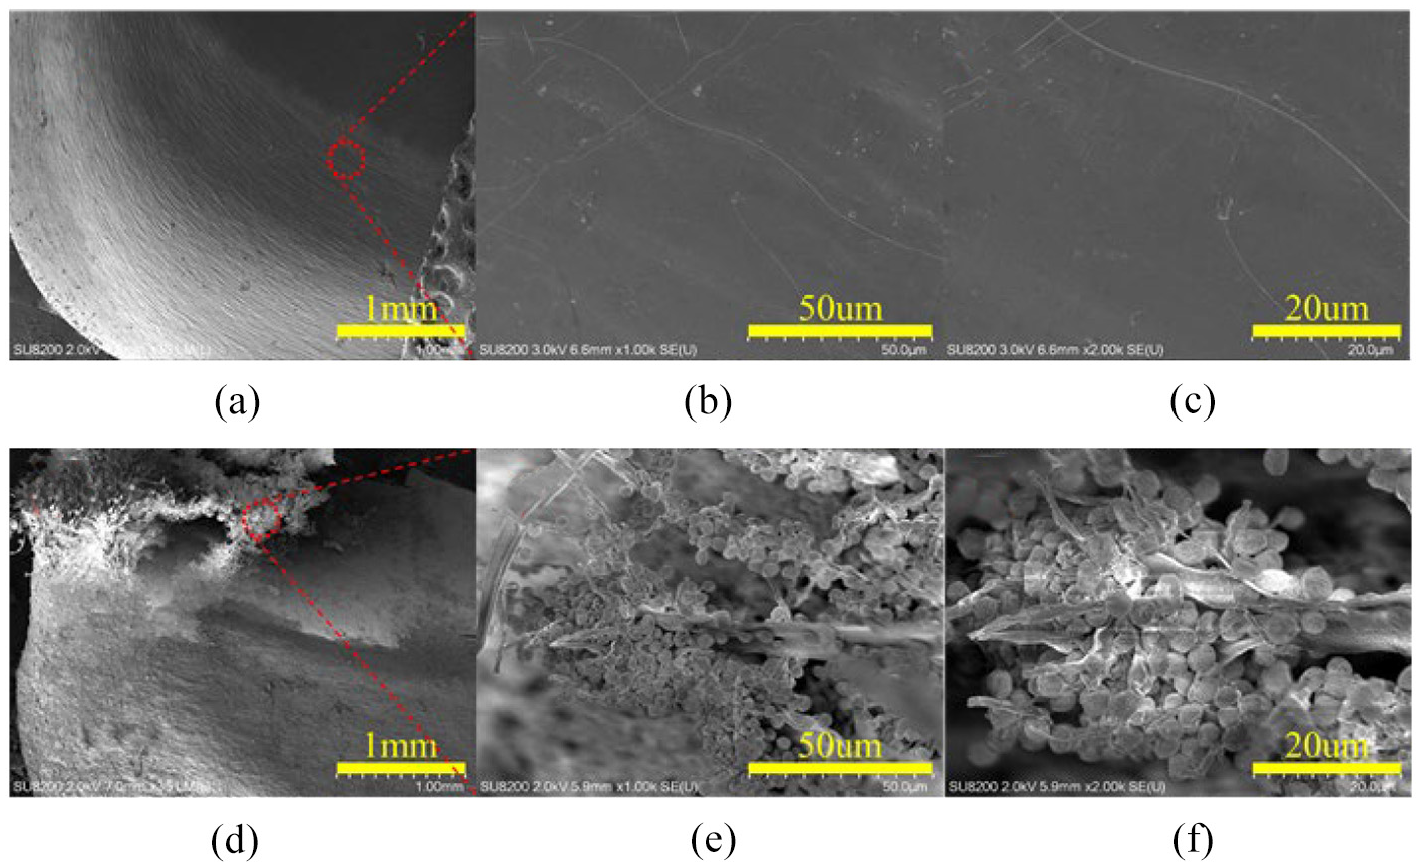
SEM images of (a)–(c) NC and (d)–(f) MC.
SEM images of (a)–(c) NB and (d)–(f) MB.
SEM images of (a)–(c) NR and (d–f) MR.
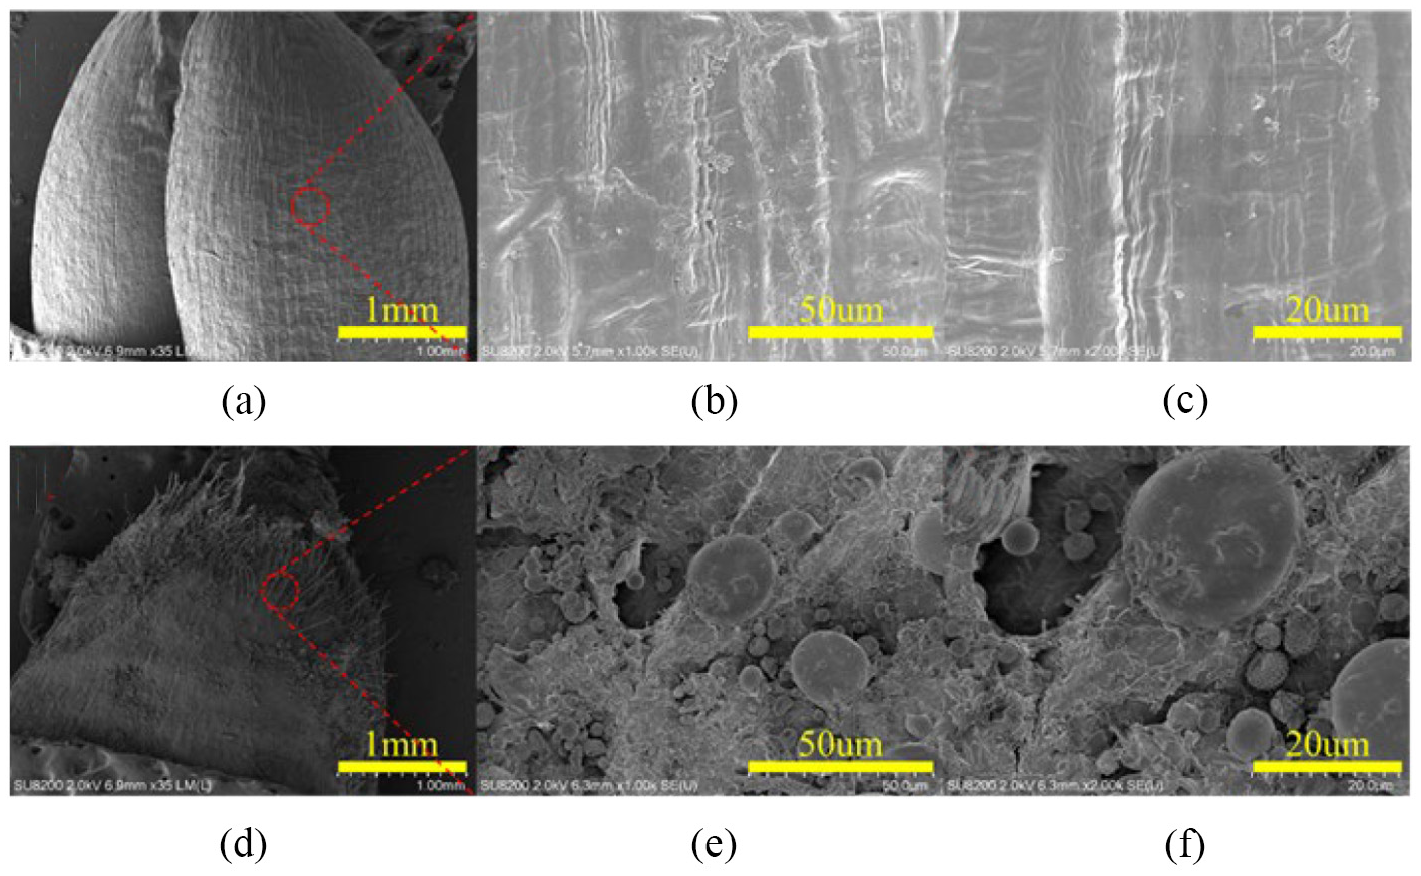
SEM images of (a)–(c) NW and (d)–(f) MW.
In general, if the similarity between sequences, such as different 16S rRNA sequences, is greater than 98%, it can be defined as an OTU. Each OTU corresponds to a different 16S rRNA sequence, that is, each OTU corresponds to a different microbial species.31,32
The OTU analysis of grain before and after mildewed was presented in Figure 6. We have repeated the OTU analysis for at least 3 times for each sample and corresponding error of our experiment is reflected in Figure 5 (numbers 1–3). The abscissa represents different types of mildewed and normal grains, and vertical coordinate represents relative abundance. Different colors indicate different species at different taxonomic levels. According to the results of species annotation, the top 10 species with the highest abundance in each sample or group at each classification level (phylum, class, order, family, and genus) is selected. A column accumulation diagram of relative species abundance is displayed to visually view the species and their proportion with higher relative abundance in each sample at different classification levels. As an example, the relative abundance histogram of species at class level is shown in Figure 6 and that of species at other levels are shown in Supplemental material (Supplemental Figure S1 to S6). There are great differences in the relative abundance of different kinds of grains, indicating that the microbial species and composition differ greatly. Similarly, the relative abundance of the same kind of grain is also quite different before and after mildew.
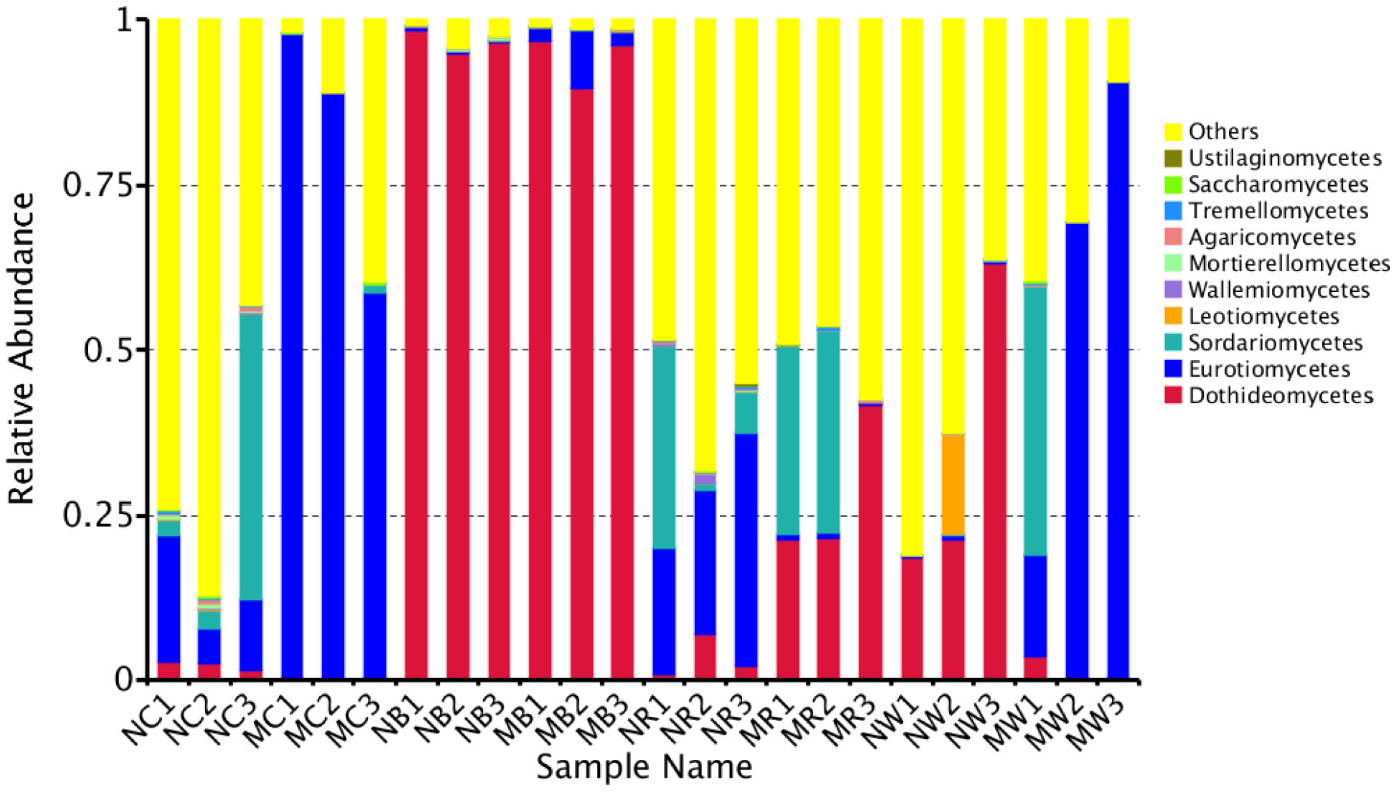
Histogram of species relative abundance at the class level.
The OTU analysis of corn at the level of phylum, class, order, family, genus and the relative abundance of Ascomycota, Eurotiomycetes, Eurotiales, Aspergillaceae, Aspergillus, Aspergillus chevalieri of mildewed maize increase to Top 1, respectively. For mildewed rice, at the gate level, the relative abundance of Ascomycota of mildewed rice increases slightly. At the class level, mildew increases the relative abundance of Dothideomycetes and Sordariomycetes, while the relative abundance of Eurotiomycetes decreases. At the order level, the relative abundance of Pleosporales of mildewed samples increases, while the relative abundance of Europiales decreases. At the family level, mildew increases the relative abundance of Phaeosphaeriaceae and Nectriaceae, while the relative abundance of Aspergillaceae decreases to nearly 0. At the genus level, the relative abundances of Fusarium and Phaeosphaeria of mildewed samples increases, and the relative abundances of Aspergillus are decreased. At the species level, mildew increases the relative abundances of Phaeosphaeria calamicola; and the relative abundances of Aspergillus penicillioides and Sarocladium zeae decrease. For wheat, mildewed increases the relative abundance of Ascomycota at the gate level. At class level, the relative abundance of Eurotiomycotes of mildewed wheat increases and that of Dothideomycotes decreases. At the order level, mildewed increases the relative abundance of Europiales and that of Plesporales decreases, which is totally opposite to the trend of rice. At the family level, mildew increases the relative abundance of Aspergillaceae and decreases the relative abundance of Pleosporaceae. At the genus level, the relative abundance of Aspergillus of mildewed samples increases and the relative abundance of Alternaria decreases. At the species level, mildew increases the relative abundance of Aspergillus chevalieri, and reduces the relative abundance of Alternaria alternata. Interestingly, for soybeans, mildew has little effect on relative abundance at all classification levels. The relative abundances of Ascomycota, Dothideomycetes, Capnodiales, Mycosphaerella, Polytechnic inclusion, and Polytechnic trifolii are the highest at the level of phylum, class, order, family, genus species, and they always account for more than 90%. It is illuminated that soybean is difficult to mold during the experiment, which may be related to the protective effect of soybean epidermis.
Table 2 shows specific data of moisture content, FFA content, and mold number of samples before and after mildew. After the treatment of all samples, the moisture content of the same kind of grain is similar before and after mildew. FFA is not only the product of fat hydrolysis, but also is the substrate of fat synthesis. FFA concentration is related to lipid metabolism, glucose metabolism, and endocrine function, and can also reflect the quality changes in food storage. In Table 2, the FFA contents of normal grain (NR, NC, NW, and NB are 1.05, 1.27, 1.51, and 0.31 mg/g, respectively) are lower than that of mildewed samples accordingly (MR, MC, MW, and MB are 1.98, 4.79, 3.83, and 1.51 mg/g, respectively). Moreover, the spores of MR, MC, MW, MB counted by a microscope are significantly higher than that of normal samples by 269.2%, 2670.8%, 1115.3%, and 258.3%, respectively.
Moisture content, FFA, and spores of all samples.
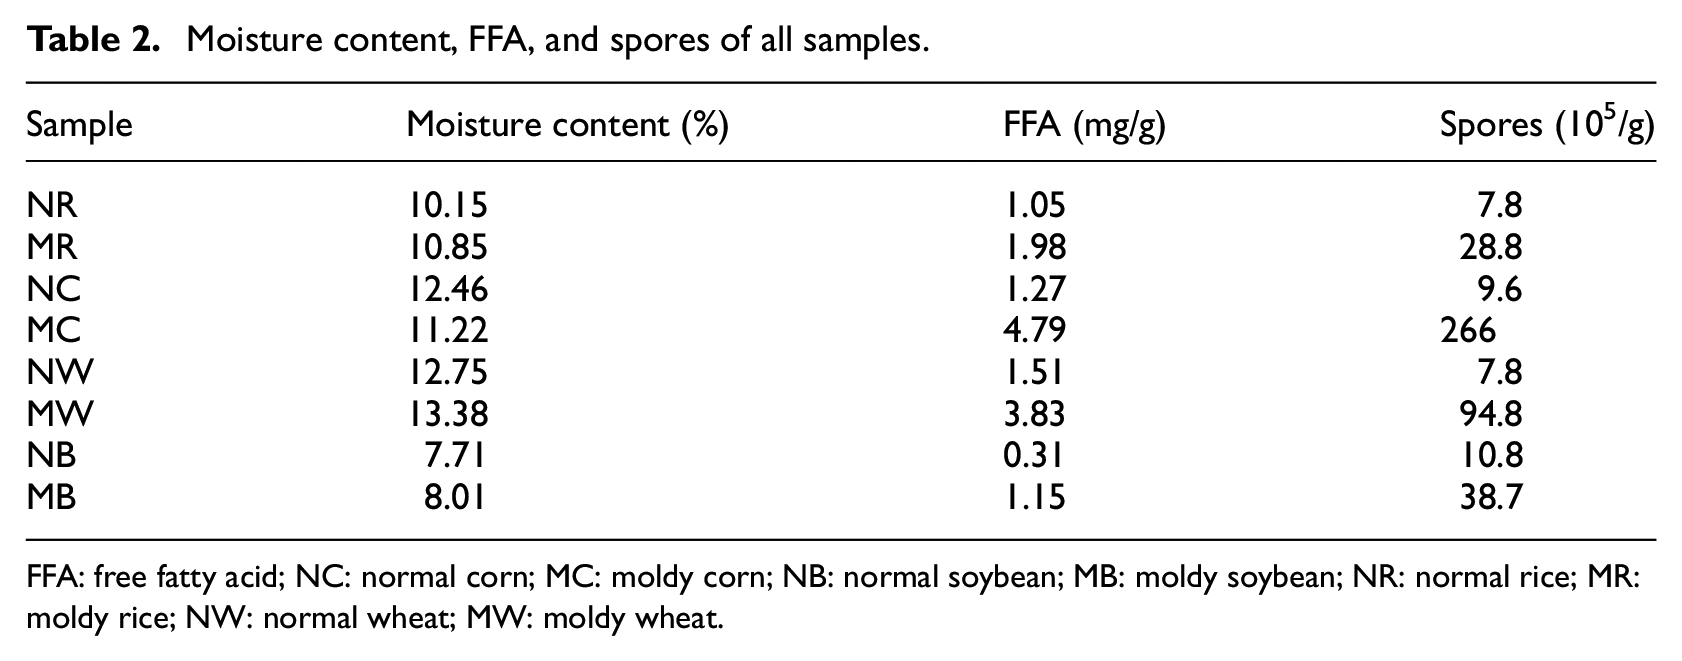
FFA: free fatty acid; NC: normal corn; MC: moldy corn; NB: normal soybean; MB: moldy soybean; NR: normal rice; MR: moldy rice; NW: normal wheat; MW: moldy wheat.
Analysis of fire security
The HRR curves of grains under different heat fluxes are shown in Figure 7 and Tables 3 to 6. When samples are subjected to heat flux, the samples will suffer from thermal degradation process to release inflammable products, thus causing ignition. Time to ignition (TTI) is an important parameter (unit: s) to evaluate the fire resistance of materials. It refers to the time from heating to continuous combustion of the material surface under the preset incident heat flux. TTI can be used to evaluate and compare the fire resistance of materials. With the increase of heat flux (25–55 kW/m2), peak heat release rate (pHRR) of grain increases and TTI decreases. Meanwhile, under low thermal radiation (25 kW/m2), except for the soybean, the pHRR value of moldy grain is larger than that of normal one, and moldy grain is more easily ignited. Moreover, it is not difficult to find that the pHRR of soybean (about 450 kW/m2) is significantly higher than that of other grains, and showing a similar trend in protein content (Table 1).
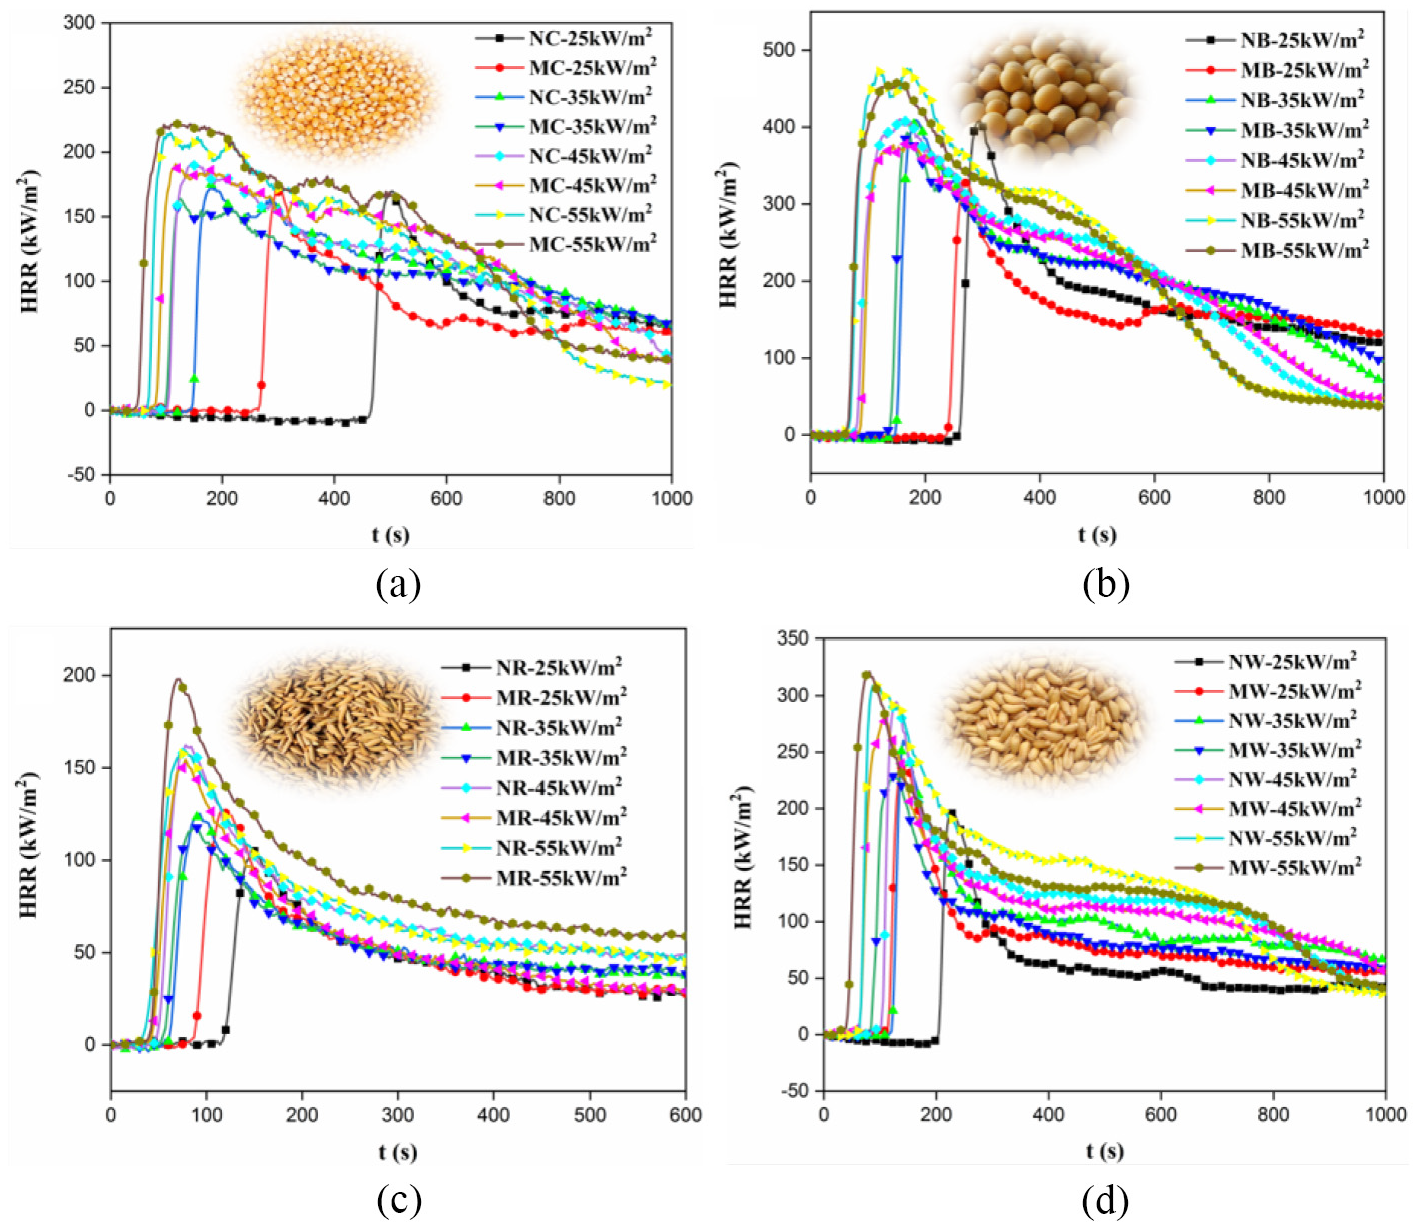
HHR curves of (a) corn, (b) soybean, (c) rice, and (d) wheat.
Related cone results of normal corn and mildewed corn.
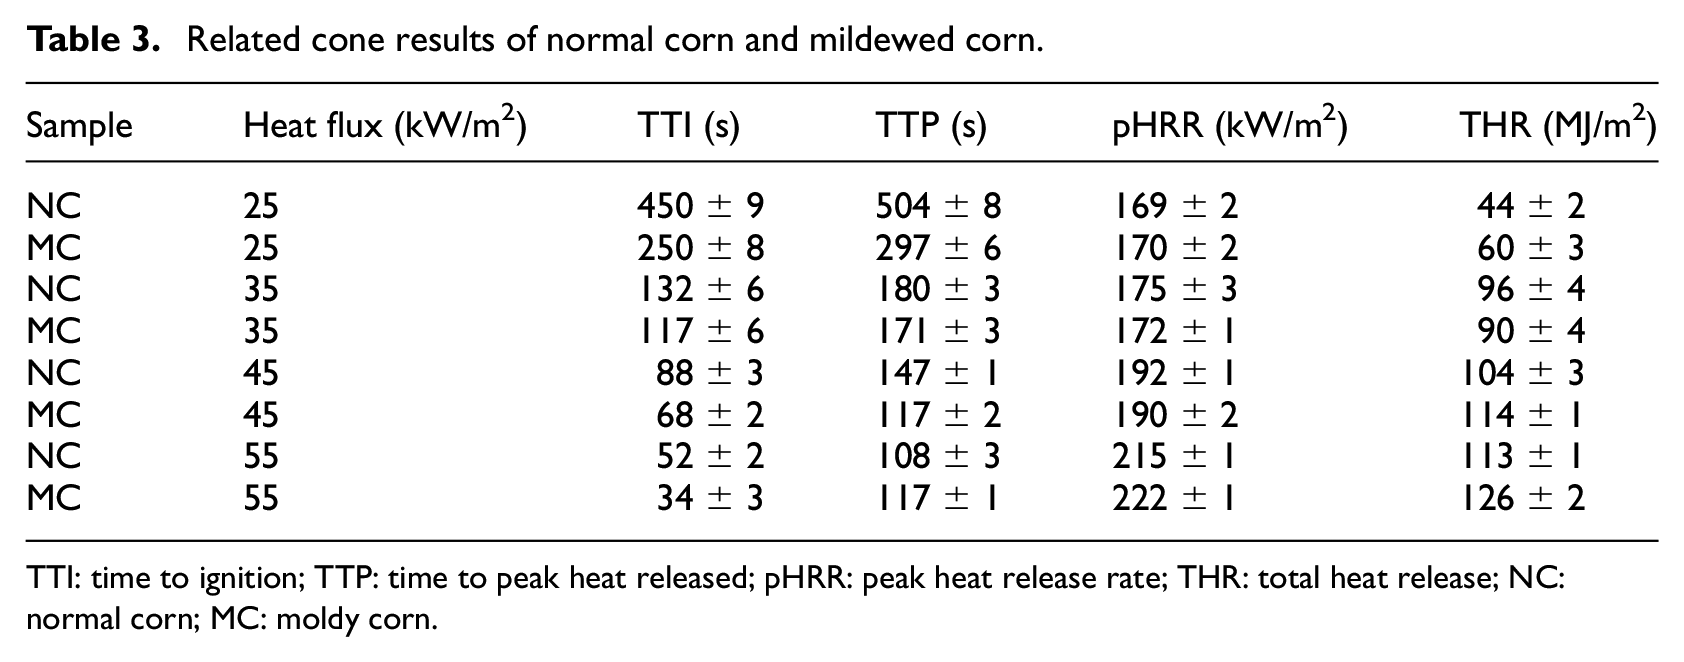
TTI: time to ignition; TTP: time to peak heat released; pHRR: peak heat release rate; THR: total heat release; NC: normal corn; MC: moldy corn.
Related cone results of normal soybean and mildewed soybean.
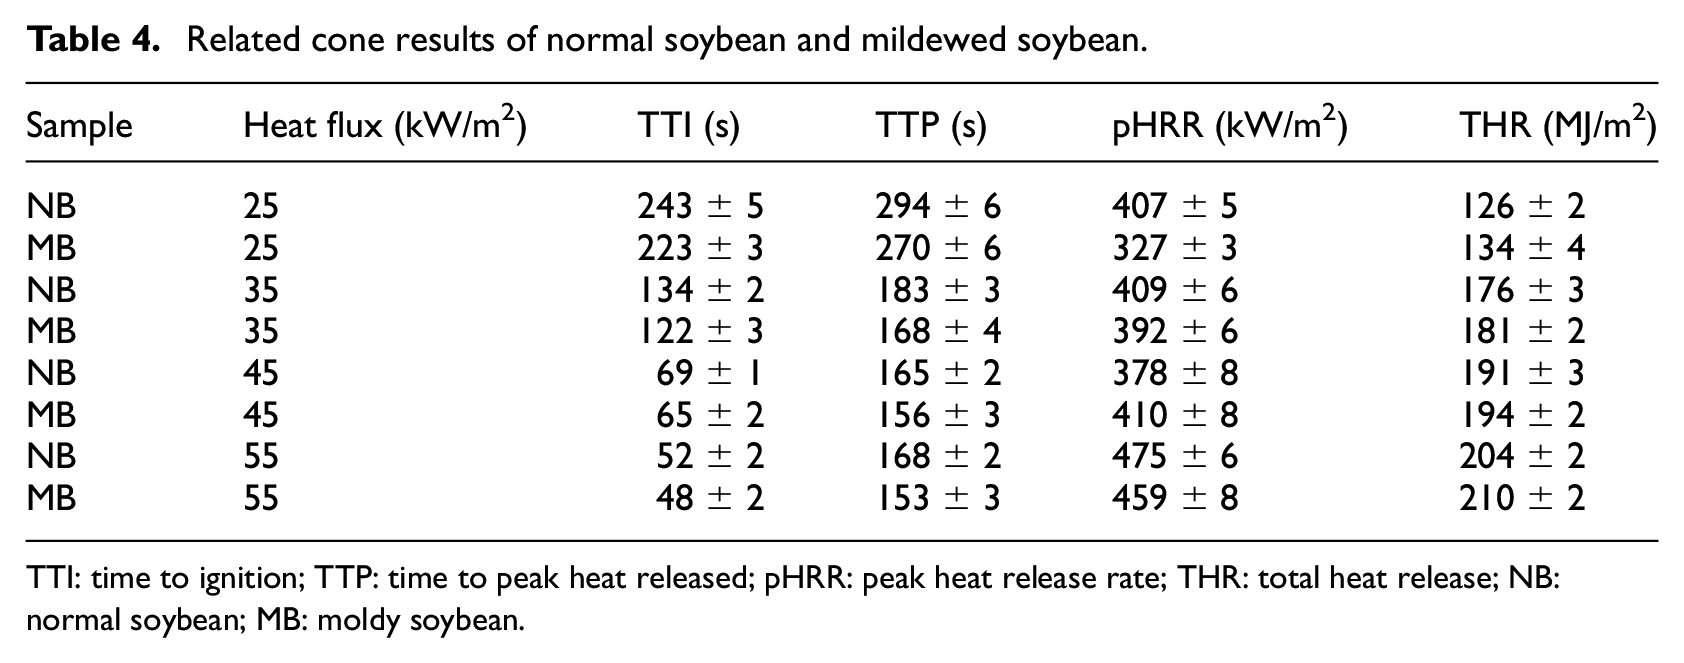
TTI: time to ignition; TTP: time to peak heat released; pHRR: peak heat release rate; THR: total heat release; NB: normal soybean; MB: moldy soybean.
Related cone results of normal wheat and mildewed wheat.
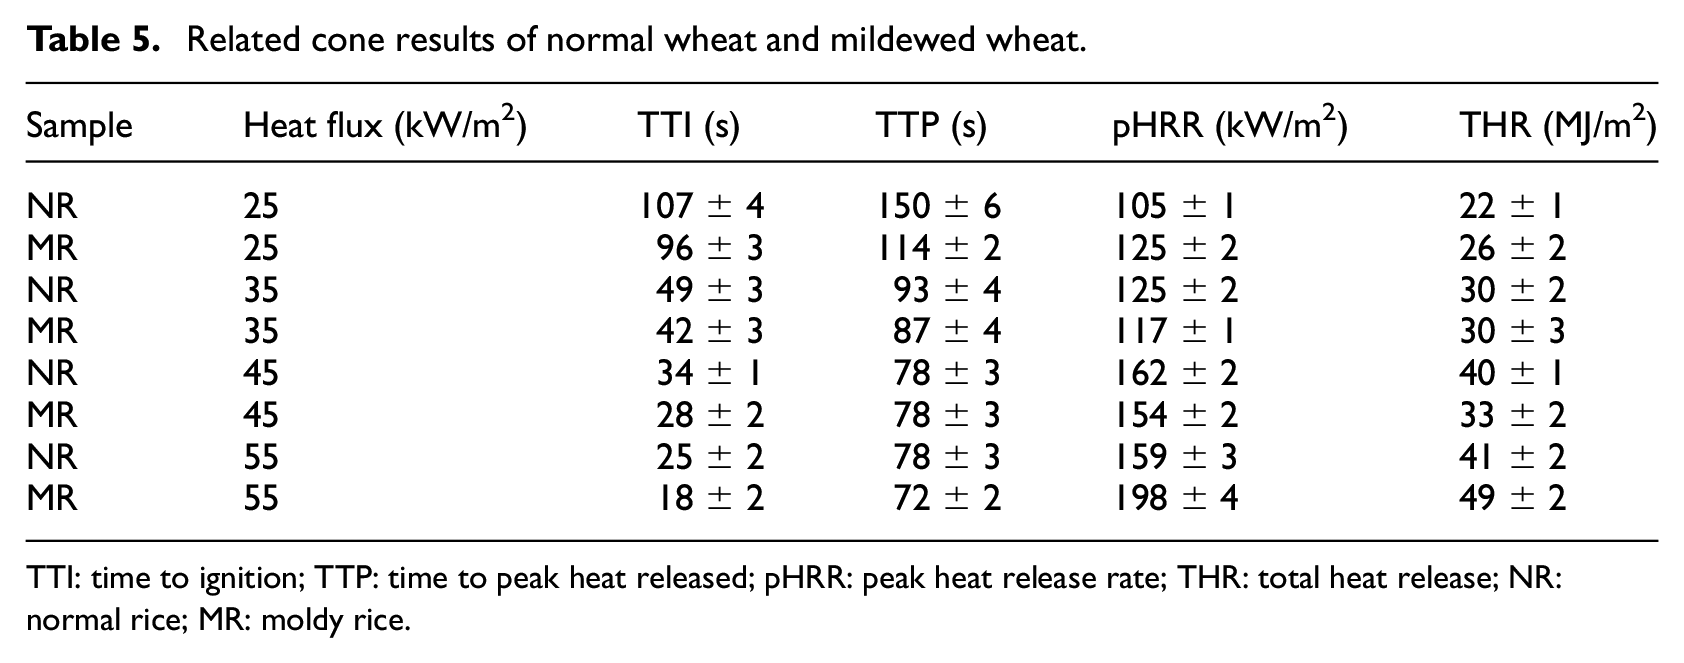
TTI: time to ignition; TTP: time to peak heat released; pHRR: peak heat release rate; THR: total heat release; NR: normal rice; MR: moldy rice.
Related cone results of normal rice and mildewed rice.
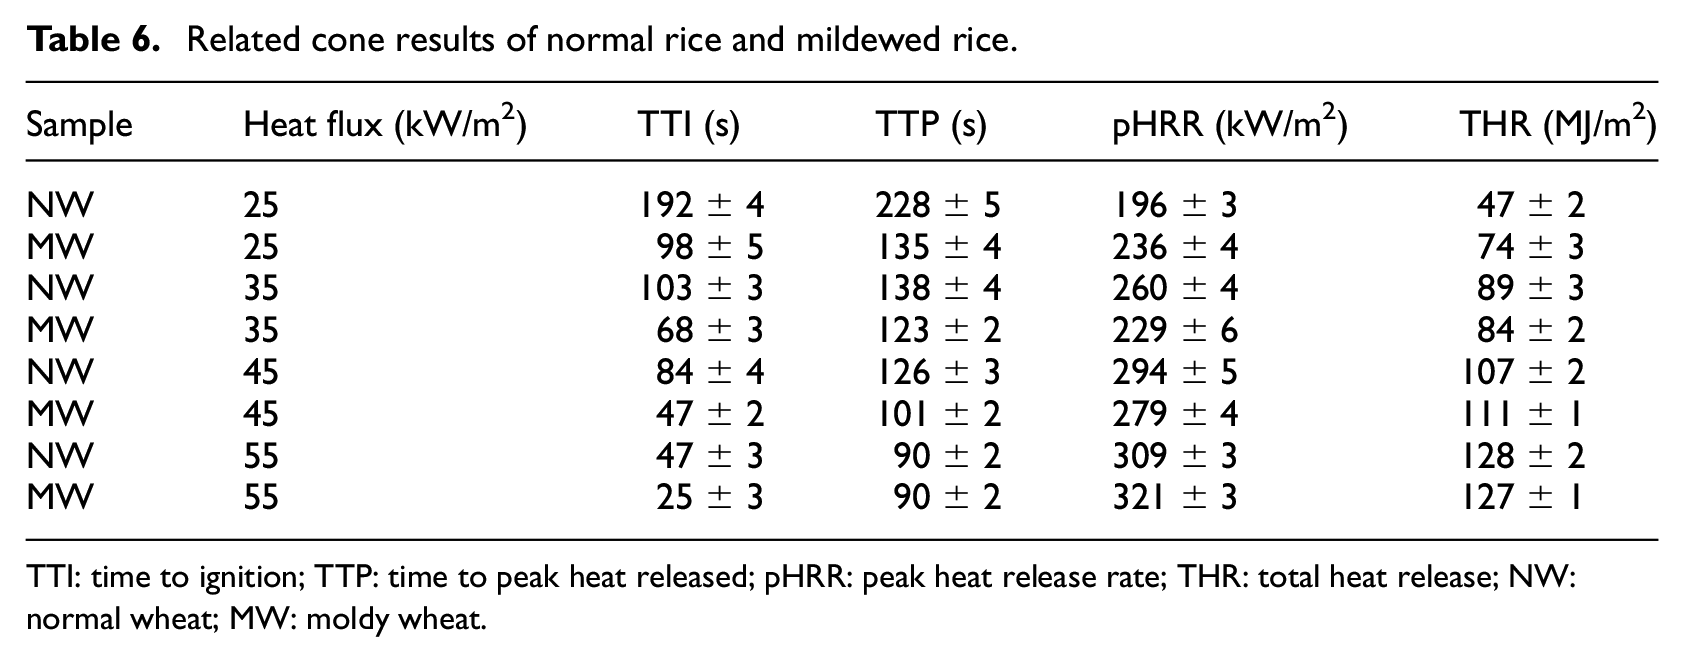
TTI: time to ignition; TTP: time to peak heat released; pHRR: peak heat release rate; THR: total heat release; NW: normal wheat; MW: moldy wheat.
The total heat release (THR) is gained by the integration of HRR with a function of time. The THR curves of (a) corn, (b) soybean, (c) rice, and (d) wheat are shown in Figure 8 and Tables 3 to 6. The results show that the change trend of THR is similar with that of pHRR. With the increase of radiation flux (25–55 kW/m2), THR value of grain increases, while under the same thermal radiation, THR value of moldy grain is higher. It is noteworthy that when the heat radiation is at 25 kW/m2, the THR value of mildewed grain is significantly higher than normal samples. Nevertheless, when the heat flux increases to 55 kW/m2, expect for rice, the THR values of moldy samples are similar to normal samples, which shows that mildew mainly affects THR values at low radiation power.
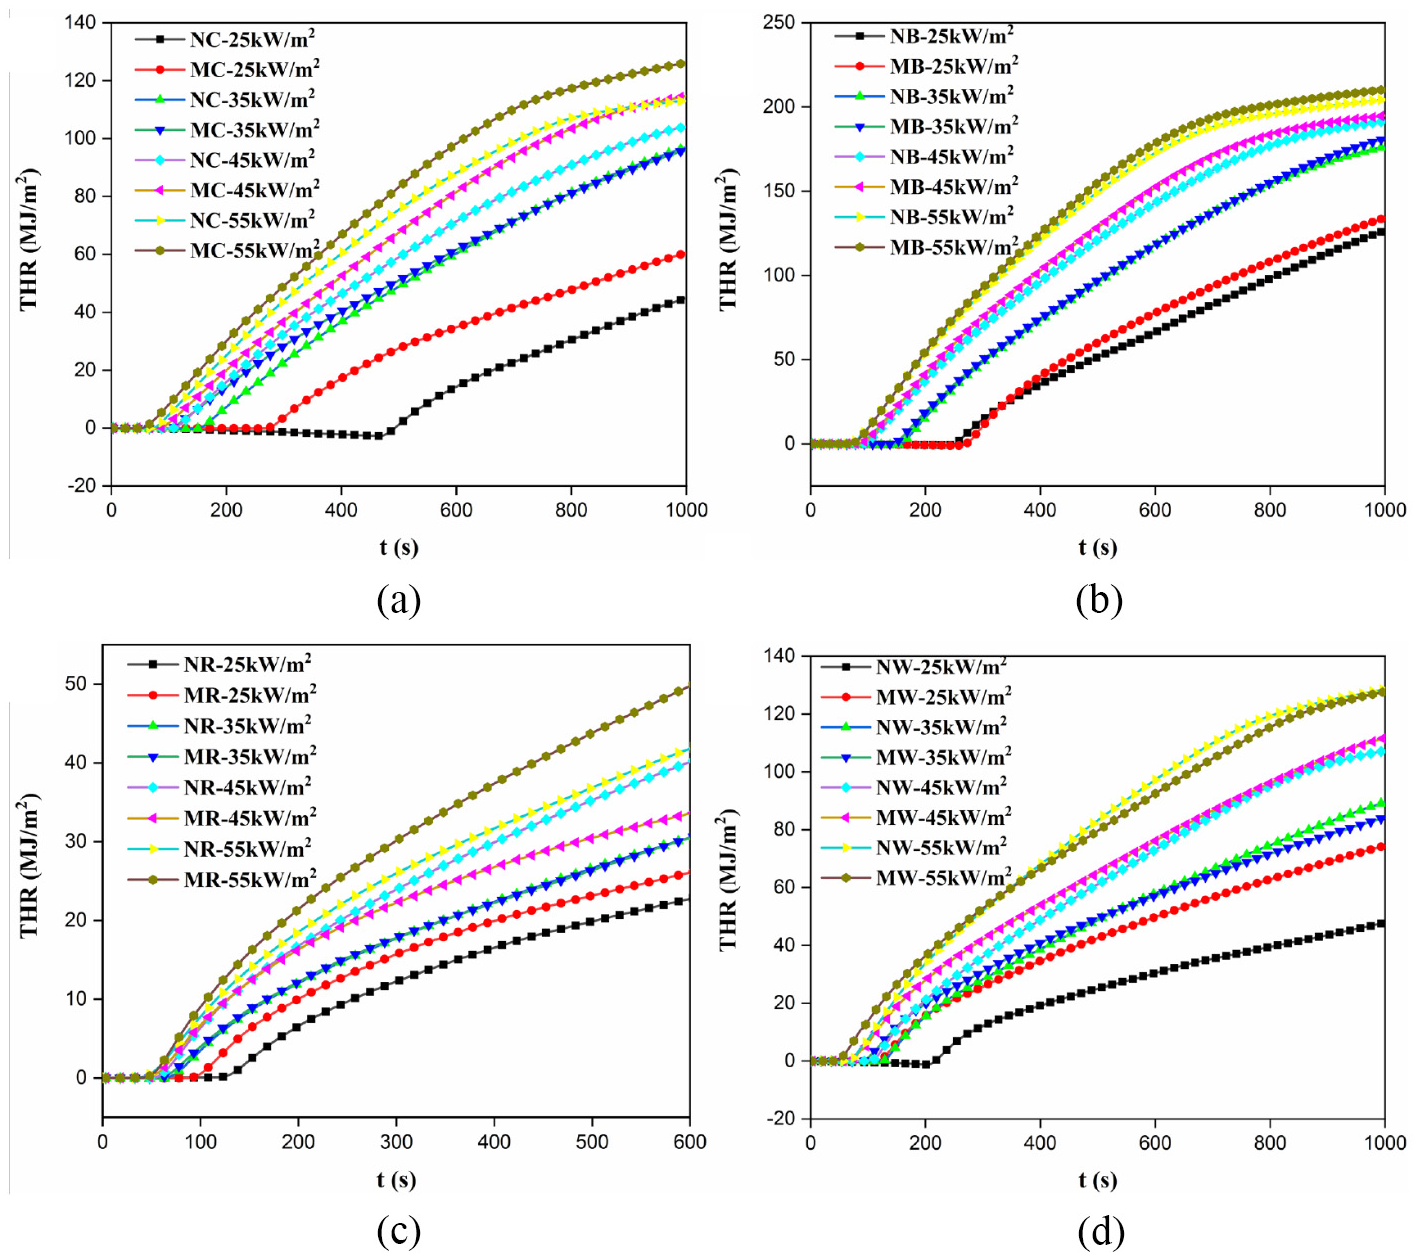
THR curves of (a) corn, (b) soybean, (c) rice, and (d) wheat.
Supplemental Tables S1 to S4 show the related cone results of normal grain and mildewed grain under low radiation flux. The results show that mildew reduced the ignition time of the sample and the critical thermal radiation is also affected by the variety and moldy degree of grain.
Fire propagation index (FPI) and fire growth index (FGI) are also used to evaluate the fire safety of grain. FPI is defined as the ratio of TTI to pHRR, which reflects the flame resistance of the material after ignition. The larger FPI value represents lower hazard of the material. FGI is defined as the ratio of pHRR and time to progression (pHRR (TTP); the time from heating to continuous combustion of the material surface under a given incident heat flow), which indicates the spread speed of the fire. 33 The larger FGI value represents higher hazard of the material. FPI and FGI curves in Figure 9 show that with the increase of thermal radiation, FPI value decreases sharply and FGI value increases rapidly. There is a trend that the FPI values of moldy samples are lower than that of normal samples and the FGI values are just opposite.
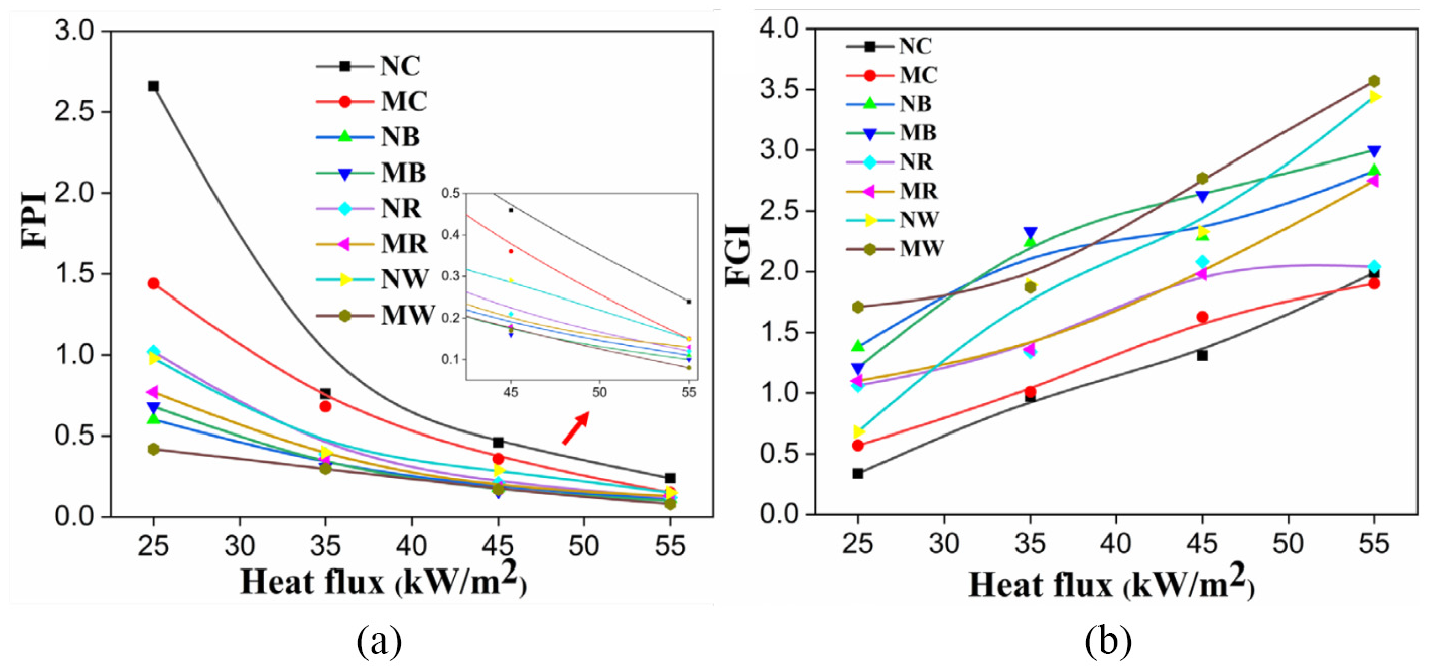
(a) FPI and (b) FGI curves of samples under different heat radiation fluxes.
When the sample is exposed to thermal radiation flux, the sample will undergo a thermal degradation process, which releases flammable products and probably cause a fire. As shown in Figure 10 and Tables 3 to 6, TTI decreases with the increase of heat flux. When the heat flux is just 25 kW/m2, the TTI of NC, MC, NB, MB, NR, MR, NW, and MW are high to 450.6, 250.8, 243.5, 223.6, 107.5, 96.5, 192.7, and 98.6 s, respectively. It is easy to find that the mildewed one is easily ignited. The increase of heat radiation flux (from 25 to 35 kW/m2) leads to sharp decrease in TTI. The TTI of NC, MC, NB, MB, NR, MR, NW, and MW are decreased with a rate of 70.6%, 53.2%, 44.9%, 45.3%, 54.2%, 56.3%, 46.4%, and 30.6%. However, under the heat flux of 45 and 55 kW/m2, it can be found that the TTI of all samples is similar, which indicates that the TTI is not significantly influenced at high heat flux. To prove the above point, the curves of TTI–1/2 and steady heat flux are presented in Figure 9. It is obvious that TTI–1/2 shows a linear relation to steady heat flux. 34
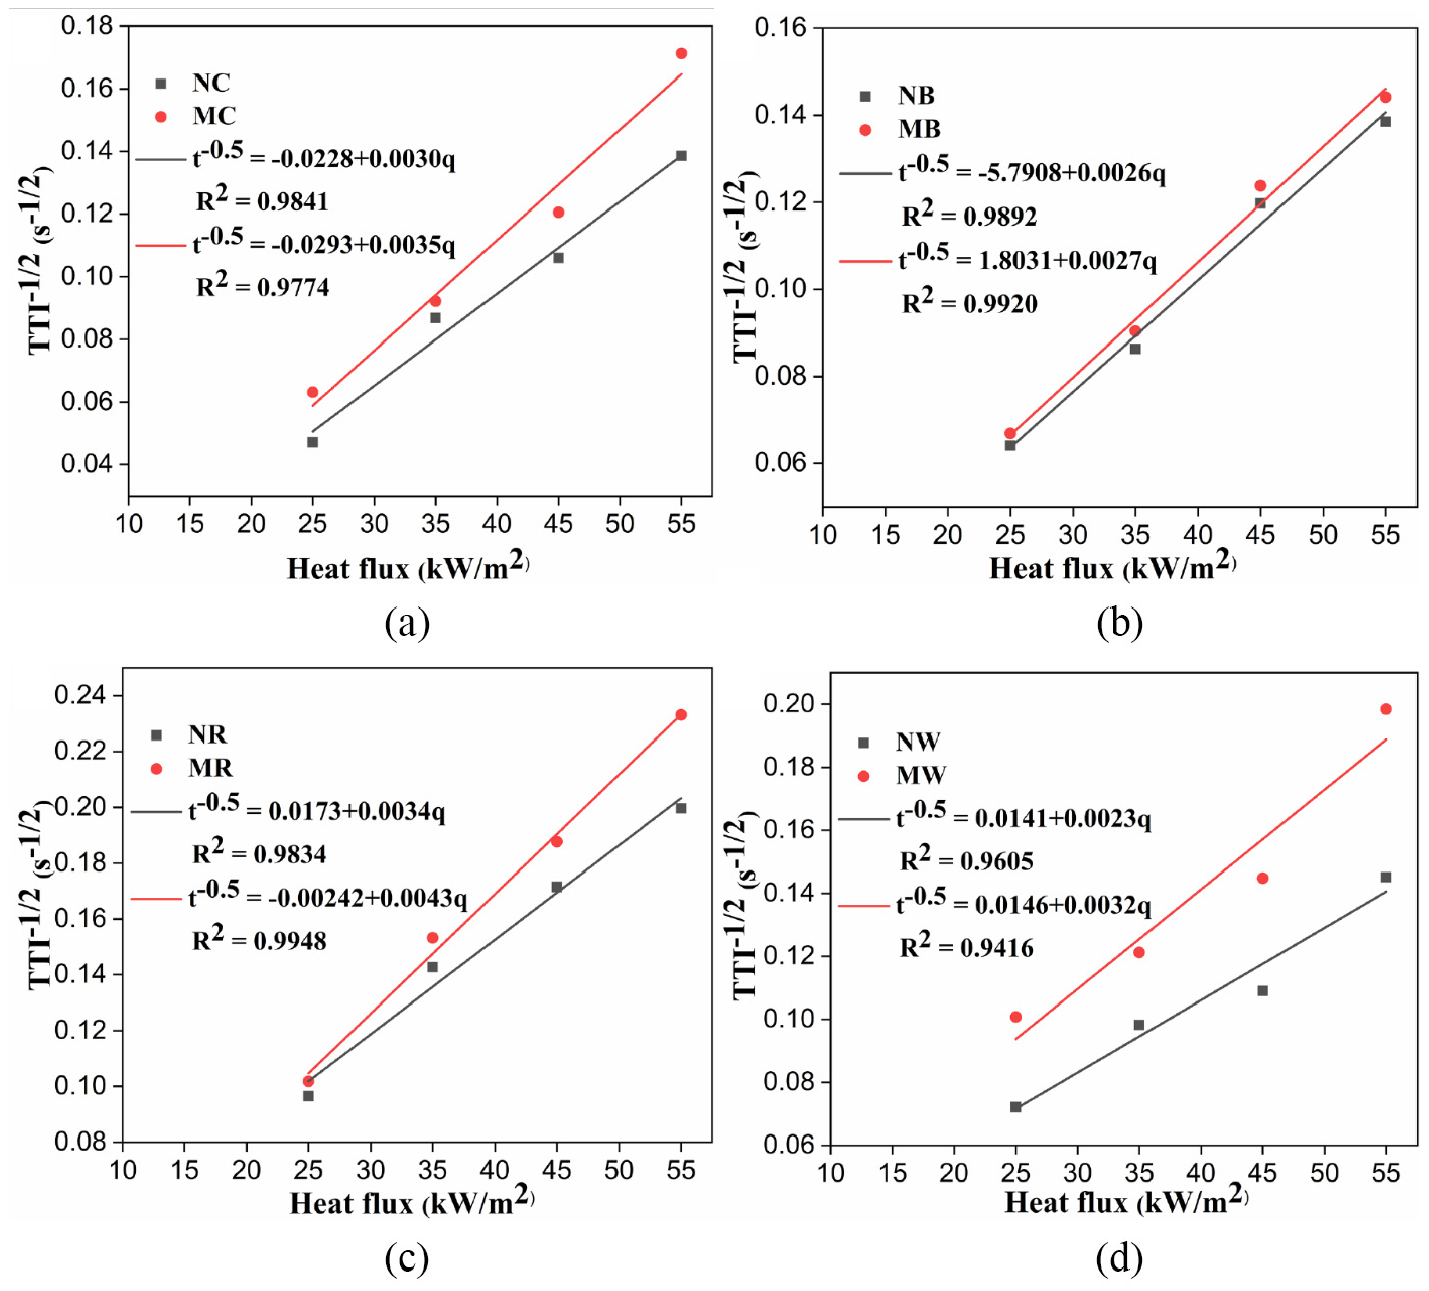
TTI–1/2 values versus heat fluxes curves of (a) corn, (b) soybean, (c) rice, and (d) wheat.
Analysis of combustion residues
The combustion residues of samples are the most direct evidence for investigating the flaming combustion behavior; and the corresponding digital photos of all samples are shown in Figure 11. When the heat flux is 55 kW/m2, structure of char at the surface of grains is completely different. We also find that the ash content of moldy grain is significantly higher than that of unmodified grain. This is because the surface structure of moldy grain is fragile under the action of microorganism, the carbon layer structure formed during combustion is loose, and the carbon layer is prone to oxidative decomposition.
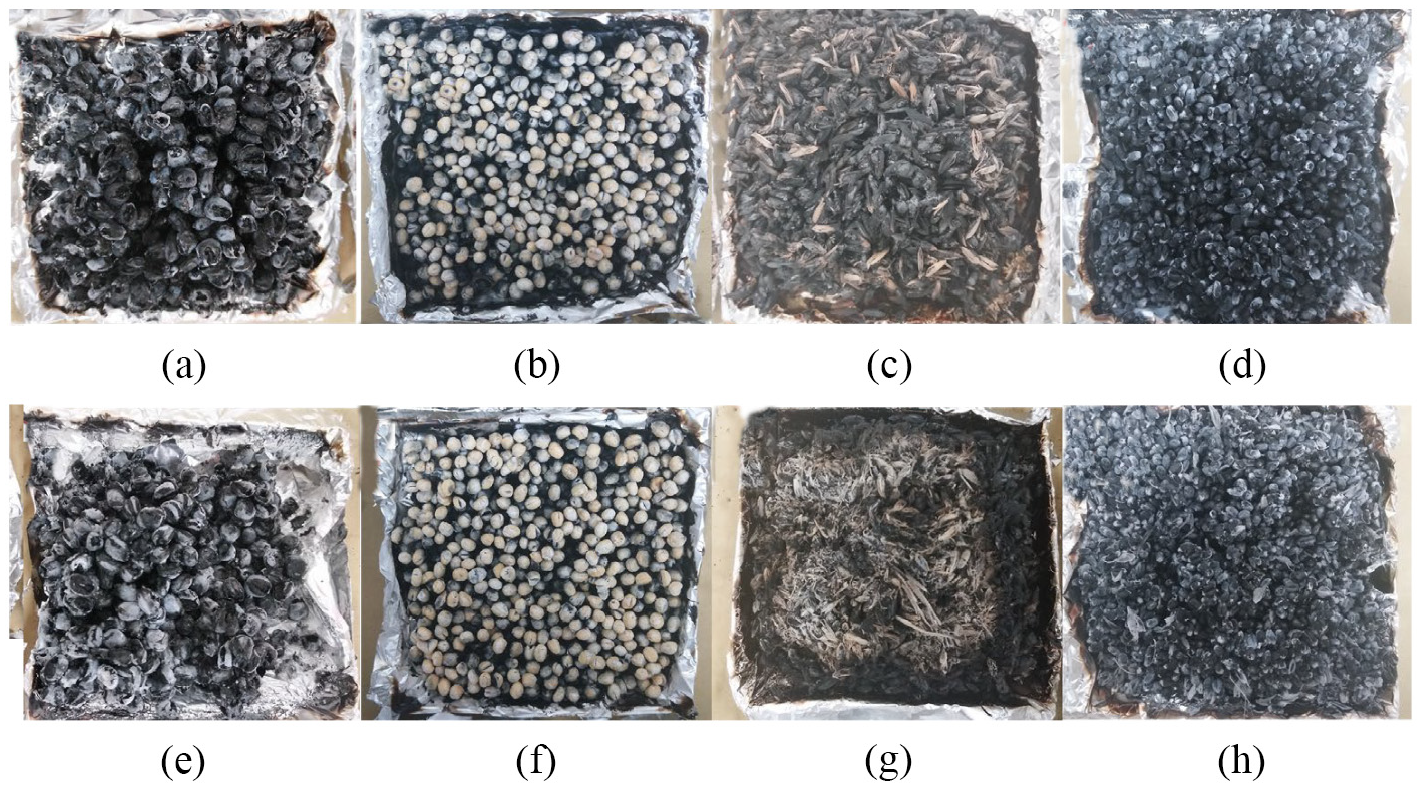
Digital images of char residues of (a) NC, (b) NB, (c) NR, (d) NW, (e) MC, (f) MB, (g) MR, and (h) MW under heat radiation flux of 55 kW/m2.
Raman analysis is used to estimate these formed carbonaceous residue layer and the corresponding spectra are also shown in Figure 12. The D band (around 1360 cm–1) corresponds to amorphous char while the G band (around 1580 cm–1) is assigned to the organized graphitic structures of the char layer. 35 The intensity ratio of D band to G band (ID/IG) corresponds to the degree of graphitization of char layer and lower ID/IG value shows higher graphitization of char layer. 36 We find that the mildewed samples have large ID/IG value which shows lower degree of graphitization of carbon. The char residues with good graphitization degree show the better physical barrier effect. Thus, pHRR of normal sample is lower than that of mildewed one. SEM images shown in Figures 2 to 5 and the changes of main chemical component analysis of grain before and after mildew also confirmed that molds could change the structure of samples and then influence the chemical components of grains. Eventually, both factors work together increasing the flammability of mildewed grains.
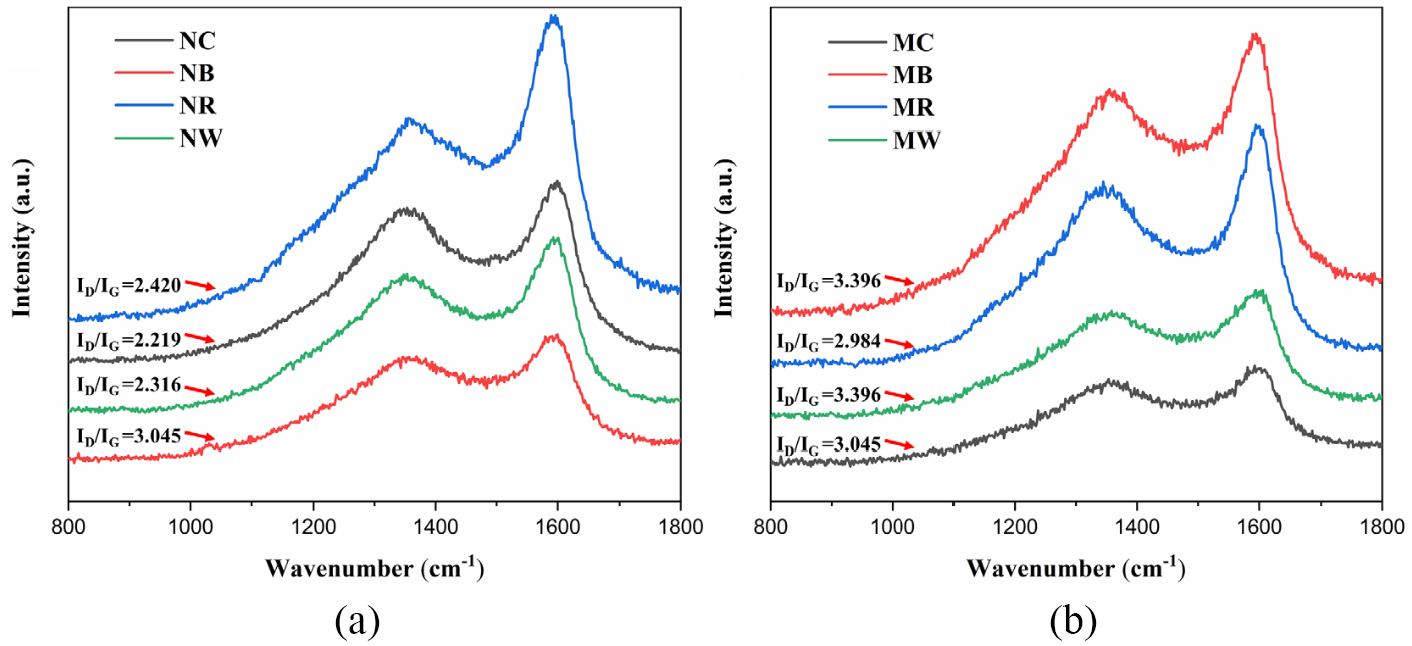
Raman spectra of (a) normal samples and (b) mildewed samples combustion residue under 55 kW/m2 heat radiation flux.
Conclusion
Inflammable characteristic feature produces an inevitable challenge for the storage of grain, especially for mildewed grain. The chemical constitution, morphology, OTU analysis, and degree of mildew of four disaggregated storage grains under the same proceeding conditions are studied. Normal grain and mildewed grain are significantly different in terms of the mounts and species of mold. The HRR and THR of grains increase and the TTI of grains decreases with the increase of heat radiation flux (25–55 kW/m2). Meanwhile, mildewed grains have higher HRR and THR than normal grains, and are more likely to be ignited. It is worth noting that the pHRR and protein content of soybean are significantly higher than that of other grains. In addition, Raman analysis shows that the graphitization degree of char residues of mildewed sample is lower than that of normal one. The FPI and FGI curves show that with the increase of heat radiation, the FPI of each grain decreases sharply and the FGI rises rapidly. The higher the heat radiation, the less the effect of mold on the FPI difference. Besides, the FPI value of mildewed grains tends to be lower than that of normal samples, while the FGI value is just the opposite.
Supplemental Material
supplemental_material – Supplemental material for Combustion behavior and fire security of storage grains before and after mildew
Supplemental material, supplemental_material for Combustion behavior and fire security of storage grains before and after mildew by Jingwen Wang, Heng Yu, Weijian Chen, Wei Cai, Liang Cheng, Junling Wang, Xin Jin, Lei Song, Xiaowei Mu and Yuan Hu in Journal of Fire Sciences
Footnotes
Declaration of conflicting interests
The author(s) declared no potential conflicts of interest with respect to the research, authorship, and/or publication of this article.
Funding
The author(s) disclosed receipt of the following financial support for the research, authorship, and/or publication of this article: This work was supported by the National Key Research and Development Program of China (grant number: 2017YFC0805900).
Supplemental material
Supplemental material for this article is available online.
Author biographies
References
Supplementary Material
Please find the following supplemental material available below.
For Open Access articles published under a Creative Commons License, all supplemental material carries the same license as the article it is associated with.
For non-Open Access articles published, all supplemental material carries a non-exclusive license, and permission requests for re-use of supplemental material or any part of supplemental material shall be sent directly to the copyright owner as specified in the copyright notice associated with the article.