
Abstract
Through the combustion experiments on the cables and servers in a data room, the combustion characteristic parameters of the materials were obtained, and the materials were analyzed and evaluated from the aspects of heat release rate, gas concentration, flue gas temperature, and so on. The results show that network cable and electric cable can be ignited during the cable combustion test. In the overall fire combustion experiment of single server and the server group with three cabinets, the fire process is divided into three stages: initial growth stage, stable combustion stage, and combustion attenuation stage. The heat release rate, flue gas temperature, and CO2 concentration of the overall experiment have three peaks, respectively, 58, 98, and 134 kW; 100°C, 152°C, and 232°C; 1314, 2514, and 2988 ppm. The research results can provide some reference for design of fire protection system in data rooms.
Introduction
With the rapid development of science and technology, people enter a new era with big data, cloud computing, and artificial intelligence as the mainstream. In the background of increasing customer demand, the data room industry is developing vigorously, the number of licensed enterprises and cabinets increase, energy efficiency level improves, and the market scale continues to expand. 1 At present, the construction scale of single data room is increasing, especially operators, Internet enterprises, information technology research institutes, and related enterprises. For example, MICROSOFT, TENCENT, ALIBABA, AMAZON, WALMART, and other well-known international enterprises have their own large data rooms. In addition to these large companies, some small- and medium-sized enterprises in the market will also build some small data rooms due to their own development needs. So, data rooms have great potential in various fields in the future. 2
Data room contains many precisions, electrical components, and equipment.3,4 In recent years, data rooms have developed on a large scale all over the world. So, the fire safety of data equipment rooms has always attracted much attention. The researchers mainly conducted theoretical research on the fire characteristics, fire prevention and control, and selection of fire extinguishers in data rooms. Wires and cables have been identified as potential fire sources for residential buildings, nuclear power plants, aircraft, and spacecraft. Based on the experimental study of using ideal laboratory wires, a physics-based theory 5 was proposed to describe the unique wire fire phenomenon. The complex role of metal core in ignition, flame propagation, combustion, and extinction of wire fire was emphasized. The challenges and problems in the basic research using laboratory conductors as well as the application research using commercial cables were discussed in depth, to guide the future conductor fire research and the design of fireproof cables. Griger 6 pointed out the electronic and lighting equipment that caused the fire in the data room, and explained the considerations in fire management, including prevention, detection, and fire suppression. Based on the cone-shaped measuring instrument, changed the heat flux, cable number, spacing, and characteristics of the fire performance of small telecommunications halogen-free cables. Zavaleta 7 proposed an analytical fitting phenomenon to accurately predict the fire performance. Zeng et al. 8 evaluated the effects of corrosive smoke generated in data rooms fires on component combustion based on the comparison with corrosive or noncorrosive smoke known in previous studies. Simonson et al. 9 conducted combustion experiments on its equipment such as computer monitor and CPU in room ISO9705, and obtained their heat release rates.
By changing several test conditions (heat flux density, cable number, and spacing) and cable characteristics (sheath thickness and insulation quality), the fire resistance of halogen-free cables for small telecommunications was measured by cone calorimeter. An analytical phenomenological fit was proposed to accurately predict the main fire performance (ignition time, peak heat release rate, and peak time of heat release rate) from a set of 42 tests. The influence of sheath delayed the emergence of the main peak of heat release rate corresponding to the decomposition of nonflame-retardant insulation. 10 Chen et al. 11 studied the influence of short circuit or lightning strike on cable fire, and obtained the fire propagation behavior on a single cable and between two adjacent cables under different inclination working conditions. The research results show that with the increase of inclination, the particle size of molten material formed by the combustion of the upper cable increases, and the ignition position of the lower cable gradually moves downward. Kim et al. 12 proposed a fire risk assessment method for the installation of fire hydrants and riser systems on cable bridges. Xie et al. 13 carried out Thermogravimetric (TG), Fourier transform infrared spectrometer (FTIR), and Microscale combustion calorimeter (MCC) experiments on old and new cables to analyze the differences in fire performance between them. The results show that when the temperature is higher than 550 K, the mass loss of the old cable sheath is significantly greater than that of the new cable sheath in air or nitrogen atmosphere. The results also show that there is a main peak derivative thermogravimetry (DTG) in the old and new cable sheaths under each condition. However, the main peak DTG of the old cable sheath is greater than that of the new cable sheath, which indicates that the fire resistance of the old cable is relatively weak. Roberto et al. 14 conducted a fire test on the cable and found that the vertical cable axis promoted the fire propagation. Huang et al. 15 designed the fire spread model of cable through cable combustion experiment. Carcillo et al. 10 analyzed the fire characteristics of cables through comparative experiments of spacing and radiation intensity. Martinka et al. 16 analyzed the influence of cable spacing distance and heat transfer performance of other components on fire development through cone calorimeter experiment. Zavaleta et al. 17 designed a model to measure the heat release rate of multilayer cable in fire based on flash-cat.
Data room contains a huge number of electronic devices, which store a lot of data information. Once a fire breaks out, its loss is very huge. In recent years, researchers have mainly studied the fire characteristics of data rooms and made great contributions to the fire prevention and extinguishing of fires with data rooms. However, there is a lack of experimental research on the fire behavior of data room and little understanding of the combustion characteristics of cables and servers. Once a fire occurs, it cannot be effectively handled according to the fire characteristics, which will lead to property damage and data loss. Therefore, it is necessary to conduct exploratory experimental research on the combustibles in a data room.
Through field investigation, this article determines the fire hazard sources in a data room, and carries out experimental research on the combustion characteristics of combustibles in a data room. Typical cables and servers in a data room are selected for combustion experiments, respectively. According to the experimental results, the combustion phenomenon, heat release rate, flue gas temperature, and gas concentration in the standard combustion chamber of the cable and server unit are analyzed. It will provide an effective reference for the selection and design of fire protection system in data rooms.
Fire test research of data room
Test overview
The combustion characteristics of combustibles in a data room is an important factor to evaluate the level of fire risk. Objective statistics on the types of combustibles in a data room, and combustion experiments on typical combustibles to clarify their combustion characteristics are of great significance to the fire prevention and extinguishing design of a data room and to reduce the fire risk. This article plans to carry out fire characteristic combustion experiments on the most commonly used cables and servers in a data room. The standard for cable combustion test is the classification of combustion performance of cables and optical cables, and the server combustion test is based on the international standard ISO9705:1993 (Full Size Room Combustion Test Method for Surface Products).
Selection of test samples
To scientifically determine the experimental objects in data room, field research and relevant theories are carried out. According to the investigation of combustibles in a data room in Beijing, the number of category six unshielded twisted pair cables in the data room is the largest, reaching 1080 and 540 m, respectively. There are 486 servers in the data room. To sum up, category six unshielded twisted pair cables, electric cables, and servers in the data room are selected as the experimental objects.
The models of electric cables are WDZAYJY5 copper core low smoke halogen-free power (cable diameter is 25 mm) and category VI unshielded network cable (diameter is 6.3 mm), which are mainly used for power energy supply and network rate transmission supply in the data room. WDZA-YJV cable is made of PVC protective sleeve, cross-linked polyethylene insulation, and the network cable is made of PVC. The cables and network cables used are shown in Figure 1.
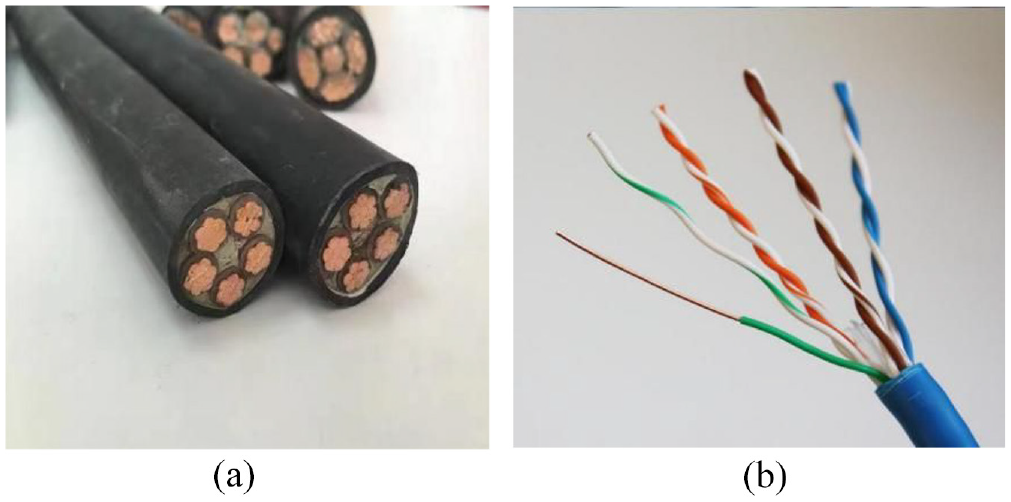
Physical drawing of cable: (a) WDZA-YJY5 copper core low smoke halogen-free electric cable and (b) Category VI unshielded network cable.
The sample used in the server experiment is the server produced by Dawning Information Industry Co., Ltd., and the model is ANQING EG630G-G20. The server is shown in Figure 2. Figure 3 shows the server cabinet.
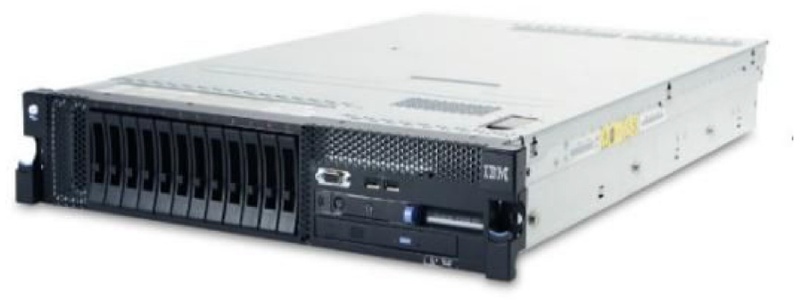
EG630G-G20 server.
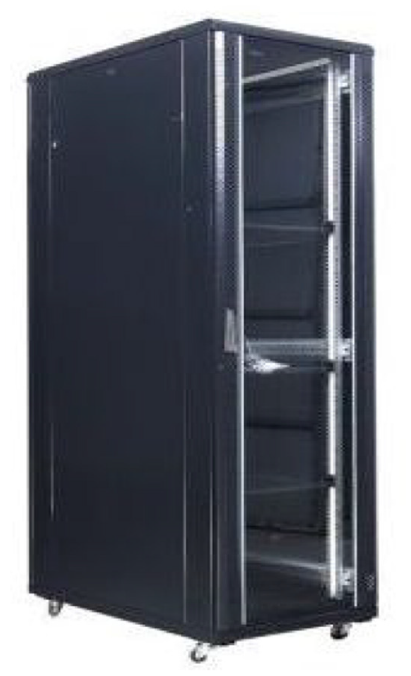
Server cabinet.
Cable test device
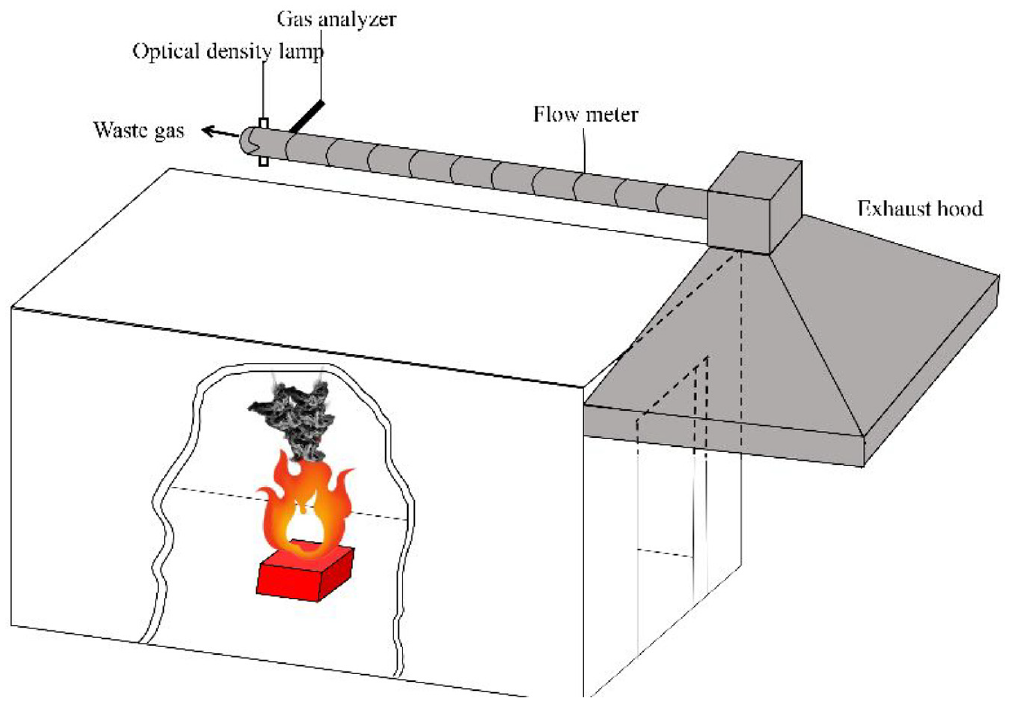
The operation and method of the test shall be in accordance with GB31247-2014 (Classification of Combustion Performance of Cables and Optical Cables). The test equipment includes combustion chamber, air supply system, standard ladder, ignition source, etc., as shown in Figure 4. The experimental cable is installed in front of the standard ladder and stands upright inside the combustion chamber. The lower part is a strip propane gas burner with a power of 20.5 kW as the ignition source. The air is directly introduced into the combustion chamber through the air box installed below the air inlet, and all waste gas generated during the period will be discharged by the smoke exhaust pipe. There are corresponding test instruments in the smoke exhaust pipe. The required data are measured by the test instruments for analysis. The ignition supplies fire until the end of the experiment.
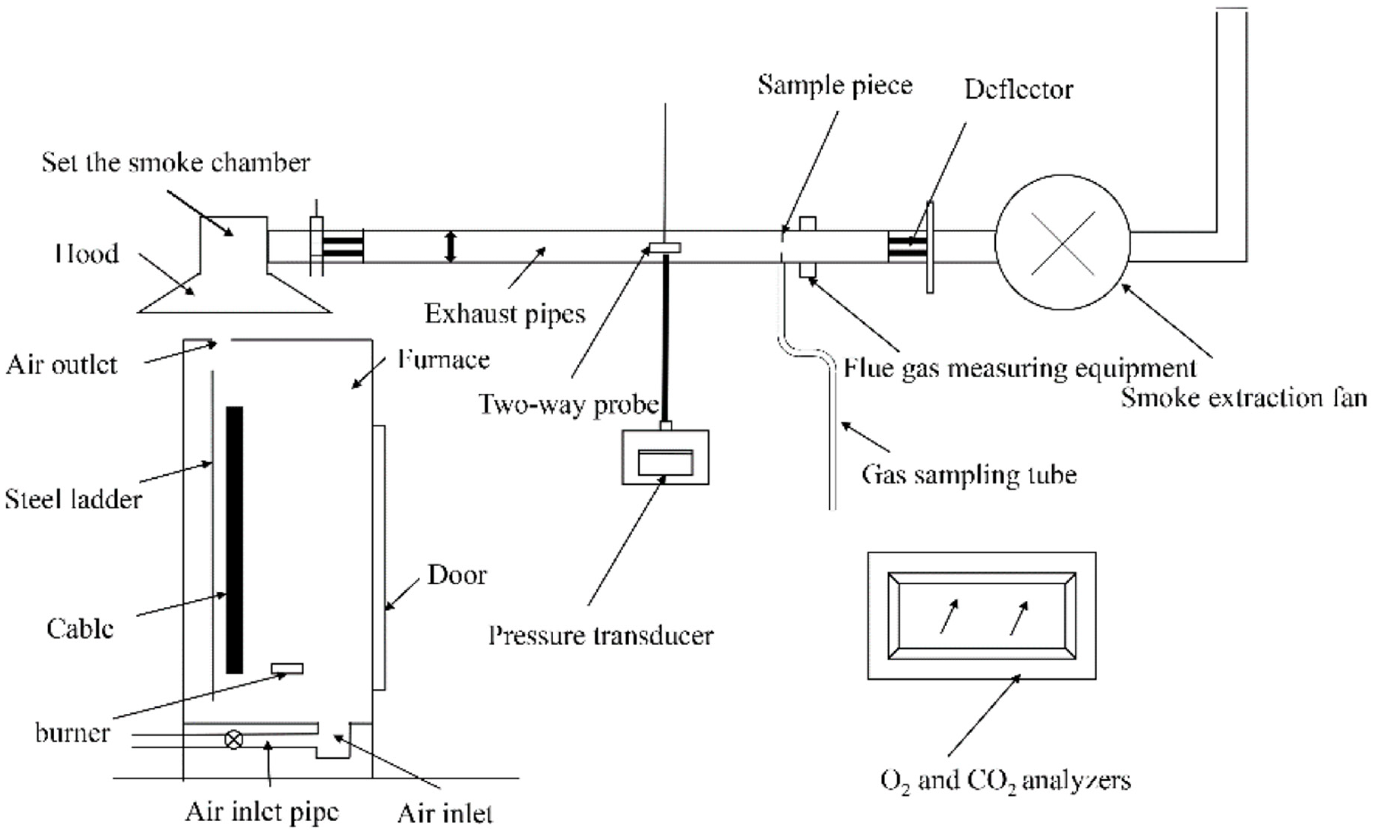
Schematic diagram of experimental system structure.
Server test device
Standard combustion chamber
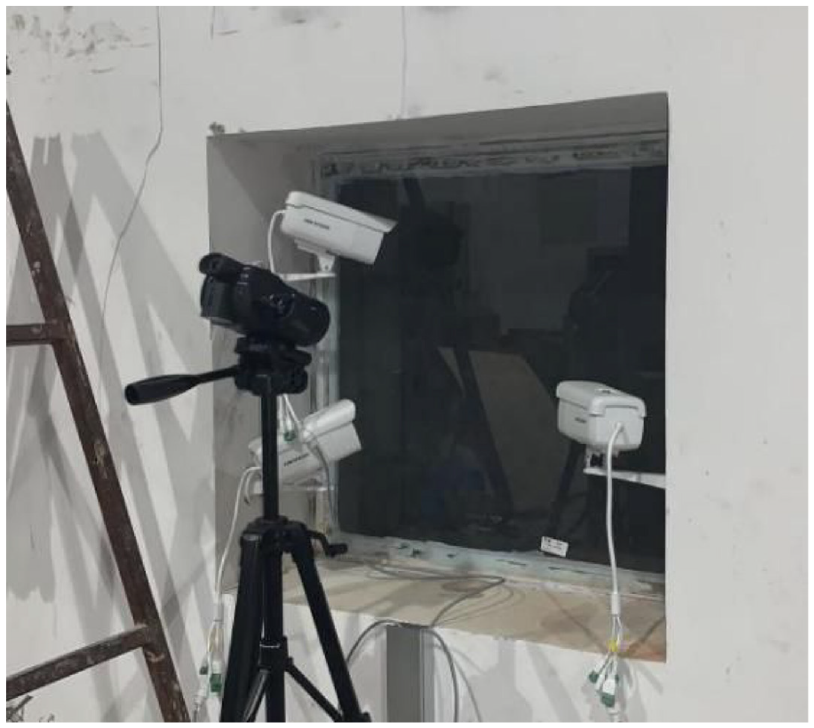
The server sample is placed in the ISO9705 full-size standard combustion chamber. Figure 5 shows the structural diagram of the ISO9705 experimental system. The internal dimension of the combustion chamber is 3.6 ×2.4 × 2.4 m, consisting of brick concrete structure. To minimize the structural damage of the combustion chamber caused by the experiment, 15-mm thick refractory is pasted on the indoor wall and ceiling. To ensure a stable experimental environment, the whole combustion chamber is built in natural ventilation, thermal insulation, and large enough internal space. There is a 0.8 × 2 m opening on the north wall of the combustion chamber, through which the combustion products are collected to the smoke collection hood and then discharged outward through the fan. 18 To better observe the phenomenon of experimental combustion from the side, a 0.2 × 0.2 m glass frame is set on the east wall of the combustion chamber. There are no ventilation ducts on other walls, floors, and ceilings. The ignition source is set according to the provisions of ISO9705 (GB/T 25207-2010) fire test method for solid room fire of surface products), which is an international unified standard. The igniter is in the combustion chamber with an opening area of 0.04 m2. Propane gas is used. The stable fire source with known power is determined by controlling the gas flow, and the actual fire source power is corrected. The igniter adopts 100 kW ignition power, and the server is located above the igniter. Since the outer surface of the server is made of metal, and the combustibles are mainly concentrated inside, to make the internal combustibles burn completely, the igniter has been supplying fire until the experiment stops during the experiment.
Structural diagram of ISO9705 experimental system.
Test data acquisition system
Image acquisition system and processing method
Flame is an important basis for the study of fire spread. High-definition camera is used to collect the image of flame. In the experiment, the camera model is SONY HDR-CX450, and the physical picture of the digital camera is shown in Figure 6.
Physical drawing of HDR-CX450 digital camera.
Temperature acquisition system
A total of seven K-type armored thermocouples are arranged in the test, which are made of nickel silicon alloy, with a diameter of 1 mm, a measuring range of 0–1200°C, and a measurement accuracy of ±0.1°C. The physical drawing of thermocouple is shown in Figure 7. See Figure 8 for thermocouple tree layout.
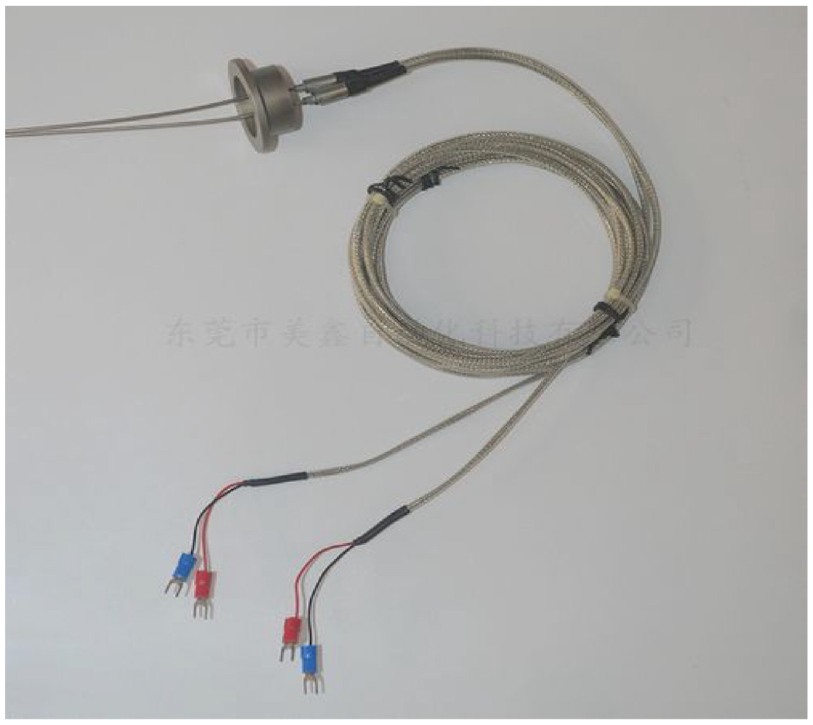
Physical drawing of K-type armored thermocouple.
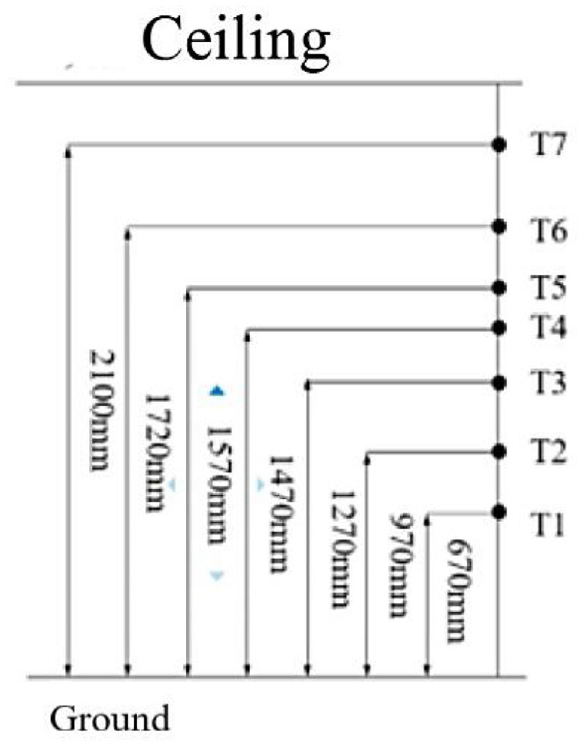
Thermocouple distribution.
Test results and analysis
Cable combustion test
Through the combustion test of bundled network cables and cables, the combustion characteristics such as heat release rate, fire growth rate index, and total heat release of network cables and cables are measured, and the combustion and fire spread behavior characteristics of typical cables in the data room are understood through the experimental phenomena. Fire growth rate index, which represents the growth rate of fire. The relationship between the fire growth rate index and the combustion heat release rate is similar to the relationship between acceleration and speed. The larger the fire growth rate index, the faster the heat release rate of the material after thermal decomposition, which can promote the development of fire faster. Therefore, the larger the fire growth rate index, the greater the fire risk of the material. Total heat release refers to the total amount of heat released per unit area from the beginning of the combustion experiment to the end of the experiment. Combining the fire growth rate index with the total heat release can comprehensively and objectively reflect the overall combustion performance of the material. The length of the experimental samples is 3.3 m, the wire is burnt out within 500 s, and the propagation speed is 0.0066 m/s. The cable is burnt out within 1200 s, and the spreading speed is 0.00275 m/s.
Test process and phenomenon
Figures 9 and 10 show the cable combustion process. Figures 9(a) and 10(a) are the original samples. Figures 9(b) and 10(b) are the samples in combustion, and Figures 9(c) and 10(c) are the samples after combustion. As can be seen from Figures 9 and 10, both the network cable and the electric cable can be ignited, and the flame can spread upward. In the cable combustion process, the sheath is decomposed first, and then other components (insulating layer) are gradually heated and decomposed. After the combustion, the outer sheath and insulating layer of the two cables are charred, the remaining residues are gray, and only the internal conductor is not ignited, which indicates that the network cable and power on cable in the data room are combustible.
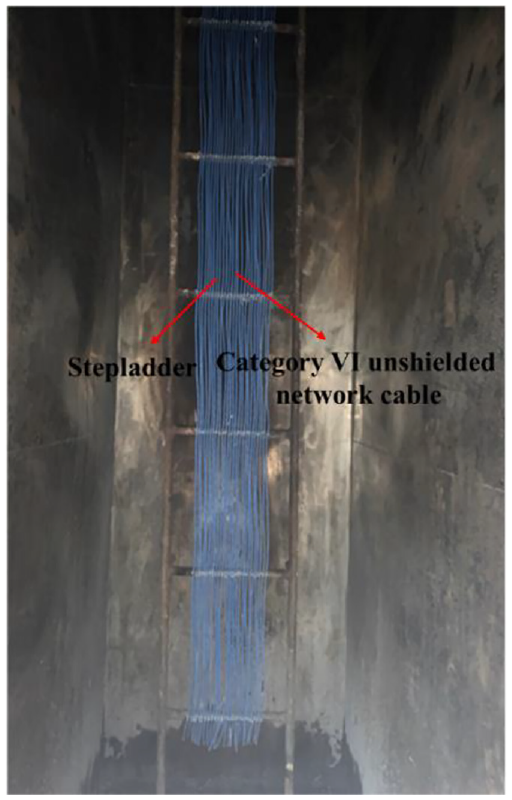
Experimental photos of category VI unshielded network cable.
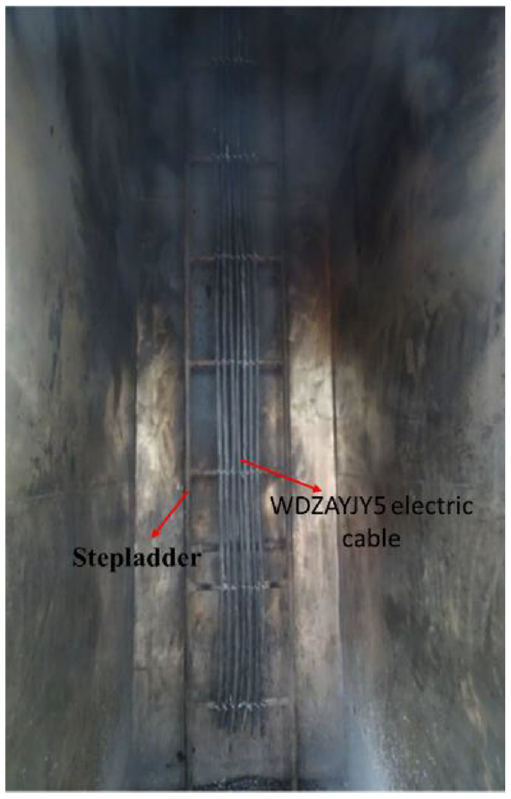
WDZAYJY5 electric cable test photo.
Test results and analysis
Heat release rate
Figure 11(a) and (b) shows the heat release rate of network cable and electric cable, respectively. The experimental cable is installed in front of the standard ladder, standing upright in the combustion chamber, and the lower part is a strip propane gas burner with a power of 20.5 kW as the ignition source. The ignition source is placed at the bottom of the cable. The curves of heat release rate for network cable and electric cable contain the heat release rate of the ignition 20.5 kW. It can be seen that there are certain differences in the heat release rate under the same radiant heat ignition conditions. It can be seen from Figure 11(a) that the heat release rate curve at the initial stage of network wire combustion is almost unchanged. After about 296 s, the heat release rate shows a trend of first increasing and then decreasing. There is only one peak value in the heat release rate curve of the network cable, which is because the sheath material PVC is mainly used for the combustion of the network cable. It drops rapidly after reaching the peak value. At 500 s, it stops releasing heat, and the spreading speed is about 0.0066 m/s. It can be seen from Figure 11(b) that the heat release rate hardly changes in the initial stage of cable combustion, and the heat release rate gradually increases after about 321 s. There is a secondary increase in the heat release rate during cable combustion, so there are two peak values of heat release rate. The increase of the first heat release rate is caused by the ignition source igniting the sheath material at the outermost layer of the bottom cable. The full combustion of the sheath with large volume causes the rapid growth of the first heat release rate of the cable. Therefore, the first peak is mainly the combustion of the sheath material PVC. When the sheath material is completely burned, its residue carbonizes, decomposes, or falls off, and the heat heats and ignites the cable insulation in the way of heat conduction, which leads to the growth of the second heat release rate. At this stage, the energy for the upward spread of the fire comes from the combustion of the bottom cable, which has nothing to do with the ignition source. Therefore, the second peak is mainly the combustion of cross-linked polyethylene. The heat release rate of the electric cable increases at about 400 s, which is longer than the ignition time of the network cable. This is because the sheath of WDZA-YJY electric cable is halogen-free low-smoke flame-retardant material with better flame-retardant performance. The heat release rate of the electric cable increases slowly when time is 400–540 s, reaches the first peak at about 540 s, increases rapidly after about 25 kW, and reaches the second peak at 940 s, with the peak of 178 kW. After reaching the peak, it decreases rapidly, and the combustion stops at 1200 s.
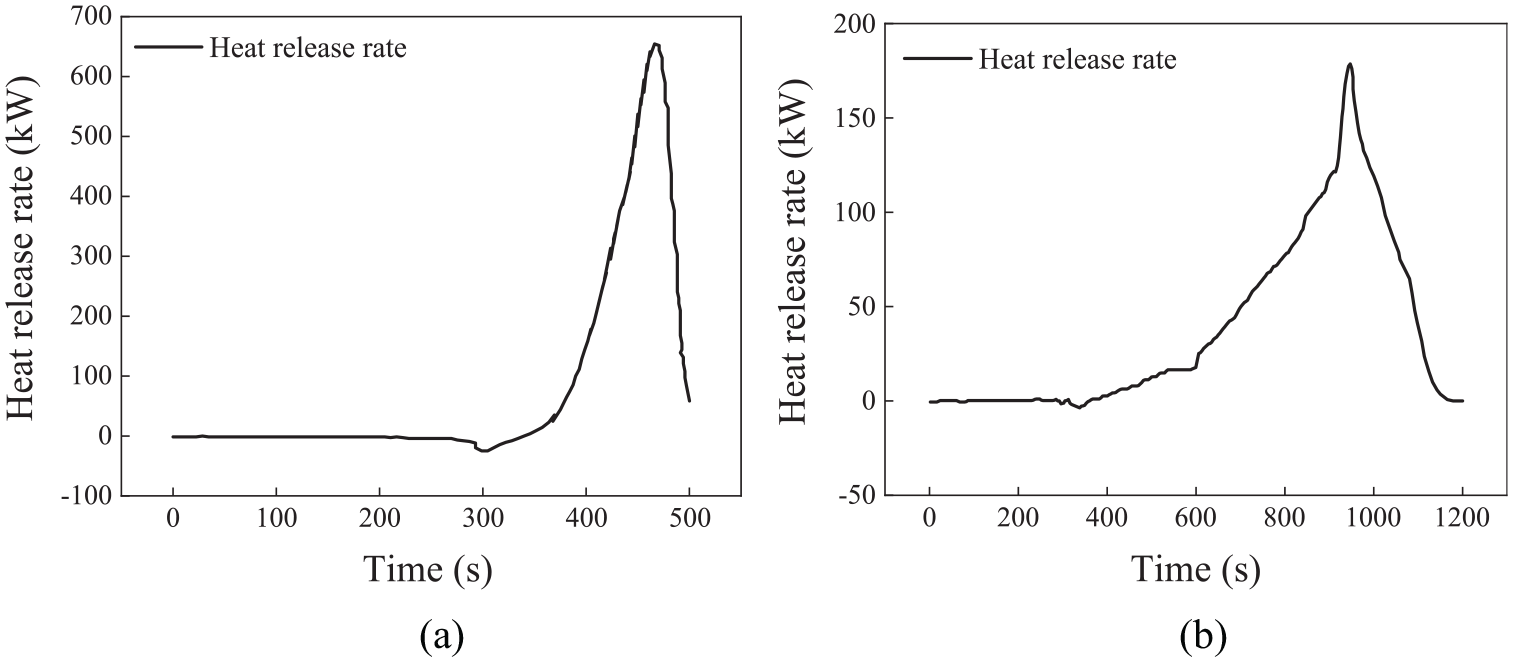
Curve of heat release rate with time: (a) network cable and (b) cable.
Fire growth rate index and total heat release
Figure 12(a) and (b) shows the fire growth rate index and total heat release of network cable and electric cable, respectively. It can be seen from Figure 12(a) that after the network cable is exposed to radiant heat, the fire growth rate index curve shows a trend of first increasing and then decreasing. The peak of fire growth rate index reached 4040 W/s, and the total heat release has been increasing with time, with a total heat release of 39 MJ within 500 s. After that, the wire material is gradually exhausted, entering the combustion attenuation stage, and the fire growth rate index rapidly decreases to 0. It can be seen from Figure 12(b) that there are two peaks in the fire growth rate index curve of electric cable. The first peak is about 73 W/s and the second peak is about 210 W/s. The two peaks represent the fire growth rate index when the outer protective sleeve and insulating sleeve are ignited, respectively. The total heat release has been increasing with time, and the total heat release of cable combustion within 1200 s is 33 MJ.
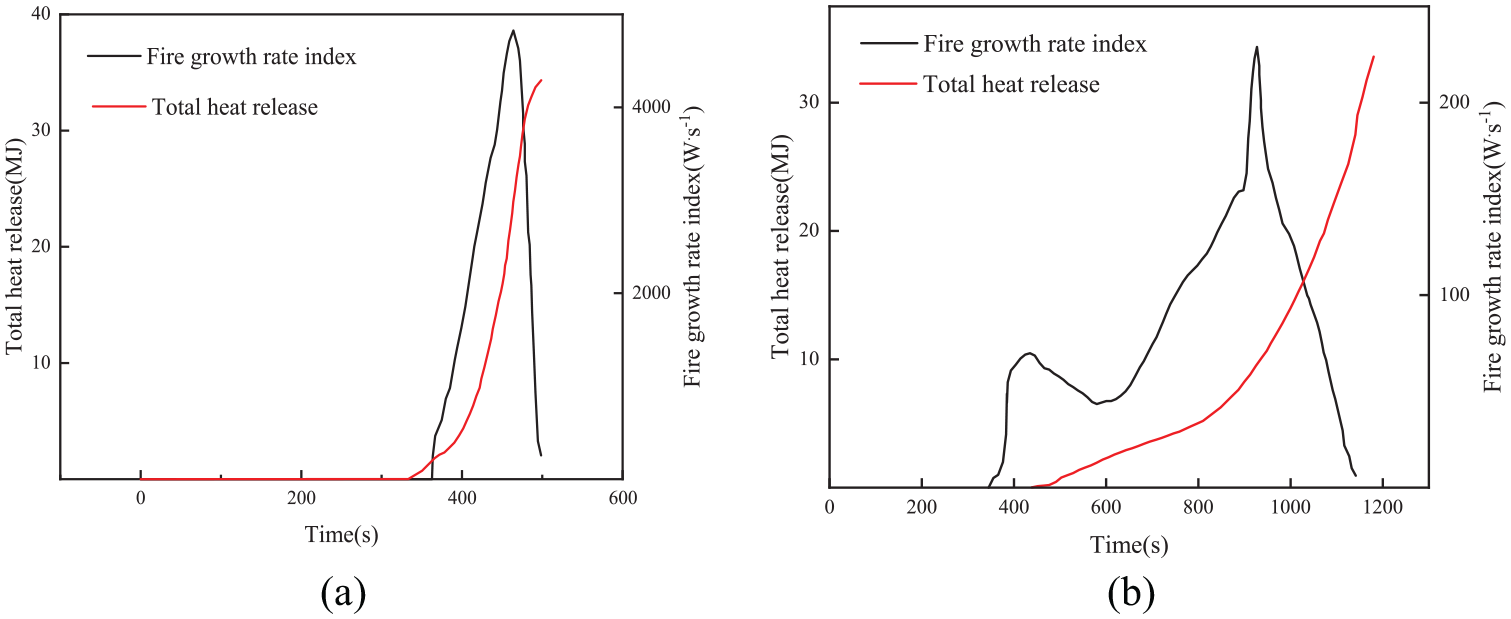
Curve of total heat release and fire growth rate index with time: (a) network cable and(b) cable.
Combustion test of single server
The full-scale fire experiment of single server is to place the single server in the middle of the standard combustion chamber. This test-bed is an international standard room for indoor fire research according to the international ISO9705 (GB/T 25207-2010 fire test method for solid room fire of surface products). The measurement experiment of heat release rate using this room has the characteristics of typical indoor fire, and its experimental data is comparable with the combustion behavior of materials in real fire. Due to the huge cost of full-scale data room fire experiment. Therefore, in this experiment, three servers are placed in the longitudinal direction in one cabinet to verify whether the server fire will spread. Cabinet size is 0.6 m × 0.8 m × 2 m. The specific placement method is shown in Figure 13. The server is placed on a fireproof support with a height of 50 cm, and the igniter is placed directly below it.
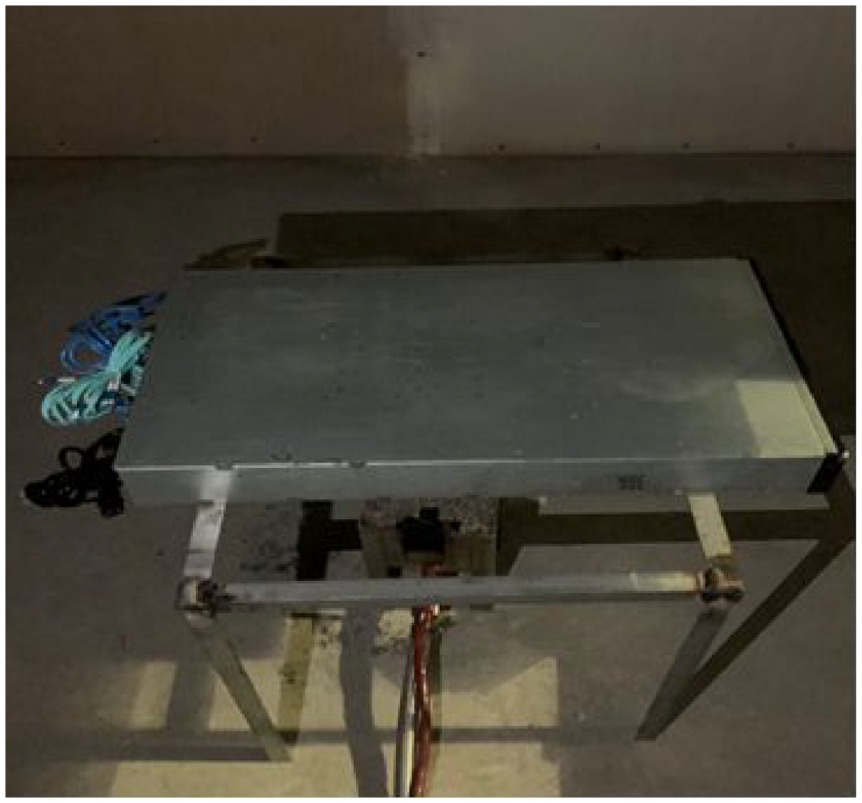
Single server fire test.
Test process and phenomenon
Figure 14 shows the phenomenon of different moments in the combustion development process of single server. As can be seen from Figure 14, the combustion process of the single server can be divided into initial growth, stable combustion, and combustion attenuation stages. Due to the action of external fire source, the flame propagates at the back end of the server, causing the electric cable to be ignited first, causing the back end of the server to catch fire, thus forming the initial growth stage, which lasts for 200 s. In the initial growth stage, the molten liquid of the electric cable drops on the ground under the action of high temperature, continues to burn, the ground combustibles increase, and the fire expands. With the progress of combustion, the server fire spreads, the front end of the server is ignited and the two ends of the server burn violently. This process is the stable combustion stage of server combustion, which lasts about 500 s. With the progress of the combustion process, the combustibles inside the server are continuously consumed, the flame gradually decreases, the combustion enters the attenuation stage, the fire source is removed, the flame in the middle of the server is extinguished, and the flame at both ends of the server is gradually reduced and finally extinguished. The flame inside the server changes from original red to scorched black. When the flame goes out, many black residues appear around the server, and the combustion attenuation phase lasts for 200 s. The server burning process lasts a total of 900 s.
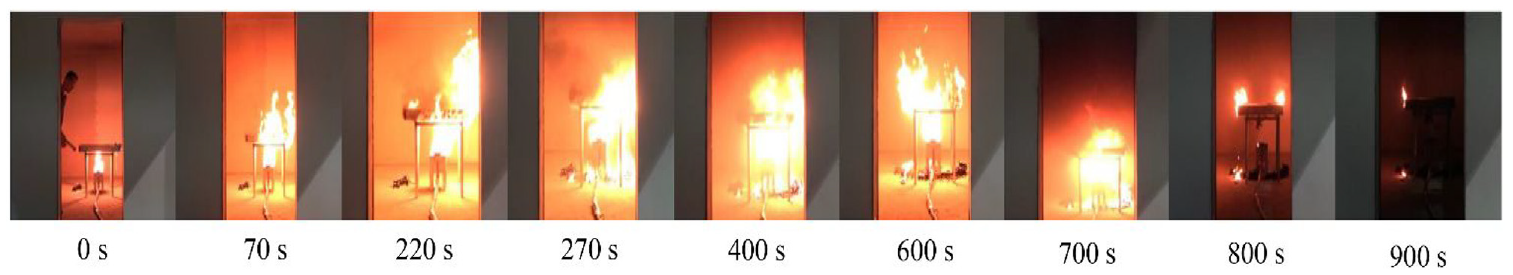
Combustion diagram of single server at different moments.
Test results and analysis
Heat release rate
Heat release rate is an important index to measure the severity of fire. Figure 15 shows the heat release curvature curve of the single server including the heat release rate of ignition source (constant ignition source, power of 100 kW). As can be seen from Figure 15, the heat release rate curve of the server has experienced the change of first increasing and then decreasing. The heat release rate begins to increase when time is 132 s, and the combustion is in the initial growth stage. At this time, the internal cables of the server undergo oxidative decomposition and smoldering, and the heat release rate begins to rise gradually. When time is 228 s, the peak value of heat release rate is 70.3 kW.
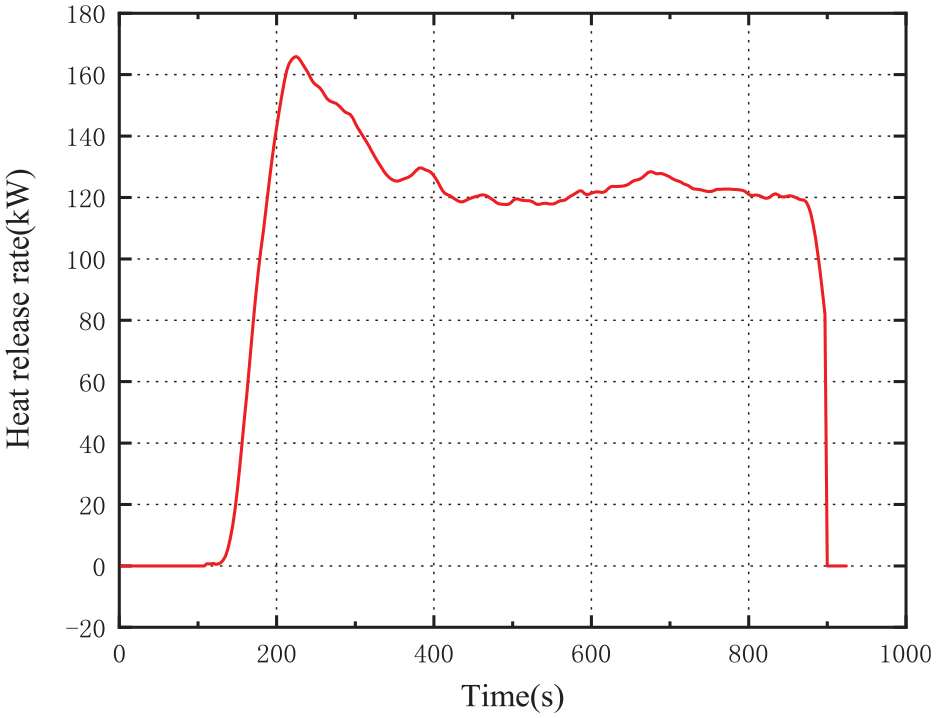
Curve of heat release rate with time.
Temperature
Figure 16 shows the temperature change curve of thermocouples at different heights. Figure 16 shows that the temperature curve begins to rise at 132 s from the start of ignition. When the temperature of each thermocouple reaches the maximum value at 228 s, it begins to float around the maximum value of temperature until 846 s. After the fire source is removed, the temperature decreases rapidly. It can be seen that the temperature also experiences a process of first increasing and then decreasing. This process shows that the server continues the combustion process in the standard combustion chamber, a large amount of flue gas accumulates in the ceiling, and the flue gas layer continues to decline. The temperature of the highest thermocouple at different heights is significantly different. Because the flue gas layer contains a lot of heat and the flue gas concentration in the upper layer is large, the temperature of the upper thermocouple is high, while the flue gas concentration in the lower layer is relatively small, so the temperature change is also small compared with the room temperature. The maximum temperature of thermocouple increases with the increase in thermocouple height. The temperature peaks of thermocouples T7 (2.1 m), T6 (1.72 m), T5 (1.57 m), and T4 (1.47 m) before removing the burner are between 166°C and 140°C, and the temperature decreases in turn with the decrease in thermocouple height. The peak temperature of thermocouples T3 (1.27 m) and T2 (0.97 m) before removing the burner is between 110°C and 60°C. The temperature rise of thermocouple T1 (0.67 m) is not obvious compared with the external temperature. According to the variation range of thermocouple temperature with height, the flue gas layer produced by the server in the combustion process of standard combustion chamber has decreased by about 1.4 m.
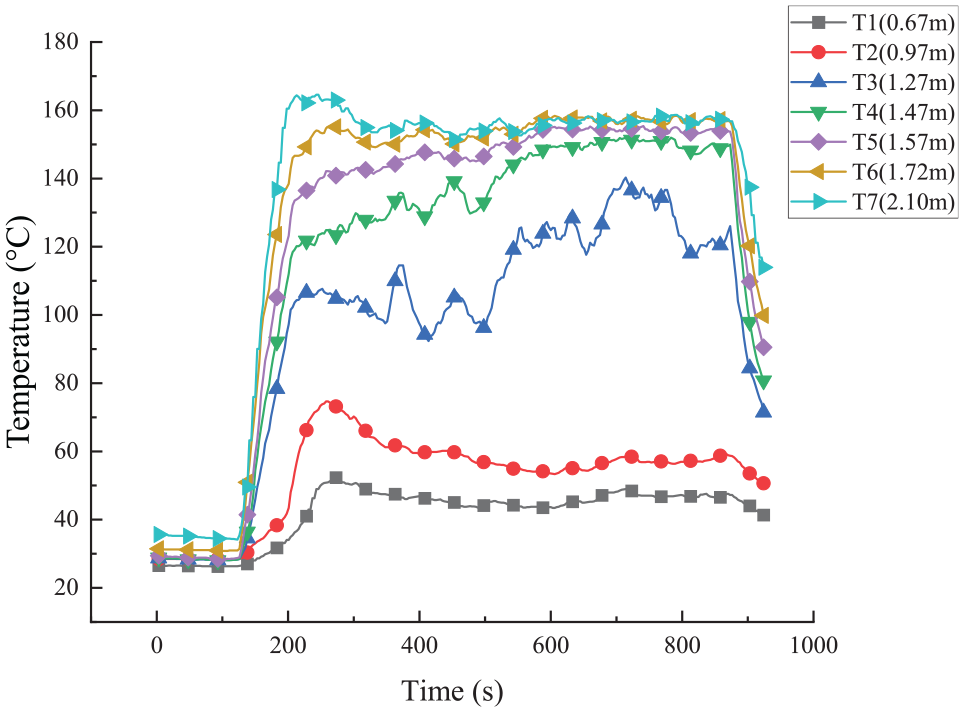
Curve of thermocouple temperature with time.
Produced gas concentration
Figures 17 and 18 show the measured CO and CO2 concentrations at the entrance of the standard combustion chamber. It can be seen from Figure 17 that at 383 s, the CO concentration rapidly increases to the peak of 166 ppm, the time to reach the peak is 575 s, and then slowly decreases to 0 at 980 s. It can be seen from Figure 18 that the change law of CO2 generation rate curve corresponding to server combustion is consistent with the law of heat release rate mentioned above. It starts to increase rapidly at 159 s. At this time, the combustion is in the initial growth stage. At 222 s, the CO2 concentration increases to 2500 ppm. When time is 222–846 s, the combustion is in the full development stage. The CO2 concentration is relatively stable and fluctuates around 2000 ppm. When the fire source is removed at 846 s, the CO2 concentration decreases rapidly, the combustion decays rapidly, and the CO concentration increases to 160 ppm. After 222 s, the CO concentration and CO2 concentration begin to decrease. The CO concentration decreases to 0 at 477 s, and the CO2 concentration decreases to 2500 ppm at 393 s, without large-scale fluctuation.
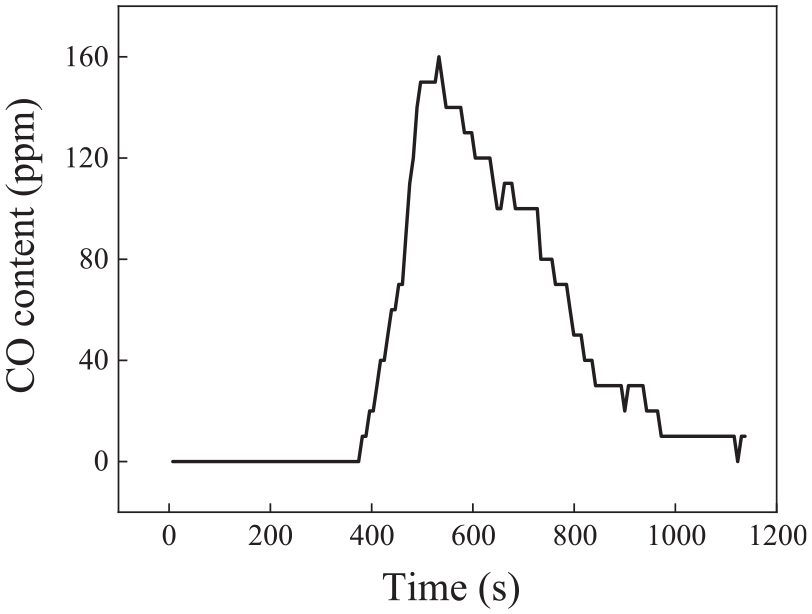
Curve of CO concentration with time.
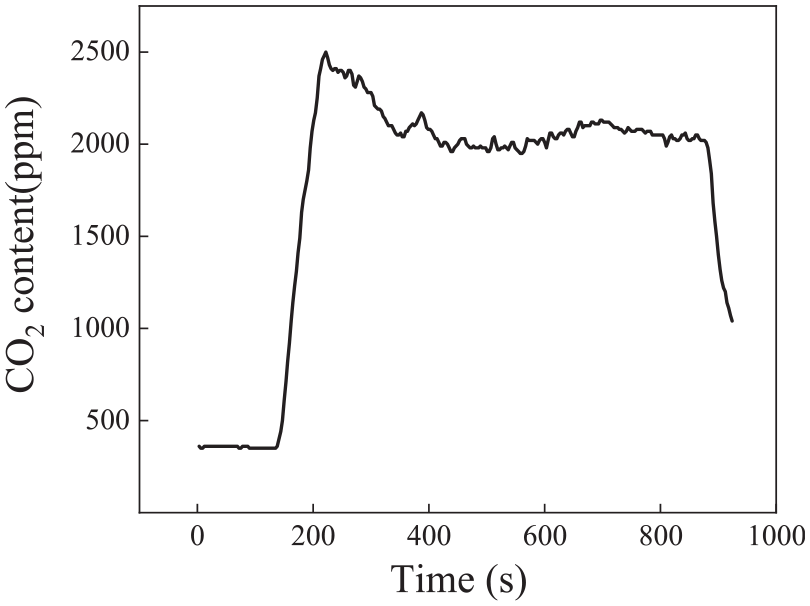
Curve of CO2 concentration with time.
Server group combustion test
When a single server is on fire, the accumulated heat will continuously increase the temperature of adjacent servers, eventually causing adjacent servers to be ignited. By analogy, the fire gradually spread. To further study the phenomenon and regularity of the server fire spread process, fire spread experiments of several servers will be carried out based on the fire experiment of single server. The relevant parameters and experimental phenomena in the experiment process will be recorded through the experimental platform, and then analyzed and summarized.
The layout of the experiment site is shown in Figure 19. There are three cabinets in the server group experiment, which are arranged according to the actual layout in the data room. The two cabinets are adjacent, and the opposite cabinet is 1.5 m away from the fire cabinet. Three servers are arranged vertically inside the fire cabinet, the ignition source is placed under the server, and one server is arranged in each of the other two cabinets. Then observe whether the fire spread and ignited the servers in the adjacent cabinet and the opposite cabinet.
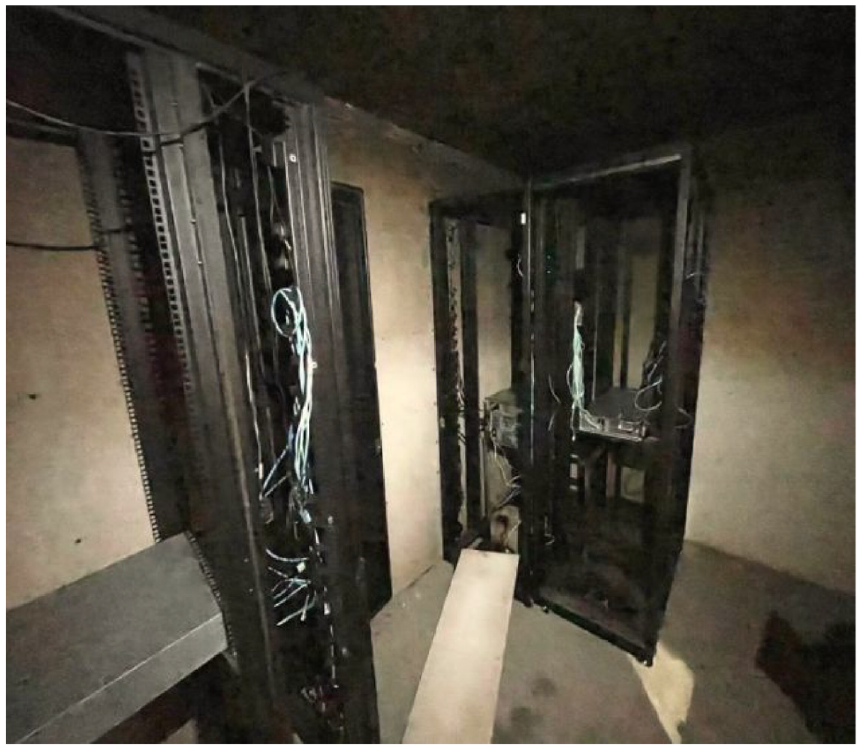
Fire test of server group with three cabinets.
Test process and phenomenon
Figure 20 is an experimental picture of different moments in the combustion development process of the server group. The time of occurrence is listed in the lower part of the figure. As can be seen from Figure 20, each server fire also experiences the initial growth stage, stable combustion stage and combustion attenuation stage during the fire spread of the server group with three cabinets. The whole combustion process lasts 1400 s. The ignition source first ignites the lowest server, forming the first growth stage, which lasts for 200 s. As the combustion intensifies, the intermediate server is ignited, and then the upper server is also ignited. At this time, all three servers in the cabinet are ignited and enter the stable combustion stage for 700 s. With the progress of the combustion process, the combustibles are continuously consumed, the flame decreases, the combustion enters the attenuation stage, and the flame of the server group gradually weakens until it goes out for 500 s. When a fire breaks out in the server group, it shows the spreading law of the lower end server (about 130 s), the intermediate server (about 520 s) and the upper end server (about 833 s), and the interval time is 390 and 313 s, respectively. From the shorter the interval between two ignitions, it can be seen that the server is ignited faster. This is because the higher the heat accumulated with the spread of the fire, the faster the temperature rise of the server that is not ignited due to the burning effect of the flame. As a result, the time to reach the ignition point is getting shorter and shorter. It can also be seen from Figure 20 that the server fire tends to spread upward, and the flame always propagates upward in only one cabinet during the experiment, and the servers in the adjacent cabinet and the opposite mechanism are not ignited, which indicates that the cabinet can prevent the fire from spreading to the servers in the adjacent cabinet to a certain extent, and play the role of fire separation. At the same time, when three servers in a cabinet are stacked, after the fire, the heat generated by server fire is not easy to be transferred to the opposite cabinet through thermal convection, indicating that the 1.5 m interval meets the requirements of fire protection design.
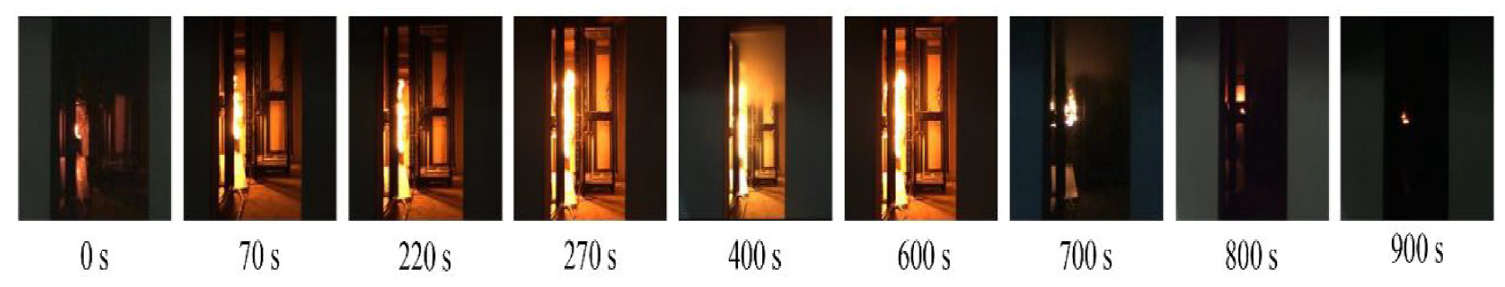
Combustion diagram of server group with three cabinets at different moments.
Test results and analysis
Heat release rate
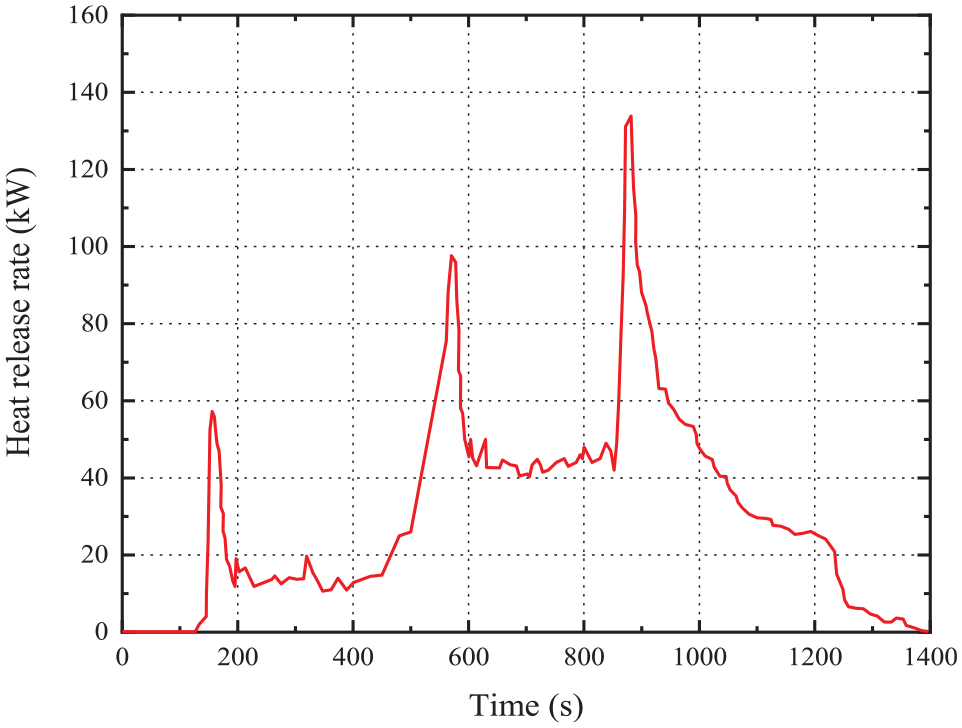
As can be seen from Figure 21, there are three peaks in the heat release rate of the server, and the peak shows a gradual increasing trend, which is consistent with the three growth stages of the combustion development process of the server group. The server at the lowest level is first lit at 130 s. At 169 s, the heat release rate increases rapidly to the first peak, which is 58 kW. Then the heat release rate decreases rapidly. When time is 210–550 s, the heat release rate is stable at about 10 kW. At 550 s, the intermediate server is ignited, and the heat release rate curve rises rapidly. At 600 s, the heat release rate reaches the second peak, which is 98 kW. Then the curve continues to decline rapidly, and the curve fluctuates in the range of 30–40 kW when time is 645–850 s. At 850 s, the upper server is ignited and the curve begins to rise rapidly. At 910 s, the heat release rate reaches the third peak, which is 134 kW. Then the heat release rate continues to decrease rapidly to 40 kW. After 1030 s, the heat release rate decreases slowly until the heat release rate decreases to 0 at 1400 s and the combustion ends. It can be seen from the heat release rate curve that in the process of server combustion, the lower server is easier to be ignited than the upper server, and the ignition time of the upper server is 200 s shorter than that of the middle server, indicating that the combustion of the upper server will accelerate the propagation speed of server fire and increase the heat release rate of server fire in the form of heat conduction, which shows that when the number of servers increases, the heat release rate will gradually increase, and the greater the fire risk.
Curve of heat release rate with time for server group.
Temperature
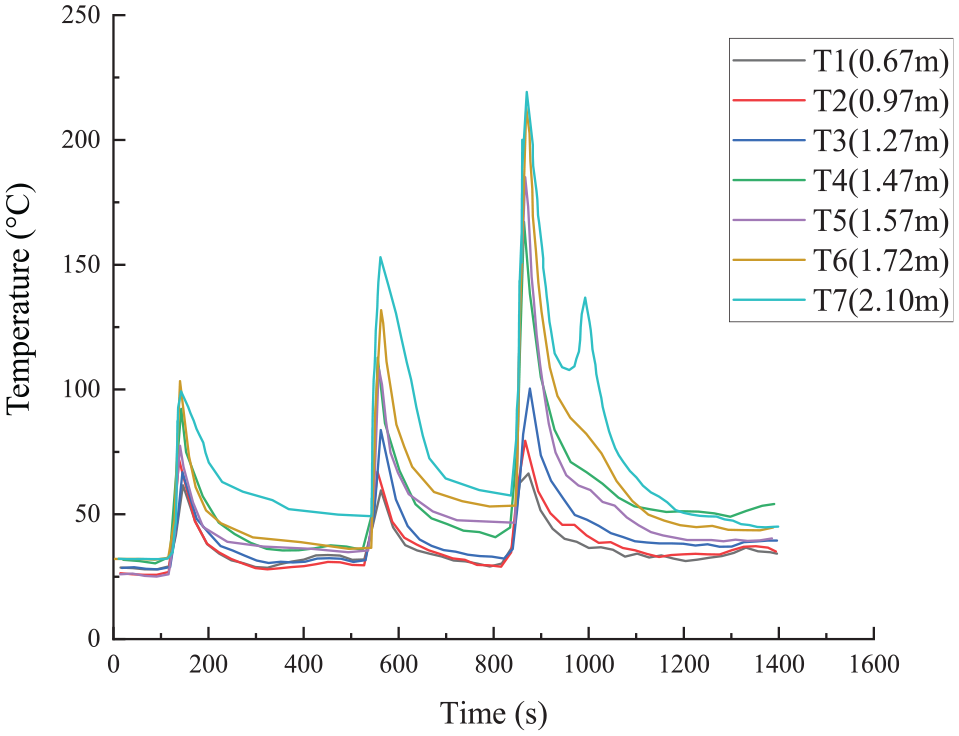
Figure 22 shows the thermocouple temperature diagram at different heights of the server group. It can be seen that the change trend of thermocouple temperature is the same as that of heat release rate curve. Each thermocouple temperature change curve also has three curve peaks, but with the decrease in thermocouple height, the maximum temperature also gradually decreases. From the start of ignition, at 130 s, the server at the lowest layer is ignited, and the temperature curve begins to rise rapidly. After 172 s, the temperature of each thermocouple reaches the first peak, and then decreases rapidly. The maximum temperature of thermocouple T7 is 100°C. When time is 210–550 s, the thermocouple temperature fluctuates between 25°C and 50°C. At 561 s, the intermediate server is ignited and the temperature curve rises rapidly for the second time. At 610 s, the temperature of each thermocouple reaches the second peak and then decreases rapidly. The maximum temperature of thermocouple T7 is 152°C. When time is 700–845 s, the thermocouple temperature fluctuates between 30°C and 75°C. At 850 s, the upper server is ignited, and the temperature curve rises rapidly for the third time. At 887 s, the temperature of each thermocouple reaches the third peak. The maximum temperature of thermocouple T7 is 232°C, and then decreases slowly. At 1400 s, the temperature of thermocouple decreases to the right of the lowest temperature, and there is no change. As shown in the thermocouple temperature variation trend, the smoke temperature rises gradually with the server being ignited, which indicates that when multiple servers in the data room are on fire and the fire spreads, the indoor temperature rises gradually with the development of the fire.
Curve of thermocouple temperature with time for server group.
CO2 concentration
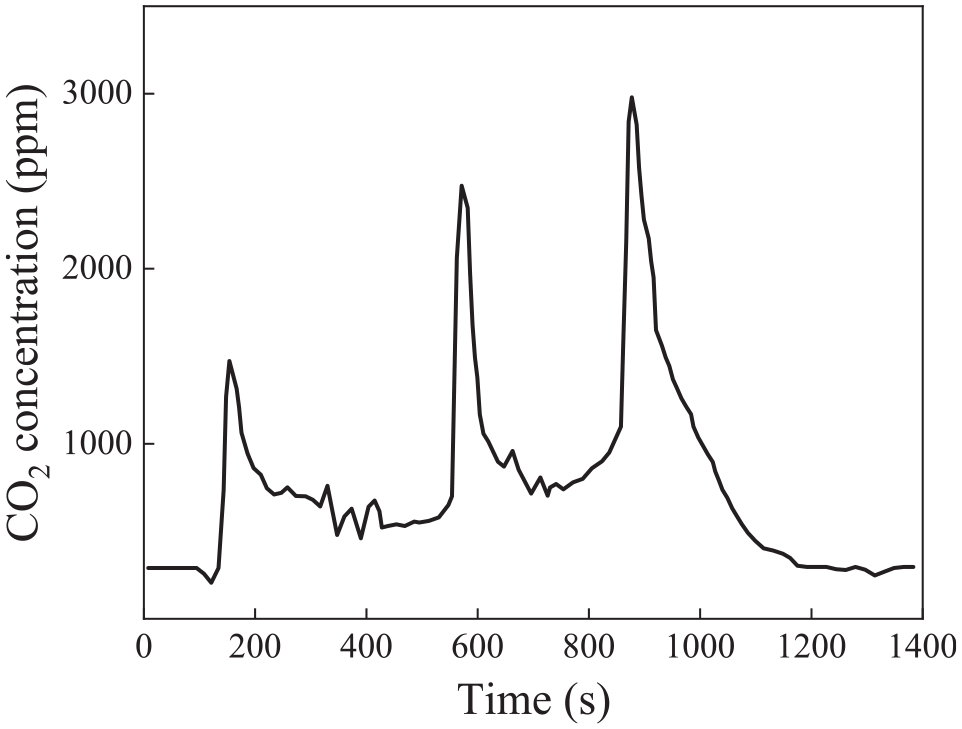
Figure 23 shows the CO2 concentration measured at the center of the top of a standard combustion chamber doorway. It can be seen from the Figure 23 that CO2 concentration and heat release rate have similar trends. The change curve of gas concentration also has three peaks, which begins to increase rapidly at 144 s. After reaching the first peak at 171 s, CO2 concentration increases to 1314 ppm and then decreases rapidly to 970 ppm. When time is 210–549 s, CO2 concentration slowly decreases to 481 ppm. At 550 s, the CO2 concentration curve rises rapidly for the second time. At 610 s, the CO2 concentration reaches the second peak, which is about 2514 ppm, and then reduces rapidly to 754 ppm at 750 s. The CO2 concentration curve rises rapidly for the third time at about 826 s. The CO2 concentration reaches the third peak, which is about 2988 ppm, and then rapidly decreases to 365 ppm until 1400 s, the CO2 concentration no longer changes.
Curve of CO2 concentration with time for server group.
Conclusion
The experimental platform and equipment of solid fire experiment are introduced in detail. By selecting the most commonly used network cable and electric cable in a data room for combustion experiment, a brand of server is selected as the research object to carry out single server fire experiments and server group fire spread experiments. The temperature change, heat release rate change and CO2 concentration change after the fire are described. The parameters measured in the experiment are analyzed and summarized. The parameter changes in each time period can reflect the increase or decrease of these parameters before and after the fire, and these changes can provide some guidance for the emergency plan of preventing fire. The following conclusions are obtained.
The measured maximum heat release rate of the network cable is 661 kW, which is higher than the maximum heat release rate of the electric cable of 178 kW, indicating that the network cable is more likely to accelerate the spread of fire. The peak of the fire growth rate index of the net cable is 4040 W/s, whereas there are two peaks of the cable fire growth rate index, the first peak is about 73 W/s and the second peak is about 210 W/s. The two peaks represent the fire growth rate index when the outer protective jacket and the insulation jacket are ignited, and the total heat release maximum is near the second peak, which is about 33 MJ. From the combustion test results of cables and network cables, it can be concluded that cables and network cables are flammable, and the fire spreads rapidly, with high peak heat release rate and high fire risk. Therefore, the data room should pay attention to cable fire prevention in daily operation and maintenance, lay the cable routing according to the specifications, and select flame-retardant cables that meet the national specifications to ensure that the cables meet the fire prevention requirements.
In the single server fire experiment, the fire process is divided into three stages: initial growth stage, stable combustion stage and combustion attenuation stage. The maximum temperature of flue gas is 166°C, the maximum concentration of CO is 160 ppm and the maximum concentration of CO2 is 2500 ppm. The combustion characteristics of the single server are determined by the experiment, which proves that the internal electronic components are combustible. The server is ignited at 132 s and the peak heat release rate is 70.3 kW. The fire risk is high.
The overall experimental heat release rate of the server group with three cabinets has three peaks, 58, 98, and 134 kW, respectively. The flue gas temperature curve also has three peaks, which are 100°C, 152°C, and 232°C, respectively. The CO2 concentration curve also has three peaks, 1314, 2514, and 2988 ppm, respectively. Compared with the servers in the upper layer, the servers in the lower layer are easier to be ignited. The combustion of the servers in the upper layer accelerates the propagation speed of the server fire through the heat conduction of the heat released by the combustion of the servers in the lower layer, and increase the heat release rate of the server fire, which indicates that when the number of servers increases, the heat release rate will gradually increase, Thus, the greater the fire risk.
The server fire tends to spread upward, and the flame always propagates upward in only one cabinet during the experiment, and the servers in the adjacent cabinet and the opposite mechanism are not ignited, which indicates that the cabinet can prevent the fire from spreading to the servers in the adjacent cabinet to a certain extent, and play the role of fire separation. At the same time, when three servers in a cabinet are stacked, after the fire, the heat generated by server fire is not easy to be transferred to the opposite cabinet through thermal convection, indicating that the 1.5 m interval meets the requirements of fire protection design.
Footnotes
Declaration of conflicting interests
The author(s) declare that they have no known competing financial interests or personal relationships that could have appeared to influence the work reported in this paper.
Funding
The author(s) disclosed receipt of the following financial support for the research, authorship, and/or publication of this article: The authors acknowledge the financial support provided by the Fundamental Research Funds for the Central Universities (grant no. 2021YJSAQ19) and Yueqi Scholar Program for China University of Mining and Technology (Beijing)