
Abstract
Additive manufacturing, including fused deposition modelling, is a growing technology opening up wide perspectives in material sciences. However, the ability to produce suitable fire-retarded materials via this process has never been studied extensively. This work focuses on understanding the relation between reaction to fire and numerous additive manufacturing parameters. The goal was to determine the impact of those parameters on standard fire tests such as flame propagation test (UL94V) and cone calorimetry. The results were compared with material samples formulated via usual processes. On one hand, flame propagation results are impacted by many additive manufacturing parameters, such as the design of the part and the material flow. On the other hand, cone calorimeter results are only influenced by parameters having an impact on the sample mass.
Keywords
Introduction
Additive manufacturing, also called three-dimensional (3D) printing, was first introduced in the 1980s. 1 This terminology is used in opposition with subtractive manufacturing where parts of a material are removed through cutting, drilling or milling to obtain the final targeted object. In additive manufacturing, the part is created by adding the material, usually layer by layer, following the shape of the targeted 3D object.
Additive manufacturing was primarily used as a rapid prototyping tool but has evolved a lot since. Nowadays, it is used to produce parts with a wide range of materials 1 such as polymers, metals or glass. Indeed, this technology allows to design completely new objects with highly complex shapes and freedom of the design, or to reproduce objects that no longer exist on the market.2,3 As an example, the use of this technology in the transport market to reproduce spare parts is increasingly attractive.
The main drawback to reach a complete freedom of design in additive manufacturing is the large number of parameters to specify, such as printing speed, extruder temperature, environment temperature, infill percentage and infill pattern among others. 4 Thus, the complexity to apprehend the technology and to apply it in the industry is still challenging. However, the plateau of maturity was reached, thanks to the numerous studies completed to understand the impact of those parameters on the surface finish,5–9 mechanical properties,7,9–12 dimensional accuracy7,9,11,13 and process efficiency.7,8,14
Concerning polymers, different technologies have been developed to produce 3D printed objects by using thermoset and thermoplastic polymers. 1 Those different technologies can be classified into three different categories: photopolymerization, bed fusion and material extrusion (Figure 1).
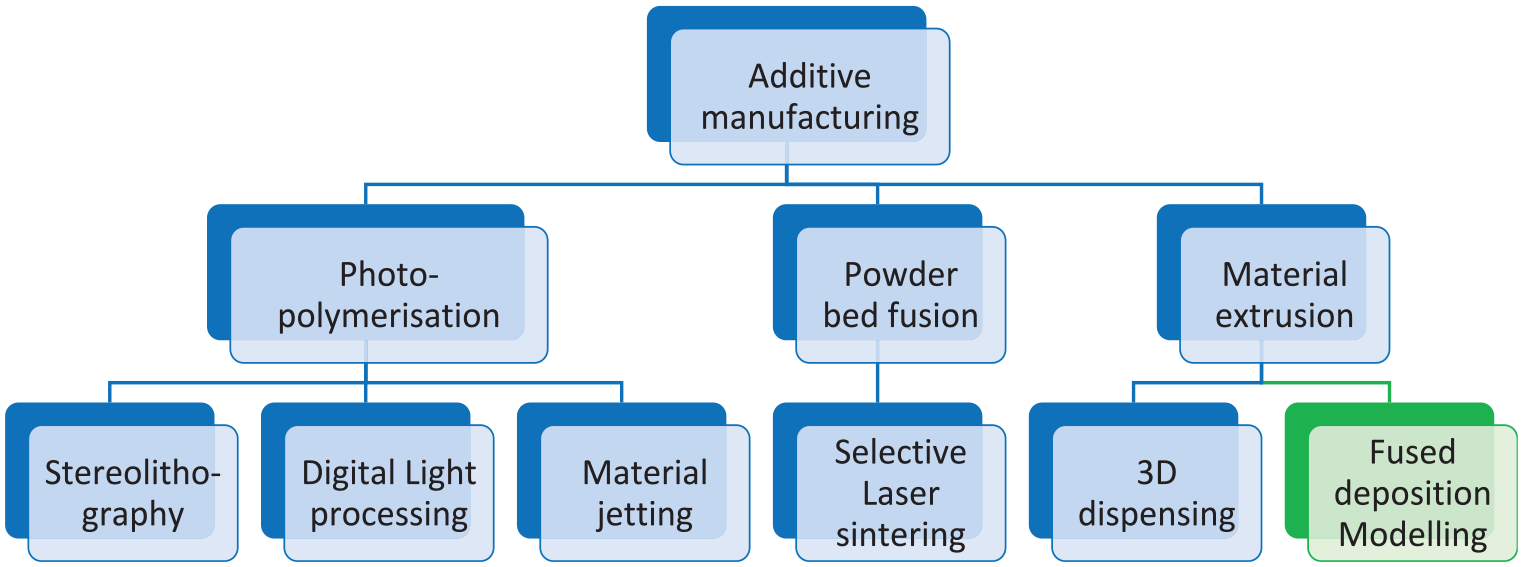
Techniques to additively manufacture a 3D object with a polymeric material.
Photopolymerization is used in different processes such as stereolithography (SLA), digital light processing (DLP) and material jetting. 1 The principle of photopolymerization always consists of initiating the polymerization reaction by using light (usually UV light), inducing the generation of free radical species. Powder bed fusion is an additive manufacturing technique using thermoplastic powders. 1 A powder bed of one layer height is screened by a laser to heat, soften and melt the material, causing the sintering of the thermoplastic. Then, in a second step, the plate lowers of one layer height and another layer of powder is added on top of the previous one by a blade or a roller.
Unlike previous techniques, material extrusion consists of extruding the material directly on top of the previous layer. 1 Two main different techniques exist: 3D dispensing and fused deposition modelling (FDM). Three-dimensional dispensing consists of dispensing a material layer by layer; however, it can involve different solidification processes. It can be considered as a catch-all category.
FDM is the most common additive manufacturing technique. 15 It consists of extruding thermoplastic polymers at high temperature. The polymer is brought to a nozzle heated above the melting temperature before being extruded. The heated deposited polymer layer bonds to the previous one. This bonding between the different layers being not complete, 16 it limits the mechanical properties. Moreover, the final parts have high porosity and surface roughness. Despite these drawbacks, numerous works have been conducted to understand the impact of printing parameters such as temperature, speed and many others, on the surface finish5–9 and the mechanical properties.7,9–12
FDM machines are less costly than machines of other technologies, and the obtained 3D printed parts are ready to use straight after their production. 17 This additive manufacturing technology is thus the main technology used in the transportation field. In this context, the FDM process was selected to conduct this study.
As mentioned previously, understanding the impact of the printing parameters is a key factor for the use of additive manufacturing to design parts at the industrial scale. Their impact on the mechanical properties of the resulting parts has been well studied and reviewed by Popescu et al. 18 However, the materials involved in some specific fields such as the transportation market also need to show good fire performances in addition to high mechanical properties. The impact of the printing parameters on the fire performances also needs to be assessed to allow additive manufacturing to be more commonly used in this field of industry.
Among the first publications connecting fire retardancy of polymers and additive manufacturing was the work of Ortiz et al. 19 published in January 2016. It was the only published work to date conducted with selective laser sintering (SLS) technology and it mainly focuses on the development of new materials with increased fire properties. All the other works combining fire retardancy and 3D printing were related to FDM technologies and most of them mainly focused on new material development.20–24
Hohenwarter et al. 25 and Zárybnická et al. 26 investigated the impact of the infill percentage on fire properties. Hohenwarten et al. tested polycarbonate (PC) and polylactic acid (PLA) with UL94V (vertical flame propagation) test and cone calorimeter (CC). Zárybnickáet al. investigated the fire behaviour of a formulated polyethylene terephthalate glycol (PETG) modified with cone calorimetry and thermogravimetry. Both teams aimed at improving fire properties of their new materials and not specifically to understand how this new technology impacts fire test results.
Brooks et al. 27 were the first to investigate multi-component systems to improve fire performances of 3D printed samples. They additively manufactured their part with different designs with a low infill percentage. Then, instead of having air in the 3D printed part, they filled it with water. This water filling technique increased significantly the time to ignition (TTI) under the CC and reduced the smoke production by half.
The same kind of work was completed by Geoffroy et al. 28 who first investigated different solid and liquid carbonate solutions, then improved this new kind of designs by using hydrogels 29 and finally combined new sandwich filled with hydrogel design with thin coatings to reach extremely high fire performances. 30
Two industrial groups have also worked on the relation between additive manufacturing parameters and fire properties. On one hand, the UL group focused on their tests and developed the ‘UL Blue Card’ to qualify 3D printed materials. On the other hand, the Federal Aviation Administration (FAA) is still working to determine the ‘worst case scenario’ of additive manufacturing.
Indeed, the UL group determined that the consistency of the print quality is crucial for the UL94V test. Indeed, even when the same parameters are applied, the 3D printed barrel can have different print qualities, resulting in variation of fire test results. Tymrak et al. 31 observed the same variability for mechanical property tests. The UL group also discovered that build strategy (build orientation) and printing parameters have a huge influence on UL94V flammability.
On their side, the FAA focused on finding an already high fire performance material ready-to-use in the aeronautic industry. They worked on the vertical bunsen burner testing (another vertical flame propagation test). They highlighted that minor differences related to the printing orientation are observed but that the infill percentage is at the opposite, a key parameter.
To conclude this short survey, understanding the impact of additive manufacturing parameters on fire performances is fundamental. The objective of the present work was thus to expand the current knowledge in this specific field. Focusing on the fused filament fabrication (FFF) technology (also designated as fused deposition modelling, FDM), this article discusses the impact of additive manufacturing main parameters on two different fire tests, that is, flame propagation test (UL94-vertical) and radiative heat flux test (cone calorimetry). The main idea is to understand how additive manufacturing parameters impact fire tests and if this impact is related to the nature of the test itself.
In that frame, barrels were 3D printed with different process parameters. They were further tested with UL94-vertical and cone calorimetry tests. Barrels of the same nature produced by standard thermo-moulding process were also tested in the same experimental conditions for the sake of comparison. First, the results were compared to determine if additive manufacturing parameters have an impact on the fire test results. Then, the analysis focused on the determination of key parameters and how they impact fire performances of the materials.
Experimental methods
Materials, equipment and software
The forming material was PC-ABS Flame Retardant from Neofil3D. This polymer is already formulated. It is described as a halogen-free flame-retardant filament meeting the UL-94 V0 standards according to the supplier. The formulation is proprietary.
The 3D printed samples were printed with the Alto 333 3D printer (Alchimies, Dieuze, France). The Alto used had only one extruder with a maximum temperature of 300°C. It was built with a plate of 333 mm × 333 mm able to reach 130°C. The temperature of the printing chamber was not a parameter that could be modified.
Slic3r software was associated with the Alto 333 to slice the 3D numerical model and translate it in text file to give the commands to the 3D printing machine. It is a free software generating G-code from 3D CAD files. The version used did not allow to modify the air gap (considered impacting by the UL organism for the UL94V test).
Production of 3D printed samples
The 3D printed samples were printed with specific road dimensions. The road is the form adopted by the extruded material when the polymer is extruded out of the nozzle (Figure 2). For this work, a layer height of half the size of the nozzle diameter and a road width of the nozzle diameter were selected. For example, for a nozzle diameter of 0.4 mm, the layer height selected was 0.2 mm and the road width was 0.4 mm. The barrels were all printed with the first layer and the last layer (top and bottom of the sample) 100% filled (Figure 3).

Schematic of a road (left) and a 3D printed pattern (right).
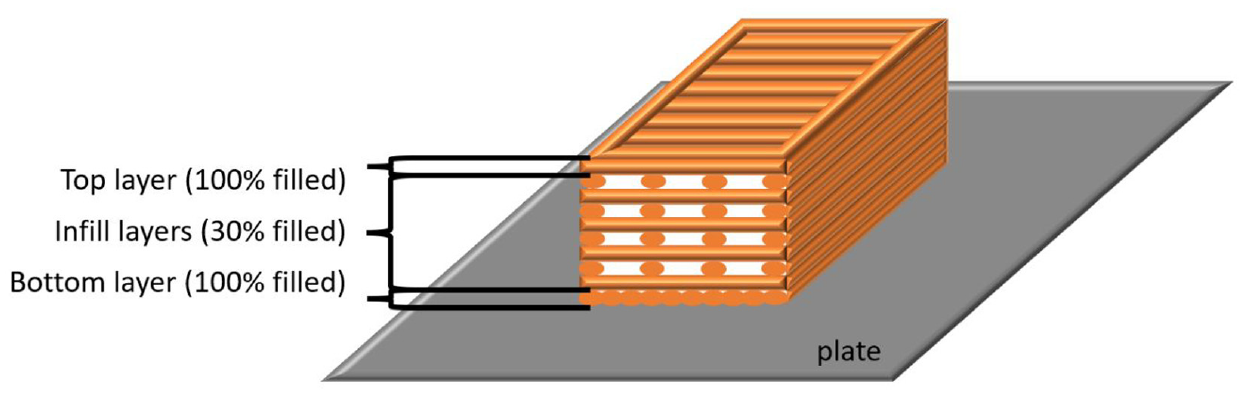
Cross-sectional scheme of the different layers of a sample with one top layer and one bottom layer fully filled and infill layers 30% filled with a rectilinear 0/90° infill pattern.
Production of moulded samples
The moulded barrels were produced by thermocompression process, using the PH40 press (Lescuyer et Villeneuve, Les Hautes Bruyères, Epeigne les bois, France). A defined mass of polymer was introduced in a mould to obtain homogeneous barrels. The pellets were heated to 250°C for 2 min at 5 kN. Then, the force was set up at 100 kN for 5 min.
Fire tests
UL-94 vertical burning test is commonly used to determine if materials self-extinguish or spread the flames once ignited. In such test, the rectangular 13 × 125 × 3.2 mm3 barrels are held in vertical position. A burner is applied for only 10 s at the bottom of the barrel. Then, the burning time is measured. At the extinguishment of the flame, the burner is applied for another 10 s. The second time to extinguishment is noted as well as the glowing time. The dripping of flaming particles is also recorded. The V0 (best), V1 or V2 ratings attest that the material self-extinguished within a specified time and if the test barrel dripped flaming particles that ignited a cotton located 30 mm under the barrel. Five samples of each barrel were tested.
Heat release rate (HRR) was measured as a function of time using CC (Fire Testing Technology (FTT), West Sussex, UK), according to standards ISO 5660-1. In such test, the sample is a square plate of 100 × 100 × 3 mm3. It is placed in a horizontal orientation on a load cell distant from 60 mm from a conical radiant heater. It is exposed to a 50-kW/m2 external radiative heat flux. This flux corresponds to the late stage of a developing fire scenario. During the heat exposure, HRR was recorded as a function of time. Data were recorded using software ConeCalc 5 (FTT). Three main parameters are used to evaluate CC tests: HRR versus time representing the thermal behaviour of materials, TTI which is the time before sample ignites and peak of heat release rate (pHRR) which allows to predict the growth rate of a fire. All barrels were measured in duplicate to ensure the repeatability of the experiment within the error margins of ±10% for pHRR and Total Heat Release (THR) and ±15% for TTI.
Any parameter could potentially impact the fire behaviour of the samples. The parameters selected were the ones that can be modified with the 3D printing machine and software used. Those parameters are the usual and easiest to modify for FDM users. All the parameters are described hereafter.
In general, nozzle diameter is increased to reduce the printing time without modifying the printing speed. It necessarily increases the layer height and the road width.
As illustrated in Figure 4, the number of perimeters represents the number of contours printed next to each other in a same layer. There is only one perimeter for patterns A, B, D, E and F, while there are six perimeters for sample C in Figure 5.
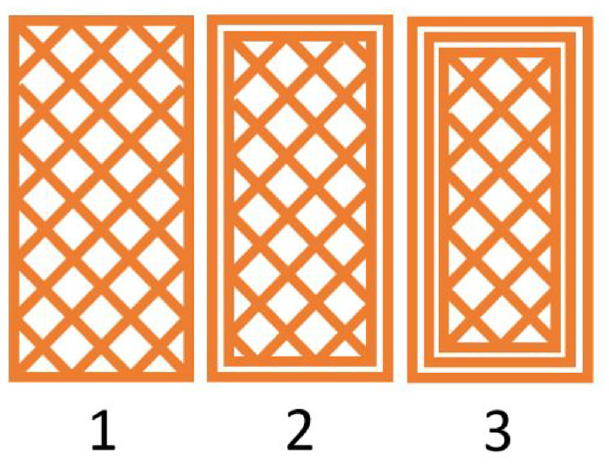
Schematic representation of one horizontal layer with one, two and three perimeters, respectively (patterns of 45/−45° rectilinear infill 30% filled).
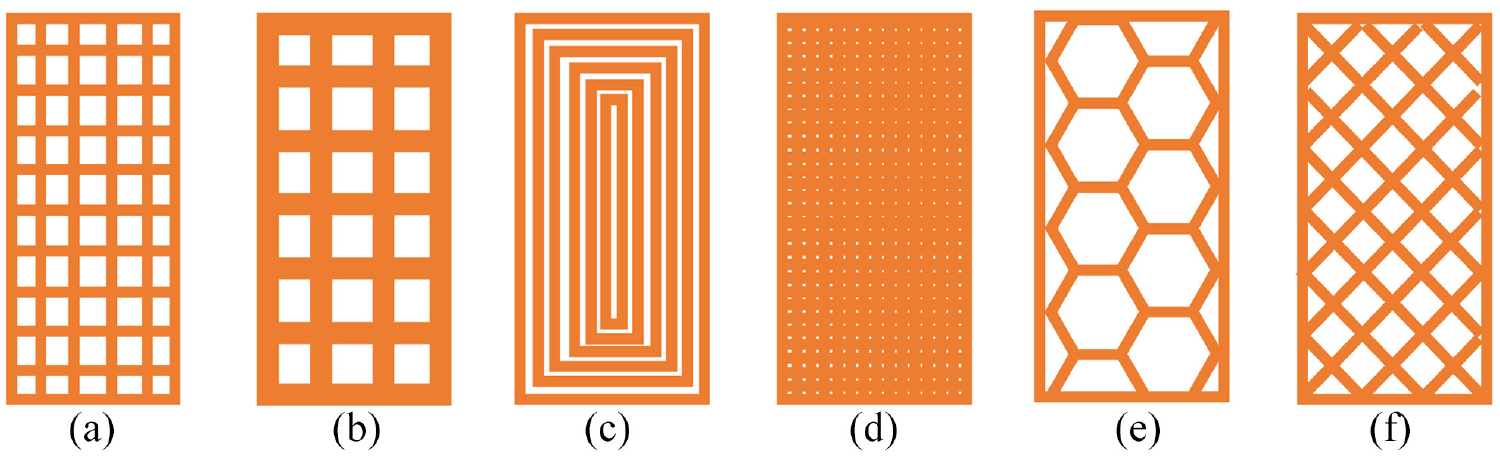
Schematic representation of patterns of different samples: (a) pattern of 0/90° rectilinear infill 30% filled with 1 perimeter and a 0.4-mm nozzle diameter, (b) pattern of 0/90° rectilinear infill 30% filled with 1 perimeter and a 0.8-mm nozzle diameter, (c) pattern of 0/90° rectilinear infill 30% filled with 20 perimeters and a 0.4-mm nozzle diameter, (d) pattern of 0/90° rectilinear infill 100% filled with 1 perimeter and a 0.4-mm nozzle diameter, (e) pattern of 0/90° hexagonal infill 30% filled with 1 perimeter and a 0.4-mm nozzle diameter and (f) pattern of 45/−45° rectilinear infill 30% filled with 1 perimeter and a 0.4-mm nozzle diameter.
The speed is the movement speed of the nozzle while extruding material, usually modified with the extruder temperature to improve the printing quality. It is expressed in millimeters per second.
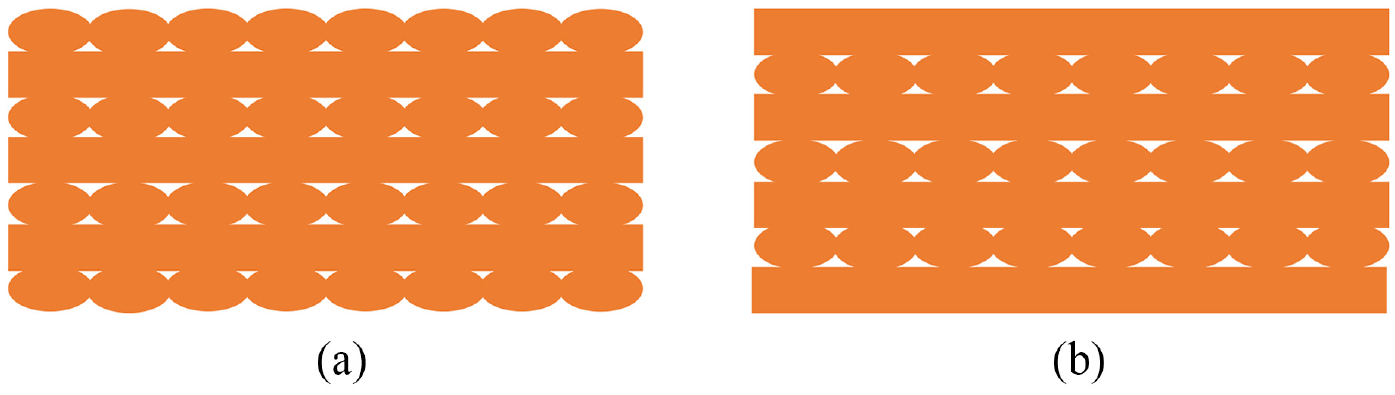
The fill density is the percentage of material deposited inside the perimeters. Figure 5(a) shows a 30% filled sample with a rectilinear pattern (R) and a 0/90° fill angle. Figure 5(b) represents the same parameters as Figure 5(a) but with a 0.8-mm extruder. Figure 5(c) represents a sample completely filled with perimeters. Figure 5(d) represents a 100% filled sample with a rectilinear pattern (R) and a 0/90° fill angle. Figure 5(e) shows a 30% filled sample with a hexagonal pattern (H) and a 0/90° fill angle. Figure 5(f) shows a 30% filled sample with a rectilinear pattern (R) and a 45/−45° fill angle.
The parameter called simultaneous prints indicates if the samples were printed in the same time or if they were printed one at a time. The impact of simultaneous prints will only be studied on UL94V. For the CC analysis, only one sample can be printed at a time due to its dimensions.
Results and discussion
To study the impact of FDM on fire behaviour, we carried out a parametric study. The parameters selected for each sample are displayed in Table 1. Sample 0 is considered the reference sample. Then, for samples 1–8, parameters were modified one by one. The idea is to compare each sample with sample 0 to understand the impact of each parameter on the different fire tests.
Parameters selected for each sample.
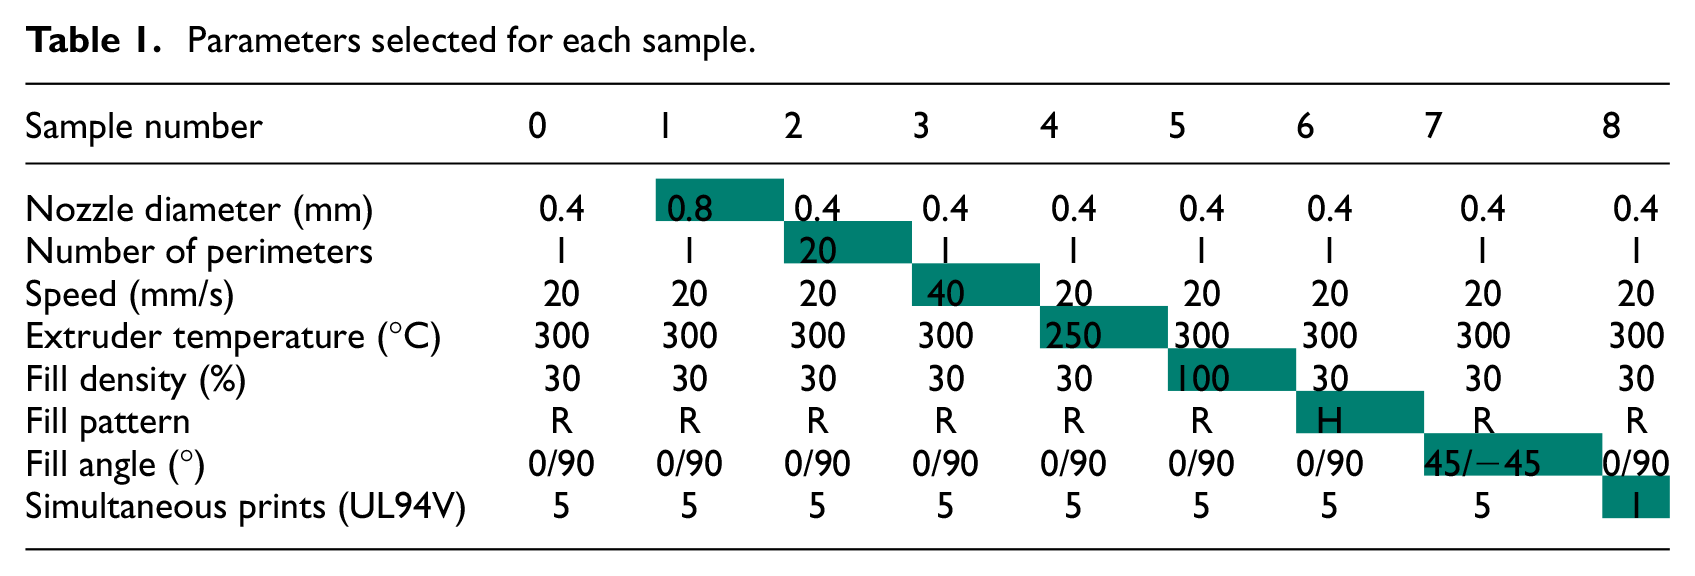
Table 2 shows the number of dripping samples obtained during the UL94V test and the rating obtained for the printed samples presented in Table 1. For each sample, five barrels were printed and tested. The number of dripping samples represents the number of barrels with burning material dripping on the number of barrels tested. The rating is the classification obtained for the sample according to the UL94V test. V0 is the best rating result.
UL94V results (the number of dripping represents the number of barrels with burning material dripping for each sample).
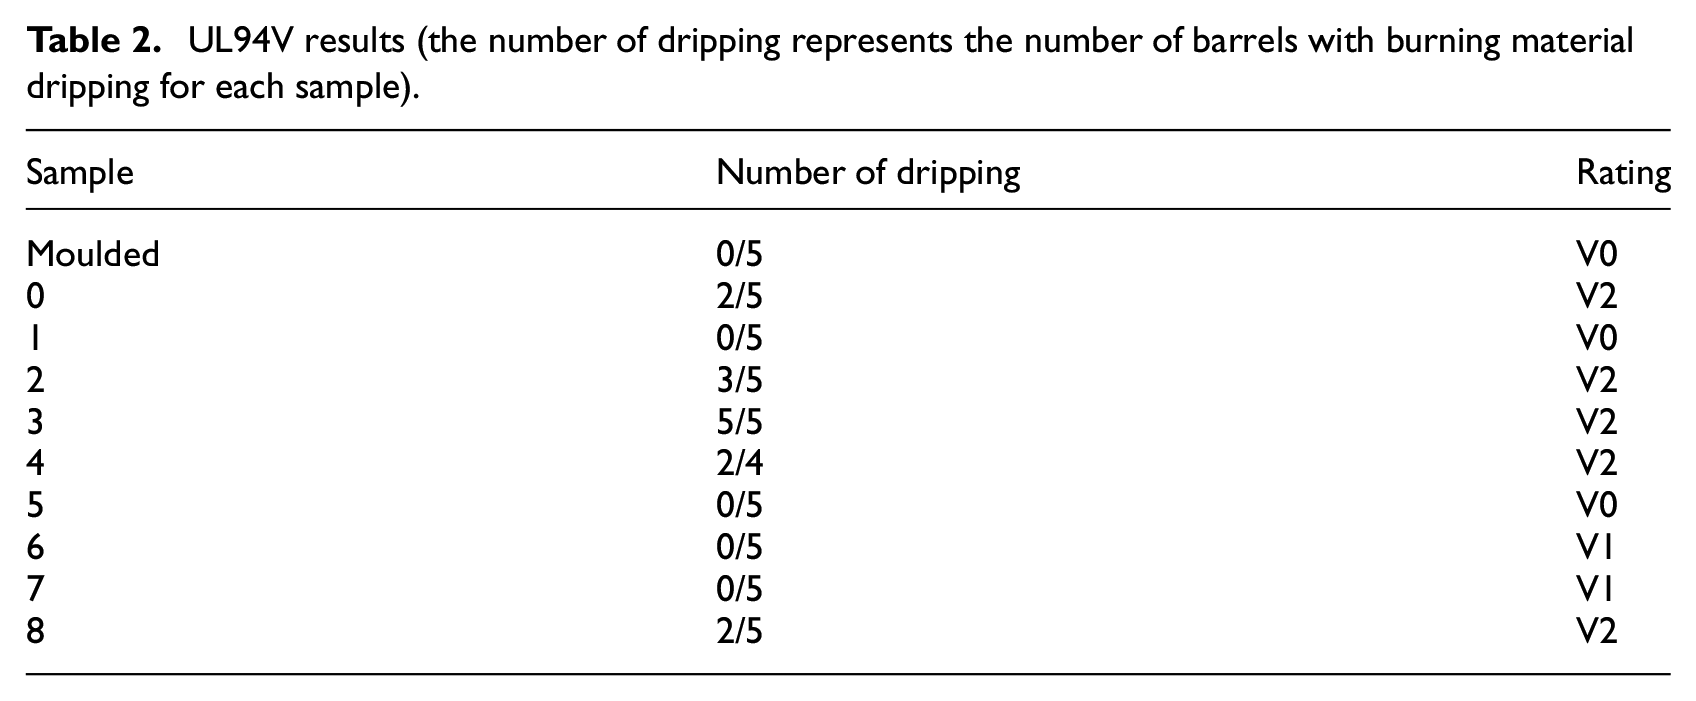
None of the barrels for the moulded sample and for samples 1, 5, 6 and 7 dripped. In opposition, all the barrels of sample 3 dripped. For samples 0, 2, 4 and 8, some barrels dripped but not all of them. This variability will be discussed further.
The moulded sample, sample 1 and sample 5 reached a V0 rating. Samples 6 and 7 were rated V1. Samples 0, 2, 3, 4 and 8 reached a V2 rating.
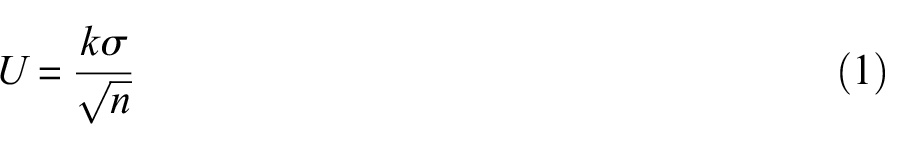
Figure 6 illustrates the mean burning time during UL94V test (blue bars) with the uncertainty of measurement U (in red). The burning time is the addition of the flaming time after the first ignition, the flaming time after the second ignition and the glowing time. The uncertainty U is a repeatability uncertainty calculated with k, the Student coefficient; σ, the standard deviation; and n, the number of barrels tested. The confidence interval selected for this work was 95%. The calculation method is displayed in equation (1). The uncertainties of mean burning time will be compared in relative and absolute terms for the rest of this study.
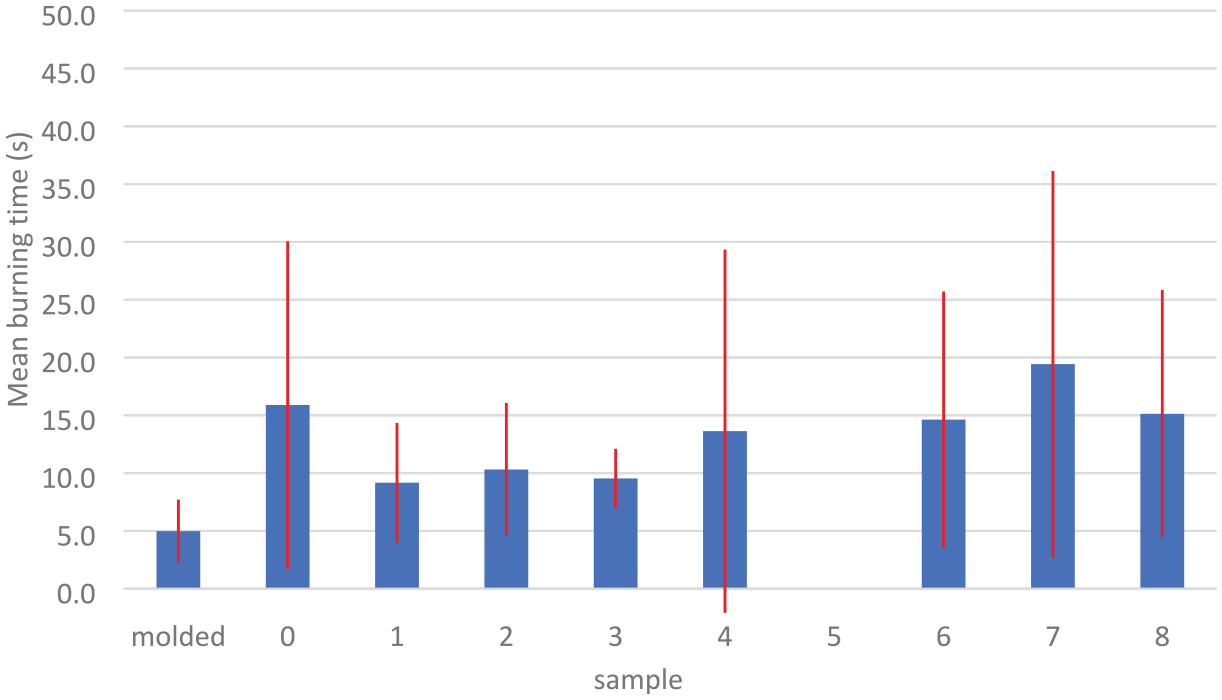
Mean time of burning during UL94V test.
Repeatability uncertainty determination is given by
The moulded sample fulfilled a V0 requirement with a mean burning time of 5.0 ± 2.7 s (corresponding to a relative uncertainty of around 50%). Sample 0 means burning time is 15.9 ± 14.2 s. This uncertainty is around 90% which is significantly higher than the moulded sample. Samples 1, 2 and 3 have a mean burning time around 10 s. The uncertainty is around 50% for samples 1 and 2 (similar to moulded sample) and only 27% for sample 3. Sample 4 obtained a mean burning time of 13.6 ± 15.7 s. The uncertainty value is so high that the value can be considered as irrelevant. For sample 5, the mean burning time and its uncertainty are null. Sample 6 and 8 mean burning times were around 15 s like sample 0 and the uncertainty was around 75% which is still higher than the one of moulded sample. Sample 7 had the higher mean burning time (19.4 ± 16.7 s).
At first glance, except for sample 5, it would not be accurate to sort out the samples from best to worst. No clear analysis of the mean burning time can be achieved due to uncertainties overlapping. Sample 5 was the only one with a lower mean burning time than the moulded sample and no uncertainty.
This result variability was also observed by Tymrak et al. 31 for mechanical property tests and by the UL group when they tested different 3D printing parameters with the UL94V test. The UL group assessed that it was linked with the print quality consistency, therefore with the FDM technology. However, this technology is widely used, thus the necessity to draw conclusions from the results obtained. To draw proper conclusions, each parameter will be extensively studied in the following section.
For samples 1–8, parameters were modified one by one with sample 0 as a reference. Therefore, the impact of each parameter modification can be highlighted by comparing sample 0 with the sample related to this modification. For example, sample 5 was the sample where the infill percent was modified from 30% (sample 0) to 100% (sample 5). Consequently, by comparing sample 0 and sample 5 results, it is possible to highlight the impact of the infill percent on fire test results.
As previously described, sample 5 was the only one to have a much better fire behaviour than the moulded sample, as no burning time and no dripping could be observed. This difference can be explained by observing the cross-section of the 3D printed part.
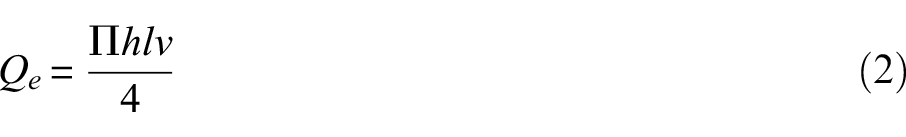
In opposition to the moulded one, the sample made with FDM is labelled as 100% filled, but the barrel contains air (Figure 7). Indeed, there are small holes inside the barrel because of the cylindrical shape of the deposited material. This cylindrical shape of the extruded material produces holes between the different layers. During the burning process, those holes play a major role in the behaviour of the barrel. When the polymer softens, it fills the holes. By doing so, the surface exposed to the flame and accessible to the oxygen was smaller. This smaller surface for a similar volume explains the fire behaviour of sample 5.
Schematic drawing of the (a) transversal plane and (b) sagittal plane of sample 5 infill.
This hole filling behaviour was not observed for the other samples. Indeed, being 30% filled means 70% of holes; consequently, the amount of material is not sufficient to fill the gap between the roads. All the barrels except for samples 5 and 2 (discussed later) can be considered as a group of regularly dispersed polymeric roads wrapped in a one-layer ‘shell’ (Figure 8). The shell is the combination of the perimeters and the top and bottom layers. It is represented in blue in Figure 8, in opposition with the infill in green. The flame starts by decomposing this shell. Then, when this shell softens, the flame attacks cylindrical filaments sparsely bonded.
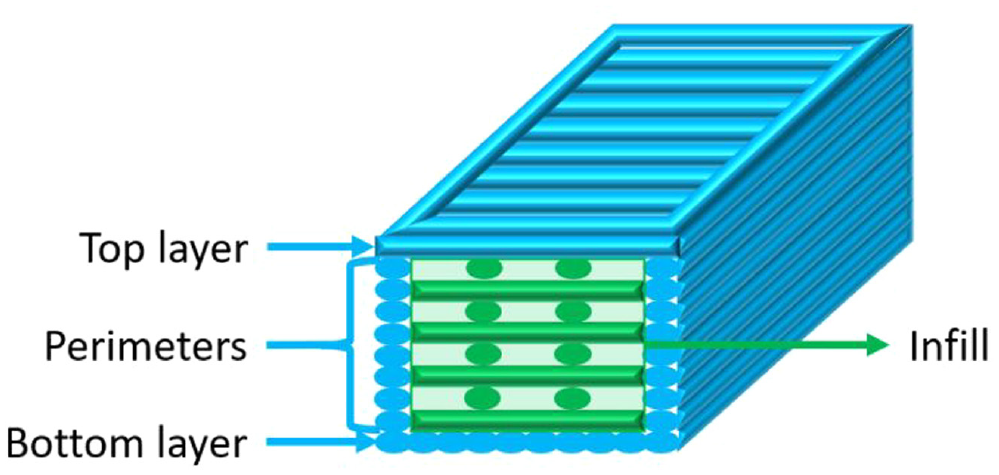
Cross-sectional scheme of the shell for a 30% filled sample. Parameters selected are one perimeter, one bottom and one top layer fully filled. The shell is in blue and the infill is in green.
Despite the sparse bonding induced by the 30% filling, sample 1 fulfilled V0 requirement. Sample 1 was the sample with a bigger nozzle diameter (0.8 mm for sample 1 versus 0.4 mm for other samples). Consequently, the layer height and the road width are modified. The layer height is increased from 0.2 to 0.4 mm and the road width from 0.4 to 0.8 mm (Figure 9). This nozzle diameter increase induces two differences with the other samples.
Comparative cross-sectional schemes of sample 0 with a 0.4-mm nozzle diameter (left) and sample 1 with a 0.8-mm nozzle diameter (right).
The first difference is the ratio between surface and volume of a single extruded polymeric road. The volume of material and the surface accessible to the oxygen and to the flame are key parameters when fire propagation is analysed. This surface/volume ratio for a single deposited road is around 4 mm2/mm3 when the nozzle diameter is 0.4 mm, while it is only 2 mm2/mm3 when the nozzle diameter is 0.8 mm.
The second difference is the shell thickness. Indeed, the layer height and the road width are twice the size of those applied for sample 0. Thus, the perimeters were twice as wide because the road width increased, and the doubling of layer height increased the top and bottom layer thickness greatly. Consequently, the ‘shell’ of the barrels was twice the size of the shell of the reference sample (Figure 9).
To sum up, the infill density was kept constant with bigger and more dispersed roads, while the shell was twice thicker than sample 0. The bigger roads and shells induced a reduction in the ratio between surface accessible to oxygen and volume of material, at the scale of a road, when compared to sample 0. The surface/volume ratio was decreased in the same manner as sample 5.
Sample 5 was nearly fully filled with small holes as explained before. The roads were the same as reference sample. However, because of the density of the material (100% filled), there was more bonding between the roads, and consequently less surface accessible to the oxygen when compared with sample 0. Moreover, when the material softened, the holes were filled by bonding, thus the radical reduction of the surface/volume ratio.
This reduction of the surface/volume ratio is a promising criterion to improve fire retardancy of additively manufactured samples. It could be summarized as, the thicker it is, the better it is to decrease flame propagation. At this stage of the investigation, this criterion is the only one already evidenced. However, this criterion cannot explain the whole results and, especially, the difference in uncertainty of fire test results. To apprehend this difference, the following part of the study will focus on sample 3.
This sample draws the attention as, unlike samples 1 and 5 studied previously, the design is exactly the same as sample 0. The only difference is the printing speed which was increased from 20 to 40 mm/s. This seems to have a direct link on the observation made that dripping uncertainty was not observed (all the barrels are dripping) and that the mean burning time became smaller than that of the moulded sample.
The key to understand this phenomenon lies within the inherent operation of FFF. Theoretically, the extrusion of material is only driven by the filament (Figure 10). When a segment of filament enters in the extruder, it pushes the previous segment which has softened, and this situation repeats itself over and over. Keeping this in mind, there is no reason for barrels to differ from one another.
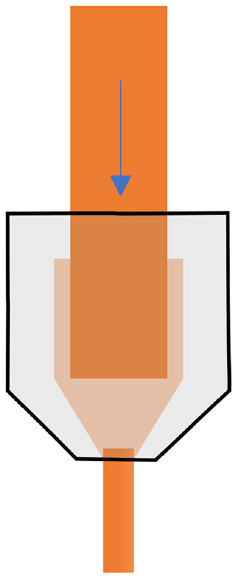
Schematic drawing of the polymer behaviour through the nozzle.
In fact, there is a competition between the extrusion driven by the incoming filament and the extrusion driven by the gravity. Indeed, the softened section can also freely flow because of the gravity. The incoming filament-driven extrusion, or controlled extrusion, does not introduce uncertainty because it is calculated by the 3D printing machine. In opposition, the flow induced by gravity or unwanted extrusion is not taken into account by the calculations.
Therefore, if the unwanted flow is neglectable in relation to the controlled extrusion, the uncertainty decreases. However, if this flow is significant, the extrusion consistency decreases as well as the global print quality consistency.
To decrease the significance of the unwanted flow, it is possible to modify different parameters such as the extruder temperature, the length of the heating chamber and the extrusion flow rate.
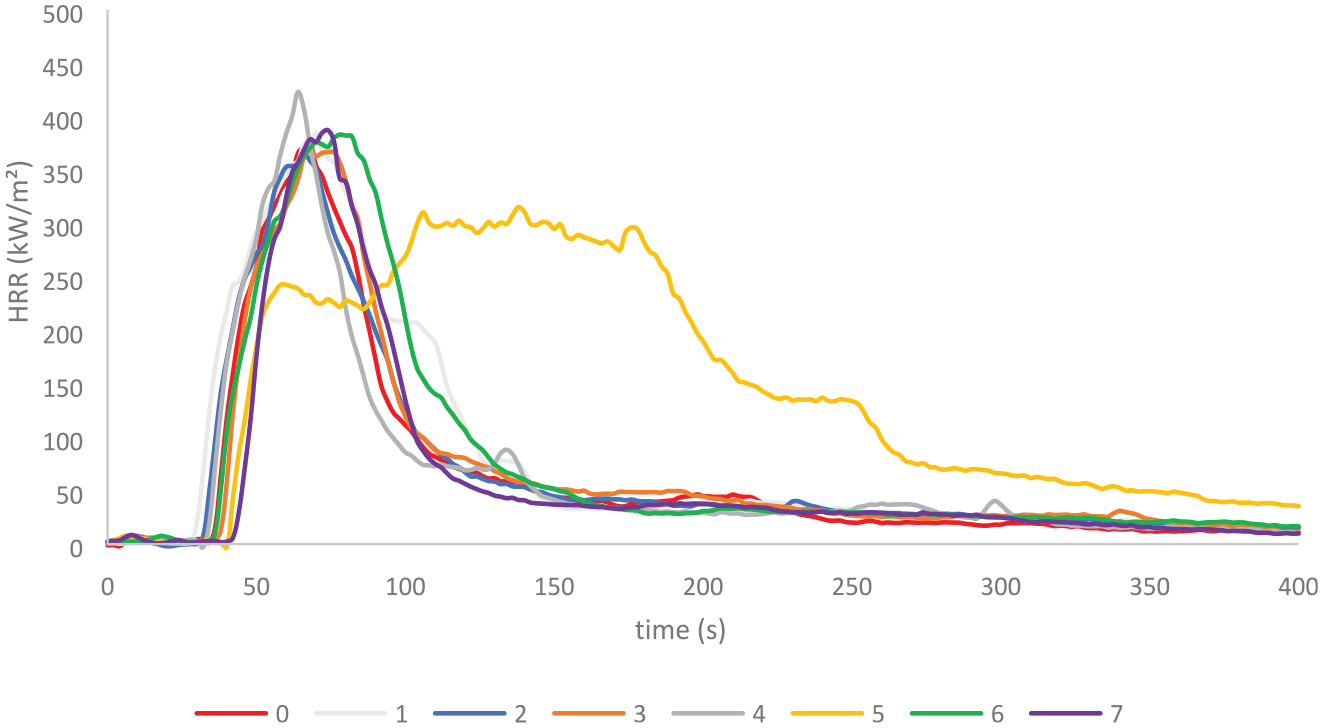
By decreasing the extruder temperature, the viscosity of the extruded material will increase, thus the reduction of its ability to flow freely. This parameter will be discussed later by studying sample 4 (from 300°C for sample 0 to 250°C for sample 4). The decrease of the length of the heating chamber will therefore decrease the residence time of the material, thus the decrease of free flow. This length cannot be modified with the material used. Finally, the decrease of the extrusion flow rate (Qe) can also be performed to decrease the residence time of the material, and consequently the free flow. However, this parameter cannot be directly studied, as it is a combination of the printing speed (v), the layer thickness (h) and the road width (l) linked by equation (2).
Extrusion flow rate determination is given by
By increasing the printing speed (sample 3), the filament residence time in the heated extruder decreases, thus the improvement of the filament-driven extrusion and the decrease of unwanted flow. This analysis explains the difference for the print quality consistency. Increasing the printing speed from 10 to 20 mm/s increases the extrusion flow rate from 2.5 to 5.0 mm3/s. The residence time is divided by 2. The free flow becomes neglectable compared with the controlled extrusion. Therefore, the barrel is more reproducible and the flame propagation results’ uncertainty decreases.
The same analysis can be performed when the nozzle diameter (and consequently the layer height and road width) is doubled in sample 1 compared with sample 0. The uncertainty of sample 1 is similar to the uncertainty of the moulded sample (±50%), while the uncertainty of sample 0 is higher (±90%). The nozzle diameter increase induces the increase of the extrusion flow rate from 2.5 mm3/s (sample 0) to 10.1 mm3/s (sample 1). Again, the residence time decreases, inducing both the reduction of the free flow and the improvement of the repeatability.
As previously mentioned, to decrease the free flow of the material, the extruder temperature can be decreased. Sample 4 was additively manufactured at 250°C in opposition with sample 0 that was printed at 300°C. A decrease of the free flow was expected because of this temperature reduction, leading to a decrease of the uncertainty. However, the results observed were quite at the opposite, the uncertainties for both the mean burning time and the dripping proving the low print quality consistency. The key to understand this apparent contradiction is the minimal temperature limit.
Actually, the temperature was too low. By decreasing the temperature, the free flow decreased due to the increase of the material viscosity. However, if the temperature of the heating chamber is too low when juxtaposed to residence time, the material will not soften enough. It will induce printing defects, resulting in a low print quality consistency.
The material flow is a well-known criterion, but nonetheless a crucial one to master additive manufacturing. The two parameters that can directly impact this material flow are the extrusion flow rate (residence time) and the extruder temperature. The free flow has to be neglectable. To do so, the extrusion flow rate can be increased or the extruder temperature can be decreased. However, if the balance between extruder temperature and printing speed is not perfectly controlled, the polymer cannot soften enough to be properly printed, resulting in printing defects and a globally worst printing quality consistency.
At this point, two different criteria induced by FDM and impacting flame propagation results have been highlighted. Decreasing the surface over volume ratio at both macroscale and mesoscale improves fire performances, while the material flow impacts print quality consistency, thus fire tests’ uncertainty. In that frame, some results still cannot be explained by only those two criteria. The impact of the filling design will be discussed by analysing samples 6 and 7 results.
Samples 6 and 7 were the only ones showing no dripping, but they both display a huge uncertainty for the mean burning time. These samples were related to changes in infill design. Sample 6 infill was rectilinear with an infill angle of 45°/−45° (Figure 5(f)), whereas sample 7 infill was hexagonal (Figure 5(e)). The results of the fire tests related to those samples highlight the impact of the design on fire performances. Actually, they were able, thanks to their designs, to retract when softened and, by doing so, to move away from the flame. For sample 0 (rectilinear with a fill angle of 0°/90°), it was impossible to escape the flame when softened. This phenomenon could explain the dripping observed for some barrel. The behaviour of the sample when exposed to the flame is thus directly related to the design of the samples. Indeed, two samples with the same infill percentage behave in a complete different manner.
Thereby, a balance between three main criteria comes up: the surface over volume ratio, the material flow control and the design of the part. The design of the part and the surface over volume ratio impact the fire performances, while the material flow impacts the print quality consistency.
Regarding sample 8, the uncertainties for both the dripping and the mean burning time do not allow a proper evaluation. The parameter modified for this sample was the number of barrels printed simultaneously (five barrels for sample 0, one barrel for sample 8). This parameter does not impact any of the three criteria previously described. The results and uncertainties for both the dripping and the mean burning time are similar to the results of sample 0. Thus, the number of barrels printed can be considered as insignificant for the flame propagation tests. Sample 8 confirms the results previously described.
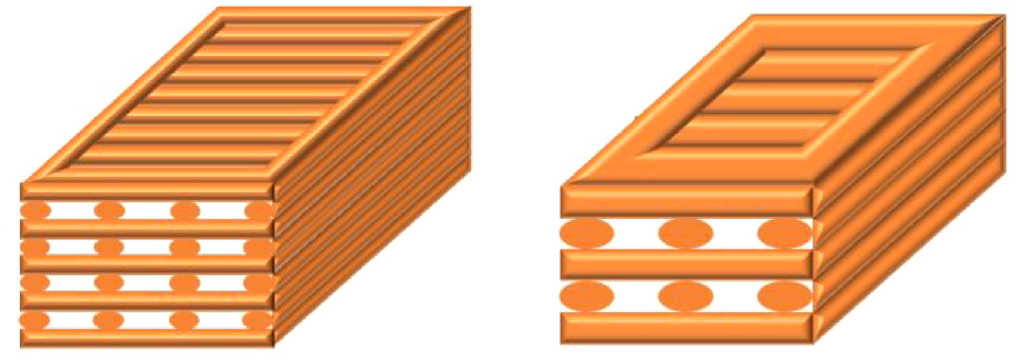
Sample 2 had a much more complicated behaviour. This sample was related to the number of perimeters (number of contours of the barrel printed). With a number of perimeters of 20, there was only the perimeter pattern and no infill pattern remaining (Figure 11). This increase in the number of perimeters results in increasing the amount of material deposited and the mass of the sample. The same amount of material, surface over volume ratio and material flow were used for samples 2 and 5; consequently, similar results were expected (Figure 11). However, for sample 2, three over five barrels dripped and the mean burning time was higher than that of sample 5.
Cross-sectional scheme of the barrel of sample 5 (left) and sample 2 (right).
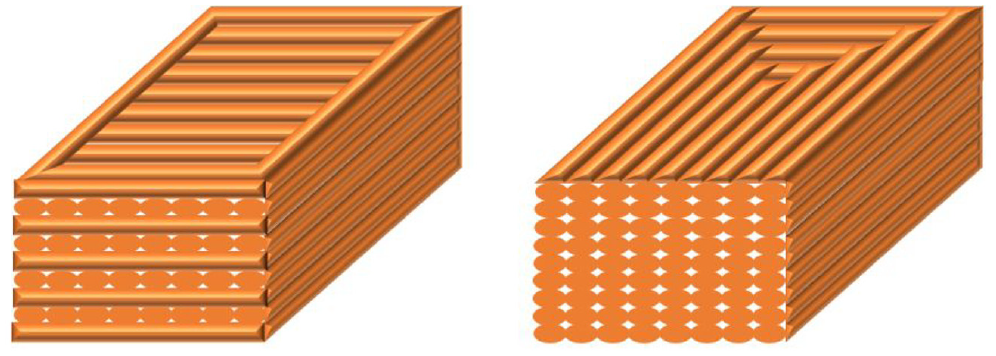
This huge difference can be explained by the sample 2 pattern. Indeed, during the printing of sample 5, there was a 90° rotation of the infill axis for each layer (0/90°). For sample 2, there was no 90° rotation of the infill because there was no infill. This absence of rotation increased the impact of the anisotropy generated by FDM. Indeed, when exposed to the flame, just like sample 5, the material softened and filled the holes by a bonding mechanism. However, the orientation of the holes induced a worse macroscopic scale behaviour (Figure 12). The bottom of the sample shrinks to the top, while the lateral edges shrink towards the centre of the sample. Those shrinkages created gradually a dangling part of material linked with the unburnt part by a smaller amount of material, progressively decomposing until the dripping of the sample can be observed.
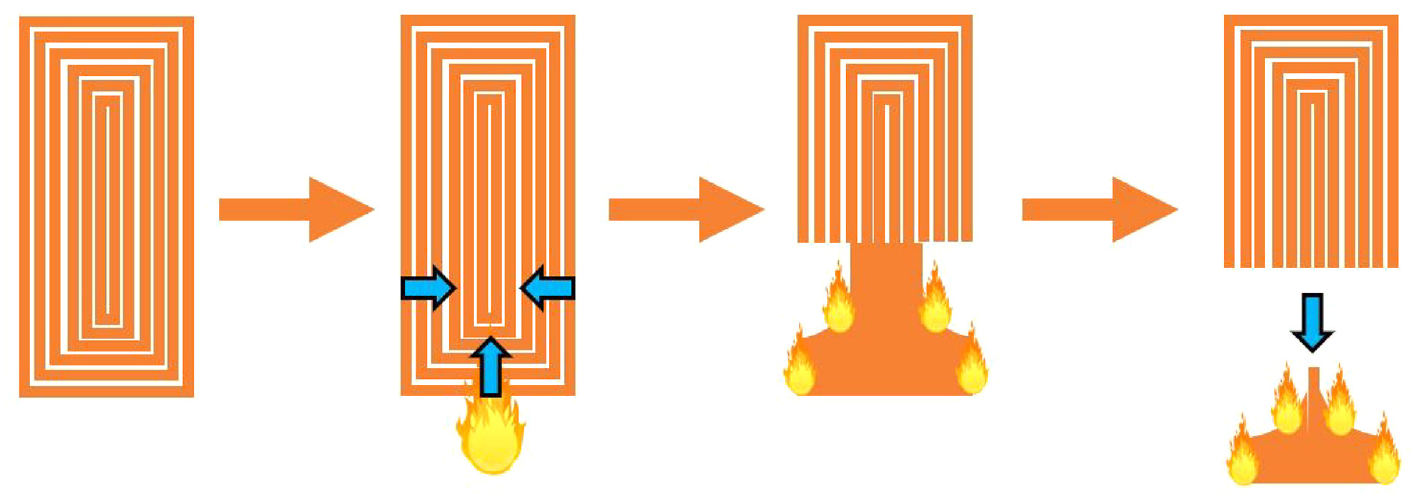
Illustration of fire behaviour mechanism of sample 2 under UL94V test conditions.
The fact that some samples did not drip, while others did, can be considered as a consequence of the low printing quality consistency, induced by the free flow phenomenon previously explained.
To sum up, even using the same initial material, parameters of additive manufacturing via FDM can highly impact the flame propagation test results. Some samples had a really good repeatability and others had a huge uncertainty. The global pattern, the nozzle diameter, the printing speed and the infill percentage are key parameters to modify the flame propagation test results, to improve them and even to surpass these of the moulded samples. The impact of the FDM on UL94V test results can be summed up in a trio of criteria: surface over volume ratio, part’s design and material flow.
Those criteria can be extended to all other vertical flame propagation tests such as the 12- and 60-s vertical burner tests used in aeronautical applications. However, the question may arise of the additive manufacturing impact on other fire tests than UL94V test, such as pure radiative tests (e.g. CC). An investigation was then carried out with CC at 50 kW/m2, using similar materials and FDM parameters as in the previous study.
Figure 13 shows the HRR of the 3D printed samples as a function of time. Only the first 400-s results are displayed because all samples were extinguished at this time. Only one of the two plates tested for each sample is displayed in Figure 13. Indeed, all the results were in adequacy with the uncertainty of the CC (±10%).
HRR as a function of time measured by cone calorimetry (external heat flux = 50 kW/m2).
For sample 0, ignition occurs after 36 s and HRR reaches its maximum value after 68 s (pHRR of 375 kW/m2). After reaching the pHRR, the HRR drops quickly due to the lack of material remaining to maintain the burning process. The char obtained was not fully developed.
The same fire behaviour was observed for all the other 3D printed samples except for sample 5. To sum up, for samples 0–4, 6 and 7, the ignition occurs at 36 ± 6 s and HRR reaches its peak at 70 ± 6 s. Moreover, the pHRR of all samples except for sample 5 is about 384 ± 39 kW/m2.
Sample 5 displays a different fire behaviour compared to the other samples. Indeed, after the ignition of the material (42 s), the formation of an expanded char stops the HRR growth until the surface cracks. It leads to another HRR growth until reaching a plateau around 300 kW/m2 for 100 s. Then, the HRR drops down.
All the samples, except sample 5, display a similar fire behaviour. Those similarities are explained by the behaviour of the samples under the radiative heat flux. Actually, when exposed to the radiative heat flux, the barrels are softening long enough before burning. This softening cancels the anisotropy, the design and all the impacts of the additive manufacturing process, thus the similarity between the 30% filled samples (sample 0–4 and 5–7).
Sample 5 is the only sample 100% filled, whereas all the others are 30% filled. Therefore, only the parameters modifying the sample mass have an impact on the behaviour of the material during the CC test.
However, this result has to be further studied by comparing a fully filled FDM sample (sample 5) with a fully filled moulded sample. The objective is to determine if the FDM technology induces a different fire behaviour due to the presence of holes inside the sample (Figure 7) and the anisotropy.
Figure 14 shows the superimposition of HRR curves of a 100% filled 3D printed sample (sample 5) and a moulded sample. The fire behaviour of the 3-mm moulded sample is similar to the one of sample 5. Indeed, after the ignition occurs, an expanded char stops the HRR growth until cracking. Then, another HRR growth is observed. Finally, the HRR drops down when the amount of remaining material is too low to sustain the fire.
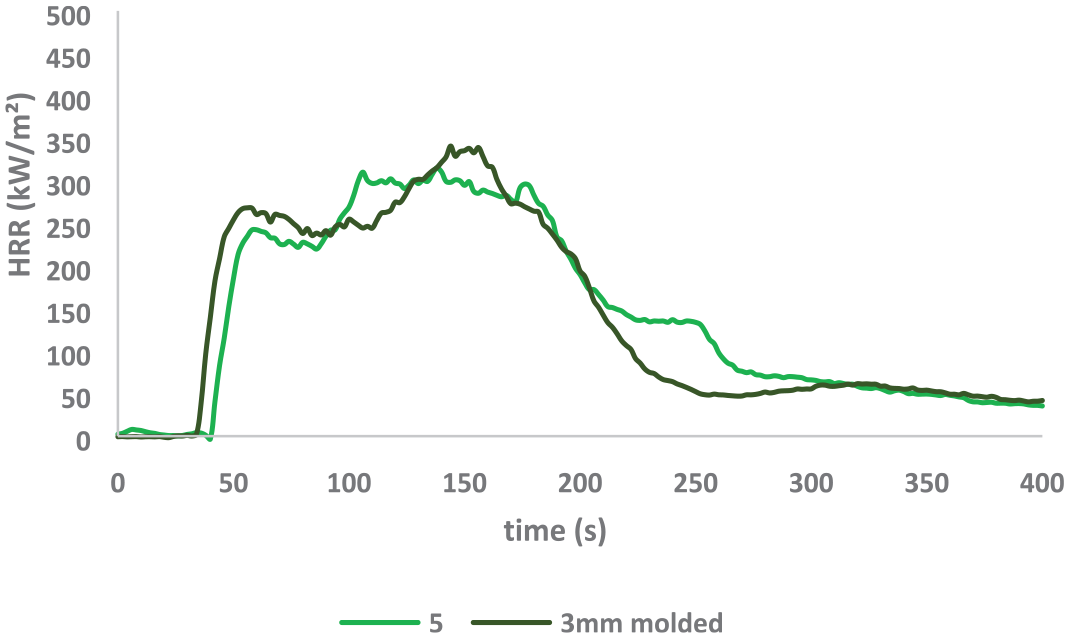
HRR as a function of time for cone calorimeter results of a thermoformed sample and a 100% filled 3D printed sample.
This similarity between the moulded sample and the 100% filled one can be explained by the softening before burning process just like the similarity between the other samples. Thus, one can conclude that only the mass of the sample is impacting the fire behaviour.
At this point, the only impacting parameter is the mass sample. However, the thickness of a barrel is also considered a key parameter regarding CC test. 32 Therefore, the analysis of this parameter in additive manufacturing is necessary. In that frame, a 3-mm-thick sample 0 filled at 30% was compared to a 10-mm-thick sample.
Yet, to decorrelate the thickness and the amount of material, the infill percentage of the 10-mm-thick sample was modified. To facilitate the understanding, sample 0 will be referred to as sample 3 mm and the other one as sample 10 mm. The objective was to obtain the same amount of material in both samples. As the top and bottom layers are 100% filled and the barrels have one perimeter, the only modifiable parameter was the infill percentage. Sample 10 mm was filled at 7%. Thus, both samples 3 and 10 mm display the same mass but not the same thickness.
Figure 15 shows HRR curves of samples 3 and 10 mm. One can observe that both samples show similar behaviour. Indeed, after the ignition, the HRR grows until reaching a peak of 375 kW/m2. Then, the HRR drops quickly due to the lack of material to keep the fire burning.
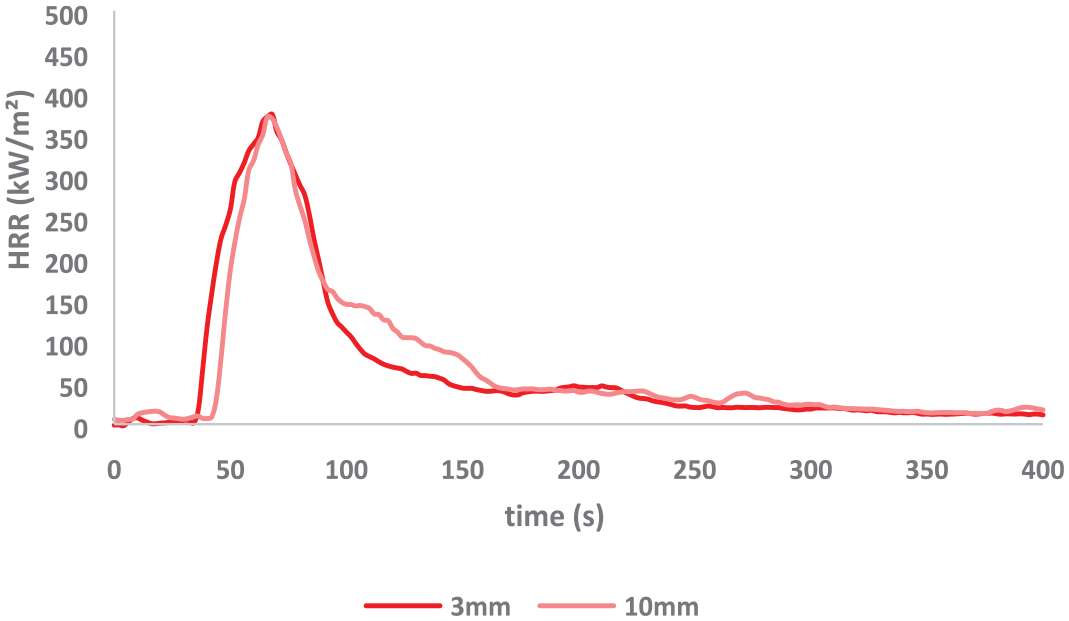
HRR as a function of time for cone calorimeter results of sample 0 (30% filled 3 mm thick) and a 7% filled 10-mm-thick sample.
This similar behaviour highlights that the thickness of the sample does not impact the cone calorimetry results if the amount of material is kept constant. At the first glance, this result is not in adequation with the consideration of the thickness as a key parameter in cone calorimetry. However, in a general manner, an increase in thickness induces an increase in the amount of material. Indeed, all the studies connecting thickness and CC results were realized with fully filled moulded materials. This correlation between thickness and amount of material is not necessarily applied with FDM, thus the possibility to consider the thickness, decorrelated of the mass, is not impacting in cone calorimetry because of the softening of the material.
Overall, under radiative heat flux conditions, FDM samples are softening before burning. Therefore, neither the thickness nor the design induced by the process impacted the fire behaviour in this study. At a broader level, with the parameters studied here, we could consider that only the parameters modifying the sample mass may have an impact on thermoplastic polymers, whatever the technique used to prepare the sample, but further studies would be needed before confirmation.
Conclusion
This work highlights the fundamental importance of additive manufacturing parameters on fire properties. Indeed, flame propagation tests are deeply impacted by additive manufacturing parameters, while CC results appear to be directly linked with the amount of material.
On one hand, flame propagation is impacted by the material flow, the surface/volume ratio and the design of the part. Controlling the material flow is a prerequisite to consider the flame propagation results as reliable. Decreasing the surface/volume ratio improves fire performances. Modifying the design of the part also allows to manage fire performances but the behaviour of the material during the test needs to be anticipated.
On the other hand, cone calorimetry tests were only impacted by the amount of material. Indeed, the softening erases any impact induced by the additive manufacturing process.
This work was performed using a thermoplastic fire-retarded polycarbonate/acrylonitrile butadiene styrene (PC-ABS). The analysis for both flame propagation and radiative heat flux could be extended to all the thermoplastics used in FDM. Indeed, there is no reason for thermoplastics not to be impacted by the same three criteria in flame propagation conditions and not to soften before burning under radiative heat flux.
This study was done with the most frequently used parameters in FDM to develop the existing knowledge. However, a lot of synergies would need to be studied as well as other materials to completely ensure the impact of additive manufacturing on flame retardancy.
Materials need to fulfil specifications to be used in different transportation markets. To do so, the materials have to pass different kinds of fire tests. Previously, with the other manufacturing technologies, improving the fire test results of a material was only achieved by modifying its chemistry. With additive manufacturing, a brand novel optimization pathway opens by combining chemistry and design thinking to optimize reaction to fire of thermoplastics.
Footnotes
Declaration of conflicting interests
The author(s) declared no potential conflicts of interest with respect to the research, authorship and/or publication of this article.
Funding
The author(s) disclosed receipt of the following financial support for the research, authorship and/or publication of this article: This work was supported by the Association Nationale de la Recherche et de la Technologie (ANRT) through the CIFRE PhD, ANRT CIFRE N° 2018/0511.