
Abstract
This study investigates the venting behavior of compressed natural gas from passenger vehicle fuel tanks through temperature-triggered pressure relief devices at full capacity (200 bar). Experimentally measured mass loss rates were calculated to provide gas source boundary conditions for compressed natural gas dispersion modeling and to support evaluation of methods for predicting gas flow from pressurized systems in accidental releases. Using air as a venting gas, near-field flow patterns were qualitatively analyzed, revealing four characteristic regimes: (1) air entrainment from behind the vehicle, (2) left rear wheel recirculation, (3) forward-directed flow under the car, and (4) right rear wheel free jet. These regimes were confirmed in a full-scale vehicle fire test, demonstrating the relevance of the observed flow patterns for real fire scenarios and providing an experimentally supported framework for hazard assessment and risk evaluation of accidental compressed natural gas release.
Keywords
Introduction
Increasing demand for alternative fuels and a growing energy market in the last two decades for both fixed and transportation fuel installations led to an increased need to understand the safety aspects of such installations and to implement appropriate regulatory measures. Among the wide range of alternative fuels, 1 natural gas, mostly in its compressed form (compressed natural gas (CNG)), has become widely used in the transportation sector. Khan et al., 2 in a comprehensive overview of CNG as a transportation fuel, identify the main reasons as the environmentally friendly nature of CNG, its availability, compatibility with conventional spark ignition engines, and low cost. A non-negligible factor is also the support of governmental authorities and regulatory agencies through subsidies for alternative fuels.
As CNG becomes increasingly common in passenger and commercial vehicles, attention is turning toward the safety performance of onboard gas systems during accidental scenarios—particularly those involving fire. One such fire-driven risk is the activation of a thermal pressure relief device (TPRD), which is installed to vent high-pressure gas in case of overheating and prevent cylinder rupture. These devices are typically triggered by elevated temperatures during fire exposure and are intended to reduce pressure buildup by controlled venting. However, the consequences of such rapid gas release—such as gas dispersion behavior, flammable mixture formation, and potential ignition—remain only partially understood, especially in complex vehicle environments.
CNG systems are often evaluated alongside hydrogen systems due to similarities in gas installation layout and safety devices used. 3 In risk analyses, computational fluid dynamics (CFD) is commonly applied to model post-release gas dispersion.4–6 However, simulating the full dynamics of high-pressure venting through millimeter-scale TPRDs at pressures up to 200 bar is computationally prohibitive. These discharges form underexpanded, supersonic jets with shock structures. 7 As a result, detailed TPRD geometries are typically replaced by simplified mass flow boundary conditions, often based on isentropic, Fanno, or Rayleigh flow assumptions. 8
While this approach is practical, it lacks validation for CNG-specific venting scenarios. Two key knowledge gaps currently limit realistic risk and fire hazard assessment: (1) experimentally validated mass flow curves for CNG TPRD venting and (2) characterization of the near-field flow structure immediately after gas release in realistic geometrical conditions. The flow dynamics influence where and how flammable mixtures may form, whether the release results in a jet fire—its orientation, length, and duration—or whether it leads to the formation of a flammable gas cloud. To address these gaps, this study focuses on two specific research questions (RQs):
Quantifying this time-resolved release provides a defined mass flow rate boundary condition over time, reduces uncertainty in dispersion and fire-growth models, improves prediction of flammable gas concentrations in space and time, and supports safety regulations and mitigation strategies.
Characterizing these flow regimes is essential for evaluating ignition likelihood and fire dynamics. The results inform simplified dispersion models, fire hazard prediction, and emergency response planning. The experiments provide information about the transient discharge dynamics, while the CFD simulations are used to interpret the interaction of the jet with the surrounding vehicle geometry and the resulting near-field flow behavior.
To answer these questions, the study integrates controlled mass loss experiments, CFD modeling, and flow visualization using tufts, tracer smoke, and hot-wire anemometry. Observations are further qualitatively validated against video footage from a full-scale vehicle fire test, previously analyzed in the work by Jahoda et al. 9 Together, these methods form a comprehensive framework for understanding CNG release dynamics and their implications for fire hazard assessment in passenger vehicles.
Pressure relief system
Thermally activated pressure relief devices are a mandatory safety component of onboard CNG fuel systems, as required by UN/ECE Regulation No. 110. 10 TPRDs represent an essential safety component of each CNG fuel system. The heating of the pressure cylinder results in pressure buildup. If not vented, it may lead to the cylinder rupture. The TPRD function is to vent natural gas from the pressure cylinder when exposed to excessive heat, mostly as a result of a fire in the vicinity of the vehicle or in the vehicle itself. Regulation No. 110 10 specifies not only the required components of the fuel system but also the performance of the TPRD–vessel assembly as verified in standardized bonfire tests. TPRD construction and placement vary considerably across manufacturers. The number of outflow openings and their total cross-sectional area may differ significantly. This variability makes it challenging to assess the risk associated with gas release, particularly under real accident conditions.
Pressure-relieving devices are widely used in many industrial applications and are typically triggered by pressure. These systems generally feature much larger orifice diameters to relieve higher flow rates at lower working pressures. Standardized sizing correlations and computational methods for industrial systems are well established. 11
However, pressure relief devices used in CNG vehicles differ substantially, featuring much smaller orifices and less well-understood discharge behavior. In CNG vehicles, the outflow diameter of TPRD is in the order of millimeters. Outflow from a high-pressure reservoir through such a small opening (nozzle) results in supersonic flow. Working pressure of CNG vehicles typically reaches 200 bar (up to 700 bar for hydrogen systems). In such conditions, shock waves emerge, and a highly underexpanded jet forms just beyond the exit plane of the opening. 7 The dynamics of methane and hydrogen underexpanded jets have been studied in fuel injection systems of combustion engines, where both experimental and computational approaches have demonstrated good agreement.12,13 While the physics of underexpanded jets is well known, gas release from actual TPRDs in vehicle applications has received limited attention.
The specific CNG fuel system investigated in this study consists of two metal cylinders, both 48.5 L in volume. TPRD is mounted on each vessel as a part of a multifunctional solenoid valve, which includes an automatic, manual, and excess flow valve, and a connecting fitting to the high-pressure fuel line. The multifunctional valve is mounted on the neck of each cylinder.
The TPRD has a cylindrical shape, approximately 17 mm in diameter and 30 mm high. It is equipped with six circular outflow orifices, each 3 mm in diameter (see Figure 1). TPRD is filled with an indium–bismuth alloy designed to melt at 110 ± 10°C. The gas and the alloy are separated by a piston-shaped component that pushes the molten alloy out of the TPRD (see Figure 1) once the melting temperature is reached. The outflow area is fully opened only when the entire volume of the molten alloy is pushed out of the TPRD body.
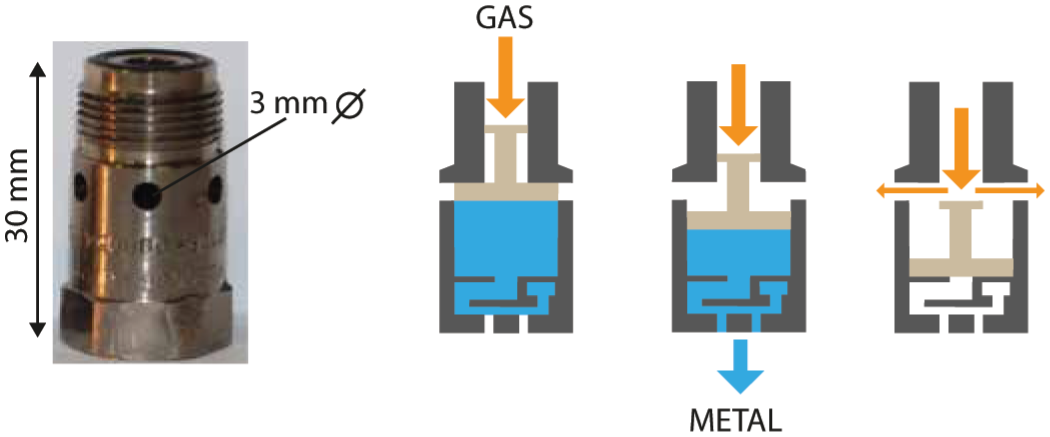
Image of the pressure relief device experimentally studied.
Experimental methods
To address the two main research questions of this study—(1) how natural gas vents from realistic safety devices under high-pressure conditions, and (2) how the resulting flow behaves under and around the vehicle—a series of targeted experiments was conducted. The approach combined (1) time-resolved mass loss measurements from pressurized vessels to characterize outflow behavior, (2) flow visualization using tufts and smoke to capture gas interaction with vehicle geometry, and (3) local velocity measurements via hot-wire anemometry to quantify air entrainment, gas mixing, and jet velocity. In contrast to idealized or theoretical nozzle studies, these experiments were carried out using actual hardware components mounted within representative vehicle configurations. The measurements were designed to complement numerical simulations and to provide realistic boundary conditions and validation data.
Mass, pressure, and temperature measurements during pressure relief
Experimental data on accidental gas release from CNG vehicles remain scarce. This is primarily due to the wide range of possible leak scenarios, the diversity of TPRD designs, and their variable placement within vehicle fuel systems. Venting experiments with highly flammable gas at pressures up to 200 bar also present significant safety risks. In addition, environmental concerns further limit the feasibility of large-scale testing.
This section describes the experimental setup, experimental conditions, and calculation methods used to provide inlet conditions for CFD and dispersion models. Discharge experiments were conducted using 200-bar cylinders equipped with TPRDs. Pressure, temperature, and mass were measured. The mass loss curve was calculated and fitted using a polynomial function to derive the mass flow rate.
Natural gas outflow setup
An experimental setup with a remotely controlled outflow valve (Figure 2) was used to characterize the venting behavior of CNG at a storage pressure of 200 bar. The setup incorporated a TPRD described in the “Pressure relief system” section, modified by removing the fusible alloy to isolate the mechanical outflow behavior from any heat-induced effects and to improve repeatability. The total TPRD outflow area was approximately 42.41
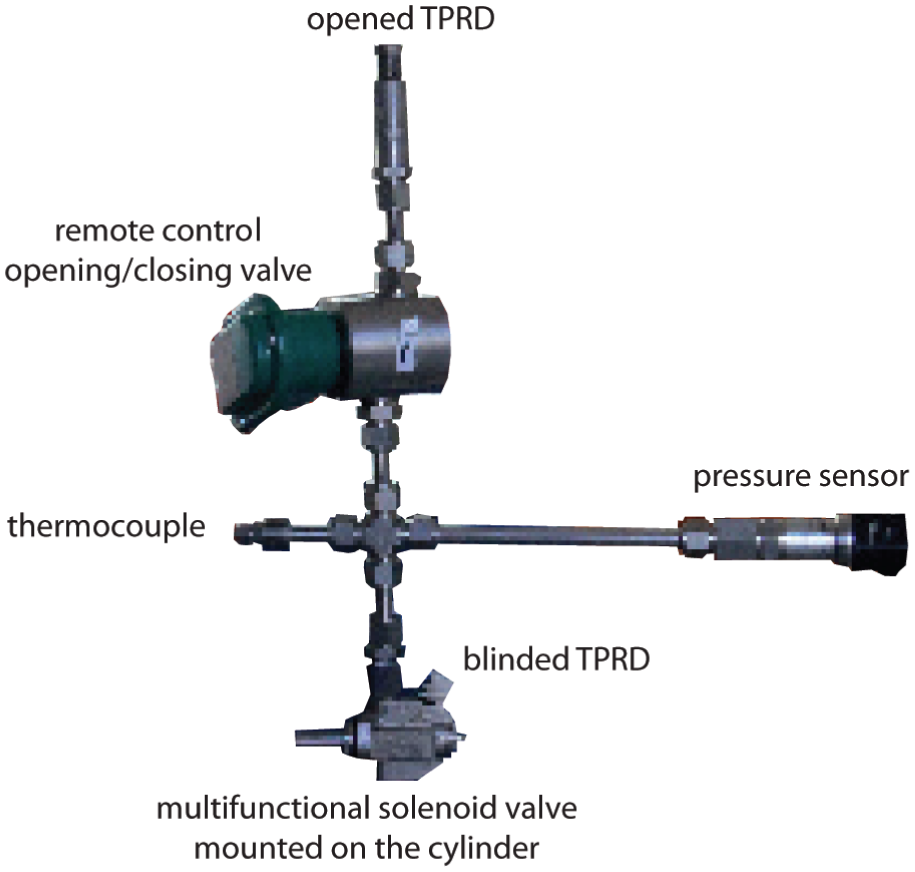
Piping section with a remote control solenoid valve mounted on the cylinder neck, ended with the TPRD used both for CNG and for air experiments. TPRD on the multifunctional solenoid valve is sealed.
The multifunctional solenoid valve mounted directly on the neck of the cylinder was modified to provide a permanently open flow path to the high-pressure line outlet. TPRD outlet on the solenoid valve was sealed. A section of piping with an open/close solenoid valve enabling remote control of the venting process was mounted to the high-pressure line outlet. The TPRD was opened and mounted behind the opening/closing valve. The gas pressure (relative pressure sensors, range: 0–400 bar and accuracy: 0.35% span) and temperature (insulated K-type class 2 thermocouple with a 1-mm bead) were measured in the section of the piping before the solenoid valve (see Figure 2). No instrumentation ports were inserted into the cylinder itself to monitor conditions inside the vessel as a safety precaution for natural gas discharge experiments. The cylinder was attached to a metal frame and placed on a balance with an accuracy of ± 30 g. Sampling frequency of pressure, temperature, and mass was 1 Hz. A cylinder filled with natural gas (supplied from a commercial gas station) at approximately 200 bar (190 ± 3 bar, 7413 ± 120 g of CNG) was vented in five independent experiments.
Mass loss rate calculation
In dispersion modeling and risk assessment, gas release from high-pressure reservoirs is typically defined via a mass inlet boundary condition, specified as a mass loss rate (MLR) in grams per second. In this study, MLR was derived from measured vessel mass as a function of time (see Figure 7). The raw mass data were very noisy during the initial phase of discharge. The noise was caused by mechanical vibrations of the vessel immediately after valve opening, despite being mounted on a rigid frame. In addition, small differences in the initial pressure between experiments introduced variability in the discharge behavior. To mitigate these effects, the average MLR was not calculated directly by differentiating individual experimental curves. Instead, a non-dimensional approach was adopted.
For each experiment, the instantaneous mass was normalized by the initial mass, resulting in a non-dimensional mass curve (
The initial mass of natural gas in a tank of constant volume
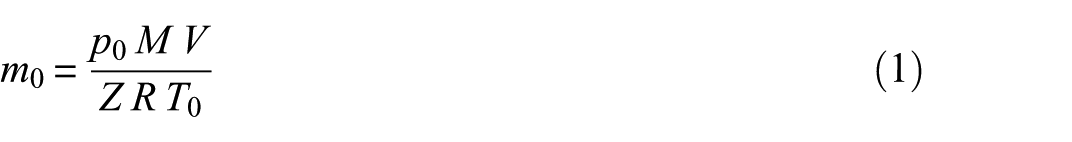
Fuel tank volume is 0.0485

where

with
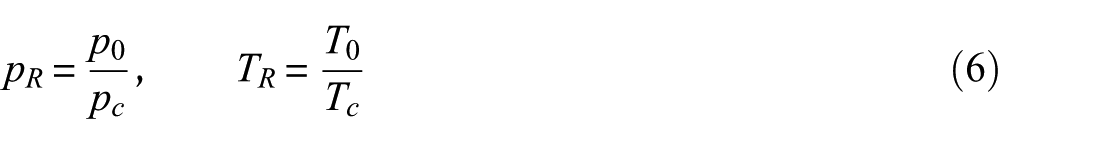
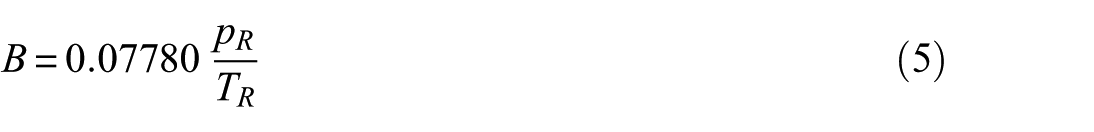
where the pseudocritical pressure
Initial mass calculated using the real EoS (Equation (1)) and values stated above in this paragraph equals 7556 g, which is 143 g more than the average from the experiment.
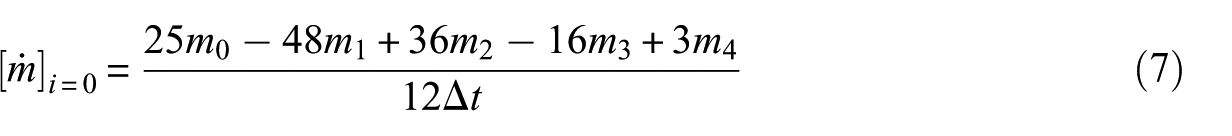
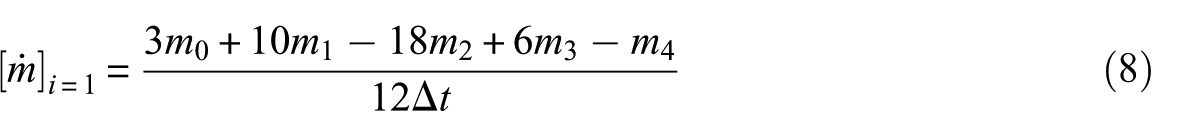
Once the average mass as a function of time was calculated using the non-dimensional average mass, MLR (
The experimentally derived MLR is intended as a transient mass-based boundary condition for future dispersion and hazard modeling. In this study, however, the CFD simulations (“3D CFD modeling of TPRD discharge and near-field flow structure” section) are not directly driven by this transient MLR input. Instead, steady-state pressure-based simulations are used to investigate pressure losses and near-field flow structure under representative conditions.
Flow visualization and velocity measurement around the vehicle
While mass loss experiments characterized the outflow rate at the source, understanding how the gas disperses immediately downstream of the TPRD outlet—particularly under the vehicle body—is essential for characterizing flow behavior and assessing how geometry influences jet development. This part of the study focuses on capturing the near-field flow behavior following high-pressure CNG release through a vehicle-mounted TPRD. A combination of tuft test, smoke tracing, and local velocity measurements was employed to map flow direction and jet interaction with surrounding structures under realistic installation conditions. These experiments were conducted around a full-scale vehicle body to reflect real-world confinement and ground effect influences. The results support the interpretation of flow patterns and serve as validation for the CFD simulations described in the “Computational part” section.
Test setup and gas discharge configuration
To ensure safe operation during the experiments, compressed air was used instead of natural gas. Although the thermophysical properties differ slightly, the flow behavior in the near field is expected to remain representative, particularly under high-pressure, choked-flow conditions. This substitution enabled repeatable and controlled experiments while preserving the geometry of the CNG vehicle system.
The experimental configuration was designed to replicate realistic venting conditions from TPRDs mounted on a CNG vehicle. The setup preserved the actual vehicle installation and geometry while enabling detailed flow observations and measurements under controlled laboratory conditions. The only difference from the real geometry was dismantling the rear bumper to allow for the clear visualization of the flow field, and most importantly, to ensure that jet formation could be observed from the moment of venting onset, and there is no obstruction to the flow.
The experiments were conducted on a commercially available CNG-powered passenger vehicle representative of typical European compact hatchbacks with factory-installed natural gas systems. The vehicle was manufactured in 2012 and equipped with two composite pressure vessels mounted longitudinally behind the rear axle (see Figure 11). In this configuration, the cylinder closer to the cabin is referred to as the front vessel and the one nearer to the bumper as the rear vessel.
Each cylinder was fitted with a multifunctional solenoid valve incorporating a TPRD described in the “Pressure relief system” section. Both valves were mounted on the right side of the vehicle, consistent with typical installation practice for this vehicle type. The configuration reflected a common original equipment manufacturer design and provided a realistic basis for studying gas release and dispersion under near-accident conditions. For hydrogen vehicles, international regulations such as UN GTR No. 13 18 and ECE R134 19 explicitly require that thermally activated pressure relief devices must vent gas upward or away from occupants and enclosed spaces. In contrast, no such directional requirements exist for CNG vehicles under current regulatory frameworks such as UN/ECE Regulation No. 110. 10 As a result, lateral or downward venting is common, and the discharge orientation depends on vehicle layout and manufacturer design choices. This variability in outlet direction can significantly influence gas dispersion and ignition behavior, underscoring the importance of experimental studies that evaluate realistic venting configurations.
In our test, the TPRD on the front vessel pointed diagonally upward toward the front of the car, while the TPRD on the rear vessel pointed diagonally downward and toward the rear of the car. This layout was preserved in the laboratory setup and served as the basis for all flow visualization and velocity measurements. It is important to stress that the gas does not exit TPRD in the direction the TPRD is pointing, but normal to the surface of the TPRD body, as shown in Figure 1.
The passenger vehicle was elevated approximately 90 cm above the ground. To simulate road clearance and maintain optical access beneath the vehicle, a transparent polycarbonate sheet was placed below the rear half of the car. A coordinate grid was positioned under the sheet to assist in localizing flow features.
Before each test, the onboard CNG cylinders were depressurized and then refilled to approximately 200 bar with compressed air supplied from two external compressed air storage vessels through the existing multifunctional solenoid valves, following the same path normally used for vehicle refueling. Instrumentation for monitoring discharge conditions—manual valves, needle regulators for flow control, and absolute pressure gauges—was installed near the front and rear TPRDs. These components were not part of the supply system but served to control and observe the venting process. The external 260-bar system functioned only as a filling source and was isolated during venting, so each TPRD discharge was driven solely by the onboard cylinder volume. Manual valves, needle regulators, and absolute pressure gauges were also installed in the filling lines to control and monitor the filling process. During venting, the gas followed the vehicle’s original high-pressure piping and exited through the TPRD nozzles in their standard locations, ensuring realistic discharge conditions. The test configuration preserved the integrity of the vehicle geometry while providing full access for diagnostics and instrumentation placement.
Qualitative flow visualization via tufts and smoke
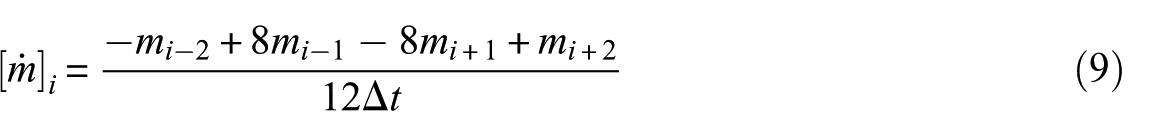
To qualitatively assess the near-field flow behavior induced by TPRD discharge, a two-step visualization approach was employed. Tufts (approximately 12 cm long) were attached to selected locations around the rear bumper, undercarriage, and wheel wells (Figure 3(a)). Their deflection during discharge provided visual cues about local flow direction. Special attention was given to locations where the flow direction changed—specifically around the left rear wheel.
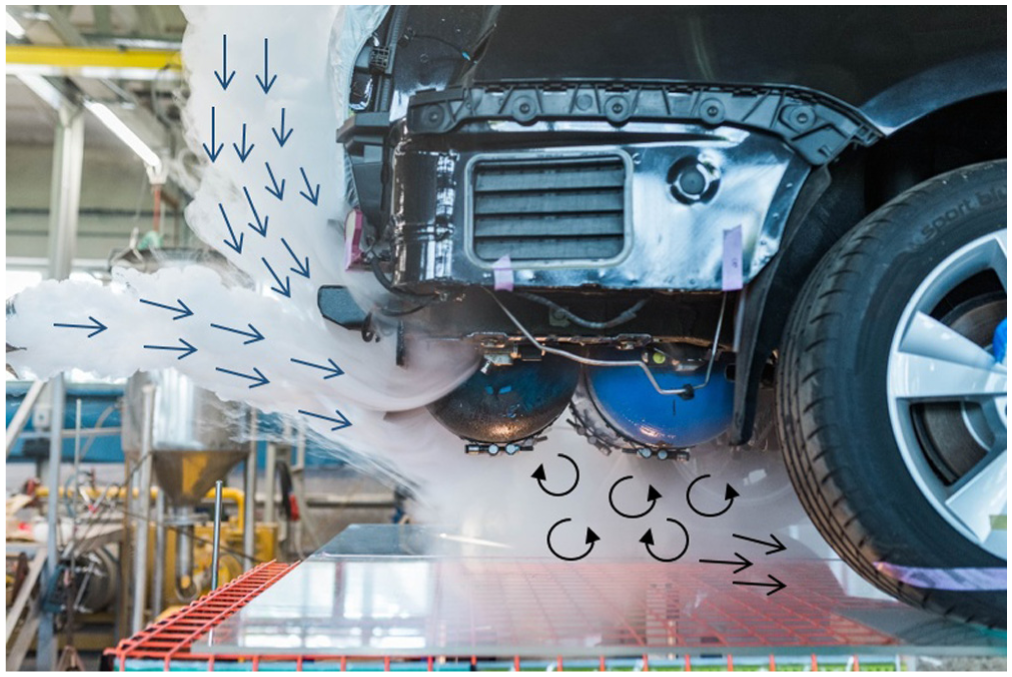
Qualitative visualization methods used to assess near-field flow structure. (a) Tufts are attached to the rear bumper and underbody to indicate local flow direction during discharge. (b) Example smoke injection illustrating air entrainment at the rear section of the vehicle during TPRD venting.
Based on these observations, targeted smoke visualization was conducted to clarify flow patterns. Smoke (Figure 3(b)) was generated by thermally vaporizing a specialized liquid and introduced through a flexible duct, which allowed precise injection around the TPRD outlets and vehicle underbody. Flow was manually guided using plates to enhance visibility in regions of interest.
To improve visibility and prevent icing of the valves and outlet nozzles as a result of the gas expansion, the discharge pressure was limited to approximately 80 bar during visualization tests. At this lower pressure, the rate of pressure drop was reduced, and the flow evolved more gradually.
Hot-wire anemometry and jet velocity measurements
Pointwise velocity measurements were conducted to characterize the near-field gas flow induced by TPRD discharge. Velocity data were acquired in two regions: (1) around and beneath the rear of the vehicle to map the local flow field and (2) along the axis of the high-speed jet discharged from the right rear TPRD. As shown in Figure 4, measurement points were arranged along the rear bumper, behind and in front of the rear wheels, and under the chassis. The spacing between adjacent points along the perimeter was approximately 300 mm, and the points were distributed symmetrically on the left and right sides of the vehicle. The choice of probe locations was guided by earlier tuft and smoke visualization highlighting the area near the rear-left wheel and underbody—making them key regions for capturing representative velocity data. The jet axis downstream of the outlet was probed at 500-mm intervals, extending up to 3.5 m from the vehicle.
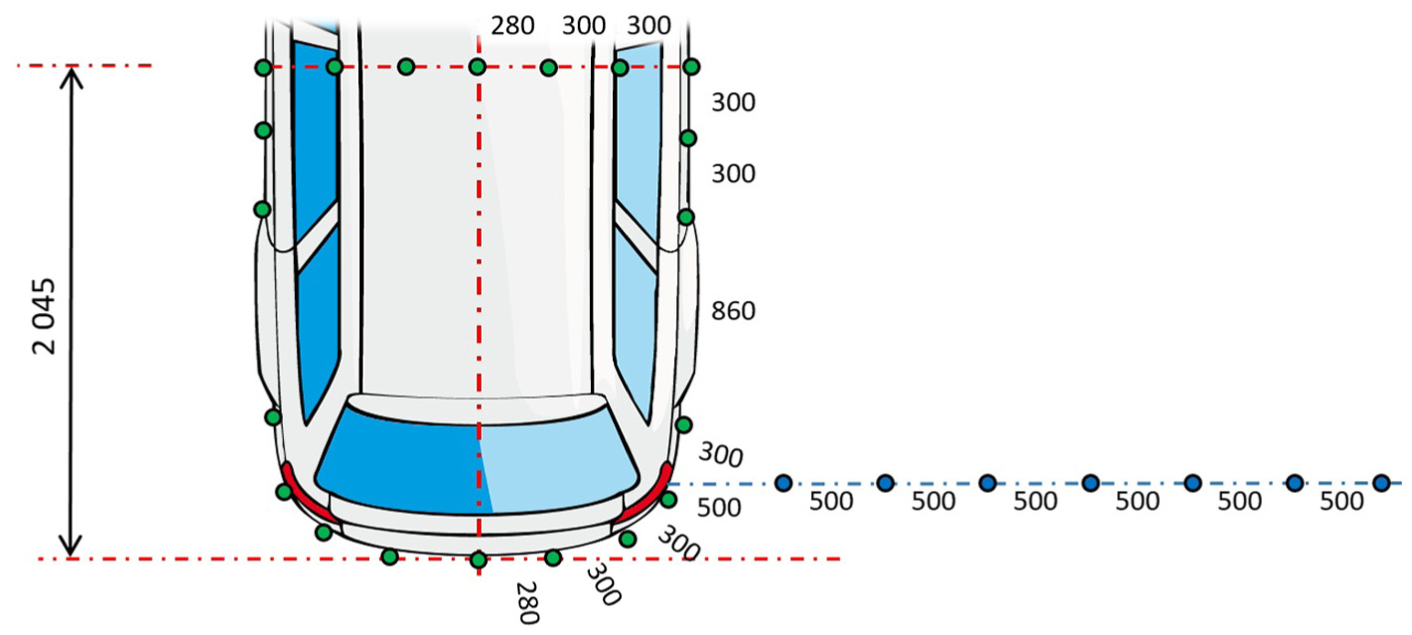
Measurement locations for CTA velocity probing around the vehicle rear and along the jet axis, used to capture near-field flow characteristics.
Velocity measurements were performed using hot-wire anemometry operated in constant temperature anemometry (CTA) mode, which maintains the probe wire at a fixed temperature by dynamically adjusting the electrical current. The flow velocity is inferred from the rate of convective cooling. This method was chosen for its operational efficiency and high temporal resolution, making it well-suited for capturing turbulent fluctuations in the complex and spatially variable flow field around the vehicle. Hot-wire anemometry provided reliable and sensitive readings, particularly in confined regions where the flow direction varied, and turbulence intensity was high. However, a key limitation of the CTA method is that it measures only the velocity component aligned with the probe wire axis. Therefore, in complex flow regions with varying directions, the recorded velocities represent projections of the true flow vector and may underestimate the full velocity magnitude.
At each measurement point, velocity readings were taken during a full discharge lasting approximately 60-s discharge, covering the pressure drop from approximately 200 to 20 bar. However, the CTA system required careful handling to mitigate thermal effects. Upon discharge, the rapid expansion of compressed air caused a temperature drop in the flow, leading to transient cooling of the sensor and distortion of the initial signal. To address this, velocity data for evaluation were taken only after thermal stabilization was observed in the sensor output. For reliable velocity data readings, the flow needed to be quasi-steady, and the hot-wire probe had to be thermally stabilized. Only segments of the signal corresponding to relatively steady velocity conditions—typically 2 to 3 s in duration—were used for velocity analysis and averaging. The rest of the signal was either unsteady or thermally drifting. The timing of this usable window was different for each measurement location because it depended on local flow behavior and is described in the results section.
Full-scale vehicle burn test
Video recordings from a full-scale vehicle fire test conducted in 2014 were analyzed to assess the relevance of the observed flow regimes under real fire conditions. The results of these experiments were previously reported and analyzed in the work by Jahoda et al. 9 The test originated from fire investigation experiments focused on vehicle fires, where full-scale burning of vehicles is used to relate observable thermal damage to fire development and fire spread. 20
The analyzed test involved the same vehicle model and an identical fuel system, including the same pressure vessels and TPRDs installed in the same configuration as flow field experiments (“Flow visualization and velocity measurement around vehicle” section). The TPRDs were oriented identically to the laboratory setup, enabling a direct comparison. The test was not instrumented for gas concentration or velocity measurements. Therefore, the analysis is limited to qualitative observation of flame development and its spatial distribution around the vehicle, based on video recordings capturing the TPRD activation and subsequent gas release. In the analyzed test, the fire was initiated in the left rear part of the vehicle, leading to fire development in the rear underbody region before the activation of the TPRDs. This initial fire location and its progression influence the thermal exposure of the pressure vessels and thus the timing and conditions of TPRD activation.
Computational part
To capture the nature of TPRD discharge and its effects on near-field flow, two complementary three dimensional (3D) CFD models were developed: a valve-scale steady-state model to quantify pressure losses and outflow conditions caused by internal valve geometry, and a vehicle-scale steady-state model to simulate flow conditions and interaction with vehicle structures, providing detailed insight into jet development and gas mixing and concentration patterns important for hazard assessment. The CFD simulations were not intended to reproduce the transient pressure decay during venting, but to investigate representative flow behavior and interaction of the jet with the surrounding vehicle geometry. These simulations complement the experimental results and help to identify key mechanisms driving the fire dynamics.
3D CFD modeling of TPRD discharge and near-field flow structure
In our previous work,
21
a two-dimensional axisymmetric CFD model was used to investigate the structure of underexpanded methane jets and estimate discharge behavior during venting through thermally activated pressure relief devices. A similar modeling strategy was adopted by Gardner and Santrock,
22
who combined an isentropic outflow model with a 2D steady-state CFD simulation to analyze natural gas venting from low-pressure reservoirs (
While such simplified approaches can provide insight into the jet morphology under idealized conditions, their accuracy becomes limited when applied to full-scale vehicle safety scenarios involving complex boundary interactions. The present 3D models address these limitations by resolving both the valve inner geometry and the surrounding vehicle geometry, enabling realistic prediction of jet behavior, mixing, and ignition-relevant concentration patterns.
TPRD discharge model (pressure loss model)
In many simplified modeling approaches, the internal vessel pressure is often used directly as the boundary condition at the outflow plane. However, this assumption neglects the pressure drop caused by internal flow restrictions. In the studied case, TPRD is mounted to the multifunctional opening/closing valve. The outflow path of the gas from the fuel tank to the outflow plane leads through the body of the valve and TPRD. The cross-sectional diameter is changing, as well as the direction of the flow. To address this, a detailed CFD model was employed to estimate the pressure loss and determine the actual pressure at the outflow plane. These corrected values provide more realistic boundary conditions for downstream jet modeling and concentration predictions.
The gas discharge from the valve was simulated for total inlet pressures of 5, 10, 50, 100, 150, and 200 bar. The CFD simulations were performed across a broad range of inlet pressures representative of different stages of cylinder discharge, from initial high-pressure conditions to lower pressures near tank depletion. This approach enables characterization of the pressure loss behavior and outflow conditions under varying operating states, ensuring that the model accurately captures the valve performance throughout the entire venting event. Consequently, the pressure drop estimates obtained can be reliably used as input for transient or isentropic outflow models simulating the discharge process.
A multifunctional solenoid valve with TPRD was placed in the center of the
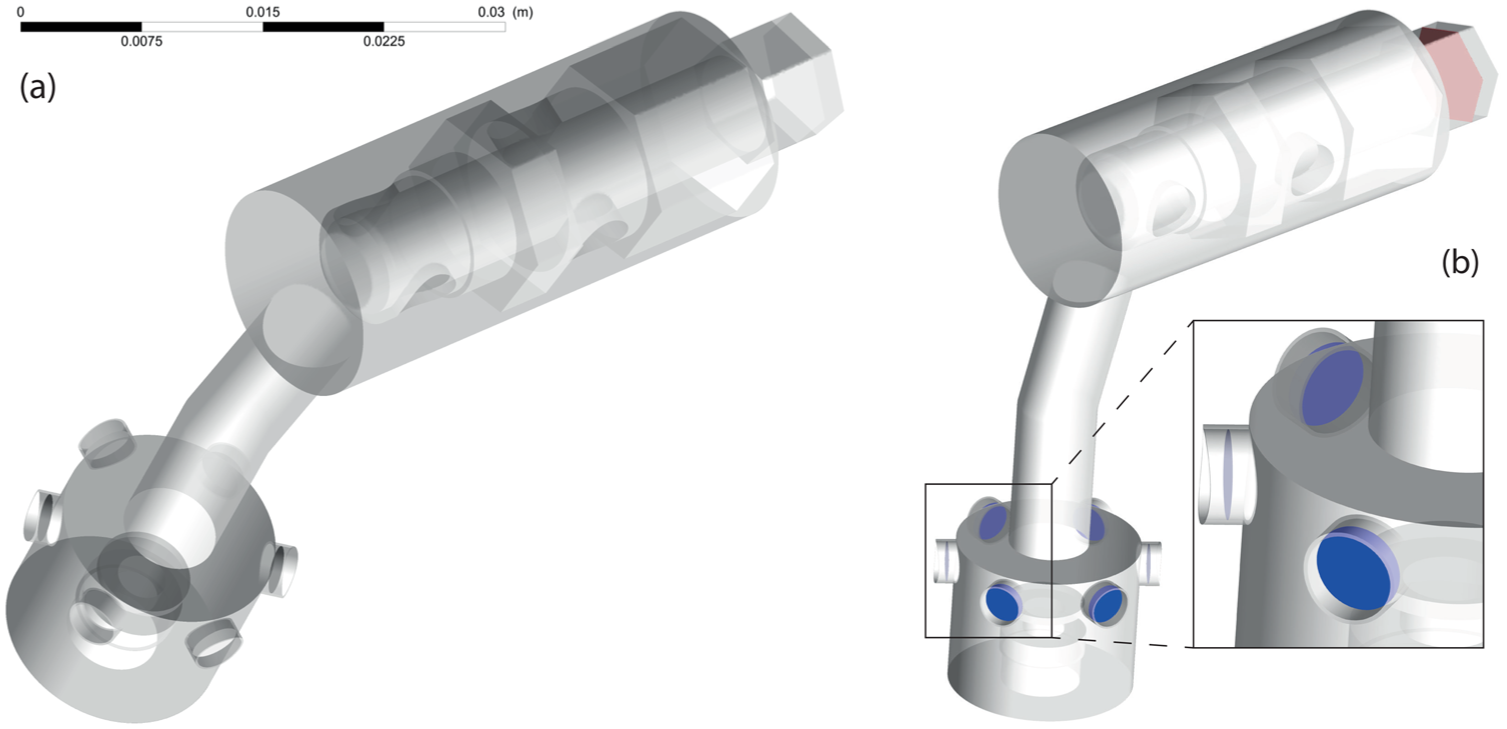
Simplified geometry of the gas outflow path through the multifunctional solenoid valve and TPRD. Red plane—pressure inlet, and blue plane—surface to calculate outflow pressure.
All simulations were performed using the commercially available tool ANSYS CFX 2020 R1. Due to the time-consuming non-stationary calculations of the flow exceeding far beyond the speed of sound, the flow field in the CFD simulation was modeled as steady, viscous, and fully turbulent. The ideal gas law was chosen to describe the flowing gas thermodynamic properties. In the case of methane (substitute for natural gas) discharge into the air, fluid in the domain was modeled as a variable composition mixture. The two-equation eddy-viscosity SST
The red plane in Figure 5(b) represents the domain inlet where the total pressure and static temperature values were constant throughout the steady-state simulation. Static inlet temperature was kept at 20°C for all simulations. The boundary condition of type ‘Opening’ was used at the domain outlet set on the cube walls. At the domain outlet, air at normal conditions (101 325 Pa, 20°C) was specified, with no methane mass fraction prescribed.
Vehicle-scale modeling of jet development and surrounding interactions near the rear of the vehicle
To assess how high-pressure gas discharge interacts with vehicle geometry, a simplified 3D model of the car’s rear section was created. The vehicle-scale CFD model simulates high-pressure methane discharge from two pressure vessels mounted beneath the rear chassis, each equipped with solenoid valves and TPRDs featuring six 3-mm outlet orifices. The computational domain includes a simplified 3D geometry of the vehicle’s rear section, fuel vessels, and surrounding structures, extending beyond the vehicle to cover the regions where velocity measurements were performed (Figure 6).
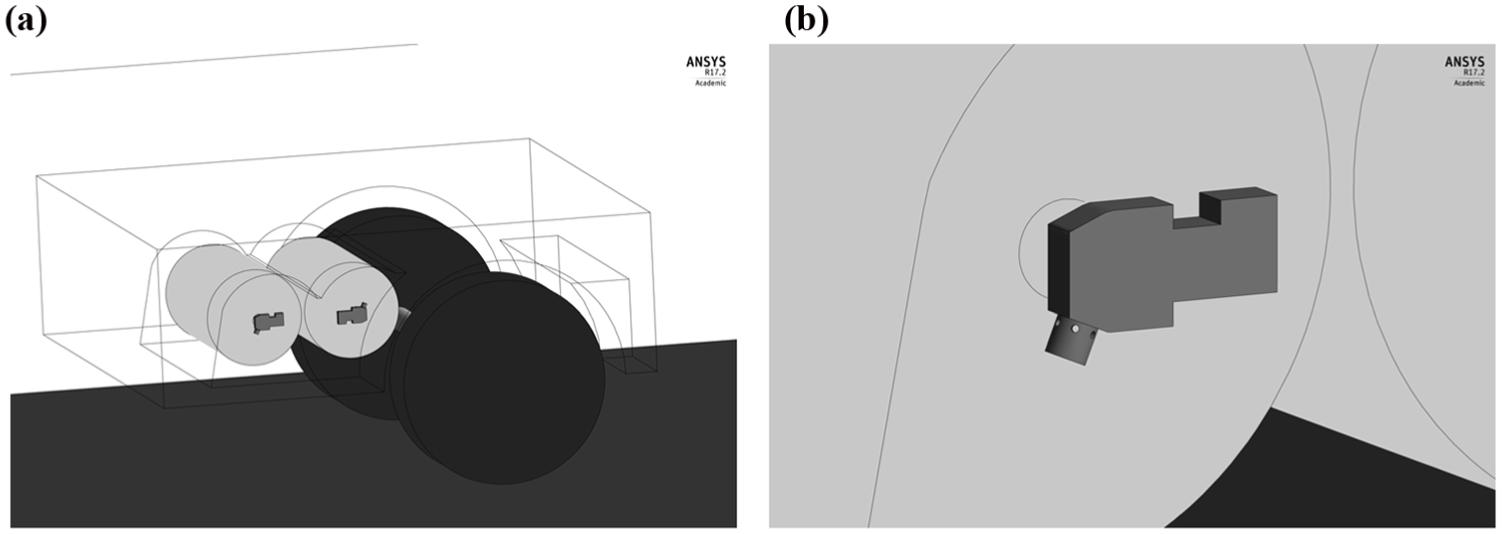
CFD domain and component geometry used in vehicle-scale and valve-scale simulations. (a) Simplified geometry of the vehicle rear section with mounted pressure vessels. (b) Close-up of the gas outflow path through the multifunctional solenoid valve and TPRD.
In the vehicle-scale CFD model, the TPRD geometry was explicitly included, and the boundary condition was prescribed as a constant total pressure of 200 bar at the inlet to the TPRD body, corresponding to the initial pressure in the storage tank. Thus, the experimentally measured MLR curve was not directly imposed in the vehicle-scale simulations. Instead, the CFD model was used to investigate steady-state flow structure and jet interaction with the vehicle geometry under these conditions, rather than to reproduce the full transient venting process, which would be computationally prohibitive. The measured MLR nevertheless provides an experimentally verified mass flux input that can be applied directly in dispersion and risk assessment models.
The inlet boundary conditions specify constant total pressure and temperature (20°C), with ambient air at standard atmospheric conditions (101 325 Pa, 20°C) and zero methane mass fraction prescribed at the domain outlet boundaries. The fluid was modeled as a compressible methane–air mixture. Vehicle geometry and outlet orifice orientations were simplified and do not exactly match the configuration used in the flow visualization experiments, while preserving key flow obstructions that influence jet behavior, mixing, and momentum loss near the ground and vehicle surfaces. The Reynolds-averaged Navier–Stokes equations were solved with a two-equation eddy-viscosity SST
Results and discussion
MLR and thermodynamic behavior
Figure 7 shows the average non-dimensional mass measured during the five CNG venting experiments for a full tank and a fit of the polynomial function used to further calculate MLR. The data show considerable scatter within the first 10 s of the outflow, clearly indicating a measurement error, as the recorded mass appears to increase during the first 5 s due to scale vibrations. This early-time scatter does not affect the integrated mass curve and, therefore, has a negligible influence on the derived MLR.
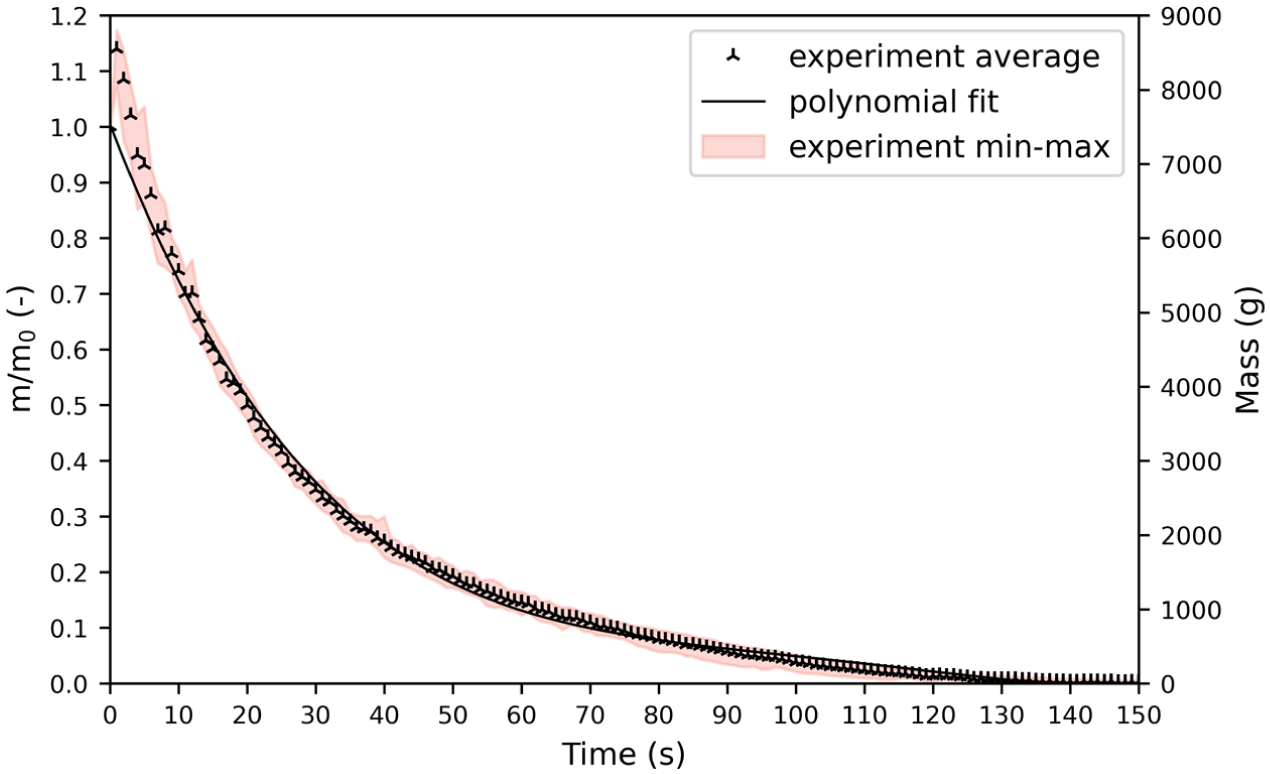
Average value of dimensionless mass from five experiments (marks), polynomial fit to the experimental data omitting the scatter in the first 5 s (solid line), maximum and minimum values measured (filled line) when venting compressed natural gas at an initial pressure of 200 bar.
In terms of repeatability between five experiments, the difference between the maximum and minimum values lies around 300 g after 20 s and decreases with time. It needs to be considered that although the dimensionless mass enables comparison of the outflow characteristics with regard to the initial pressure value, the outflow rate will also be influenced by the initial CNG temperature and the ambient temperature of the surrounding air. Initial temperature of CNG and ambient air temperature were not controlled and slightly differed between experiments (CNG initial temperature was on average 20.2 ± 4.9°C; ambient temperature was 20 to 23°C). The total outflow time of CNG from the full tank via TPRD openings is approximately 150 s. About 50% of the mass is, however, vented within the first 20 s.
The solid line is an average value of non-dimensional mass
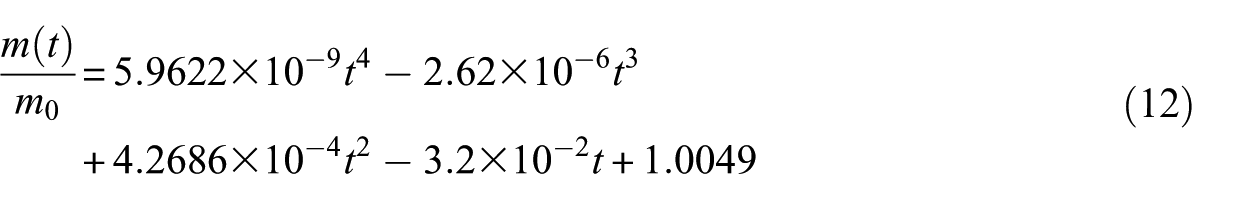
Figure 8 shows the non-dimensional temperature of CNG during the vessel venting. The non-dimensional temperature was calculated as
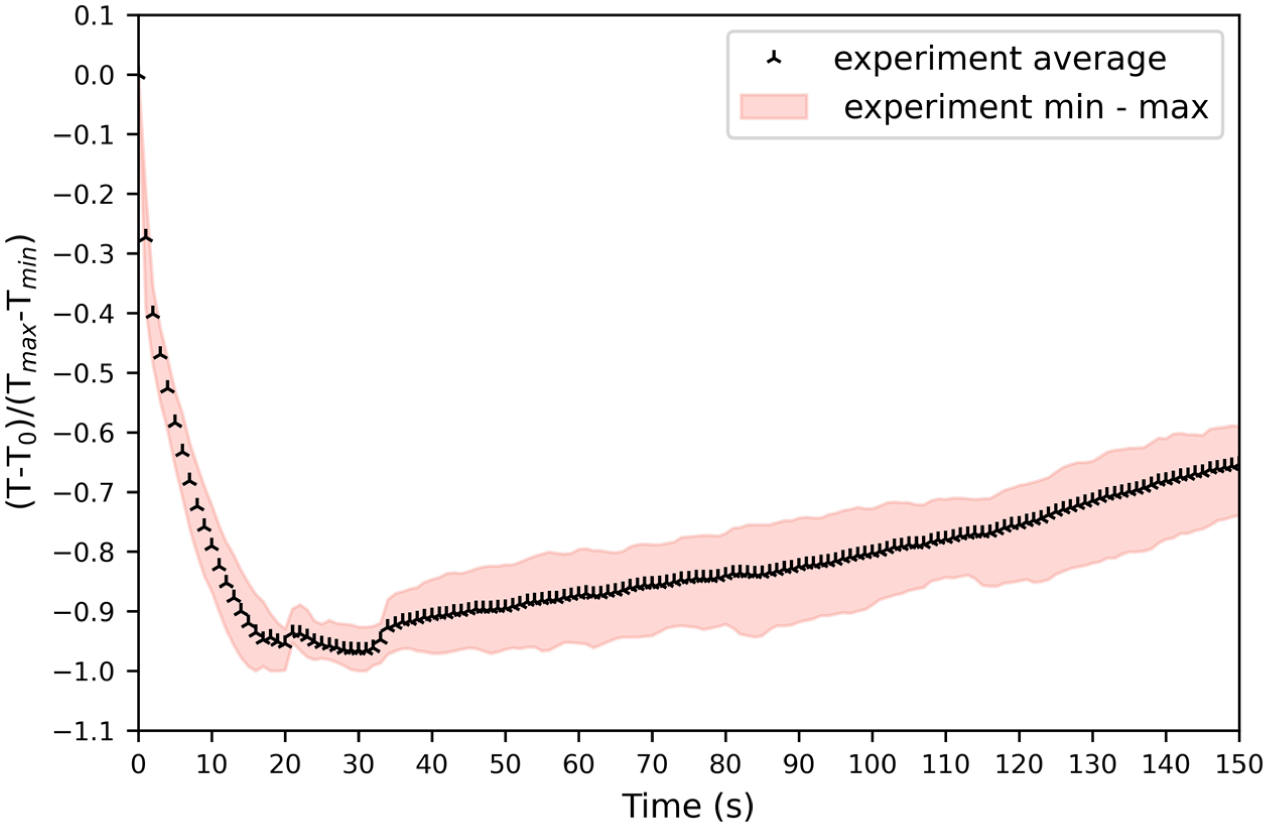
Dimensionless average temperature as a function of time for venting natural gas at an initial pressure of 200 bar. Filled lines represent maximal and minimal values.
After the first 20 s of gas venting (that corresponds to approximately half of the total gas mass being vented), the temperature of CNG dropped by 80°C on average. Eventually, the dimensionless temperature in Figure 8 starts to increase as the magnitude of the heat transfer from the surroundings is larger than the cooling of the gas as a result of gas expansion.
Looking at the dimensionless pressure of venting gas as a function of time (Figure 9), a sudden increase in natural gas pressure followed by strong scatter was observed after approximately 60% of the natural gas was vented. When the scatter in data occurred, natural gas pressure was between 20 and 30 bar and temperature around −50°C to −60°C. According to the phase diagram of natural gas predicted by the Peng–Robinson Equation of State, 23 the scatter in the pressure data corresponds to the conditions where both vapor and liquid phases coexist. It was concluded that the measured increase and strong scatter of the data were a measurement error, probably caused by interactions of the liquid phase with the solenoid valve. Since this phenomenon occurs late in the discharge when mass flow is already low, its impact on hazard-relevant venting behavior is limited.
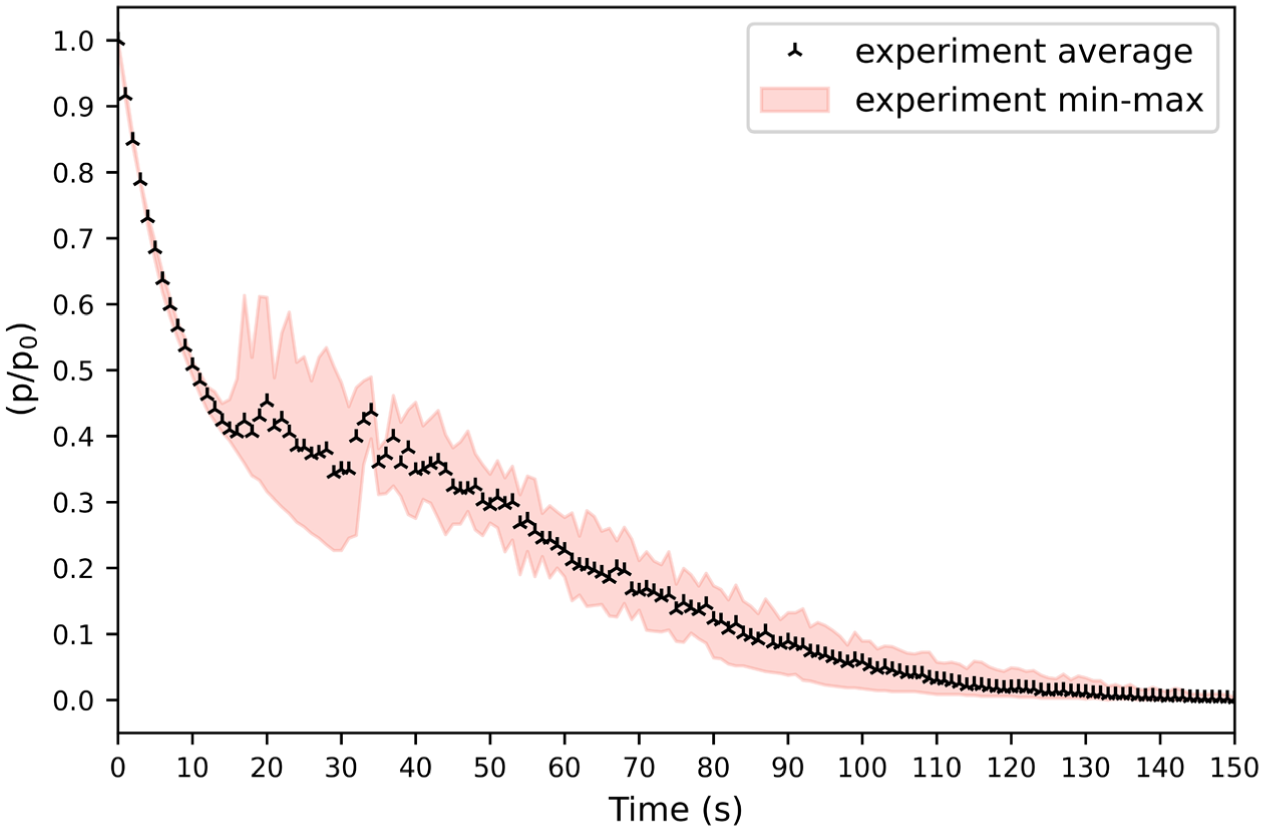
Average dimensionless pressure as a function of time for venting natural gas at an initial pressure of 200 bar. Filled lines represent maximal and minimal values.
Mass loss rate
MLR calculated from the mass curves in Figure 7 is presented in Figure 10. The maximum calculated MLR is 242
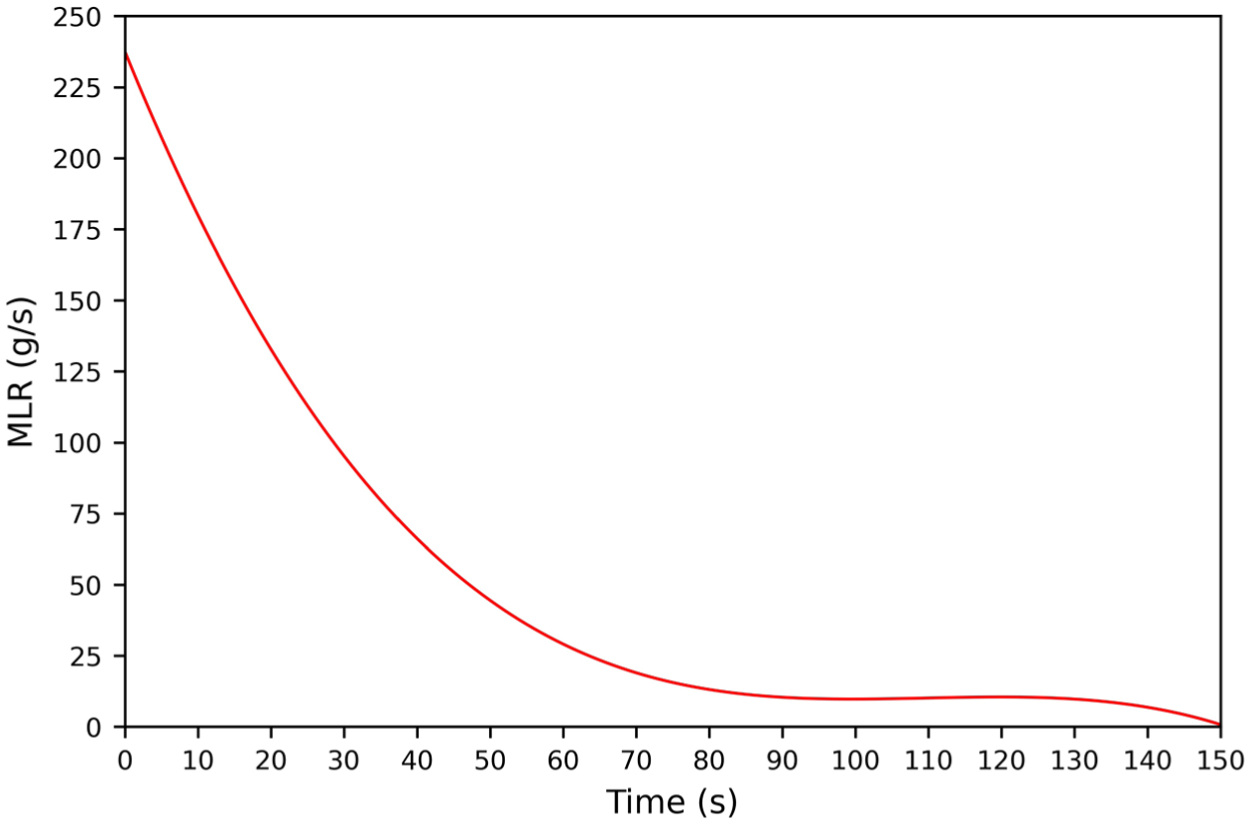
Mass loss rate of natural gas as a function of time during the gas venting, calculated from the average mass obtained from the venting experiment at 200 bar and assuming the initial gas mass of 7413 g of CNG.
The MLR curve in Figure 10 can be used directly as the inlet boundary condition to a CFD model of gas dispersion. The total outflow area in the studied case equals 42.41
Flow field observations from tuft and smoke tests
The flow pattern resulting from TPRD discharge was dominated by air entrainment and redirection of the air flow beneath the vehicle. Instead of uniformly expanding away from the outlet outwards from under the car, as might be expected due to the high momentum of the gas, a strong vortex formed around the pressure vessels following TPRD activation, drawing ambient air in from behind the vehicle. The entrained air interacted with the discharged air and surrounding structures, resulting in a complex flow pattern beneath the chassis. Tuft tests revealed forward and lateral redirection of the stream and localized recirculation near the left rear wheel.
From the tuft and smoke test observations, four characteristic flow regions of the TPRD outflow dynamics were identified:
air entrainment from behind the vehicle
left rear wheel recirculation zone
forward-directed flow under the car
right rear wheel free jet.
The first three flow patterns are demonstrated in the side-view photograph of the vehicle during the smoke test shown in Figure 11, where arrows were added to highlight the observed entrainment and recirculation. These observations show that the resulting flow during discharge through TPRD did not develop based solely on outlet orientation, but also followed paths defined by the vehicle’s shape and ground clearance.
Smoke visualization of air entrainment beneath the vehicle during TPRD discharge, illustrating lateral and forward redirection of the gas flow.
Full-scale vehicle burn test
While the tuft and smoke tests clearly revealed the structure of the flow field and likely gas dispersion paths, they could not answer the critical question of whether and where flammable mixtures would actually form and ignite under real fire conditions. To address this gap, a full-scale vehicle fire test was analyzed. The observations from this test, previously reported in the work by Jahoda et al., 9 are here examined in the context of the flow regimes identified from the laboratory experiments.
The car fire originated under the left rear wheel well and soon involved the suspension and tire in this area. Over the next several minutes, flames spread along the rear underbody and into the lower part of the bumper, eventually causing the left section of the rear bumper to soften and partially detach. By the time CNG venting started, the fire was established across the rear underbody and left side of the vehicle, while the right rear side remained largely unaffected by flames. The TPRD on the rear cylinder was the first to activate, approximately 11 min after the vehicle was ignited. The onset of CNG venting was identified both acoustically by the sudden hissing of the venting gas and visually by the immediate intensification of the flames. The rear part of the vehicle was already burning, so as the natural gas was released and mixed with ambient air, it ignited almost immediately upon reaching flammable concentrations.
The observed flame behavior around the vehicle was notably asymmetric. The general flow patterns around the vehicle have been previously qualitatively described in the work by Jahoda et al. 9 In this study, these flow regimes are further analyzed in relation to detailed flow visualization and velocity measurements. The burn test observations are consistent with the flow-driven patterns (flow regimes) revealed using the tuft and smoke visualizations. Each flow regime corresponds to a characteristic flame behavior/zone as illustrated in Figure 12, which shows the vehicle from the right rear view shortly after one TPRD activation:
(A) Air entrainment zone behind the vehicle: This area remained free of flames, as strong rearward air entrainment occurred.
(B) Left rear recirculation zone: A cloud fire developed beneath the chassis and along the left side of the vehicle. This behavior matched the underfloor flow from the front TPRD and the localized recirculation observed in the tuft tests.
(C) Right rear free jet: A jet fire formed on the right side, aligned with the TPRD discharge.
(D) Forward-directed flow under the car: A stream of burning gas propagated beneath the chassis and emerged near the front wheel, consistent with the forward under-car flow observed in smoke visualization.
Although Figure 12 shows the characteristic flame regions shortly after TPRD opening, the venting fire evolved dynamically over the 2–3 min of discharge. Based on the observed fire dynamics, it was not possible to distinguish which TPRD activated first and the exact timing of the second TPRD activation. During the initial high-pressure stage, the right rear jet fire (Region C) produced the most prominent flame, while a simultaneous cloud fire formed in the left rear recirculation zone (Region B) and pulses of flame began propagating forward under the chassis (Region D). As the tank pressure decreased, the jet shortened and the under-car and left-side flames became more dominant (Regions B and D). Near the end of the venting period, the jet extinguished entirely, leaving only residual under-car burning until the tanks were fully depressurized.
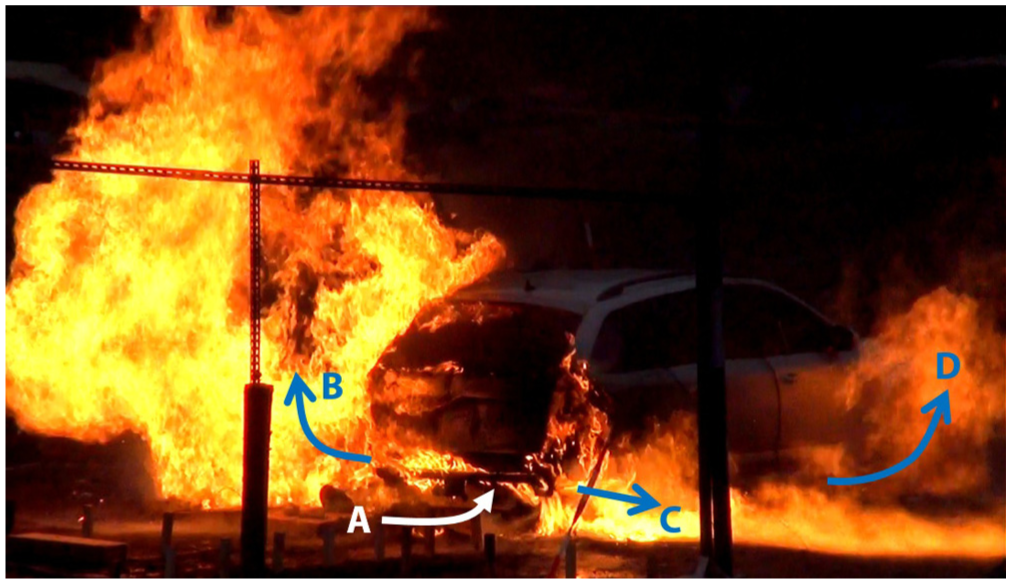
Observed flow directions during CNG venting in a full-scale vehicle fire test, illustrating gas displacement patterns and recirculation zones. 9
The vehicle had already been burning for more than 11 min when the TPRDs activated, meaning that significant structural degradation of the vehicle had occurred. This dynamic evolution of the vehicle structure plays a critical role in the gas outflow and fire dynamics in real fire scenarios. For example, the timing of the jet flame observed in the burn test, very early after TPRD activation, was a result of the fire damage to the vehicle. The outflow path from the TPRD pointing out to the side was unobstructed at the time when the TPRD activated. The jet was also directing toward the ground, as the vehicle was not standing evenly on the four wheels at that time anymore. In contrast, the laboratory visualization was performed without the bumper, allowing the jet to develop and be recorded perpendicular to the ground. This comparison highlights that features observed in idealized conditions may emerge later in real fires—not because the flow changes fundamentally, but because structural barriers are lost or change their shape as the fire progresses.
Velocity profiles via CTA measurements
The tuft and smoke visualizations confirmed that the gas discharge from the TPRDs generates a highly dynamic flow field characterized by strong entrainment and redirection beneath the vehicle. These complex flow patterns play a critical role in shaping overall fire dynamics, influencing whether a jet or cloud fire develops and how flames propagate around and under the vehicle during a full-scale fire. The intensity of rear air entrainment, forward-directed under-chassis flow, and jet momentum were quantified through local velocity measurements. These data provide a crucial quantitative foundation for interpreting the observed fire behavior. However, due to probe orientation and local three-dimensional flow variations, the reported magnitudes should be interpreted as indicative rather than absolute.
The measured velocities are summarized in Figure 13. Velocity magnitudes measured around the vehicle vary widely, ranging approximately from 0.7 m/s to more than 8 m/s in the point measurements around the perimeter. Higher velocities (above 6 m/s) were recorded both beneath the chassis along the forward underfloor flow and near lateral or diagonal outlets influenced by the TPRD discharge. The strongest sustained jet, observed behind the right rear wheel in the detailed jet axis measurements, exhibited near-nozzle mean velocities exceeding 30 m/s at high upstream pressures.
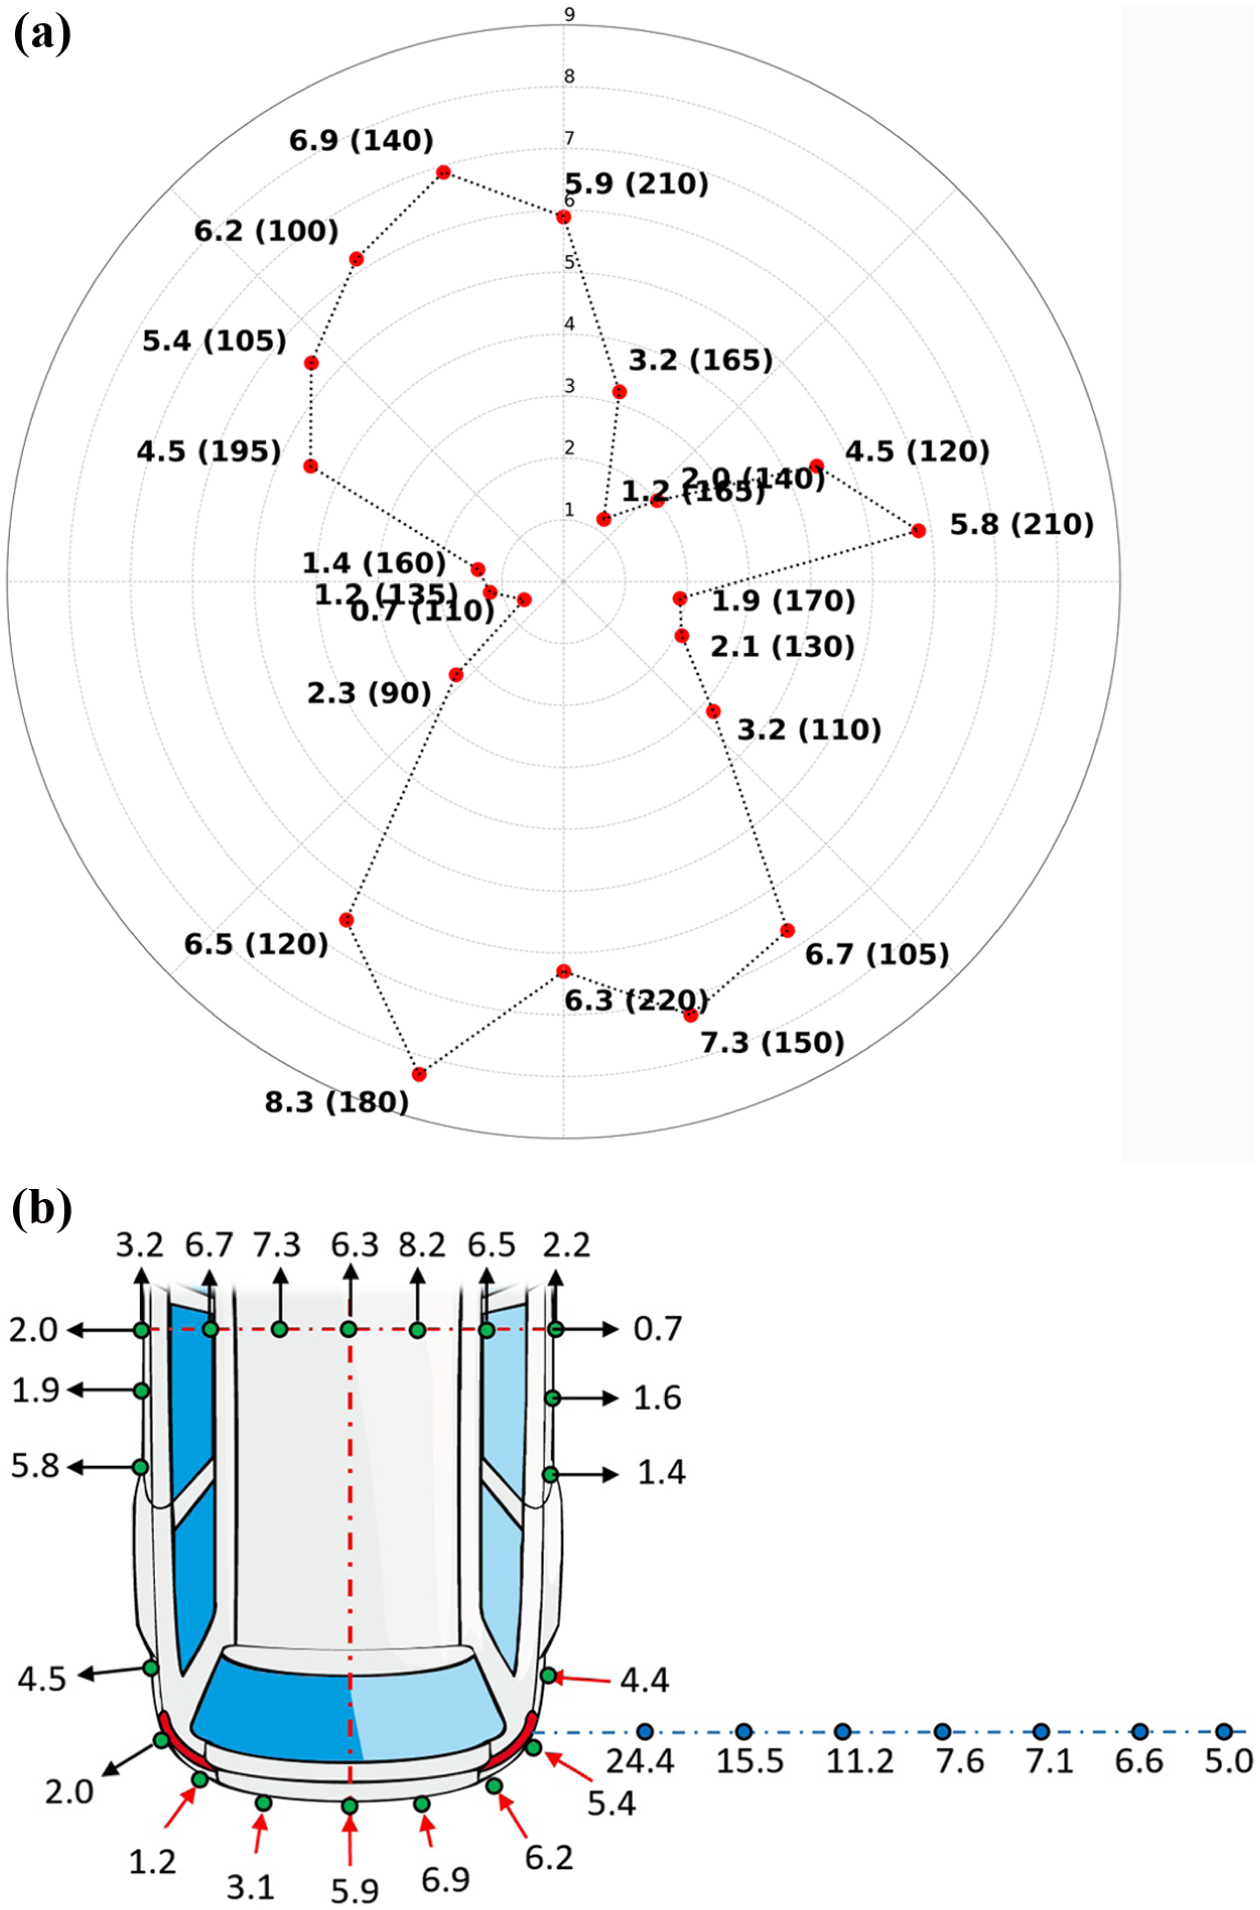
Velocity measurement results from CTA hot-wire anemometry. (a) Polar representation of perimeter velocity measurements with labels showing velocity (m/s) and pressure (bar) in parentheses. (b) Measured average jet velocity as a function of distance from the TPRD outlet, based on CTA data.
It should be noted that the velocity values in Figure 13 correspond to different cylinder pressures as described in the “Hot-wire anemometry and jet velocity measurements” section. At the free jet and underbody centerline locations (regions 4 and 3, see “Flow field observations from tuft and smoke tests” section), the flow stabilized almost immediately after TPRD opening, so the averaging window occurred early in the discharge at high pressures (200–140 bar). In contrast, the left rear recirculation and rear-entrainment zones (regions 1 and 2) produced chaotic flow initially, and stable readings were only obtained later, when the pressure had already dropped (120–85 bar). For clarity, the perimeter measurement point velocities in the polar plot (Figure 13(a)) are annotated with their actual pressure in parentheses. This means that the perimeter velocity map represents peak local behavior of each regime rather than a true instantaneous distribution around the vehicle.
As a result, the reported velocities represent local peak behavior of each flow regime rather than simultaneous values across the entire vehicle. Note that reported pressures correspond to upstream pipe conditions rather than direct exit pressures at the TPRD nozzle. While useful for ranking flow regimes, these do not provide exact discharge velocities.
Together, the data confirm a strongly asymmetric flow field: the polar plot of perimeter velocities (Figure 13(a)) highlights high-velocity zones along the vehicle centerline beneath the chassis and near the right rear corner, while the left rear region shows comparatively low velocities consistent with recirculation. The jet axis measurements and flow direction arrows further illustrate the intense momentum of the right rear jet and the prominent air entrainment zone beneath the vehicle. The measured jet velocities decrease with increasing distance from the nozzle, reflecting the expected momentum loss due to mixing and entrainment as the jet propagates. Because velocity measurements along the jet axis were taken at different times during the discharge—corresponding to varying vessel pressures—the raw velocity data reflect a range of upstream pressures rather than a single constant condition. To facilitate comparison, the jet axis velocity profiles were normalized to a common reference pressure (approximately 150 bar) as shown in Figure 13(b). This normalization allows consistent assessment of the velocity decay trend along the jet despite the pressure variations during measurement.
The variability in measured velocities reflects both true spatial differences in flow speed and the inherent limitation of the single-wire hot-wire anemometry technique. Since the probe records only the velocity component along its sensitive axis, measurements in regions with complex, three-dimensional, or recirculating flow may underestimate the actual local velocity magnitude. This directional sensitivity should be considered when interpreting the velocity data, particularly in zones where flow direction fluctuates rapidly. Despite these limitations, the relative ranking of flow regimes by momentum is robust and consistent with the tuft/smoke visualization and CFD predictions (“Vehicle-scale modeling of jet development and surrounding interactions near the rear of the vehicle” section).
Together, the two plots illustrate the strong asymmetry of the flow field and confirm the patterns inferred from the smoke and tuft observations. Although absolute velocity comparisons between positions are limited by these pressure variations, the data clearly show flow speeds on the order of meters per second and consistent directional patterns.
3D CFD modeling of TPRD discharge and near-field flow structure
Discharge behavior from 3D CFD of TPRD outlet
3D CFD simulation of the gas flow through the solenoid valve and TPRD revealed that there is a significant pressure drop between the vessel throat and the exit plane of the gas in the TPRD opening. Over the entire span of the pressure fuel tank, the pressure drop lies on average at around 45%. The gas pressure in the cylinder thus does not correspond to the model input pressure. This highlights why direct use of vessel pressure as a boundary condition can be misleading in simplified computational approaches and underscores the importance of incorporating valve-scale modeling into hazard assessments.
Figure 14 shows that the pressure is not evenly distributed over the outflow area. In the case of a 200-bar initial pressure simulation, the pressure field in the outflow opening ranges from around 40 to 140 bar. The total pressure value at the plane was determined as the average value weighted by mass flow. The outlet total pressure of the discharging gas was evaluated as the arithmetic mean of six total pressure values calculated at the exit plane of each orifice.
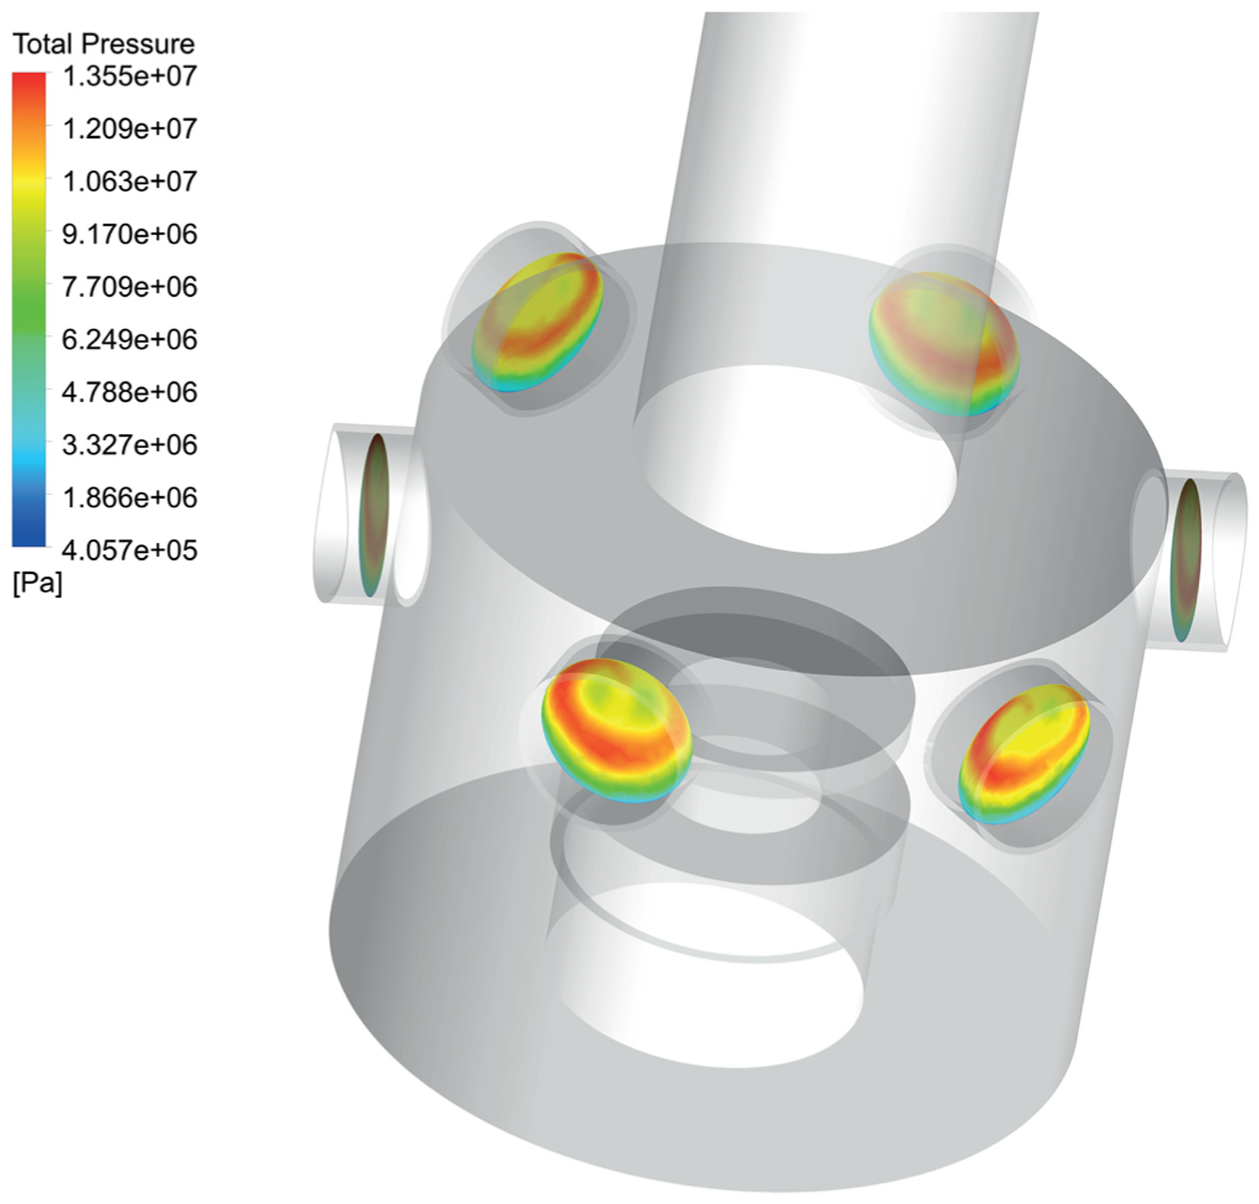
Total pressure field in the TPRDs orifices. The pressure inlet boundary condition was 200 bar.
Vehicle-scale modeling of jet development and surrounding interactions near the rear of the vehicle
The 3D CFD simulation reveals distinct high-velocity jets (Figure 15) emerging from each of the six 3-mm outlet orifices, consistent with the expected behavior of high-pressure methane discharge through multiple orifices. These jets rapidly impinge on nearby vehicle components and the ground surface, causing significant momentum decay and promoting intense turbulent mixing in the near field. This behavior reproduces the complex flow redirection and mixing observed in tuft and smoke visualizations.
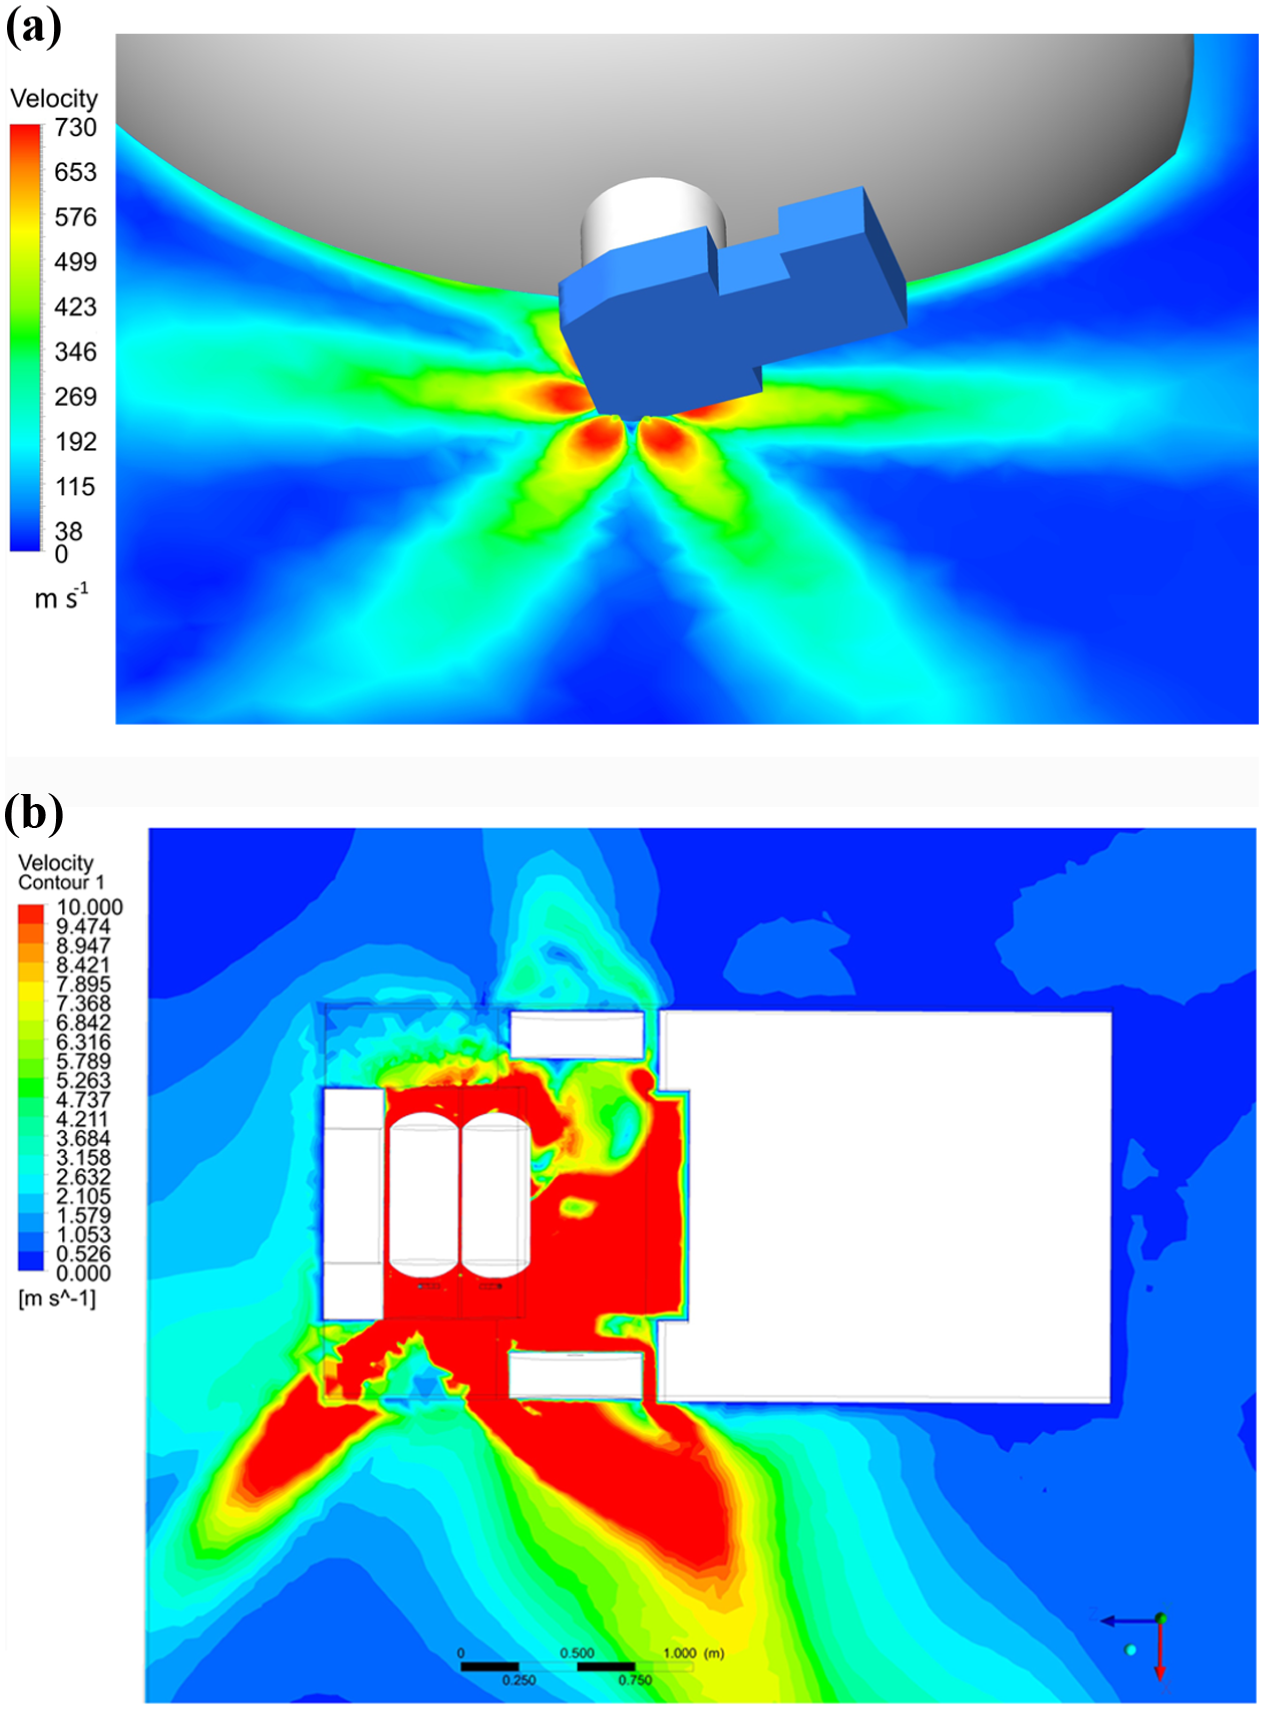
200-bar steady-state simulation velocity contours: left—TPRD-level detail and right—top view over the whole computational domain. (a) Methane velocity field near the TPRD outlet orifices. Steady-state CFD simulation at 200-bar inlet pressure. (b) 3D CFD visualization of individual jets forming at each outlet orifice of the TPRD (top view of the vehicle geometry).
Flow patterns near the pressure vessels show dynamics corresponding with smoke and tuft visualization experiments (Figure 16). The four characteristic flow regimes (i–4) identified during the smoke experiment can be clearly observed (compare Figures 11(b) and 16).
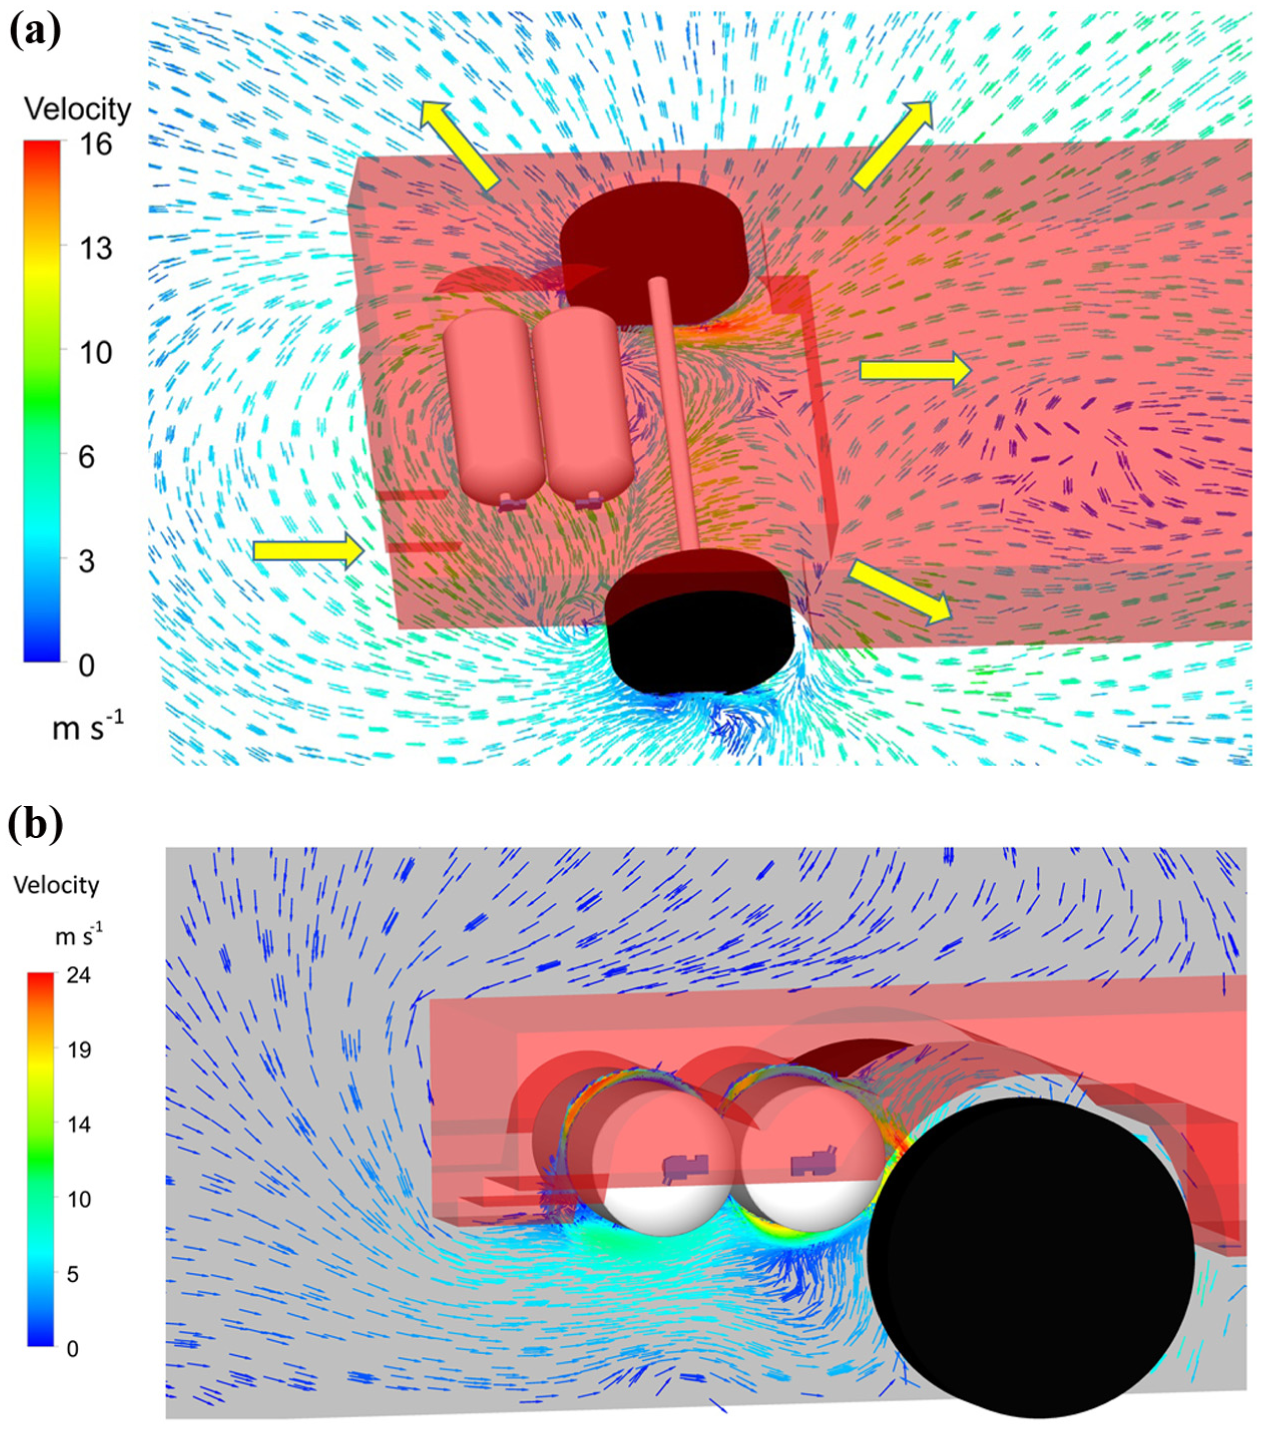
Velocity vectors of the 200-bar steady-state simulation. (a) Flow direction during CNG venting showing air entrainment beneath the vehicle. (b) Velocity vector field highlighting entrainment-driven redirection of the flow—side view of the vehicle geometry.
In the 3D CFD model, the orientation of the TPRD orifices does not match the experimental setup in which jet velocity was measured. Specifically, two of the six orifices are angled outward from beneath the vehicle, resulting in the formation of two distinct jets. In contrast, the experiment observed a single jet behind the right rear wheel. The jet directed toward the rear wheel corresponds to the experimentally observed jet and is referred to as the forward jet in the centerline velocity plot. At the vehicle boundary, its velocity reaches approximately 30 m/s but is reduced due to partial impingement on the wheel surface. The second jet, referred to as the backward jet, is angled outward behind the vehicle and attains velocities approaching 50 m/s at the same location.
Jet formation is captured in the simulation only when the side bumper is omitted from the vehicle geometry, underscoring the sensitivity of flow behavior to structural details. This finding emphasizes that seemingly small geometric features, such as bumper panels or wheel placement, can determine whether coherent jets emerge or are suppressed. The velocity decay along the jet centerline is illustrated in Figure 17, showing how the initially coherent, high-speed jet gradually loses momentum and mixes with ambient air within approximately 2 m from the vehicle boundary.
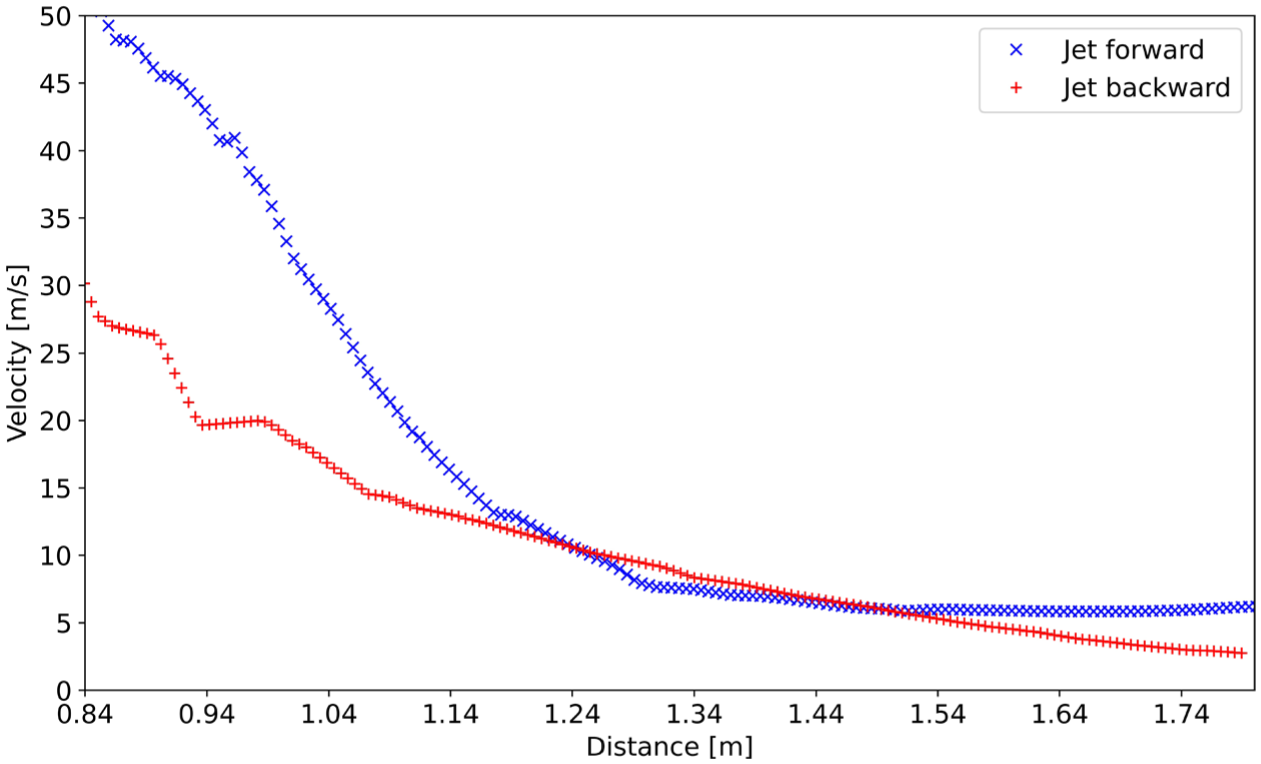
Velocity profile along the centerline axes of the two jets predicted by the 3D CFD model, projected in the x-direction from the vehicle boundary to approximately 2 m downstream.
The simulation also captures vortex formation near the pressure vessels, air entrainment in the left rear section of the vehicle, and displacement of the methane–air mixture toward the front underside of the chassis.
The good agreement between CFD predictions and measured data confirms that the simplified valve geometry captures the pressure drop across the TPRD with reasonable accuracy. Together, these results demonstrate the model’s capability to realistically predict jet development, mixing, and flow interactions relevant for hazard assessment in vehicle CNG venting scenarios. Nonetheless, due to computational cost, the simulations remain limited to short time windows or steady-state conditions, and, therefore, cannot yet capture the full transient evolution of the venting event.
Conclusion
By integrating mass loss measurements, flow visualization, velocity data, CFD simulations, and full-scale fire observations, this study clarifies how venting from thermally activated pressure relief devices develops and interacts with vehicle geometry. The results demonstrate that TPRDs in CNG vehicles influence fire development not only through the quantity of fuel vented but also through the way the discharge interacts with surrounding structures.
The measured mass loss curve shows a peak outflow of approximately 242
The experimentally derived mass loss curve provides a physically based boundary for future CFD dispersion and fire-growth simulations, reducing reliance on simplified assumptions. While applying the measured MLR directly conserves the total fuel mass—sufficient for hazard and dispersion modeling focused on fuel quantity—momentum depends on the velocity field at the outlet. A uniform redistribution of MLR across the outlet area does not necessarily reproduce the correct jet momentum. To achieve consistency in both mass and momentum, one can either (1) combine the experimental MLR with CFD results that provide the detailed exit velocity and pressure of the TPRD, or (2) explicitly prescribe both the measured mass flux and the corresponding momentum components. In this study, vehicle-scale CFD was performed using a constant inlet pressure of 200 bar at the TPRD, corresponding to the initial pressure in the storage tank. These steady-state simulations were used to investigate flow structure and pressure losses rather than to reproduce the full transient discharge process. The measured MLR, therefore, remains available as a physically consistent and ready-to-use boundary condition for future dispersion or hazard analyses.
Detailed 3D valve simulations showed that pressure losses within the TPRD substantially reduce jet exit conditions relative to cylinder pressure. Flow visualization and velocity measurements demonstrated that the resulting jet is strongly redirected by vehicle geometry, diverging from idealized free jet behavior. Vehicle-scale CFD reproduced the observed velocity fields, supporting the interpretation of experimental data and confirming that the CFD model can capture the relevant dynamics. Across these approaches, four characteristic regimes were consistently identified and later confirmed in the full-scale burn test as distinct flame zones. Although flow visualization and velocity measurements were performed with air, corresponding CFD simulations using CNG predicted the same regimes, and these were confirmed in the full-scale burn test. This consistency supports the use of air-based experiments for interpreting dispersion- and ignition-relevant flow behavior.
This work shows that CNG venting from TPRDs does not produce a uniform fire hazard but instead results in distinct, repeatable flow regimes that can be anticipated and reproduced: rearward entrainment behind the vehicle, underbody forward flow, recirculation near the wheel, and lateral jets. The strong rearward entrainment observed experimentally was particularly unexpected and explains why the vehicle was not engulfed in flames as a whole. These results demonstrate that the commonly assumed uniform radial outflow is unrealistic. Instead, ignition-relevant regions can be identified using CFD, which was shown here to reproduce both the measured velocity fields and the flame development in the full-scale burn test.
While this study examined a single vehicle configuration, the consistency between experiments, CFD, and fire observations demonstrates that the methodology can be extended to other geometries and TPRD locations, providing a practical framework for hazard prediction and safety assessment. The results provide experimentally supported inputs for fire modeling and a basis for regulatory evaluation and emergency response planning.
Footnotes
Funding
The authors disclosed receipt of the following financial support for the research, authorship, and/or publication of this article: This work was supported by the Ministry of the Interior, Safety research program of the Czech Republic 2015—2020 (BV lll/1—VS) under the number VI20172019077—Accidental release of CNG from passenger vehicles.
Declaration of conflicting interests
The authors declared no potential conflicts of interest with respect to the research, authorship, and/or publication of this article.
Data availability statement
The data supporting the findings of this study are available from the corresponding author upon reasonable request.