
Abstract
A positive self-concept supposedly affects a student’s well-being as well as his or her perception of individual competence at school. As computer-based learning is becoming increasingly important in school, a positive computer-related self-concept (CSC) might help to enhance cognitive achievement. Consequently, we focused on establishing a short, valid, and reliable instrument to measure the CSC by administering to German subsamples (Ntotal = 488) of three different age-groups: 8th (N = 159), 11th graders (N = 214), and university freshmen (N = 115). We succeeded in developing a one-factor-instrument with good overall reliability (αtotal = .84) and adequate criterion validity. The scale implementation revealed a high self-concept among younger respondents. Furthermore, we observed a stereotypical difference between the CSC scores for 8th and 11th graders. Finally, we discuss pedagogical and educational considerations of the scale’s implementation in school.
Introduction
Research in the topic of self-concept has been well established for decades. A highly topical issue in the last years was the computer-related self-concept (CSC) because of deeply rooted gender stereotypes (Janneck, Vincent-Höper, & Ehrhardt, 2013). Sáinz and Eccles (2012) confirmed this stereotypical difference by showing a higher self-concept of computer ability for boys than for girls. This can be a result of the gender differences in positions toward new communication technology, regularity of computer use, and self-perceived computer experience (Broos, 2005). In the case of maths, it has also been shown that parents still accept typical stereotypes, and they ascribe daughters’ mathematical success to effort, and sons’ to talent (Räty, Vänskä, Kasanen, & Kärkkäinen, 2002; Yee & Eccles, 1988), a fact that can possibly influence a child’s CSC. A resulting gender gap may possibly affect academic outcomes in school when learning is based on working with computers. Christoph, Goldhammer, Zylka, and Hartig (2015), for example, argue that specifically the CSC is playing a significant role regarding inter-individual differences in the case of computer-related learning and motivational characteristics. In addition to the differing self-concept scores between genders, there are also differences between age-groups (Marsh, Parker, & Barnes, 1985). This can be confirmed also for CSC (Sáinz & Eccles, 2012). Furthermore, Denissen, Zarrett, and Eccles (2007) propose a high intra-individual association between interest and self-concept. All in all, Janneck et al. (2013) recommend interventions especially in young school ages to enable girls to develop a positive CSC. This requires an instrument for measuring the CSC in a short and easy way with a scale that is suitable for different age-groups to offer the possibility for comparisons across ages.
The Computer-Related Self-Concept
In general, the self-concept is the “perception of ourselves” (Byrne, 1984, p. 429). To be more precise, it is a complex and dynamic phenomenon, a significant regulator of individuals’ behavior (Markus & Nurius, 1986) and a predictor of grades (Choi, 2005). The self-concept is a hierarchical construct with the general self-concept at the top followed by the academic self-concept and the nonacademic self-concept on a second level. The nonacademic self-concept includes the social, the emotional, and the physical self-concept. In contrast, the academic self-concept “refers to individuals’ knowledge and perceptions about themselves in achievement situations” (Bong & Skaalvik, 2003, p. 6). Besides English, maths, history, and science self-concepts, which are regarded as essential elements of the academic self-concept (originally defined by Shavelson, Huber, & Stanton, 1976), we included the CSC to this section according to the definition of Bong and Skaalvik (2003).
The “Shavelson Model” (Shavelson et al., 1976) describes and characterizes the self-concept in detail; the self-concept reflects an individual’s perception of himself or herself. The way a person acts is influenced by the self-concept which by itself is influenced by feedback from others in specific situations. It is organized, multifaceted, developmental, descriptive and evaluative, and differentiable from other constructs. Often the conceptual difference between self-concept, self-efficacy, and attitudes is controversial. Self-efficacy is regarded as a “context-specific assessment of competence to perform a specific task [and] a judgement of one’s capabilities to execute specific behaviors in specific situations” (Pajares & Miller, 1994, p. 194), whereas the self-concept is more all-embracing and related to an individual’s perceived competence especially in comparison with others (Bong & Clark, 1999; Choi, 2005; Pajares & Miller, 1994). In consequence, these constructs differ in the type of self-appraisal: The self-concept represents a norm-referenced evaluation and self-efficacy a criterion-referenced evaluation. In addition to that, the self-concept is a multidimensional construct integrating cognitive and affective components quite contrary to the unidimensional and mainly cognitive self-efficacy (Bong & Clark, 1999). Of course, this implies self-efficacy being a part of self-concept, but self-efficacy and self-concept represent different constructs and should not be mistaken for each other (Bandura, 1986). Attitudes toward an object are formed informational by evaluating the various collected attributes linked to the object (Fishbein & Ajzen, 1975). This information process is independent from social interaction and makes the difference between attitudes and self-concept. Otherwise, attitudes can be seen as a part of self-concept, as attitudes and self-concept have in common to affect beliefs (Pancer, George, & Gebotys, 1992). Self-concept is a composition of an individual’s self-referred attitudes (Janneck et al., 2013). As can be seen, the self-concept represents a holistic construct including several facets of a person due to its hierarchical structure.
For both genders, the self-concept is regarded as a hierarchical and multidimensional structure with the general self-concept at the top (Byrne & Shavelson, 1987). The self-concept subscales differ stereotypically: for girls, for instance, the academic self-concept is more strongly related to the English self-concept than with maths self-concept, whereas for the boys, the reverse is true. In consequence, the overall academic ability of girls derives by their performance in English and that of boys by their performance in maths (e.g., Marsh et al., 1985).
To sum up, in respect to the literature research, we define the CSC as a dynamic phenomenon, that is, part of academic self-concept and which affects a person’s computer-related performance and itself is affected by a person’s actions as well as experiences with computers and a person’s individual environment. Additionally, it includes “self-referred evaluations concerning computer-related skills, interests, experiences, attitudes, and beliefs” (Janneck et al., 2013, p. 2). Janneck et al. (2013) went further into detail and postulated the multidimensional CSC model based on the three-components-model of attitudes by Rosenberg and Hovland (1960). Accordingly, the CSC consists of three components influencing each other: a conative, a motivational and a cognitive component. The conative component refers to experiences during life (e.g., concrete actions or behaviors), the motivational component includes all emotions and attitudes toward computers like, for example, computer anxiety or individual motives for using computers, and, at least, the cognitive component which involves self-perceived computer competencies, self-efficacy and individual strategies for handling computers as well as computer-related attribution processes. Consequently, this model confirms that not only the general self but also the CSC includes many facets of oneself and, therefore, is closely related to diverse constructs such as, for example, computer self-efficacy or computer attitudes.
Measuring the Computer-Related Self-Concept
For measuring the CSC in school, a short but valid instrument is needed for suitable application in classrooms. A simple and fast evaluation of a class needs a single-factor instrument with closed answer format. Schwanzer (2002) in her developmental approach initially included 17 scales focusing on a multidimensional self-concept by modifying the Self Description Questionnaire III (SDQ III) published by Marsh and O’Neill (1984). The Shavelson Model (Shavelson et al., 1976) with its seven subscales served as a basis for all of these studies and could be constantly confirmed all over again until today (Brunner et al., 2010). Schwanzer (2002) aimed to adapt the SDQ III by designing a German version with scales and items relevant for adolescents, to choose a short response format, to extend the self-concept with more self-concept facets, and at least to verify the validity of the new instrument. One of the added subscales is the 12-item CSC scale which Schwanzer (2002) invented 12 completely new items taking into consideration conative, motivational, and cognitive aspects of handling computers (compare Janneck et al., 2013). These items could be validated and reached acceptable reliabilities. In addition to that, she succeeded in validating the scale by applying several external criteria. In this regard, the study participants needed to specify the frequency of using computers for different purposes and the individual abilities in different areas of computer usage. The subsequent data confirmed that high CSC scores are consistent with using computers more often and higher self-perception correlates with individual computer abilities. Due to missing test–retest reliabilities of the CSC scale and insufficient sample sizes (N = 67), these results were not included in a published version of the self-concept instrument (Schwanzer, Trautwein, Lüdke, & Sydow, 2005). The German CSC scale is short but with a broad psychological foundation. Therefore, our study’s objectives were threefold: first, to validate Schwanzer’s proposed instrument for monitoring the CSC with a sufficiently big sample; second, to assure a valid and reliable instrument with a minimal number of items suitable for different age-groups; and third, to verify gender differences in the CSC by applying the validated instrument.
Material and Methods
Our items originated from an internal report of Schwanzer (2002) by excluding one outdated item. The scale was implemented in German following a 4-point Likert scale response pattern and was applied using the original wording of Schwanzer (2002). The questionnaire was conducted as a traditional pen-and-paper test and was totally anonymous to minimize social desirability (Mummendey & Grau, 2008). This offered the possibility to include large sample sizes by providing adequate anonymity and privacy to encourage participants to give more candid responses. Furthermore, the anonymity should was emphasized during the introduction of the questionnaire, and the participants were told that there is no correct answer in the questionnaire because it refers to personal views.
Characteristic Values of the Sub-samples Participating in the Main Study.
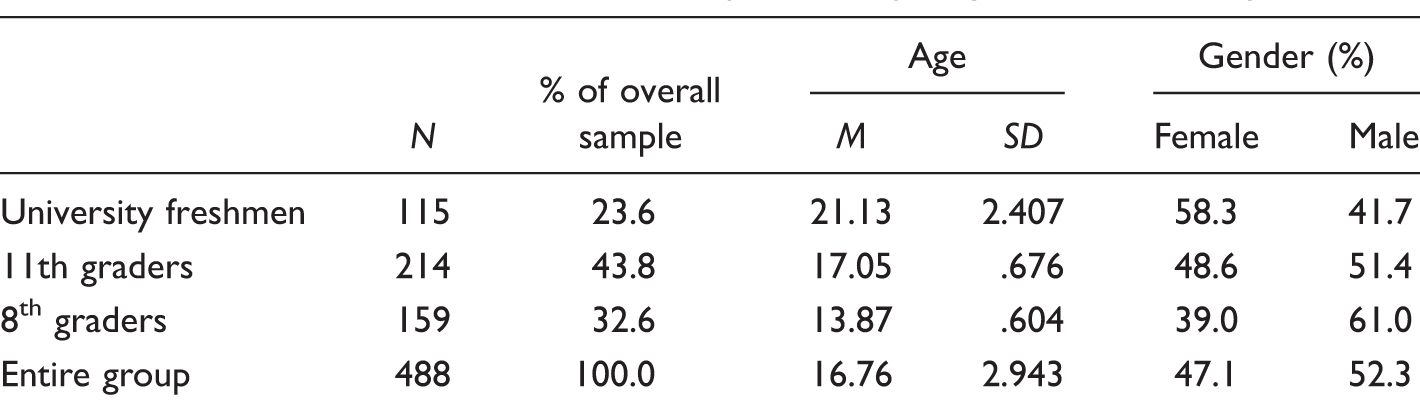
Validity is a broadly defined quality criterion of a test which refers to different quality aspects (Hartig, Frey, & Jude, 2012). We focused on proving criterion validity which implies the practical relevance of test values (Hartig et al., 2012). To face criterion validity, some external criteria were applied regarding the self-assessment of abilities to handle computers, that is, the frequency of computer use. These external criteria cover all components of the multidimensional CSC model and, therefore, are representative for the CSC. In this regard, 117 university students (average age M = 21.13, SD = 2.41, 58.1% women, 41.9% men) completed the 11-item questionnaire including the external criteria. Both categories of external criteria, the frequency of using computers for different purposes and the individual abilities in different areas of computer usage, were taken from Schwanzer (2002), but items were updated. We expect that a high CSC correlates with these external criteria. Participants were required to specify the frequency of using computers for different purposes (conative and motivational component): (a) surfing the internet; (b) electronic communication (internet forum, email, skype, facebook messenger, ICQ, etc.); (c) use of social networks, as well as (d) programming. This questionnaire followed a 5-digit response format (1 = never, 2 = less than one time a week, 3 = various times a week, 4 = less than one hour a day, 5 = several hours a day).
Additionally, participants assessed their individual abilities in different areas of computer usage within a 4-digit response format (1 = absolutely no good, 2 = moderately well, 3 = good, 4 = very good; cognitive component). The following aspects were assessed: (a) handling of computers in general, (b) editing texts, (c) using the internet, (d) correcting faults or understanding error messages or technical defaults, (e) handling software (confident handling of file formats, software installation, downloads, etc.), and (f) handling hardware (expansion of the storage space, exchange of different components, etc.).
To exclude factors that falsify the measurement of the CSC and to prove the stability of the CSC, a test–retest reliability has to be calculated. The test–retest sample consisted of 75 upper secondary school students of the highest school stratification level with an average age of 16.84 (SD = 1.07, 57.3% girls, 42.7% boys). This sample completed the same 11-item questionnaire twice without evaluating the external criteria over an interval of 12 weeks.
For statistical analyses, SPSS (Version 22.0) was used. The value of the inverse items (#10 and 11) was considered as inverted value for calculations. At first, an exploratory factor analysis extracted one factor, using the principal axis factoring method and a varimax rotation of all 11 items. All items with cross-loadings as well as loading scores below .40 were removed (Stevens, 2002), the same with correlations between item and the total score below .30 (Nunnally & Bernstein, 1994) and items with α* that suggests a higher Cronbach’s alpha if this item were to be deleted. The reduced scale was further analyzed as described for the 11-item scale.
To predict the scale homogeneity (Lienert & Raatz, 1994), we correlated all remaining items of the main sample with each other by using Spearman’s Rho. Additionally, we calculated the average correlation of every single item with all others in the CSC scale and averaged them (Bortz & Döring, 2006).
As correlating the score of a scale with an external criterion can also provide evidence about test validity and is a direct function of the item validity estimates (Ferketich, 1991), we correlated the mean score of the CSC scale with 11 external criteria (bivariate correlation with Spearman’s Rho and two tailed significance).
For evaluating the test–retest reliability, we first recalculated Cronbach’s alpha for the second assessment as an indicator of internal consistency. Moreover, by correlating the scores of the first rating session with the scores obtained in a second rating session 11.95 weeks (SD = 2.70) later, we calculated test–retest reliability.
According to the central limit theorem, which implies that a sampling distribution has a normal distribution as the sample size gets large (usually starting from a sample size of 30), we assumed a normal distribution for our data (Field, 2013). Therefore, we calculated all following results with parametric tests.
To be able to assess the statistical significance of the age differences, we employed univariate ANOVA for more than two independent samples. Additionally we used Tukey’s post hoc test. For comparisons of gender within groups, we used t test.
Results
Questionnaire Revision and Validation
The CSC Scale: Loadings and Cross Loadings of Items, Correlations Between Item and the Total Score (rit) and Cronbach’s Alpha if Item Deleted (α*) Before and After Revision.
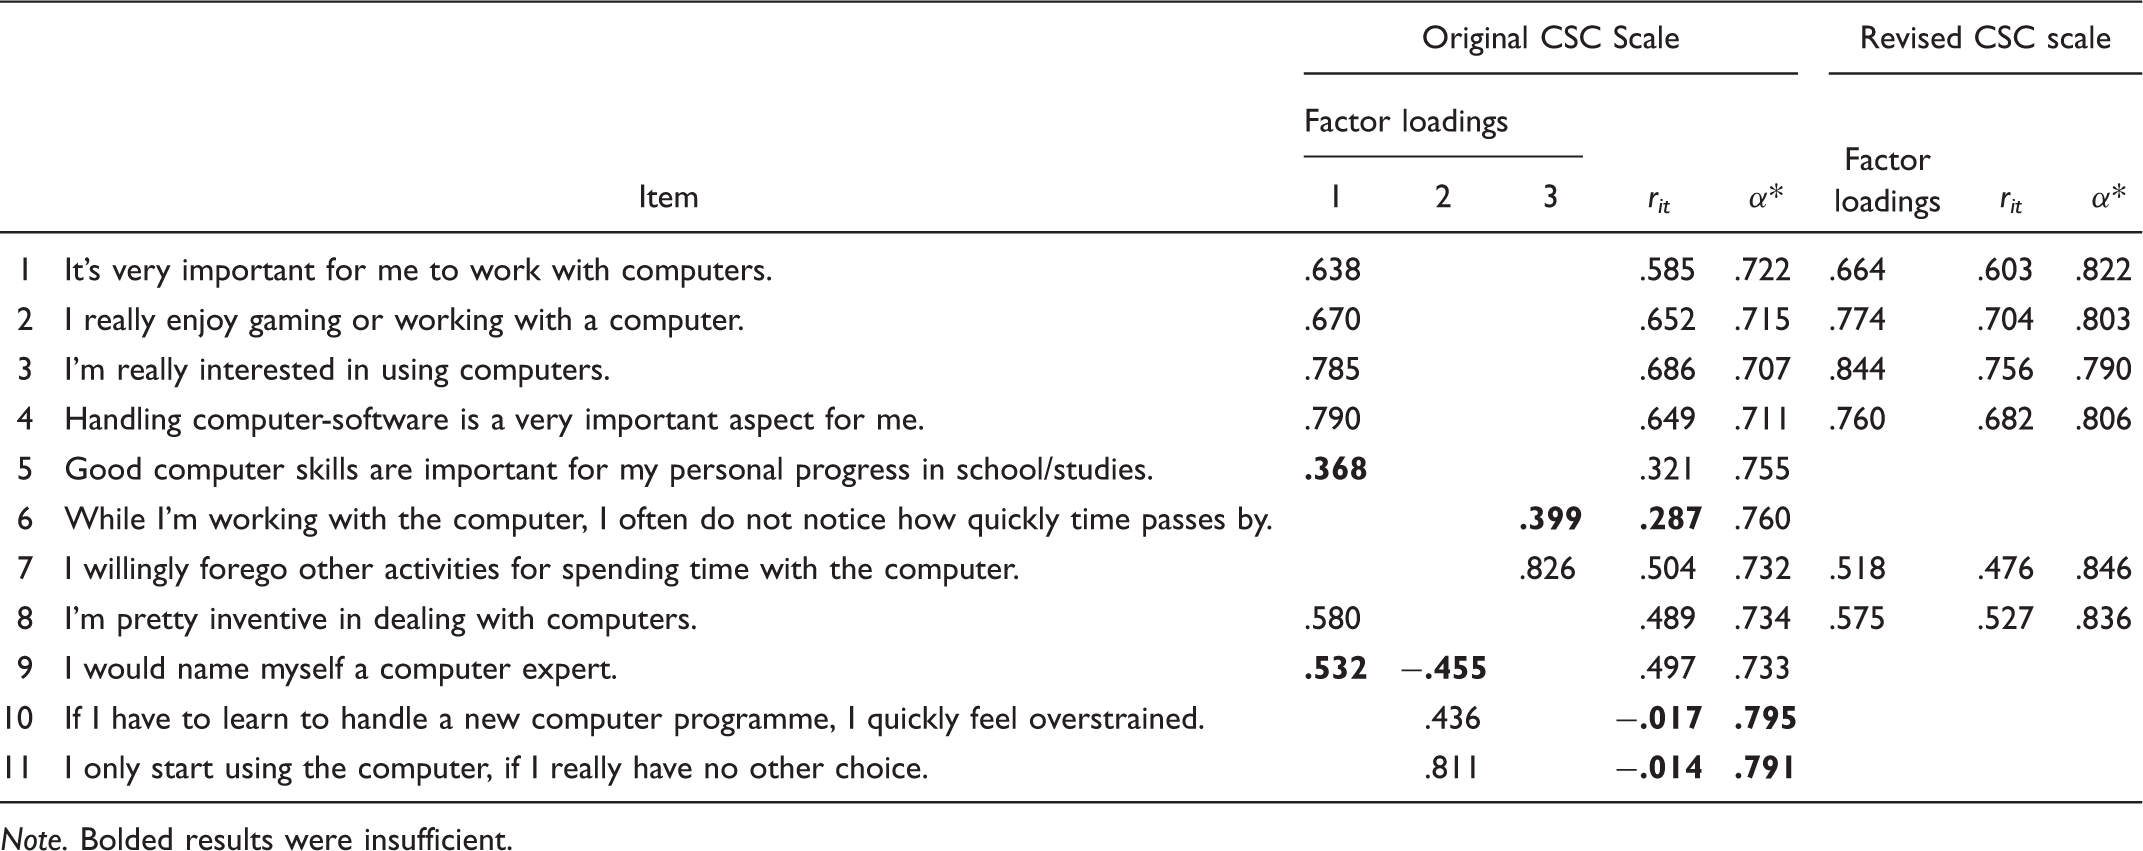
Note. Bolded results were insufficient.
Five items (#5, 6, 9, 10, and 11) were removed due to insufficient or multiple loadings (selection details see Material and Methods section). Item 7 was kept despite of its single loading on Factor 3 because none of the selection criteria applied. A repeated factor analysis based on the remaining six items revealed one single factor, explaining 48.8% of the variance. According to Lienert (1969), this can be labeled as remarkable. Cronbach’s alpha (.84) indicated a good overall reliability (Kline, 1999). Additionally, no item deletion would have increased Cronbach’s alpha substantially. The recalculated characteristic values of the CSC scale were also summarized in Table 2.
The exploratory factor analysis of each subsample also yielded a single factor. Cronbach’s alpha of the CSC scale for the subsample of university freshmen was .84, of 11th graders was .84, and of 8th graders was .85. Thus, the CSC scale presents itself as suitable for adolescents of different ages.
Correlation Matrix Among Items.
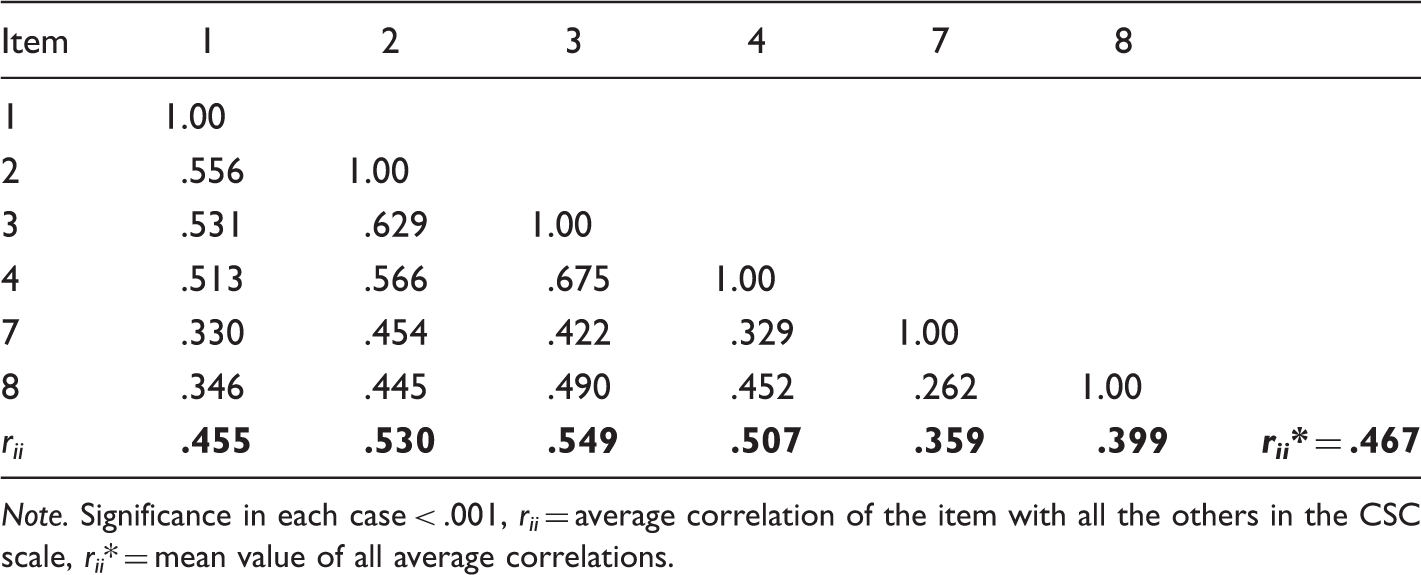
Note. Significance in each case < .001, rii = average correlation of the item with all the others in the CSC scale, rii* = mean value of all average correlations.
External Correlates of the CSC Scale.
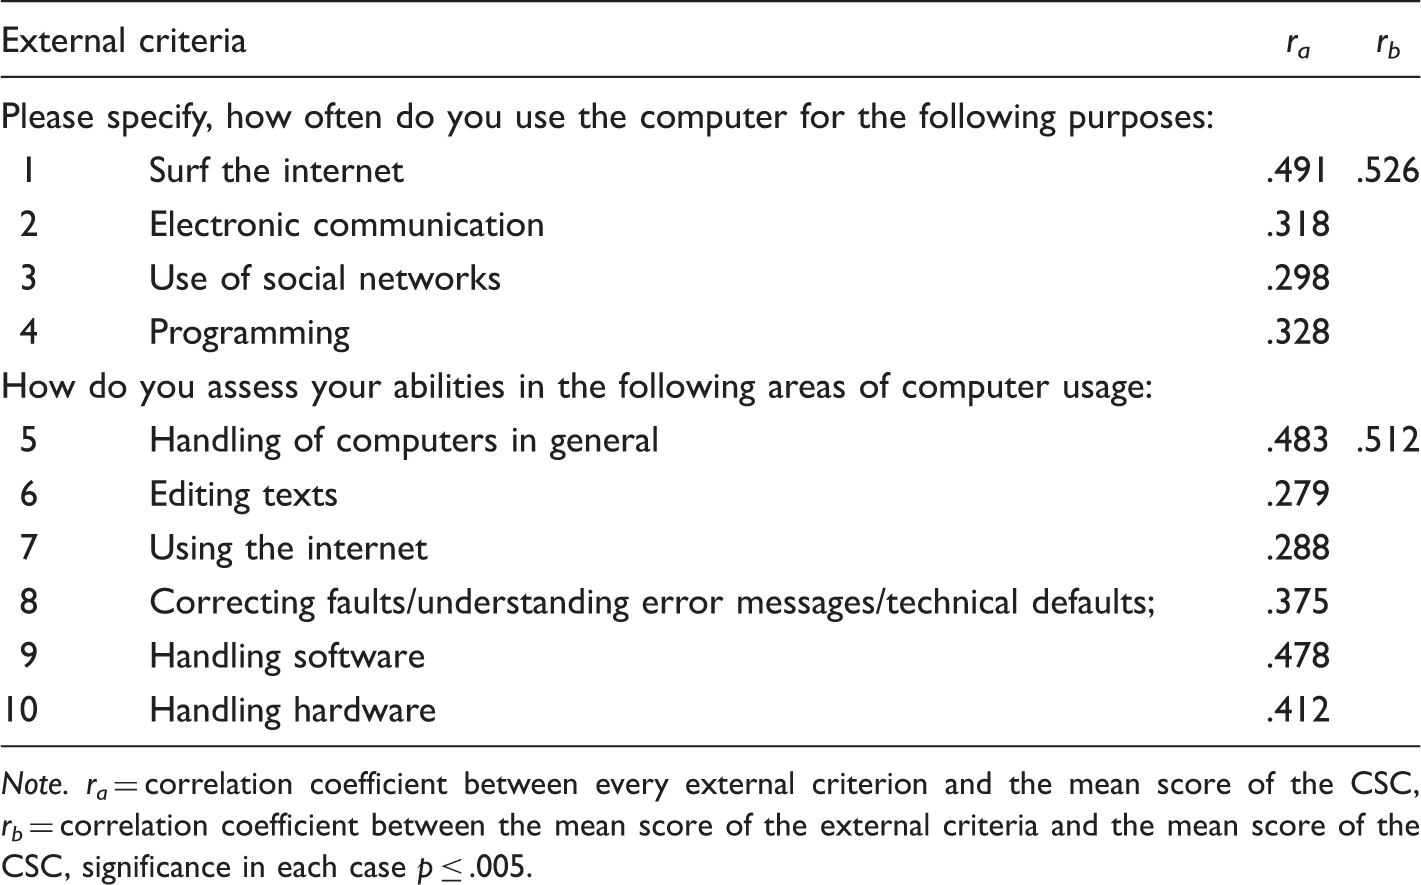
Note. ra = correlation coefficient between every external criterion and the mean score of the CSC, rb = correlation coefficient between the mean score of the external criteria and the mean score of the CSC, significance in each case p ≤ .005.
The test–retest reliability for the CSC scale within the test–retest sample yielded a Cronbach’s alpha of .82 which reflects the internal consistency following the repeated assessment (.80). The statistical correlation analysis reveals acceptable test–retest reliability with a value of .75.
Implementation of the CSC Scale in Different Age-Groups
A univariate ANOVA showed that age correlated with the CSC, F(2, 485) = 10.74, p < .001, ω = .20; Figure 1). Tukey’s test verified this result and illustrated a significant difference between 8th and 11th graders (p < .001) as well as a significant difference between the 8th graders and the university students (p < .001). The CSC mean scores of the 11th graders and the university freshmen did not differ significantly (p = .765). For more detailed information, we distinguished the age-groups by gender (Figure 1). The CSC scale showed a single factor and a good overall reliability for girls (.78) and for boys (.86) (Kline, 1999). Overall, the mean test score of the male participants varies between the different ages, F(2, 254) = 12.05, p < .001, ω = .28. This could not be confirmed for the female participants; F(2, 229), p = .075, ω = .12.
Comparison of overall mean test scores by age-group and gender.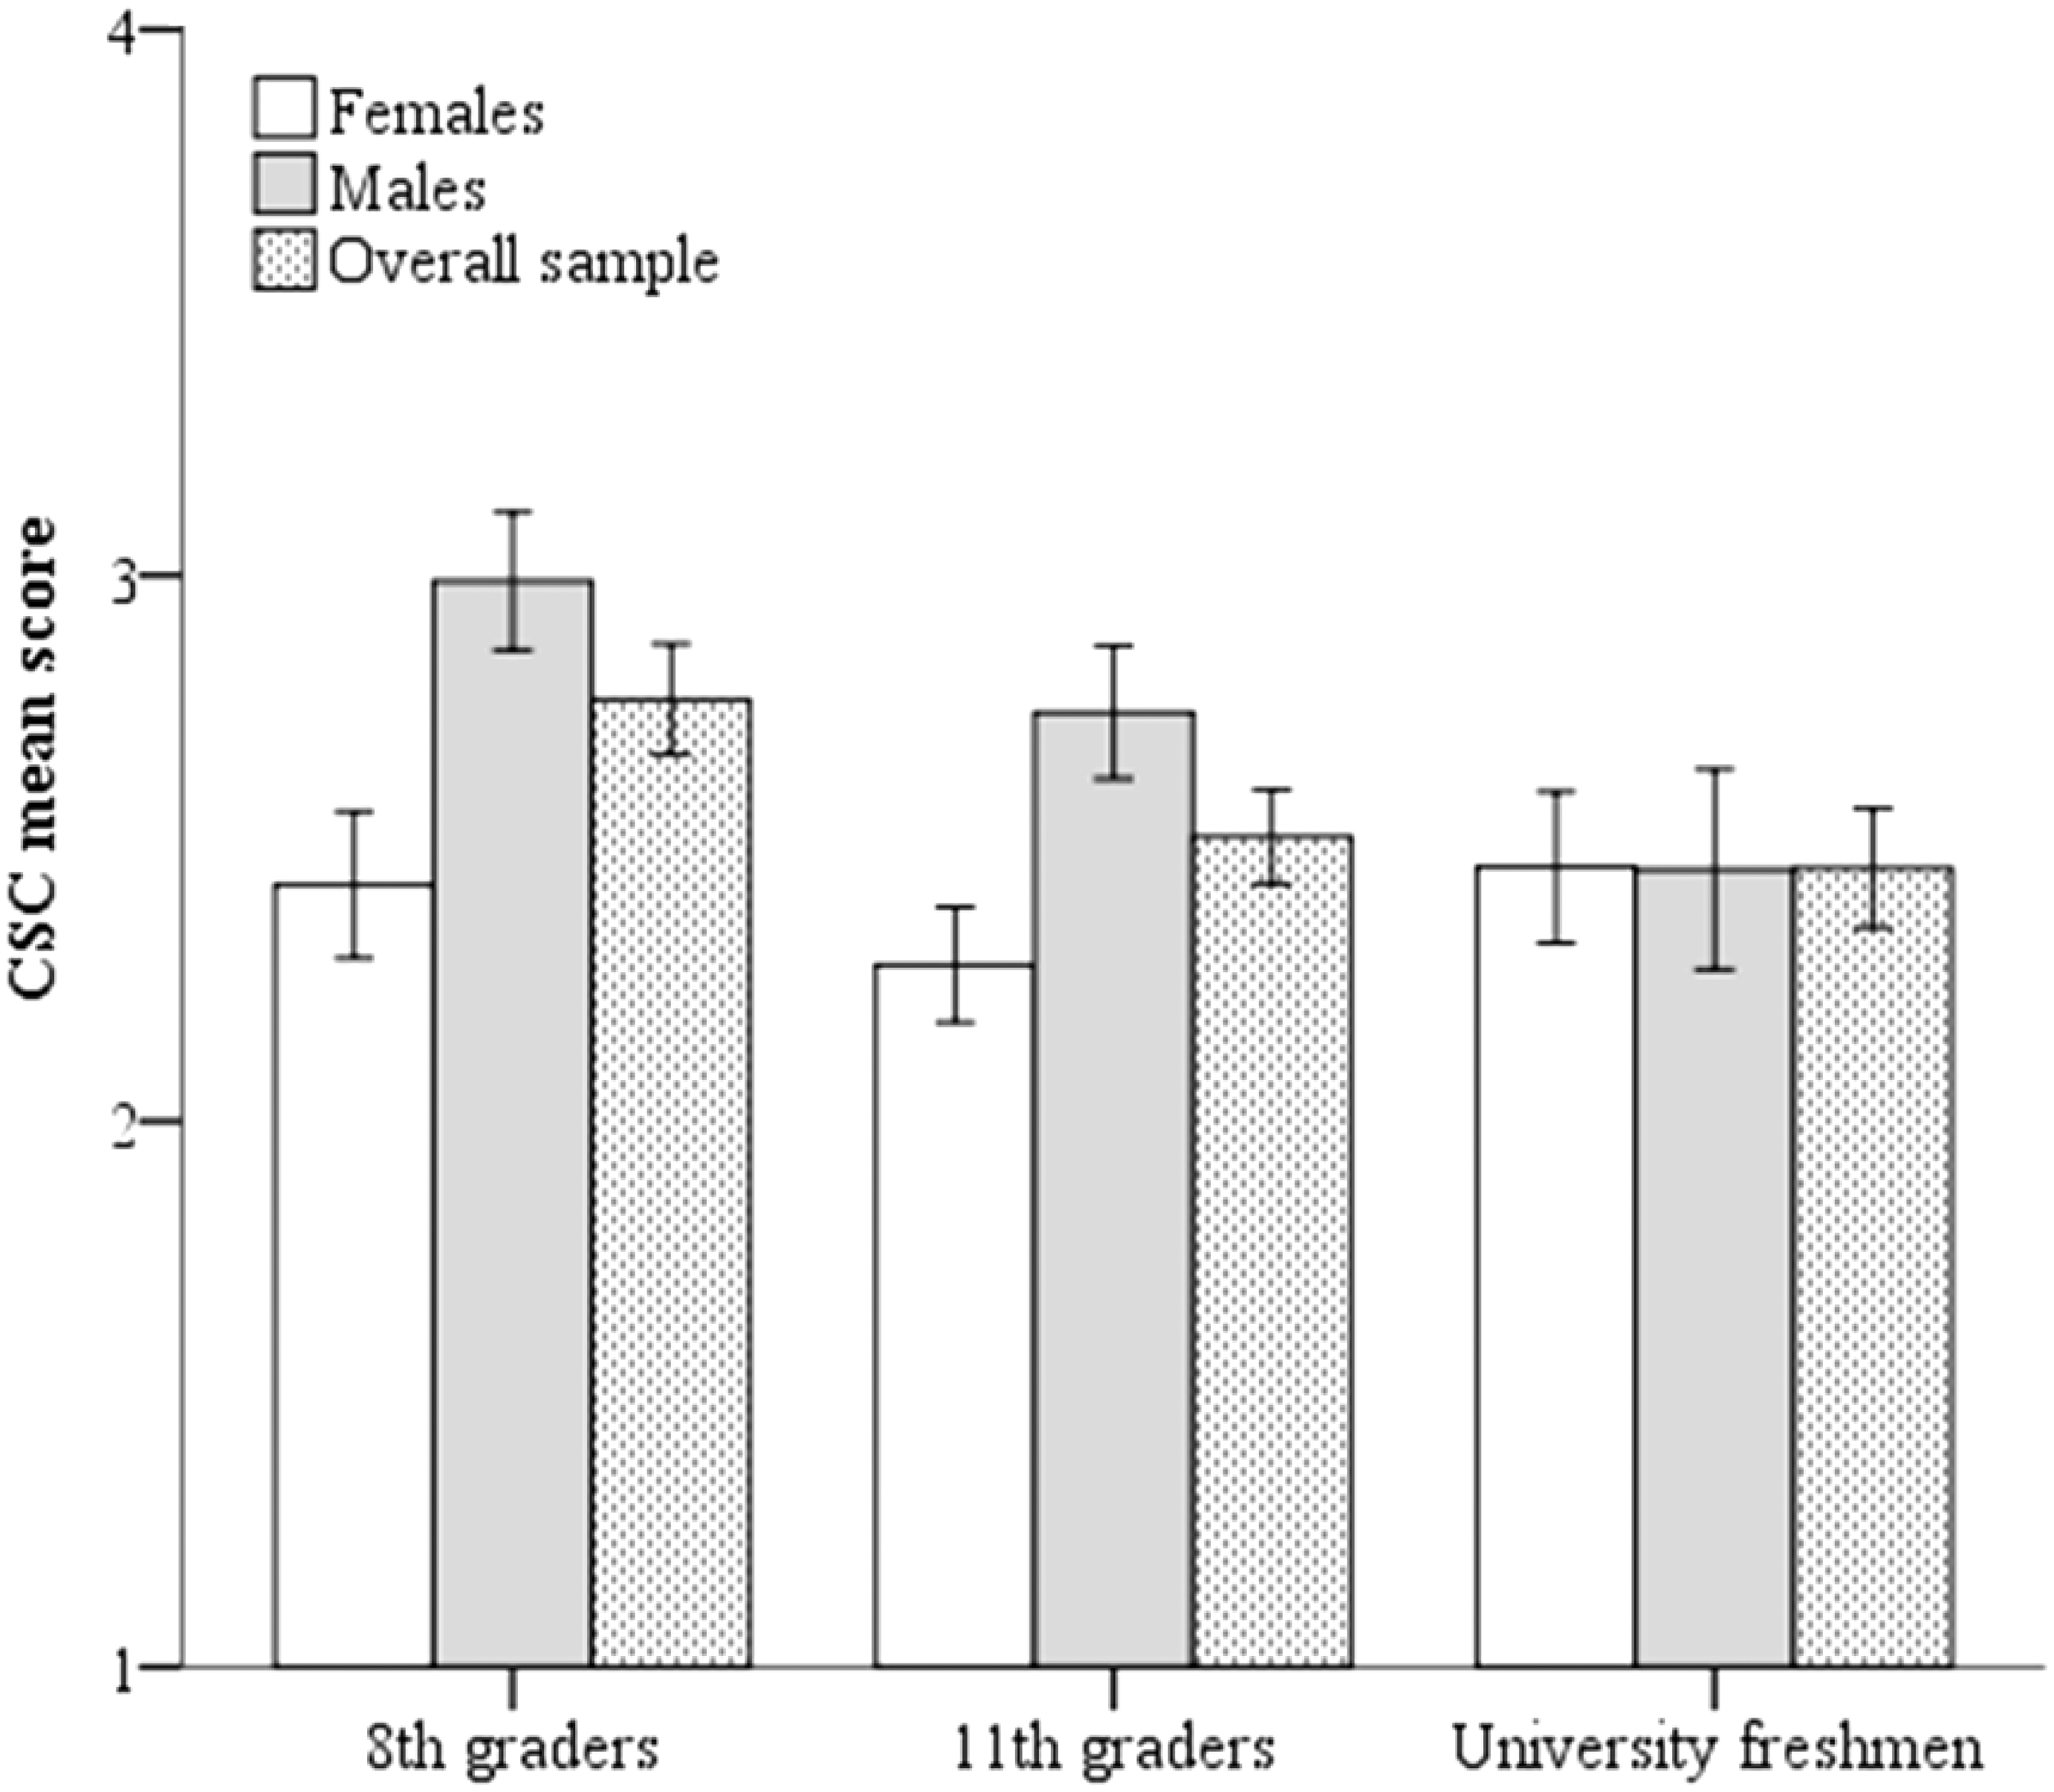
Although there were no significant differences between gender of the university students, we observed that the male 11th graders reached a higher CSC (M = 2.75, SE = .65) than the female 11th graders (M = 2.29, SE = .54). This difference, −.46, BCa 95% CI (−.62, −.30), was significant, t(212) = −5.65, p < .001, d = .77. Similarly, with the female 8th graders (M = 2.43, SE = .53) and the male 8th graders (M = 2.99, SE = .63), the difference, −.56, BCa 95% CI (−.75, −.37), was also significant, t(157) = −5.81, p < .001, d = .94.
Discussion
This study presented a German valid and reliable single factor scale with a minimal number of items to measure the CSC. We succeeded in validating the unpublished CSC scale of Schwanzer (2002) for different gender and age-groups of the German “Gymnasium” by reducing the number of items from 12 to 6 showing an overall good test–retest reliability and internal consistency. The implementation of the scale showed that 8th graders demonstrated a higher self-concept than 11th graders and even the university freshmen. Similarly, a stereotypical gender difference, with a higher CSC for male participants, was found for the 8th as well as for the 11th graders. This difference vanished for university students.
Questionnaire Revision and Validation
The CSC is one component of the total academic self-concept. Therefore, it should not consist of more than one single factor, especially under consideration of implementing the scale in a school context. In general, the validation of a scale should result in an instrument as short as possible while maintaining acceptable support for its validity and reliability (Ferketich, 1991). We obtained an instrument with a single-factor structure with moderate to good factor loadings measuring the CSC. For approval of criterion validity, university student’s responses about individual computer usage were monitored. According to our expectations, the external criteria correlated significantly with the CSC scale which supports the scale’s criterion validity. Those who often use the computer for a variety of purposes (e.g., surfing the internet, electronic communication, or using social networks) also have a high CSC, as do those who assess their abilities for various areas of computer usage as good. In this case, we required girls to be engaged in equal tasks of computer use compared with boys, as it was shown by Vekiri and Chronaki (2008). These external criteria were in line with the multidimensional CSC model (Janneck et al., 2013) and confirm that the validated scale measures are based on conative, motivational, and cognitive components of the CSC. This also includes related constructs like emotions and attitudes toward computers or self-efficacy.
The internal consistency, shown by Cronbachs’s alpha, is overall good (.84), as it is for all three subsamples and both genders. Moreover, the measured test–retest reliability estimate was acceptable which implies a demonstrable stability of the CSC and an adequate dependability and accuracy of the assessment method. This points out that the CSC is not influenced by actual external variables during the test situation. Furthermore, all items showed an appropriate scale homogeneity which is a supporting argument for both validity and reliability (Ferketich, 1991).
For analyzing the gender-specific CSC, we also validated the shortened CSC scale separately for girls and for boys. Our results supported a single factor solution and a good overall reliability for both genders of every age-group.
The CSC scale was one of 17 subscales proposed by Schwanzer (2002) with the goal to evaluate the total self-concept. Due to small sample sizes and missing test–retest reliabilities, the CSC scale was the only one that was never completely validated. Consequently, we had first focused on the validation of the CSC scale. This scale now offers the possibility to be implemented with the 16 other subscales to evaluate the total self.
Implementation of the CSC Scale in Different Age-Groups
In our study, the freshmen’s CSCs did not discriminate between girls and boys. This is in line with the computer usage study of Imhof, Vollmeyer, and Beierlein (2007). In consequence, the CSC can be yield a nonstereotypical self-concept rating in university courses despite some disagreement in the literature. Baram-Tsabari and Yarden (2011), for example, stated that the typical stereotypes are not completely developed until the end of high school. This would result in a lower CSC for girls and a higher one for boys (compare also Sáinz & Eccles, 2012).
On average, for both genders, older subjects score lower in the CSC. This is in line with the literature (Comber, Colley, Hargreaves, & Dorn, 1997). In the separate subsamples of 8th as well as the 11th graders, our study demonstrates stereotypical gender differences in the CSC scores. This is in line with the results of Sáinz and Eccles (2012) who also demonstrated a stereotypical gender gap. The only difference is that, in contrast to our study, the self-concept increases for male students over time, whereas the self-concept of the female respondents decreases. Our results were inverse. By comparing the CSC of both genders in the three explored age-groups, the CSC scores became aligned in conjunction with a decrease of boys’ CSC and an increase in CSC experienced by girls.
The Scales Relevance in School
Our study points out gender differences in the CSC in school relevant ages. These differences in self-concept scores may play a significant role in regard to inter-individual differences in computer-related learning and motivational characteristics as well as interest (Christoph et al., 2015; Denissen et al., 2007; Marsh, Trautwein, Lüdke, Köller, & Baumert, 2005). At least, the self-concept shapes the academic and occupation choices later-on (Lips, 2004), influences individual goal-setting and choices of future profession. These preferences by themselves may additively explain specific (school) subject motivation (Markus & Nurius, 1986). Therefore, an equivalent self-concept of both genders is necessary to enable all students the same chances especially by taking into consideration technology courses and the fact that computer-based teaching and learning is becoming an increasingly important role in school. This study indicates that a push to increase the CSC of girls is needed while maintaining the high CSC level of boys. To guarantee individual and optimal support within the terms of differentiation, a tool for evaluating individual CSC scores is required to adapt teaching methods. By displaying the current CSC status of students, the CSC can be considered for adapting teaching to each class, for example, by differentiation or offering several learning aids with varying difficulty in computer-based learning-units. In consequence, high CSC-achieving students are not under-challenged anymore, while all other students find a better chance to reach high cognitive achievement levels. Since the self-concept is strongly connected to individual experiences, students can improve their individual self-concept by successfully mastering new learning contents by using computer-based learning in this way of teaching (Janneck et al., 2013). This increase in CSC is not only relevant for following education but also in future profession that will be more and more include working with computers. Therefore, teaching in younger ages should focus on evaluation of CSC and lead to a more positive CSC.
The scales shortness allows an easier application in school contexts. This includes implementations from a teacher’s side to adapt their individual teaching efforts as well from researcher’s side to evaluate teaching forces with computers. Furthermore, long-term studies with multiple completions of the questionnaire become more feasible allowing comparisons over time. This can be used, for example, to evaluate the effectiveness of different teaching methods using the computer or the impact on the girls’ and boys’ CSC.
Potential Limitations
Our 4-digit response format of the CSC scale allows two points of view: On one hand, the absence of a (undecided) midpoint can avoid responses affected by social desirability, but on the other hand, distortions in the results are possible (Garland, 1991). Our present study does not allow any decision about preferences.
A cohort effect in our study cannot be excluded due to an age gap of 7 years in our sample (while technical progress proceeds very rapidly). Therefore, we would favor longitudinal study in the future. Additionally, to verify a shift of the CSC over ages, more age-groups are required, especially in younger ages. To increase the representativeness of the results, more data from different school types and countries are needed. Additionally, the construction of self-concept is more than just the reflection of absolute performance. Flexible selection and processing information where also personality traits come in, was shown to be important for develop a completive self-concept (Byrne, 1996; Gniewosz, Eccles, & Noack, 2011; Jonkmann, Becker, Marsh, Lüdtke, & Trautwein, 2012). In the following, the Big-Fish-Little-Pond-Effect (BFLPE) and social desirability shall be exemplary portrayed. Equally abled students show lower academic self-concepts when being part of a high-achieving class than being part of a low-achieving one. This phenomenon is well-known as the BFLPE (Marsh, 1987; Marsh & Parker, 1984). In our study, we cannot rule out the BFLPE having an impact on our results because we have not collected additional data about achievement levels of each participating class of our study. Furthermore, social desirability can lead to a falsification of results (Mummendey & Grau, 2008; Rost, 1996). Personality tests often are easy to see through. This may induce that self-monitoring, for example, with rating scales, is more similar to an ideal self than the real self. Additionally, this effect varies with age, gender, and class affiliation. To minimize an influence of social desirability, the questionnaire of this study was implemented in a pen-and-paper format by ensuring anonymity. But to prove the direct influence of social desirability on the results of the study a control scale should be added to the questionnaire, if the questionnaire’s volume does allow (see, Oerke & Bogner, 2013). Mummendey and Grau (2008) even report that socially desirable answers are part of a measured construct especially in self-concept research. All in all, this study cannot provide evidence about a possible influence of social desirability but tried to minimize the impact by adapting the execution of the survey.
Finally, we propose to implement our valid and reliable scale together with the scale for measuring the self-concept of computer ability of Zarrett and Malanchuk (2005) in order to examine whether these both are based on the same construct and to face convergent construct validity. To go even into more detail and to confirm the multidimensional CSC model, the “attitudes toward computer usage” scale (ATCUS v 2.0) by Morris, Gullekson, Morse, and Popovich (2009) and the “computer user self-efficacy” scale (CUSE) by Cassidy and Eachus (2002) may add strengths into further surveys.
Conclusion
The presented instrument provides a reliable and valid way for educators and teachers to rapidly obtain information about computer-related issues including self-concept preferences. The advantage of this scale is its broad psychological foundation and that it can be implemented on a stand-alone basis as well as in combination with other subscales to gain a holistic vies of self-concept (Schwanzer et al., 2005). The scale’s shortness allows its application in classrooms without disturbing teaching flows and, thus, provides a huge potential to optimize teaching according to the individual needs of students.
Footnotes
Acknowledgments
This publication reflects only the author’s views and the European Union is not liable for any use that might be made of information contained herein. Special thanks go to teachers and students involved in this study for their cooperation.
Declaration of Conflicting Interests
The authors declared no potential conflicts of interest with respect to the research, authorship, and/or publication of this article.
Funding
The authors disclosed receipt of the following financial support for the research, authorship, and/or publication of this article: This study was supported by the Inspiring Science Education (ISE) project funded by the European Union’s ICT Policy Support Programme as part of the Competitiveness and Innovation Framework Programme (Grant: 325123).