
Abstract
Integrating engineering design into K-12 curricula is increasingly important as engineering has been incorporated into many STEM education standards. However, the ill-structured and open-ended nature of engineering design makes it difficult for an instructor to keep track of the design processes of all students simultaneously and provide personalized feedback on a timely basis. This study proposes a Bayesian network model to dynamically and automatically assess students’ engagement with engineering design tasks and to support formative feedback. Specifically, we applied a Bayesian network to 111 ninth-grade students’ process data logged by a computer-aided design software program that students used to solve an engineering design challenge. Evidence was extracted from the log files and fed into the Bayesian network to perform inferential reasoning and provide a barometer of their performance in the form of posterior probabilities. Results showed that the Bayesian network model was competent at predicting a student’s task performance. It performed well in both identifying students of a particular group (recall) and ensuring identified students were correctly labeled (precision). This study also suggests that Bayesian networks can be used to pinpoint a student’s strengths and weaknesses for applying relevant science knowledge to engineering design tasks. Future work of implementing this tool within the computer-aided design software will provide instructors a powerful tool to facilitate engineering design through automatically generating personalized feedback to students in real time.
Introduction
Engineering education often involves situating problem-solving in realistic settings within which students are supposed to integrate science knowledge of various domains into generating viable solutions (Asunda & Hill, 2007; English, 2016; Lewis, 2005; Mangold & Robinson, 2013). As a heated topic in engineering education, engineering design is widely regarded as an important ingredient in STEM education and thus the Next Generation Science Standards call for its use (Bybee, 2014; National Research Council, 2012). Engineering design tasks in K-12 settings are important not only because they offer training and realistic experience to future STEM major students but because they foster all students’ ability to apply diverse knowledge taught separately in school to solve real-world problems (Chabalengula & Mumba, 2017; Mentzer et al., 2015; Yuen et al., 2015). This is a desirable goal of education since it equips the next generation with necessary problem-solving skills (Razzouk & Shute, 2012; Zheng et al., 2020).
Teaching engineering design successfully requires effective and efficient assessment methods to provide accurate and timely feedback to facilitate a student’s learning and solution-generation during the design process (Arastoopour et al., 2016; Vieira et al., 2016). This is difficult to achieve for two reasons. The first problem is that like other design tasks engineering design is open-ended and ill-structured (Bartholomew, 2017; Jonassen, 2010; Li et al., 2020). The complexity of such tasks at all levels (number of actions or action sequences, paths of solution generation, end artifacts, etc.) requires an advanced computerized engineering design system that can track fine-grained design process data. However, the intricacy of a sea of design process data that students generate in these tasks makes it difficult to infer a student’s intention based on observable evidence, which induces uncertainty in building assessment models (Kodagoda et al., 2017; Rahman et al., 2019). Applying inadequate models in assessment is likely to provide misleading information as to student learning (Clow, 2012). The second obstacle to accurate and timely feedback is that the methods that are currently popular in analyzing engineering design process tasks are unable to provide insight before students complete the task. Powerful and insightful as they are, traditional approaches such as video analysis and artifacts analysis also require enormous time and labor of instructors (Blikstein et al., 2014; Vieira et al., 2016).
The extremely fast development of computer storage and computational power has made possible the application of learning analytics (LA) and educational data mining (EDM) in educational settings of all levels (Xing et al., 2019). EDM is an interdisciplinary field that combines statistics, data science, and computer systems to mine useful knowledge from educational data to support all components of the instructional cycle (Lang et al., 2017; Papamitsiou & Economides, 2014; Romero & Ventura, 2013). Student assessments could implement EDM using approaches such as decision trees, k-nearest Neighbor (KNN), support vector machine (SVM), and Bayesian inferential methods to generate association rules, classifiers, and clusters with useful information (Slater et al., 2017; Sundar, 2013).Among those common EDM techniques, Bayesian inferential processes such as the application of Bayesian Networks (BNs) are particularly suited to perform certain inferential tasks in assessing student performance in engineering design (Wipulanusat et al., 2020). With relevant factors appropriately included and their dependencies set in terms of conditional probabilities, a BNs model could be seen as a representation of the real-world scenario under consideration (Asif et al., 2017; Lacave et al., 2018; Millán et al., 2010; Ramírez-Noriega et al., 2017). Given the “white-box” nature of BNs that relevant variables and their relationships are carefully worked out to abstract the situation of interest, the posterior probabilities of each affected node could be updated with ready interpretability during the challenge learning process. The automatic assessment results from BNs can be translated into concrete feedback to students during the engineering design process. In addition, since each variable within such a model is represented as a probability distribution, instructors could use the BNs model to handle uncertainties that pervade the assessment of an engineering design process where systems record student actions without an understanding of the intention (Conati et al., 2002).
In this study, we aimed to build a BNs model that simulates the scenario when a student tackles an engineering design challenge and utilize it to infer the level at which the student applies relevant knowledge in the design process. We examined the performance of the results in terms of certain metrics and compared this model with three other benchmark classification models (DecisionTree, KNN, and SVM). We also discussed some representative examples identified through the BNs model and their implications in engineering design practice. We asked two research questions below:
How well does a BNs model predict a student’s design solution reflected by the performance of his final artifact in comparison to some benchmark data mining methods? How might instructors use a BNs model to determine a student’s science knowledge application during the engineering design process to provide useful feedback during the process?
Literature Review
Engineering design education is gaining ever-increasing popularity within the STEM education community (English, 2016; Lewis, 2005; Xie et al., 2018). In order to perform well in an engineering design project, students need to show adequate understanding of relevant science knowledge from an interdisciplinary perspective as well as certain design thinking content knowledge and skills (Lewis, 2005; Zheng, Xing, Huang et al., 2020). The need to include engineering related topics that are appropriate to students’ knowledge level in these tasks imposes certain difficulties. For example, due to the complexity of engineering processes and the open-ended nature of design artifacts, it is hard for teachers to keep track of each student’s current progress, not mentioning offering customized feedback in a timely manner.
Teachers and researchers have used several methods to evaluate students’ engineering design products and process. These include verbal protocol analysis of students’ process (Atman & Bursic, 1998; Atman et al., 2008), design replays from software and student-generated notes as a means to identify informed design patterns (Purzer et al., 2015), and artifact elicitation interviews to assess design thinking (Eyeman et al., 2018). However, these methods provide assessment in a post hoc manner and usually require a huge amount of human labor on the part of assessors. New technologies offer avenues to address these issues (Lee & Lee, 2016). Hauge and Riedel (2012) and Hew and Cheung (2010) provide two examples. The former conducted a research study utilizing two serious games for teaching engineering and manufacturing. By analyzing collected data including chat log files recorded by the gaming environment, they were able to determine how college engineering students communicate to each other during the game. The latter did a comprehensive review of how instructors have used 3D immersive virtual environments in K-12 and higher education settings.
Research on the application of technologies to the use of engineering design problems in the education remains thin. The lack of viable tools to allow authentic engineering education is one probable reason. But the implementation of technological tools and huge amount of process data accompanying them also require a compatible method to automatically negotiate pinpoint and in-time assessments.
As an emerging field that takes advantage of modern computers, LA and EDM has proved promising in several educational tasks such as predicting student performance, providing customized feedback, promoting self-reflection, etc. based on educational big data (Papamitsiou & Economides, 2014; Romero & Ventura, 2013). Many studies have explored the application of EDM in educational settings of all kinds and obtained meaningful results (Antonenko et al., 2012; Castro et al., 2007; Chen et al., 2014; Romero et al., 2008; Vialardi et al., 2009). Several research studies have documented the use of EDM techniques within engineering education. For example, Yadav and Pal (2012) applied and compared several classification algorithms based on student-related variables such as gender, high school grade, admission type, etc. to predict their final exam performance. Pal (2012) built predictive models to help identify potential dropout engineering students based on new students’ records in order to provide corresponding support. Ito et al. (2018) applied text mining techniques to assess effectiveness of pedagogy in open engineering design tasks. Uskov et al. (2019) compared eight benchmark machine learning models for predictive analytics and offered usage recommendations in STEM education. The automatic nature of the EDM approach makes it easy to scale and able to provide feedback to both teachers and students during the design process.
Among several LA and EDM methods that could be applied to assess a student’s performance in engineering design tasks powered by technologies, the Bayesian network classifier is particularly appropriate. During an engineering design process, students might implicitly conduct multiple lines of reasoning at the same time, which leads to high uncertainties that could not be handled easily (Conati et al., 2002). A BNs model uses probabilities to represent uncertainties of all its variables and those probabilities could be updated constantly depending on fed evidence observed in real time (Jameson, 1995; Liu, 2006; Millán et al., 2010). Such a white-box model – a realistic approximation of the real scenario – provides ready understandability that has important implications for teaching practice. For example, Sharabiani et al. (2014) built a Bayesian network to predict engineering students’ grades in certain courses in order to provide timely help to at-risk students. Lacave and Molina (2018) reported a case study on the relationship between data heterogeneity and BNs model adjustment when applying such probabilistic models to the dropout problem of engineering students. In a web-based education system, García et al. (2007) found that BNs are a promising tool for detecting students’ different learning styles. Xu et al. (2016) used BNs to assess teaching competency of 23 teaching assistants interacting with a 3D virtual training environment. Feng et al. (2017) developed a dynamic Bayesian network, a type of BNs that considers variable dependencies between time slices, to classify engagement levels of interactions between a therapeutic robot and children with autism. Such kind of BNs was also applied by scholars to assess a student’s performance in educational video games (Levy, 2019).
While many predictive models exist based on various kinds of educational big data using LA and EDM approaches, there is little research on building such models from engineering design process data. Among the limited amount of studies on engineering design process using LA and EDM methods, few studies have leveraged white-box models such as BNs to understand how students apply science knowledge during the engineering design process, thus automatically providing insightful feedback (Dasgupta et al., 2019; Rahman et al., 2019; Vieira et al., 2016). This study aims to address this gap by comparing BNs with traditional machine learning models and use BNs to draw inferences on the extent where the student applies relevant knowledge in the design process.
Methodology
Research Context
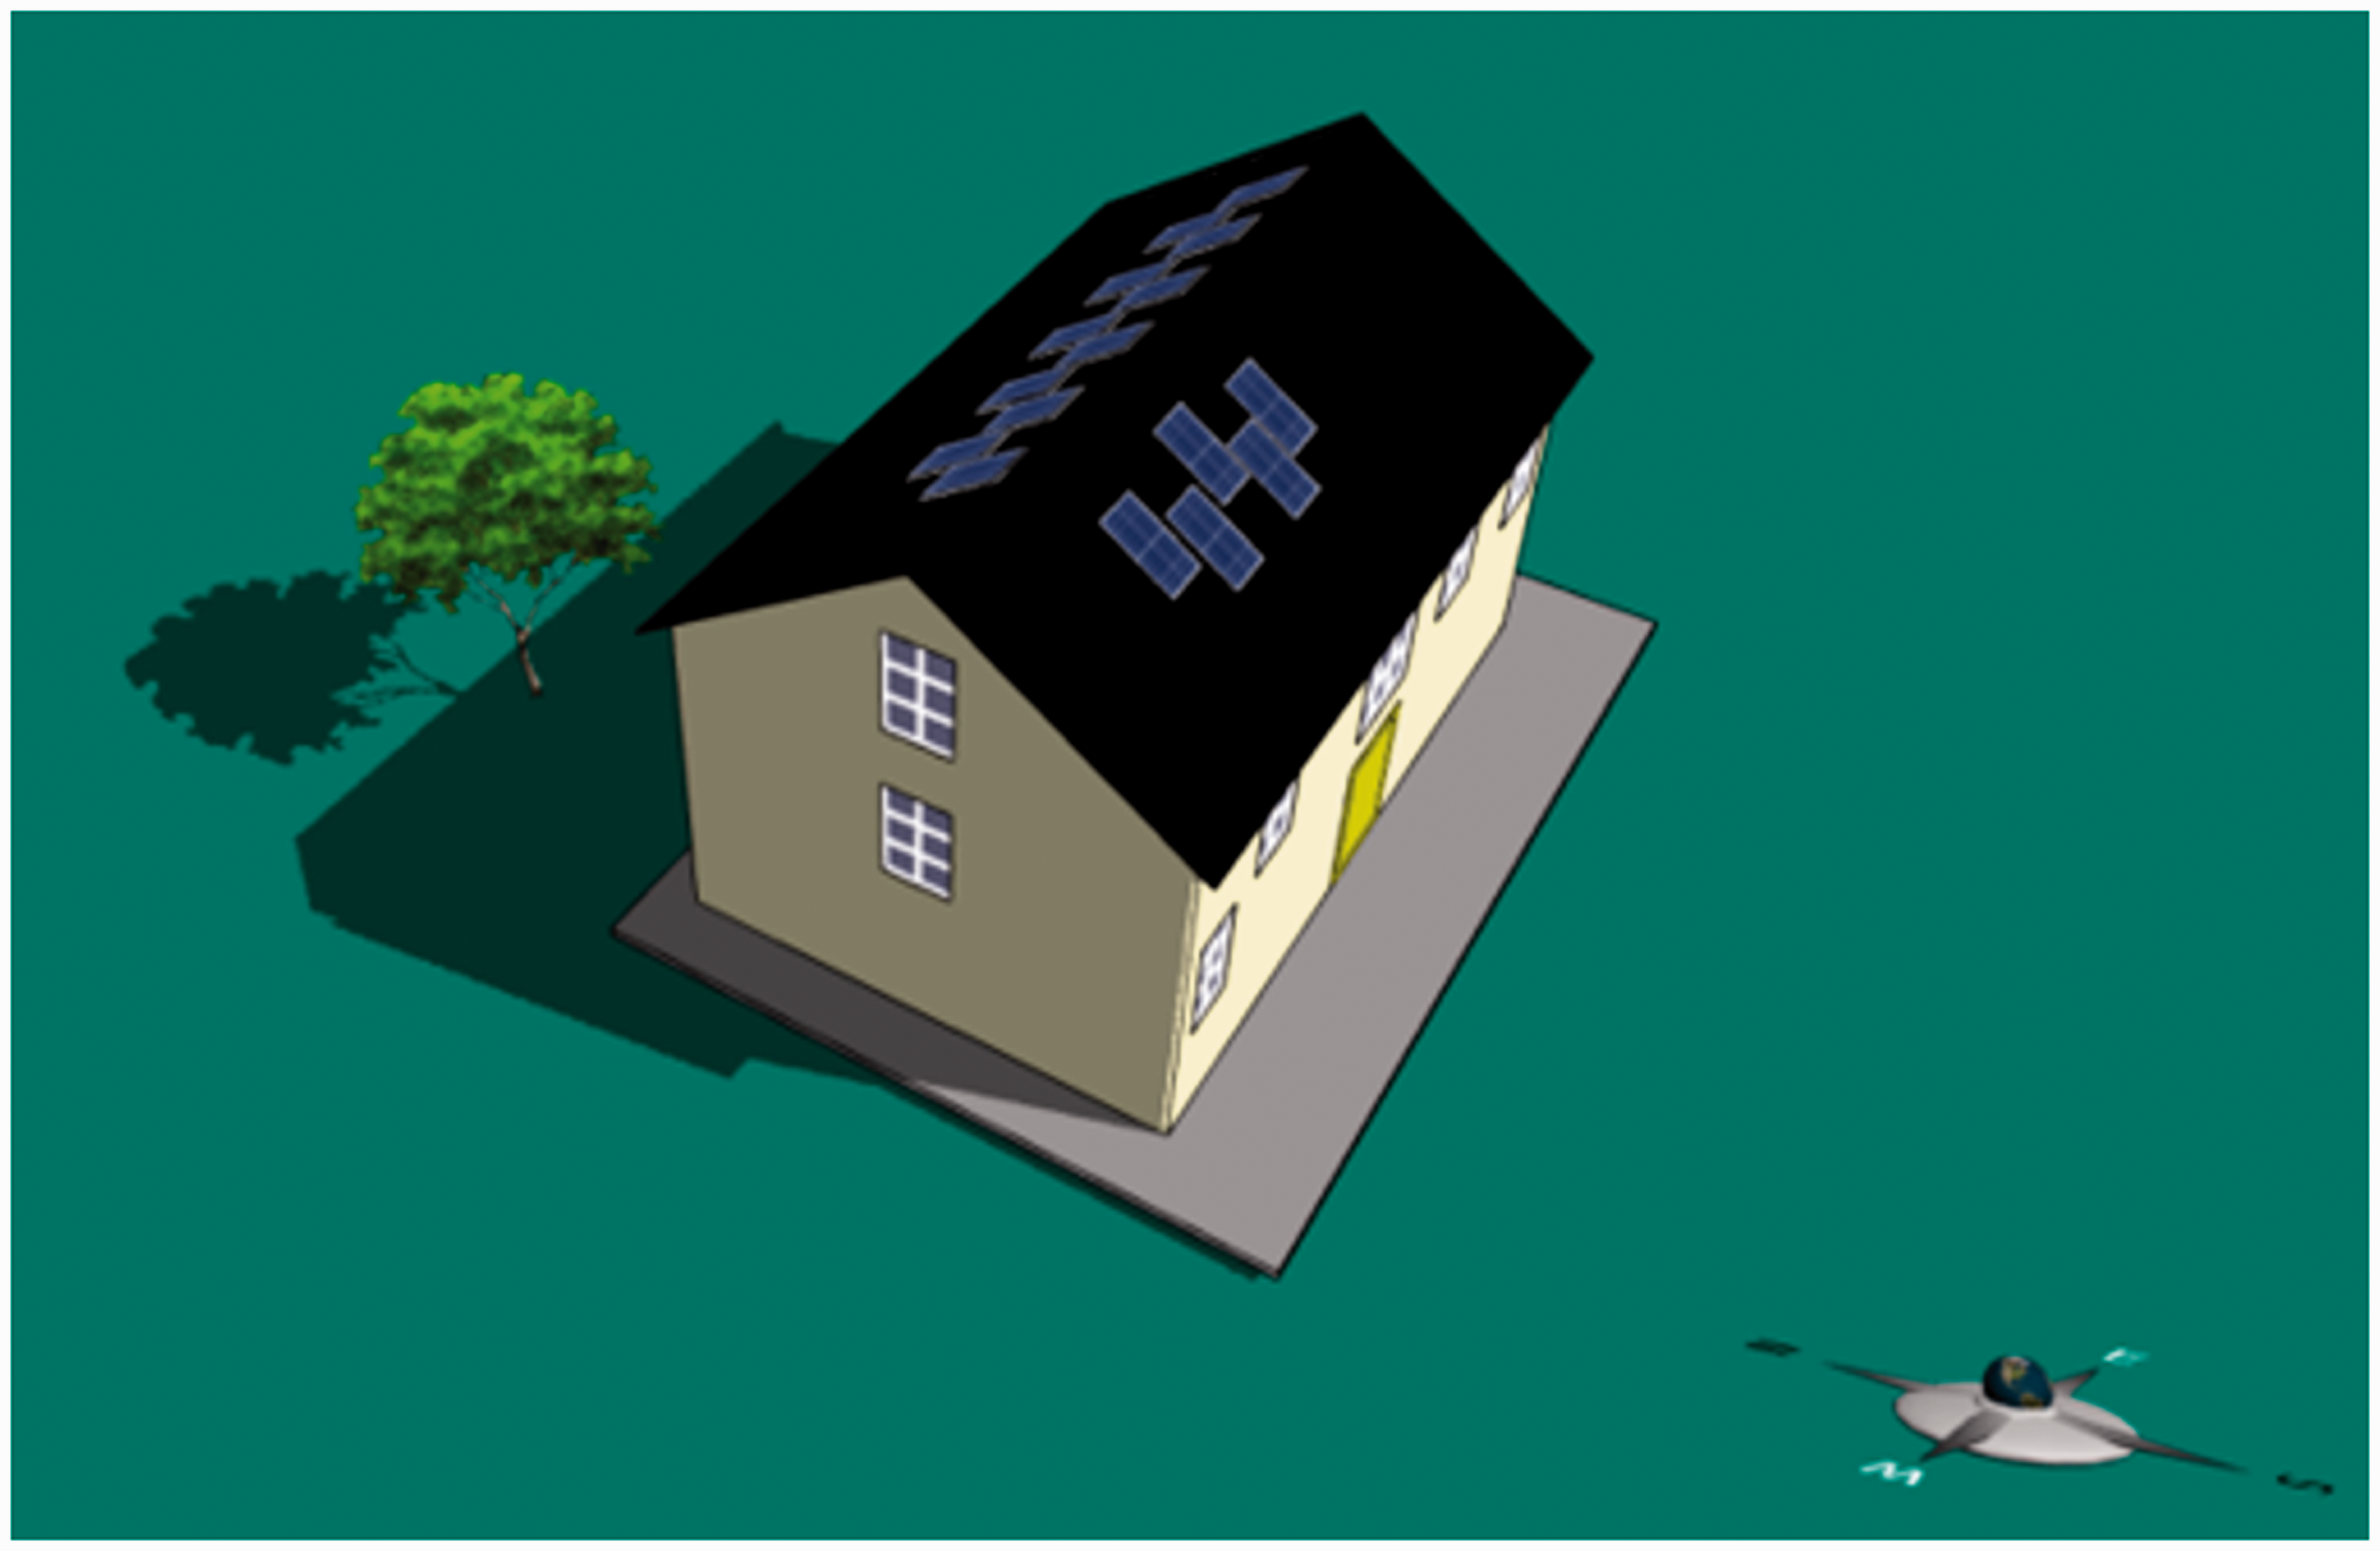
This study examined a design task assigned to students using Energy3D scientific simulation and design software (Figure 1). Within Energy3D, users can easily build 3D structures that are related to solar energy production ranging from buildings mounted with solar panels to solar power plants featuring arrays of solar panel racks or solar thermal power systems. Based on built models, certain simulations could be performed for analysis purposes. Many professionals use Energy3D to build and test prototypes due to its convenience to use and scientific accuracy. The software logs all interactions between the Energy3D interface and its users with timestamps. This information can be extracted in JSON format for research purposes.
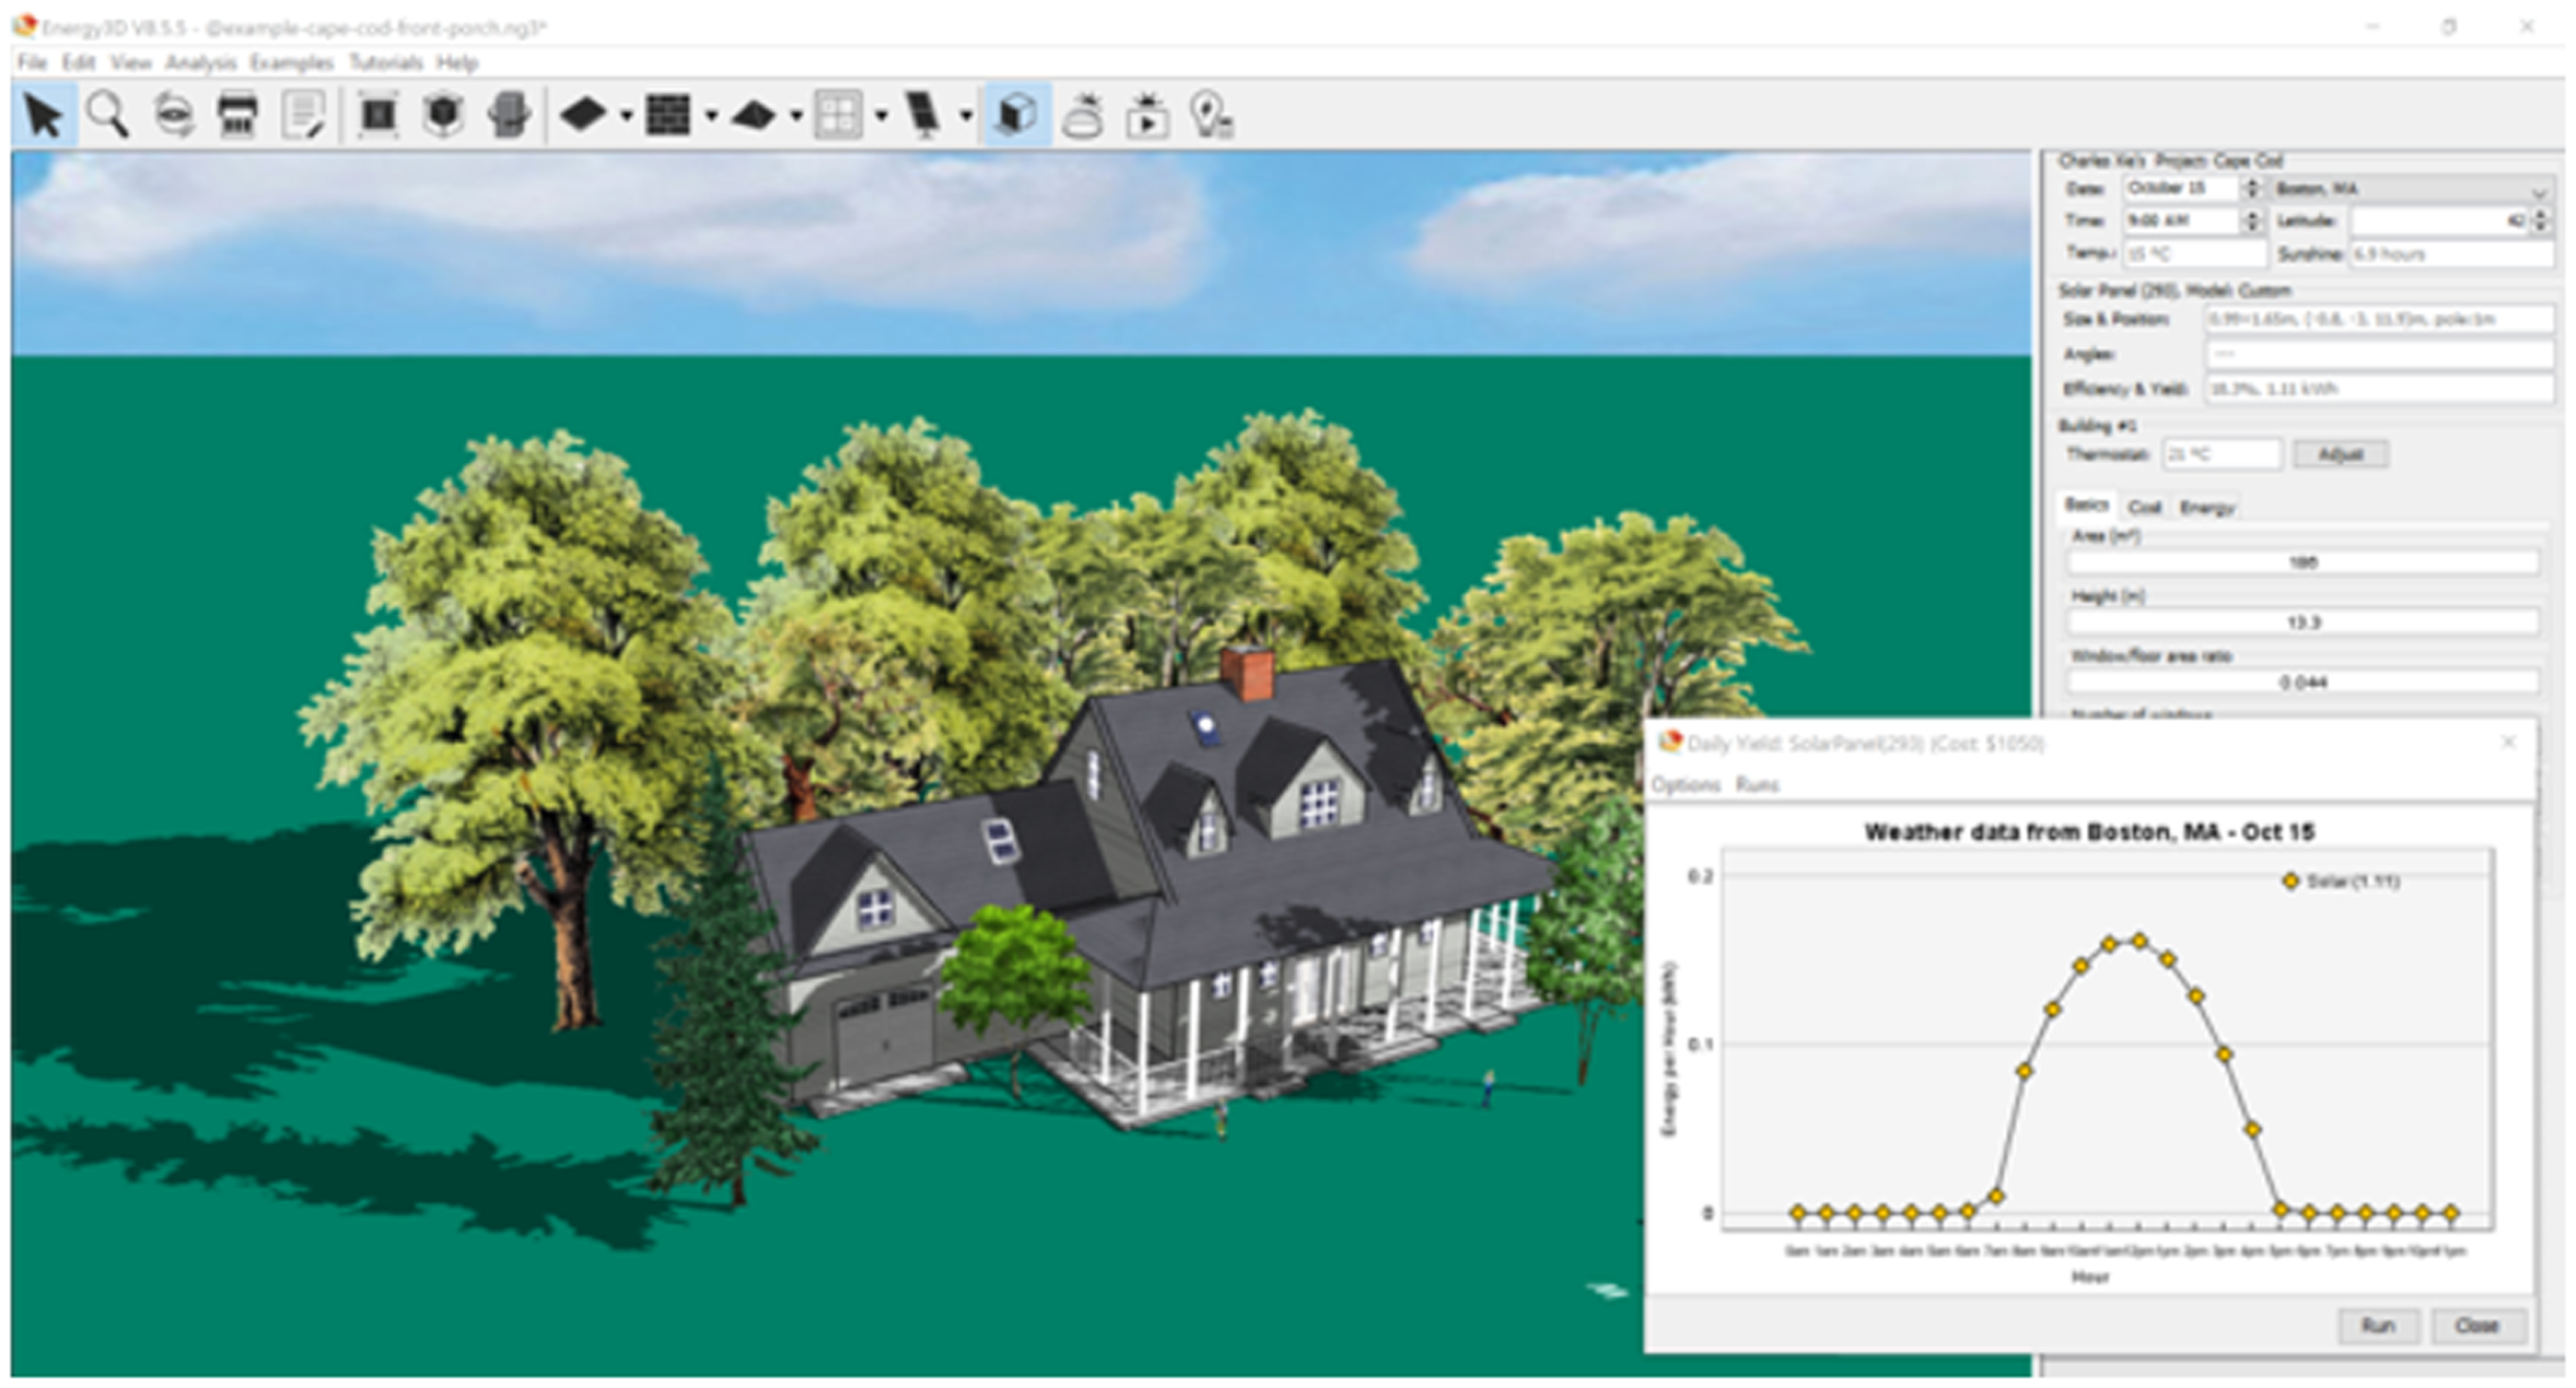
Energy3D User Interface.
A total of 111 ninth graders in five physical sciences honor classes from a suburban high school in the northeastern United States participated in the study. Among those students, 47% are males and 53% are females. One students withdrew from the study before it ended; two students’ log files were missing due to hardware problems; and three students’ submissions included either multiple buildings or broken files that made energy analysis inaccurate or impossible. After eliminating those participants, the remaining 105 students formed our sample for this research.
At the first class meeting during the study, students took a pretest that probed their design thinking as well as their ability to apply the scientific knowledge needed to perform the two design challenges that would follow. The first engineering design task, the Energy Plus Home Project, required them to design three detached homes, one each in the Cape Cod, Colonial, and Ranch styles, mounted with solar panels. Their goal was to meet specified energy consumption goals on a yearly basis in the Boston area. Students spent six 1-hour sessions on this task. The second task, the Bad Design Improvement Project, was completed in one 1-hour session. This required them to lower the yearly energy consumption of a given house design, also under Boston-area weather conditions. At the final class meeting students re-took the test they had taken eight days earlier. Each student’s problem-solving process was recorded by Energy3D and pooled together by researchers at the end of the tasks.
The Bad Design Improvement Project
This study focused on students’ performance on the Bad Design Improvement Project. In this design challenge, every student received an initial house file (Figure 2 left) manifesting inefficient design features compared to the solution students would create to receive a perfect grade (Figure 2 right). These features include having solar panels mounted on the north-facing roof, which receive less solar energy annually in Boston area than panels on the other side would. Also, the initial solar panel efficiency was set to 10% while students could increase to 20%, doubling the electricity generation. Besides optimizing the position and efficiency of solar panels to maximize output, students could also change the U-factor, which represent the insulation of windows, walls, roofs, and doors regarding heat transfer, to control heat loss in winter and unnecessary air-conditioning cost in summer. Students could also take advantage of the Solar Heat Gain Coefficient (SHGC) of windows and the position of trees to adjust the seasonal effect of solar radiation. For example, SHGC could be lowered to block solar radiation through windows in summer. However, a low SHGC value could also mean transmitting less solar energy in winter. Planting deciduous trees in front of the windows would block solar radiation that would otherwise overheat the house without blocking heat-generating sunshine in winter, as the trees would be leafless from November to March (Figure 2).
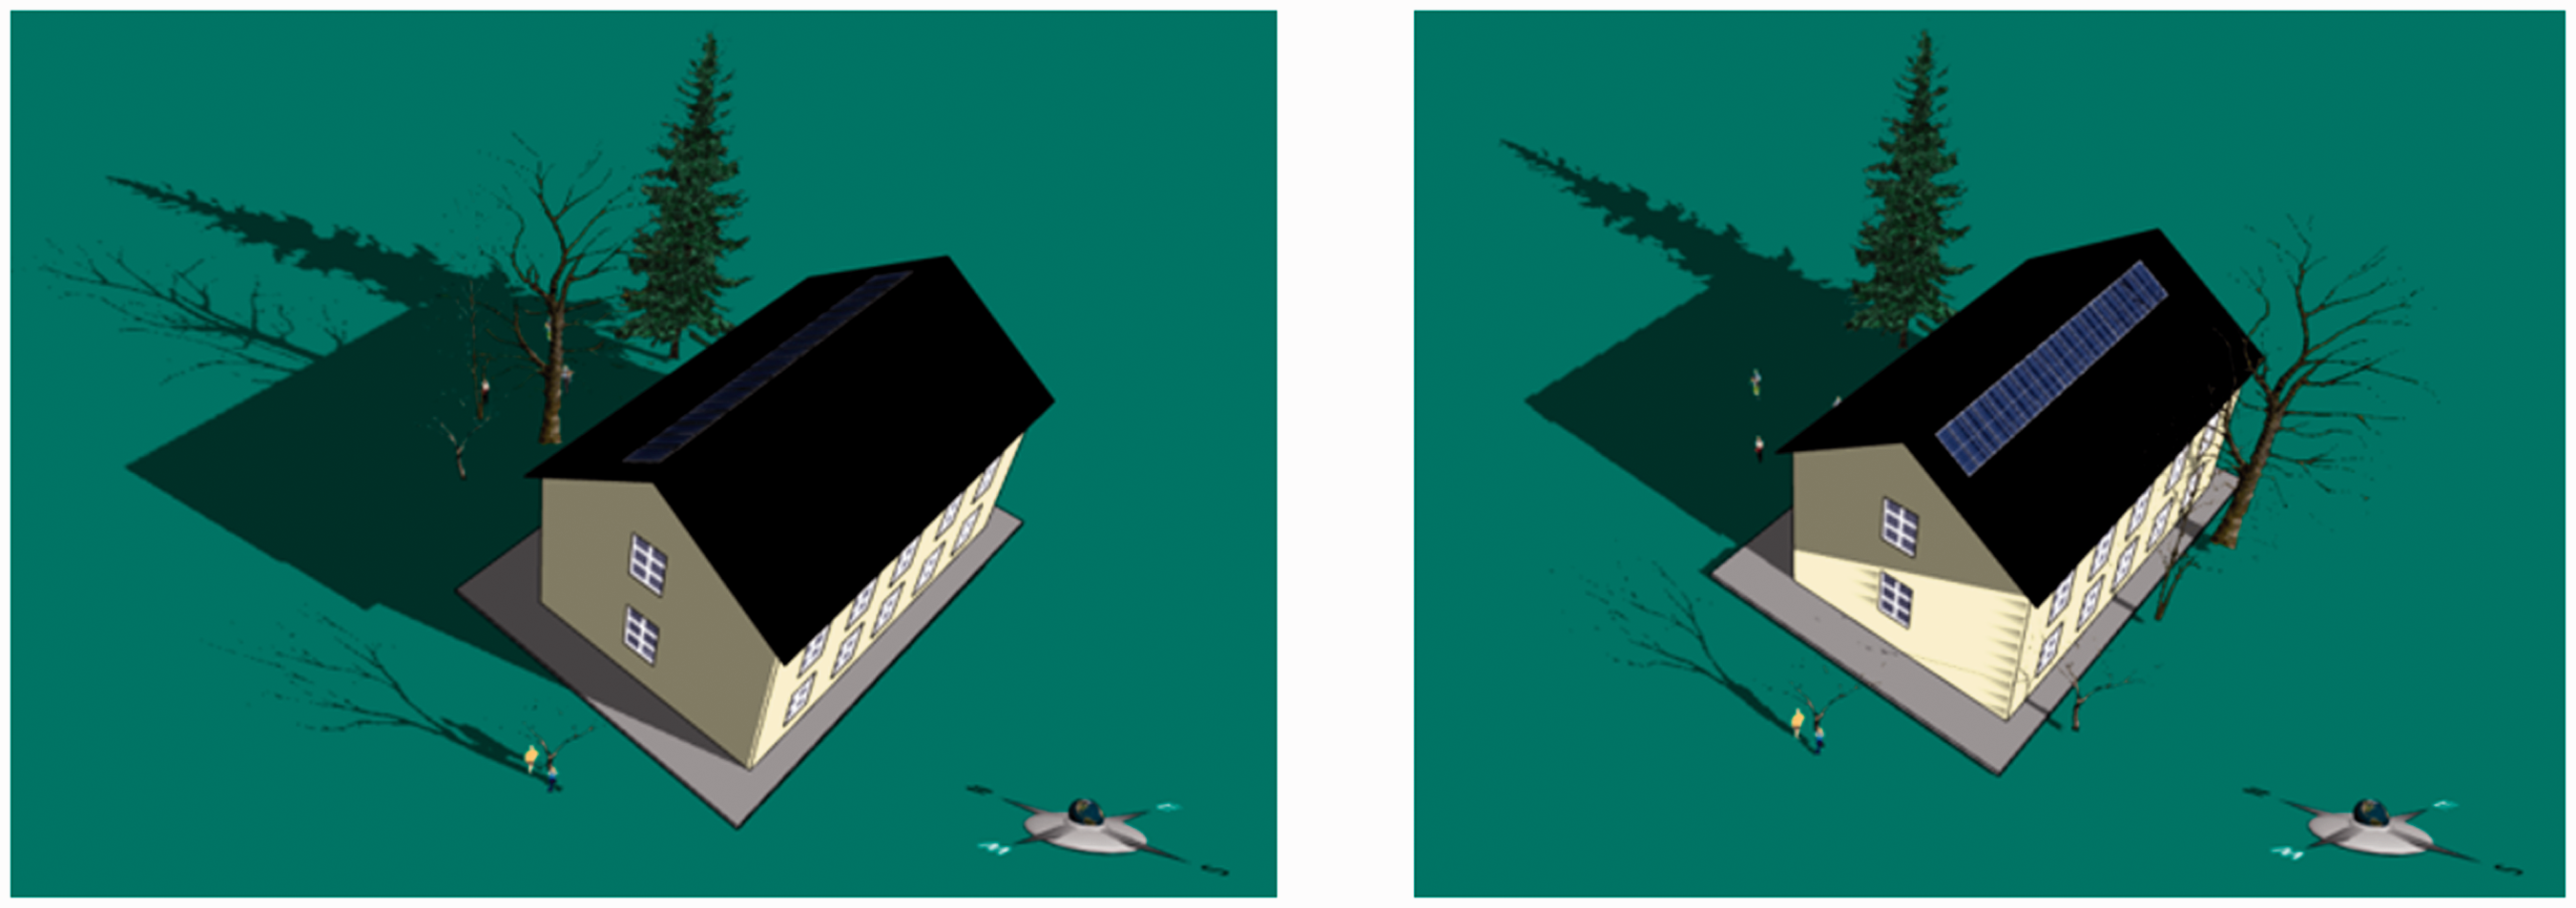
The Comparison Between a Bad Design (Left) and a Better Design (Right) in Terms of Annual Energy Cost.
The Bad Design Improvement Project suits this study for three reasons. First, students began working on this project after they had completed the Energy Plus Home project and had thus gained considerable familiarity with Energy3D as well as having the opportunity to acquire relevant energy-related science knowledge. Second, students were asked to fix possible issues without changing the basic shape of the house so they could focus solely on reducing annual energy cost. This is important since it allows us to isolate tasks undertaken to improve energy. Third, the fact students had a 1-hour session to complete this task, which meant that they were less likely to adopt a trial-and-error approach to gradually approximate to better solutions than to actively utilize what they knew to tackle the challenge.
Data Preparation and Analysis
This study primarily focused on students’ performance in terms of the net annual energy gain of their final artifacts and the log files of the Bad Design Improvement Project.
Students’ annual energy output were used to represent their performance level in this design task. They were first separated into two groups (high performer vs. low performer) and the group assignments served as the target label for various classification algorithms in this study.
Table 1 shows relevant statistics of the two student groups labeled by considering annual energy output of their final design.
Student Group Assignment Based on Annual Energy Output.

Analysis was mainly conducted with Bayesian networks (BNs) given BNs’ capability for real-time feedback and explainability to yield implications on students’ learning (Lacave & Molina, 2018; Millán et al., 2010; Sharabiani et al., 2014). Bayesian networks are probabilistic graphical models that specify random variables as nodes and dependencies between variables as arrows (Neapolitan, 2003; Pearl, 1988). Once a Bayesian network is built and prior probabilities are populated for each node, Bayesian probabilistic algorithms could be used to update posterior probabilities of latent nodes in the network as long as the states of observable nodes change (de Klerk et al., 2015). Prior probabilities describe researchers’ belief on the distribution of random variables without seeing the data (Xenos, 2004), which can be informative and non-informative. Informative priors are set with expert knowledge and experience. The ability to incorporate additional information in models mark one of the key advantages of Bayesian inference (Yu & Abdel-Aty, 2013). Non-informative priors are used when a researcher has only vague or little knowledge about the distribution of the interested parameters before observing data, usually in the form of Uniform or flatten-curved distribution (Ni & Sun, 2003). On the other hand, posterior probabilities are updated belief on random variables after incorporating observed data (Xenos, 2004). Like other models in the Bayesian analysis, the core formula of BNs (see formula (1)) is Bayes theorem, where 

Another important property BNs has is local Markov property, which defines that a node is conditionally independent of its non-descendants, given its parents. For example, students’ problem-solving performance in Figure 3 can be simplified to be only conditioned on hidden nodes, without being affected by evidence nodes. The local Markov property of BNs can greatly reduce the number of parameters, thus reducing computation in a fairly complexed model.
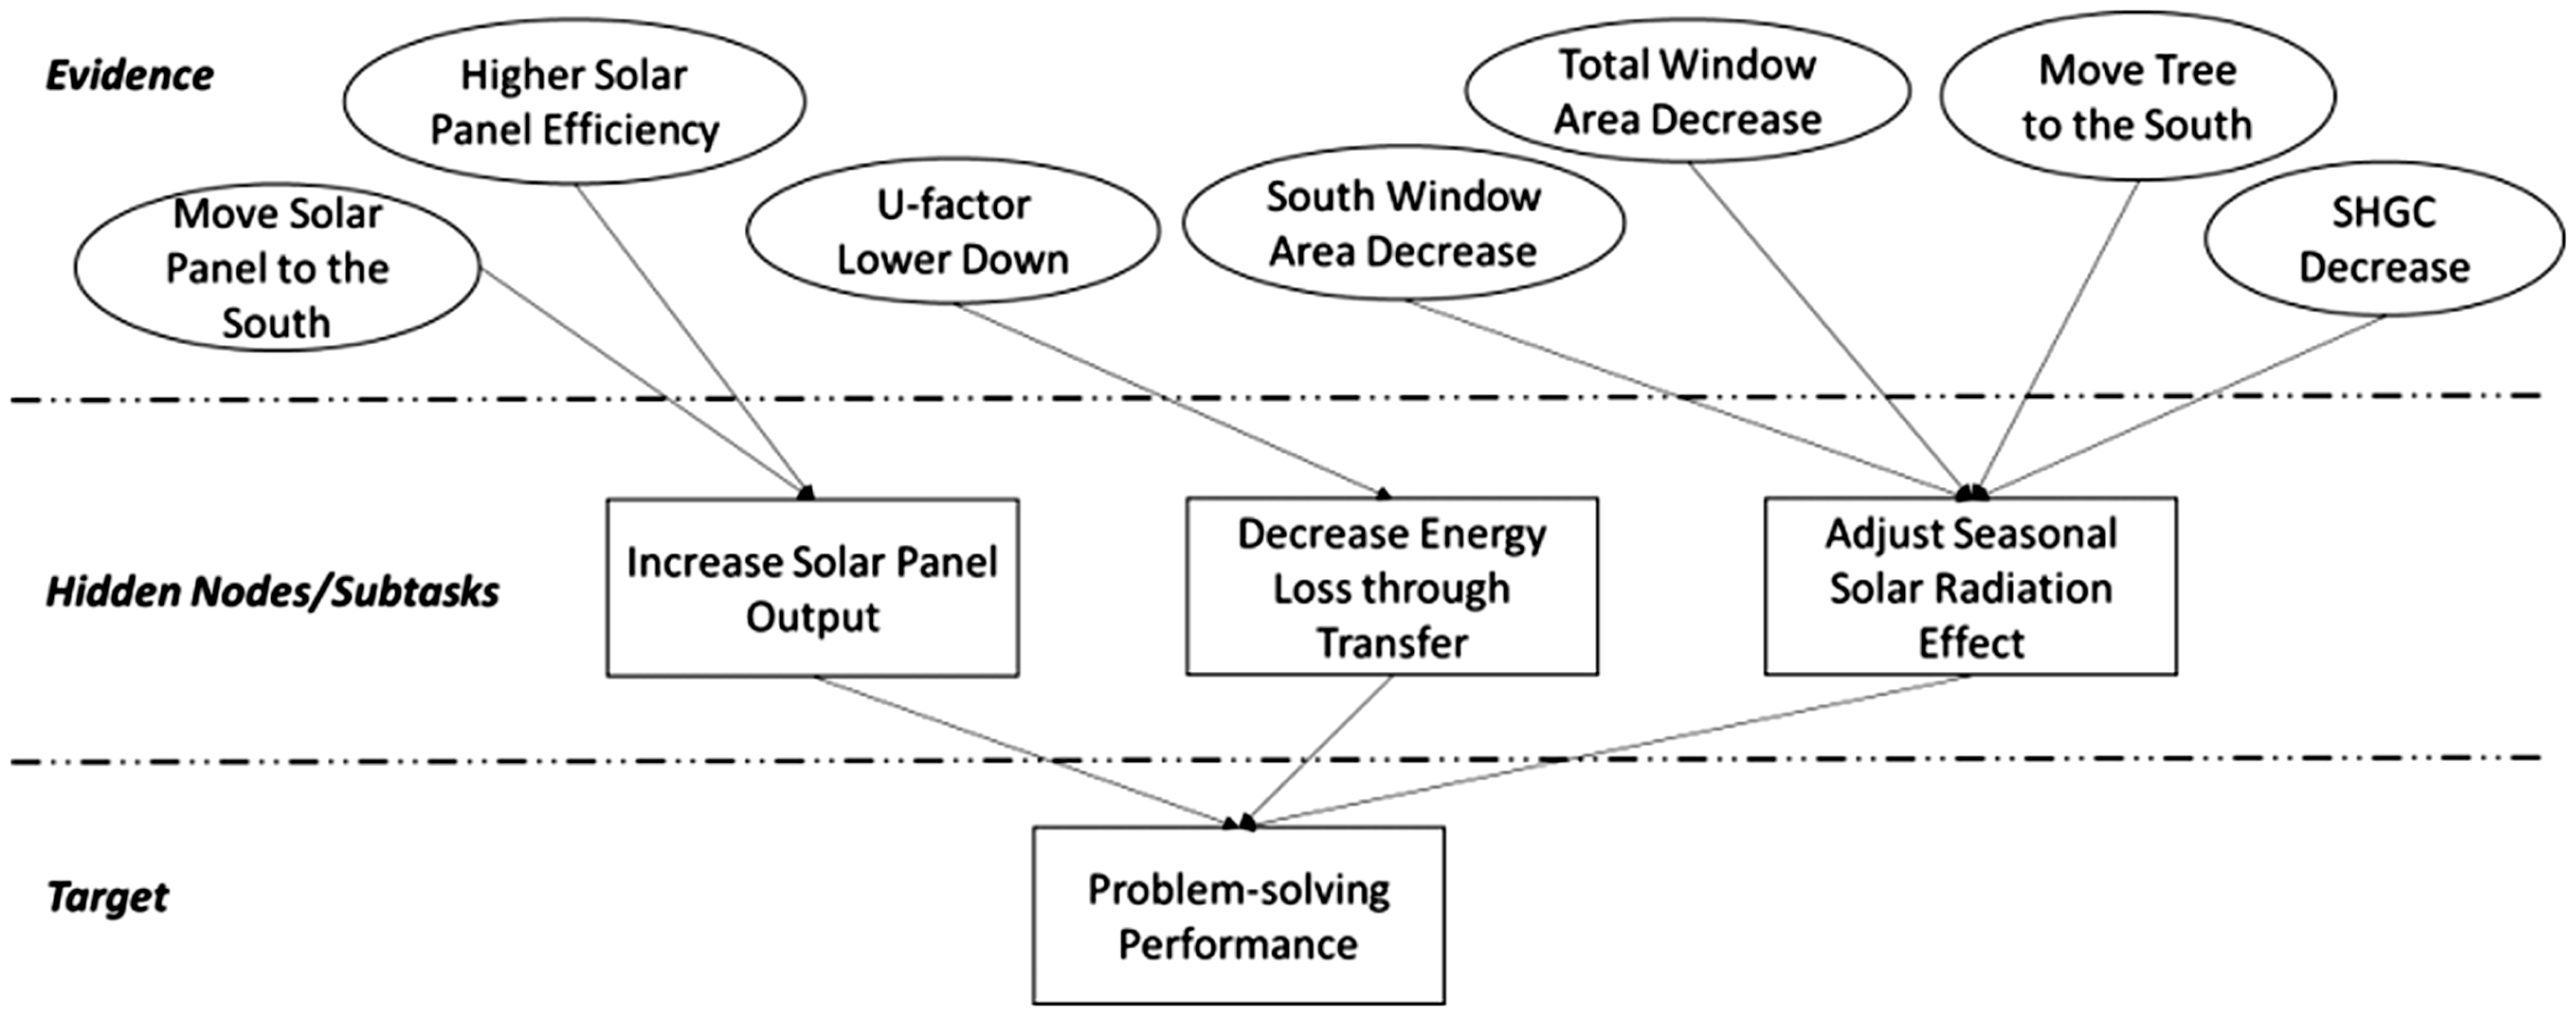
The Proposed Bayesian Network for Analyzing a Student’s Problem-Solving Performance.
Other than the advantage of using expert knowledge and efficient computation, the BNs model is a “white-box” model since it allows for reasoning about the scenario once its structure and conditional probabilities have been formulated (Xenos, 2004). In engineering design tasks given to students, any recorded observable action can be fed to the model immediately and probabilities for dependence hidden and knowledge application performance updated. Those updated probabilities could serve as indicators of confidence on how a student performs on each knowledge application subtask and could automatically inform a teacher’s customized instructional decisions.
In order to build a Bayesian network for analysis, favorable actions that contribute to a better design were elicited and their dependencies were sorted out. We leveraged the advantage of Bayesian inference and used informative priors, since the subject matter expert of our research group is well experienced with the learning process in the designing environment. Figure 3 shows a representation of the built Bayesian network for this study. Since we are interested in the influence of students’ designing process on their knowledge application, the target node is set to students’ knowledge application level based on their design process. In order to achieve a high level of rating, students must perform three subtasks during the engineering design process to demonstrate different sets of knowledge on energy efficiency. These three subtasks are modelled as nodes in the hidden nodes layer because they cannot be observed directly from the process data. Seven types of competency evidence was captured by calculation from a student’s logged actions and then fed into the nodes in the evidence layer directly throughout the design process. For example, students need to increase electricity generation from solar panels to meet the annual energy needs of the house; in order to increase solar panel output, they should either position solar panels pointing toward the south to gain more solar energy since most months of the year the sun moves to the south of Boston area in the daytime, or increase the solar panel efficiency coefficient to facilitate the conversion of light to electricity. Once students move or add solar panels on the roof or changes the efficiency level, their actions are logged and could then be calculated to update the probabilities of corresponding nodes in the network to begin reasoning.
For this study, we used collected log files of the whole session and simplified evidence calculation by assuming that if observations show that a student behavior changes in the same direction repeatedly over a certain threshold, the behavior can be considered to be observed. For example, if a student changes the position of one solar panel to south, it might be due to random movement; it is easy to drag a solar panel and move it, and the software will record this movement with related parameters such as the origin and destination in the form of point coordinates in a 3D Cartesian system. However, if a student moves five solar panel movements in a row toward the south, this indicates a specific decision to move them there to increase efficiency. The probability of the corresponding “Move Solar Panel to the South” node could then be updated to True (100% observed). The same logic applies to evidence calculation related to other nodes. Students who show certain systematic behavior in relevant knowledge applications are therefore considered competent, which in turn factors into deciding their posterior probabilities in completing each subtask and their likelihood of knowledge application level belongings. Using information gained from subsequent actions offers strength to inferring the true probability that a student is able to be successful in solving problems.
Figure 4 shows the BNs model that approximates the real scenario when a student is working on the Bad Design Improvement Project. It was created using aGrUM, a modeling software that could be used to build graphical models such as BNs. This BNs model has initial parameters that could be utilized to perform certain inference tasks. In order to compare this model to other benchmark models, evidence of valid observable actions is calculated for each student and updated to corresponding nodes in the BNs model, and the probabilities of high or low performance level belongs were then obtained.
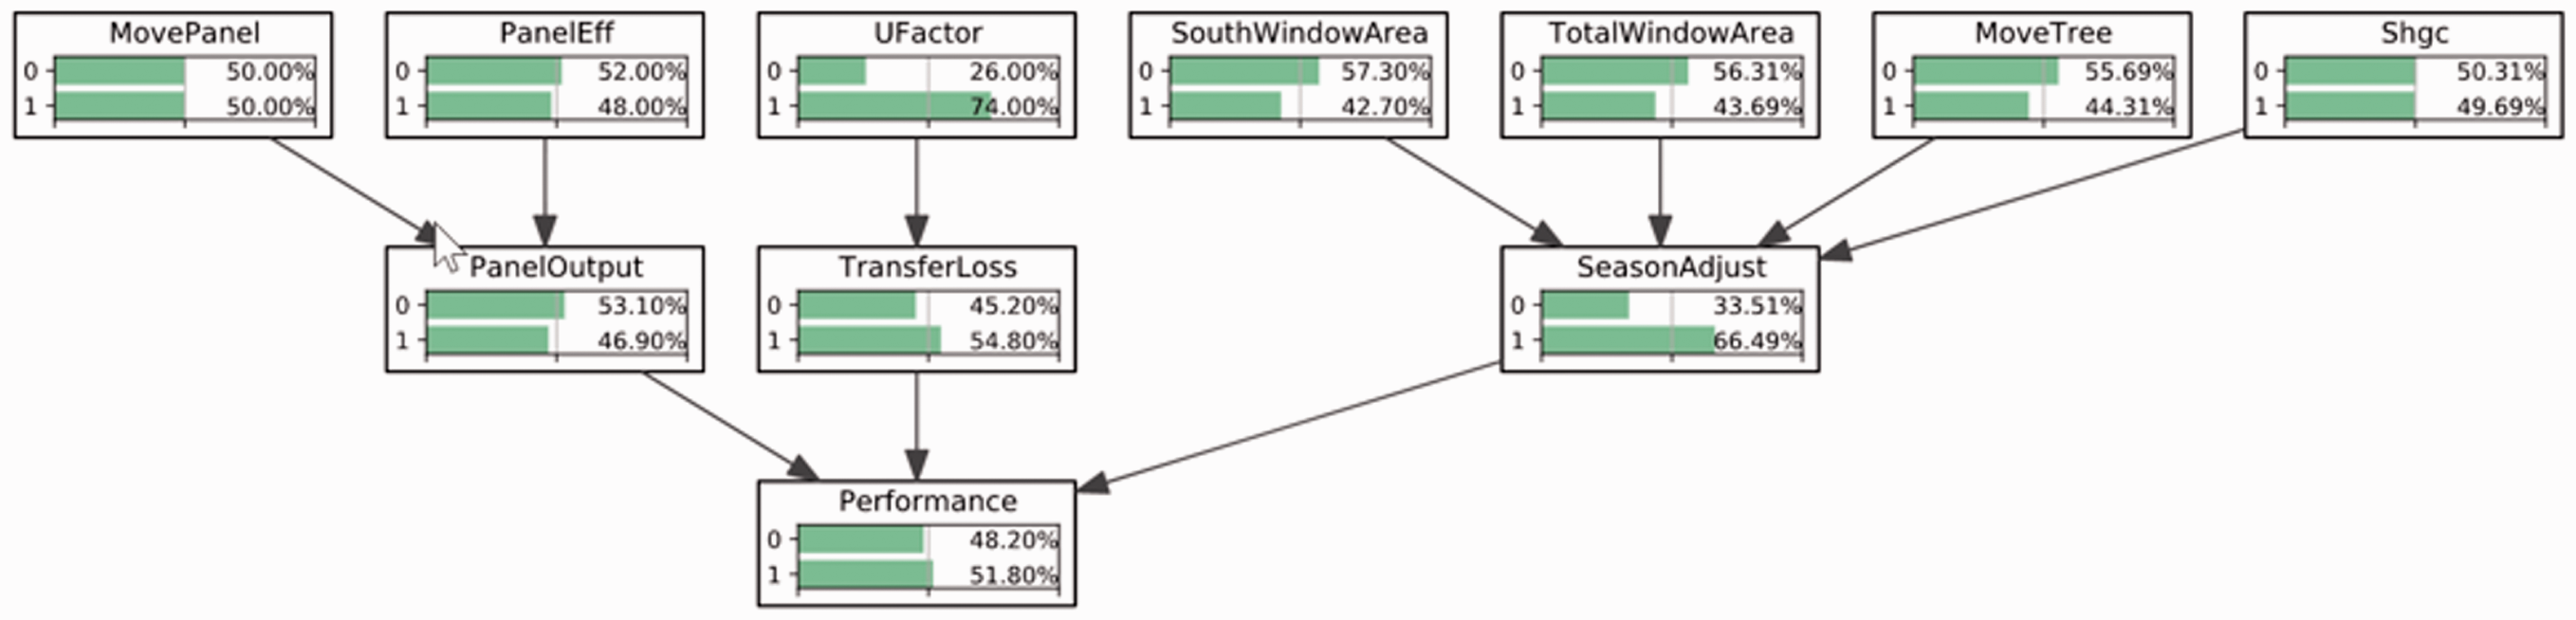
Initial Bayesian Network Model for Reasoning.
Performance Metrics
Once pieces of evidence were calculated from each student’s log files and fed into the built BNs model, the probabilities of a student belonging to a high or low performing group could be calculated. If students belonging to the high performing group with high probability of performing well on the annual energy analysis of their final design, this will validate the BNs model. In order to see how well the BNs model prediction aligns with group assignments based on annual energy gain performance, classification accuracy was calculated and reported. The same set of observed evidence and group assignments were used as the input and output to apply another three benchmark classification algorithms (DecisionTree, KNN, and SVM) and corresponding accuracy values were obtained and compared.
The accuracy index alone serves no function to differentiate misclassified students. For example, those who successfully complete the design challenge might not perform well in tests; such students were presumably different from those who excelled in tests but did poorly in the design task. To evaluate how the BNs model worked as compared with different misclassified cases, precision and recall values were calculated and analyzed.
Precision was calculated using equation (3). According to its definition, it measures whether identified cases were relevant. In our study, a high precision value for identified high performing students means a large proportion of those identified students who are actually high performers; this idea also applies to the low performing group.

Recall was calculated using equation (4). It measures how well true cases were correctly identified. In this study, a high recall value for identified high performing students means a large percentage of true high performers are correctly labelled; this principle also applies to the low performing group.

Results
Performance Comparison for RQ1
In this study, the application of BNs was used to infer students’ problem-solving level based on each of their observable actions when working on the Bad Design Improvement project. The predicted class was then compared with each student design’s annual energy performance. Based on the relative improvement of students between the tests, 51 were identified as high performers while 54 were assigned to the low performing group. Corresponding numbers of students were then sorted out based on the posterior probabilities of their performance level calculated by the BNs model.
The prediction accuracies of the BNs, DecisionTree, KNN, and SVM model are 78.1%, 67.6%, 65.7%, and 73.0%, respectively. The accuracies of the latter three benchmark classifiers were calculated after executing 10-fold cross-validation. The BNs model outperformed other models by correctly classifying students of both the high and low group based on evidence observed from their problem-solving process.
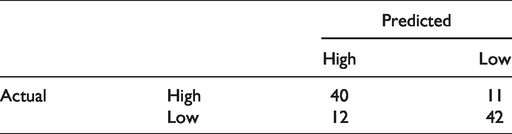
The confusion matrix which shows the detailed prediction results as compared to each student’s true label was presented in Table 2. The precision and recall of predicting high performing students are 76.9% and 78.4% respectively, while the precision and recall are 77.8% and 79.2% for predicting low performing students. This indicates that the BNs model we utilized in this study did a similar job in both predicting and identifying as many high performers as possible as in both classifying and finding existing low performers correctly.
Confusion Matrix.
Science Knowledge Application Inference and Feedback for RQ2
Gray/White-Box Models V.S. Black-box Models
The value of training a model to predict a student’s group belonging, however, lies not in its mere prediction accuracy, precision, and recall but in its ability to reveal patterns that could provide actionable insights to facilitate teaching and learning. Learning analytics approaches stress this objective by implementing learned models with certain satisfying classification accuracy in practice. Compared with “black-box” models such as SVM, KNN, etc., which lack interpretability for their decision mechanism and thus are restricted to be used with confidence, “gray-box” or “white-box” models such as BNs and DecisionTree could provide manipulative strategies in prediction. For instance, the DecisionTree method could mine and deliver possible sets of rules in the readily understandable “if-then” format. Figure 5 shows a calculated DecisionTree model with a depth of three (the length of the longest path from a leaf node to the root node is three). This model is readily implementable in the engineering design task to judge a student’s performance in integrating relevant knowledge to generate viable solutions. However, this relatively simple set of rules was calculated at the expense of classification accuracy for the testing set (50.4%).
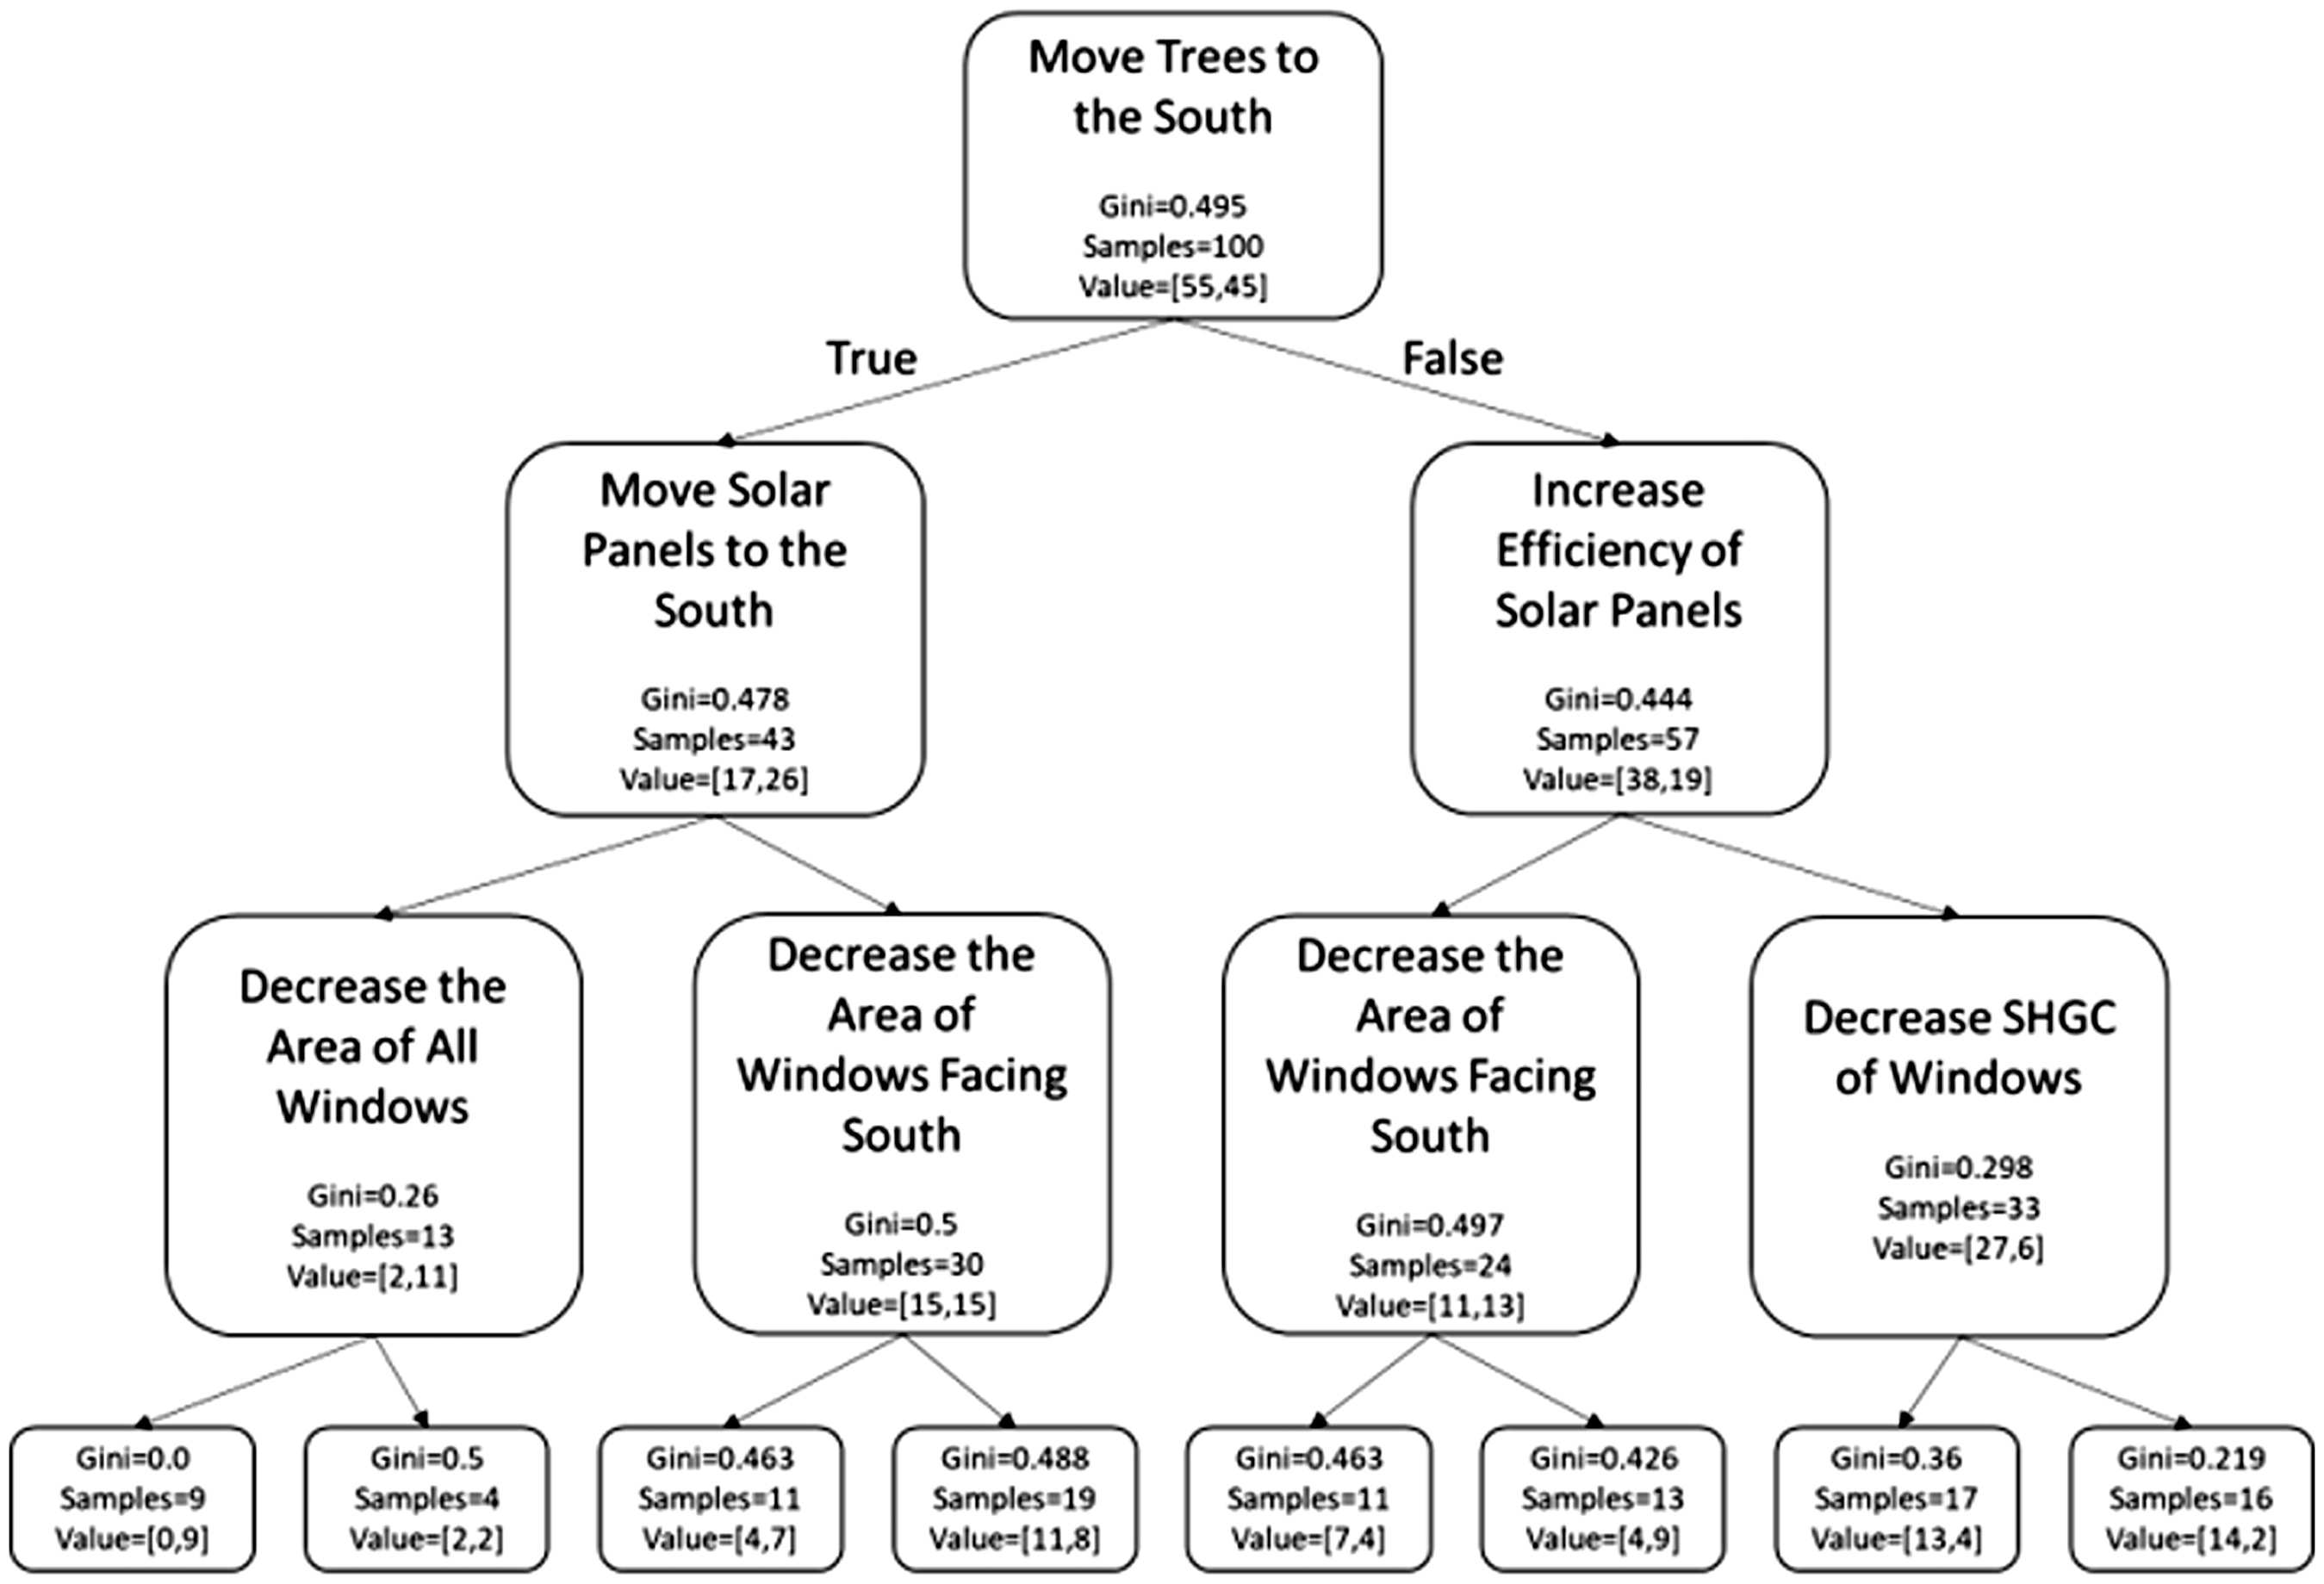
Calculated Decision Tree With a Depth of Three and Lower Prediction Accuracy.
Figure 6 shows a more complex learned DecisionTree with better prediction accuracy than the DecisionTree in Figure 5. However, the understandability of this model was seriously undermined given a too-large set of rules. Figure 6 is included to simply show the complexed structure of a better-performed DecisionTree and does not require careful reading. The outline of the graph is therefore grayed out to avoid over-interpretation.
Calculated Decision Tree With a Depth of Seven and Higher Prediction Accuracy.
Representative Examples Identified by the BNs Model
The BNs model could capture such distinctiveness in the form of posterior probabilities on each affected node based on specified topology of the network, which allows for instant interpretability and thus has the affordances for meaningful feedback. Figure 7 shows the final design of a student who was correctly classified as a low performer in the design challenge and Table 3 shows the prior and posterior probability comparison on subtasks based on evidence observed from his design process. This student achieved 8% improvement in the posterior probability of promoting output of the solar panels by increasing their efficiency. He also managed to gain more output by moving or adding some solar panels to the south-facing roof, but he left the majority of solar panels on the north-facing side, indicating a gap in applying related knowledge to optimize the position of solar panels. This student also failed to achieve better performance on the other two subtasks. Specifically, he did not reduce heat loss by decreasing the U-factor of walls, windows, the roof, etc. Although he lowered the SHGC of the windows to prevent overheating caused by solar radiation during summer, which incurs additional cost on air-conditioning, he made no more effort to either move deciduous trees to the south to gain solar radiation in winter and block it in summer or to adjust the size or number of the windows accordingly to achieve better energy performance.
The Screenshot of a Low Performing Student’s Design.
The Prior and Posterior Probability Comparison of a Low-Performing Student’s Performance on Each Subtask.
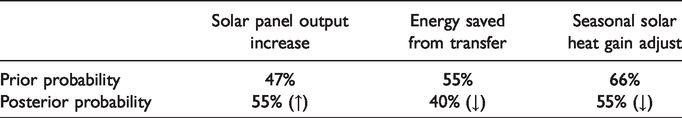
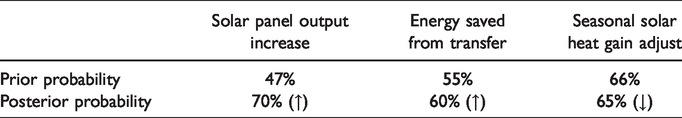
Figure 8 shows both north and south sides of a correctly predicted high performing student’s artifact. Combining with the calculated prior and posterior probabilities comparison as listed in Table 4, we could conclude that this student achieved considerable improvement from 47% to 70% in managing the solar panels to produce more electricity. He did this by laying all solar panels on the south-facing roof and increasing the efficiency of those panels to gain better output per unit. This student showed a good understanding of the insulation properties of buildings by decreasing the U-factor to prevent unnecessary heat loss during winter or air-conditioning cost during summer. However, this student seemed to perform less ideally in adjusting seasonal solar heat gain to achieve a better design. He appropriately removed three windows on the south-facing wall to decrease solar radiation through windows during summer and planted two deciduous trees in front of the remaining two south-facing windows to further prevent overheating in summer and promote heat gain in winter. But he left too many north-facing windows without lowering their size or number or managing SHGC to deal with solar radiation. However, the interplay among tree types, tree position, window area, facing, and SHGC are complex and even high achieving students could err in reasoning easily. And the BNs model could pinpoint the sources of error by reasoning from evidence gathered from a student’s design process.
The Screenshot of the South-Facing Side (Left) and the North-Facing Side (Right) of a High Performing Student’s Design.
The Prior and Posterior Probability Comparison of a High-Performing Student’s Performance on Each Subtask.
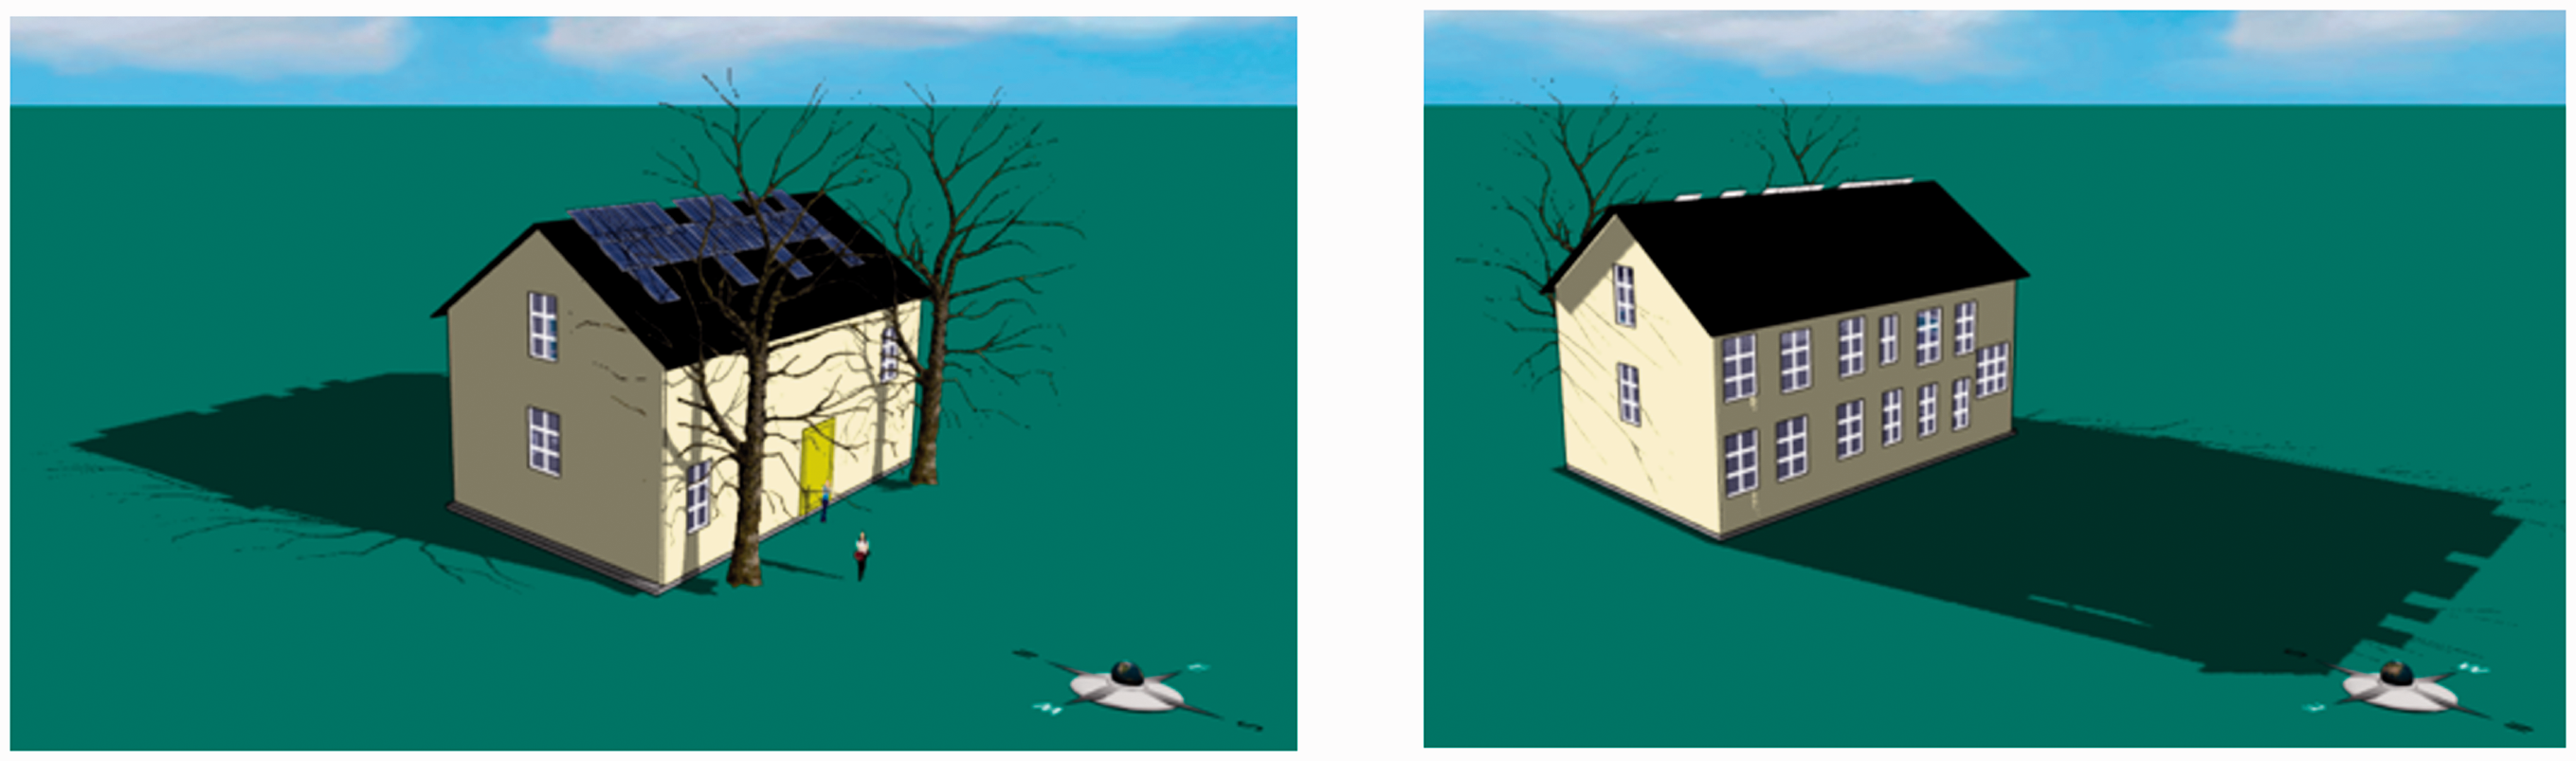
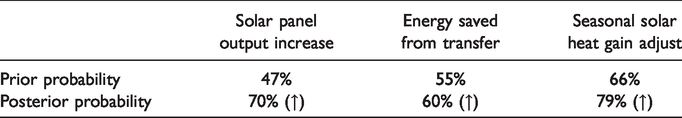
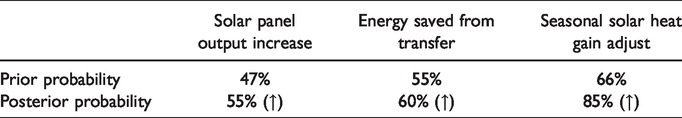
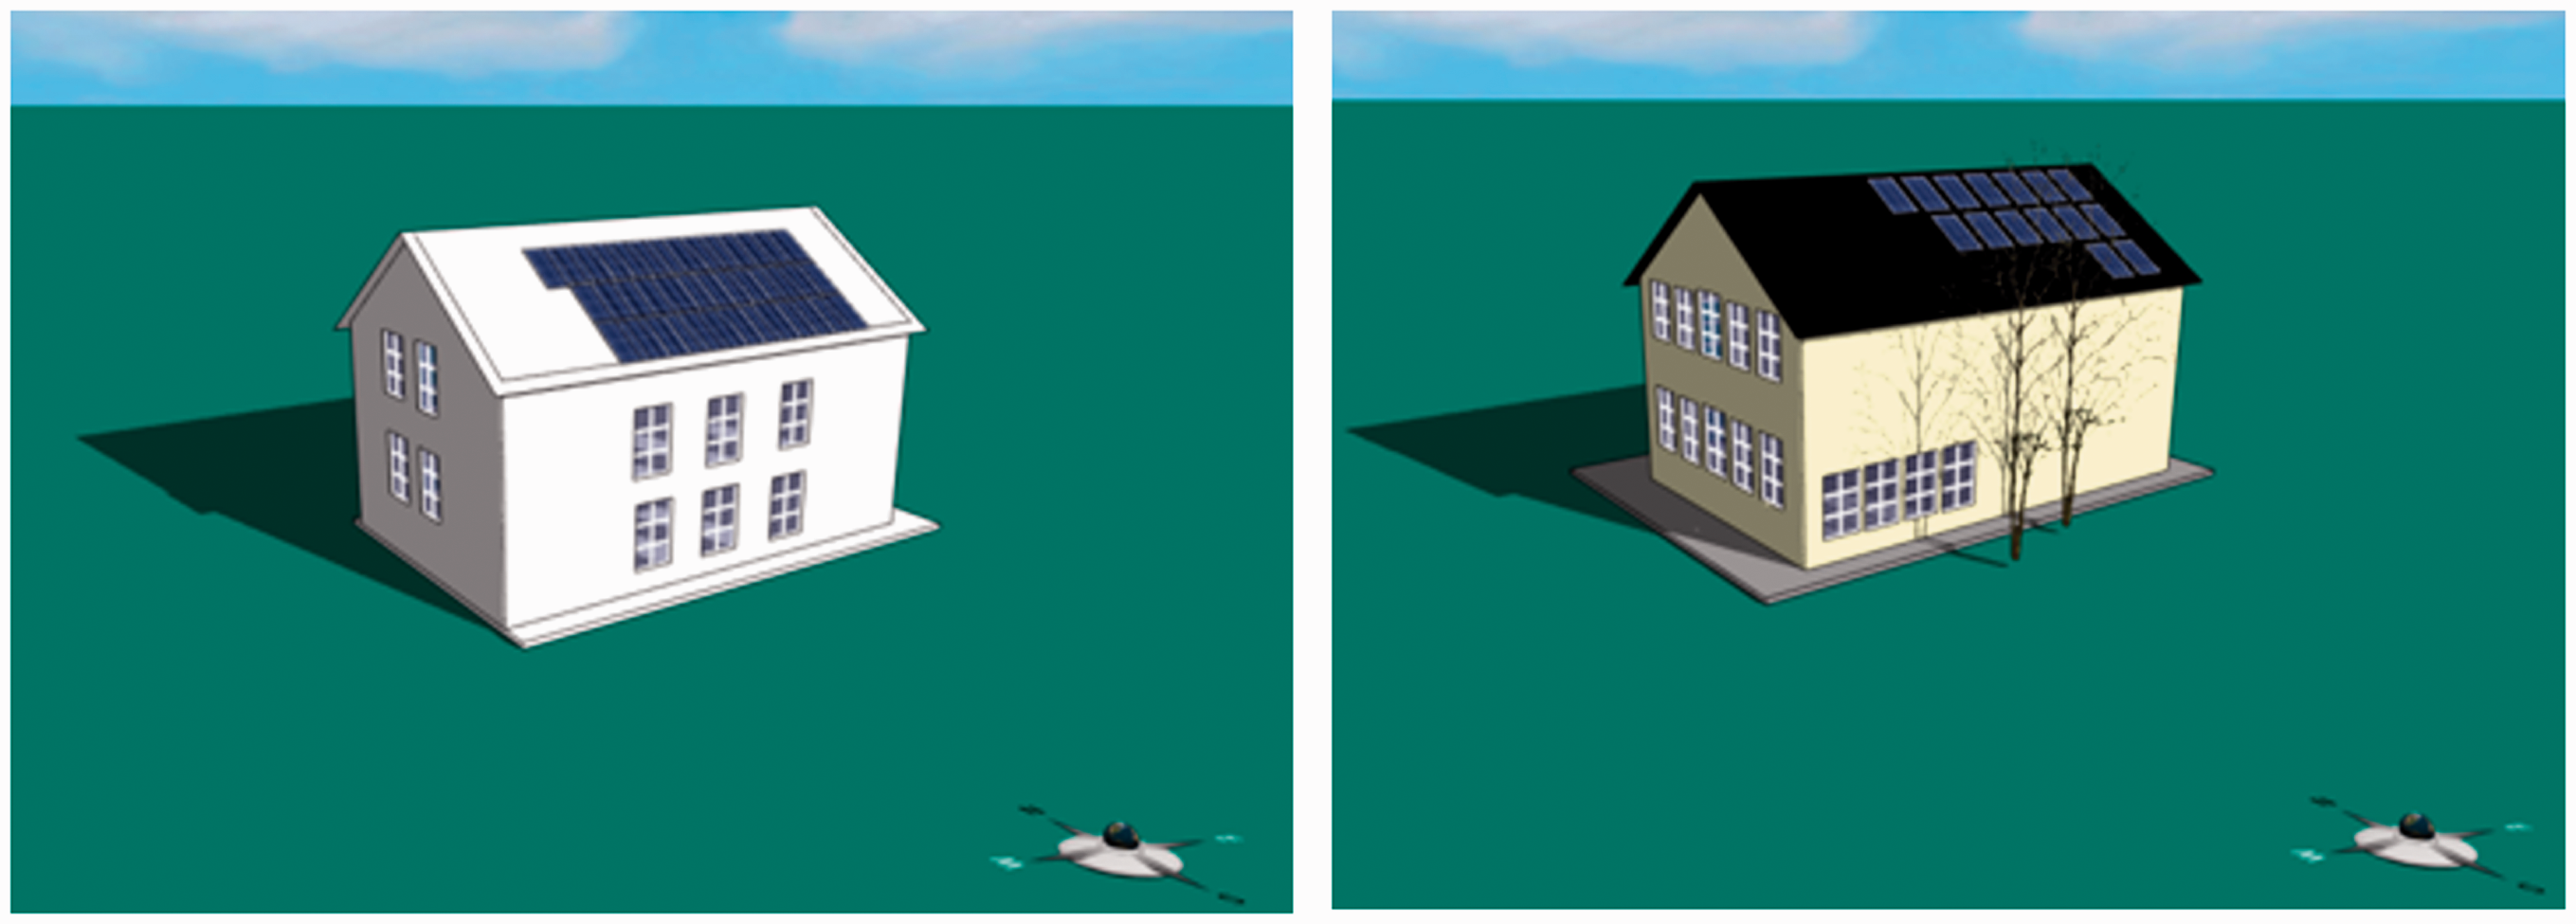
That the BNs model reasons based on different students’ observable evidence during their design process could be further illustrated by comparing different final designs. Figure 9 shows two correctly identified high performing students’ design artifacts that are visually different from each other. Table 5 shows the prior and posterior probabilities on three subtask nodes of the student who generated the design in the left side of Figure 9, while Table 6 listed those probabilities of the right side design. According to both tables, students of both designs showed good understanding of the U-factor in controlling heat transfer. However, the student of the left design put more effort in maximizing solar panels output, while the student of the right design allocated more energy in saving air-conditioning in summer and gaining solar radiation in winter. This is manifest in the screenshots of both designs. The house on the left has more solar panels on the south-facing roof, no trees surrounding it, and the student more or less kept the windows intact, with only minor changes to position and size. The design on the right has fewer solar panels on the south roof but reflects significant changes in the position and size of windows and the placement of deciduous trees in front of each window.
The Comparison of Two High Performers’ Final Design.
The Prior and Posterior Probability Comparison of the Performance of the Student on Each Subtask Whose Design Appears in Figure 9 Left.
The Prior and Posterior Probability Comparison of the Performance of the Student on Each Subtask Whose Design Appears in Figure 9 Right.
While it makes sense to provide specific feedback to identified high performers to continually make improvements or to engage additional instructional resources for potential low performing students, it is equally interesting to look at misclassified cases. In this study, the built BNs model was used to reason based on students’ design process and then predict their design’s annual energy performance. There are two kinds of misclassification: those whose products did not show good net gain on a yearly basis but who excelled in the engineering design challenge, and those whose artifacts showed high energy-efficiency but whose logged behaviors suggest they would be low performers. Figure 10 shows two students’ designs; student of the left design were predicted as low performers by the BNs model but regarded as high performers in terms of design performance, whereas student of the right design represents a false positive case. Table 7 and Table 8 listed the posterior probabilities on three subtask nodes of their designs respectively. The student who produced the left design made good annual energy gain. As shown in Table 7, he in fact arranged all solar panels on the south-facing roof and increased their efficiency to achieve maximum output and in limiting heat loss through transfer. However, he did not meet the threshold posterior probability to be classified as a high performing student since he removed all trees surrounding the house while leaving too many windows exposed to solar radiation that would increase air-conditioning cost in summer. Although this student fell short of meeting the high threshold set to find high performers, he did show competency in applying some knowledge to solve the problem. The student who completed the right design shown in Figure 10 appropriately positioned the solar panels toward the sun trajectory and planted deciduous trees in front of windows that receive solar radiation. He also changed solar panel efficiency to gain more energy output and decrease the U-factor to achieve desirable insulation that could further cut down the air-conditioner and heater costs, which caused the BNs model to classify him as a high performer. However, too many windows arranged on the west side of the building incur additional cost in heating since additional heat gain through incoming sunshine in the winter afternoon could not make up the overall heat loss.
The Designs of Two Misidentified Cases.
The Prior and Posterior Probability Comparison of a Student’s (Figure 10 Left) Performance on Each Subtask.

The Prior and Posterior Probability Comparison of a Student’s (Figure 10 Right) Performance on Each Subtask.
Discussion
Engineering design projects can provide a valuable pedagogical tool in K-12 settings (Chabalengula & Mumba, 2017; National Research Council, 2012). However, the open-ended and ill-structured nature of such tasks often contribute to an unduly complex situation with pervasive uncertainties that render it difficult to build student models to understand their learning process. Conventional methods such as analyzing based on verbal protocols, video clips, and artifacts could help in assessment (Schwarz et al., 2009), but such approaches often involve extensive amounts of time and effort and are not suited for early intervention.
The introduction of certain engineering design software with logging features as well as LA and EDM techniques could help alleviate this adverse condition by keeping track of user actions and performing analyses to predict performance in real time. Among those techniques, gray/white-box models such as DecisionTree and the BNs model report not only prediction accuracy measures but means to understand the classification process under the hood and therefore possess advantages for application in educational settings. The BNs model, in particular, could represent and update uncertainties instantly in terms of probabilities of relevant variables (Asif et al., 2017; Lacave et al., 2018; Liu, 2006).
We extracted observable evidence that factors into a student’s performance in an engineering design task as logged by the CAD software and fed such evidence into a constructed BNs network, following relevant literature (de Klerk et al., 2015; Millán et al.,, 2010; Neapolitan, 2003; Pearl, 1988). Through its inferencing algorithm, the BNs model output each student’s performance prediction in the form of posterior probabilities. The comparison of these predictions to student artifacts’ annual energy performance showed better accuracy value than other benchmark classification algorithms. The BNs model also showed competence in precisely labelling identified cases correctly and satisfyingly recalling many students with corresponding labels.
The above mentioned properties of the BNs model enable it not only to predict a student’s problem-solving performance level but to provide detailed information on why he succeeds or fails on certain subtasks in time. This is particularly useful since in a complex engineering design task with an unlimited solution space, a mere label of high or low performing group might sometimes be not enough to capture the intricacy of what a student did to solve the problem. Students take different paths to meet the design requirements and specific inferences based on each student’s data stream go a long way in providing customized, timely feedback. The results presented in this study showed how the constructed BNs model could automatically distinguish a student’s knowledge application level on each subtask and compare it to other students.
The ability of the BNs model to handle uncertainties and pinpoint the sources of error by reasoning from observed evidence generated by a student during the problem-solving process could help both formative and summative assessment. This was illustrated by the misclassified cases in this study. For both false positive and false negative cases, the BNs model could provide information to help them to improve based on identified weaknesses and justify the classification results.
This study has some limitations. First, the observable evidence nodes of the built BNs model only considered a true or false input. That is, once the occurrences of an observed action defined by its corresponding node exceed a given threshold, the probability of observing such an action is set directly to 100%. However, such probability could be modeled to be any value between 0 and 1, depending on the confidence level of observing the action. And this is particularly useful when implementing dynamic Bayesian network models that consider the temporal dynamics among certain variables within the network. Second, this study did not consider pretest and posttest scores as a representation of a student’s level of knowledge application, while it might be interesting to see how well such test scores correlate with problem-solving process. However, since various sets of knowledge were needed to solve different items in the test, there exists a mismatch to use a composite score to represent an uneven distribution of knowledge understanding among students. A Bayesian knowledge tracing model might be more accurate to correlate a student’s observed evidence of mastery to specific items that test the same knowledge.
Conclusion
This study aimed to explore possible solutions to handle ubiquitous uncertainties during an engineering design process in order to automatically customize feedback to students. We extracted each student’s design process data logged by an engineering design software, calculated evidence relevant to their problem-solving performance level, and then fed these evidence to our built BNs model to obtain posterior probabilities of students’ performance on related tasks. Results showed that the BNs model performed better than other three popular classification algorithms (DecisionTree, KNN, and SVM) in predicting a student’s knowledge application level by accuracy. This study demonstrated that BNs could be used in engineering design tasks to pinpoint a student’s strengths and weaknesses in knowledge application and could be implemented in real time to provide customized feedback.
There is, however, much room left for future exploration. First, multiple time slices could be considered separately to apply the BNs model to identify milestones of a student’s design process. Second, a probability value between zero and one could represent more accurately observable evidence based on its credibility calculated from actions. Third, a dynamic Bayesian network model could be considered to account for dependencies of nodes between time segments. The above means, when combined and tuned, could better represent the relationships among important variables within the design scenario and obtain more fruitful implications to a student’s learning.
Footnotes
Acknowledgments
The authors are indebted to Joyce Massicotte, Elena Sereiviene, Jie Chao, Xudong Huang, and Corey Schimpf for assistance and suggestions.
Declaration of Conflicting Interests
The authors declared no potential conflicts of interest with respect to the research, authorship, and/or publication of this article.
Funding
The authors disclosed receipt of the following financial support for the research, authorship, and/or publication of this article: This work is supported by the National Science Foundation (NSF) of the United States under grant numbers 1512868, 1348530 and 1503196. Any opinions, findings, and conclusions or recommendations expressed in this paper, however, are those of the authors and do not necessarily reflect the views of the NSF.
Statements on Open Data and Ethics
The data will be available by individual application directly to the author. The research was approved by the Ethics Committee of the (omitted for anonymous review).