
Abstract
This research examines whether transit-oriented development (TOD) contributes to housing value resilience in Atlanta, Georgia. We developed two spatial hedonic models using property sale records to examine whether being located in TOD areas contributes to the resilience of housing prices during and after the Great Recession, compared to being located in transit-adjacent development areas. Our results suggest that there is a growing demand for TOD properties in recent years, which contributes to maintaining and faster regaining property values in TOD areas. Our results support future investment in TOD areas and also suggest challenges to incorporating affordable housing in TOD designs.
Introduction
Transit-oriented development (TOD) is typically defined as a medium- to high-density, mixed-use, planned development area within walking distance of high-quality transit facilities (Cervero 2004). Many US cities are promoting TOD near rail stations to encourage transit use and increase housing opportunities around stations (Lund 2006). Hedonic price models have been used to understand people’s willingness to pay (i.e., demand) for TOD properties. Many cross-sectional studies found that TOD is positively associated with home values. This finding supports continued municipal and regional investment in TODs as a method of achieving sustainable urban growth and promoting healthy housing markets (Kay, Noland, and DiPetrillo 2014; Seo, Golub, and Kuby 2014; Mathur and Ferrell 2013; Duncan 2011).
Other studies suggest that TODs have zero or negative impacts on home values due to negative externalities associated with adjacency to transit stations (Atkinson-Palombo 2010; Kahn 2007; Bowes and Ihlanfeldt 2001). However, more recent survey results and forecasts show that there is a resurgence of consumer demand for TOD (Belden Russonello Strategists 2013; Nelson 2012). A limited number of studies have examined the effect of TOD on the resilience of home values through an economic recession and/or housing market downturn. Understanding changes in people’s willingness to pay for TOD versus transit-adjacent development (TAD; i.e., areas adjacent to transit stations but without supportive built environment features) before and after the recession can help planners identify policy implications for local TOD investments in the future.
To study changes in demand for TOD properties, longitudinal property transaction data are required. The longitudinal tax appraisal data can be problematic because the appraisal values are not up to date and do not reflect people’s willingness to pay. In some circumstances, the appraisal value and market value may differ by thousands or even tens of thousands of dollars, depending on the condition of the property. Most hedonic models are estimated using real transaction records, which are rarely available in publicly accessible tax assessor data (Li et al. 2015; Kay, Noland, and DiPetrillo 2014). In the United States, disaggregated cross-sectional transaction data are difficult to obtain; however, new open data sources with geolocation and time stamps such as Zillow® allow researchers to use real transaction data and specific property details to create and calibrate hedonic price models on a larger geographical scale (French, Barchers, and Zhang 2017). This article uses longitudinal property-level transaction records from Zillow® to examine the impact of TOD on the resilience of residential property values from 2006 to 2016 in Atlanta, Georgia. The research distinguishes between TOD properties and TAD properties and demonstrates how consumer willingness to pay for TOD properties is capitalized as housing price resilience through an economic downturn.
Theoretical Background and Research Hypothesis
TODs versus TADs
The literature suggests that TODs can be characterized by three primary built environment features: (1) being adjacent to a transit stop, (2) providing pedestrian access to the transit station, and (3) having supportive land use (Cervero, Ferrell, and Murphy 2002; Dittmar and Ohland 2012; Holmes and van Hemert 2008). These features can maximize transit ridership and leverage access to transit as one of the selling points of housing units in TOD. TODs generally require substantial investment, and there has been a debate about the extent to which they change travel behavior of residents, lead to higher home values, and guarantee returns on investment for communities (Cervero 2004).
TAD differs from TOD. TAD areas lack the land use characteristics that enable easy access to transit stops (Renne 2009). Those properties that are characterized as transit adjacent have only one of the three aspects needed to be considered TOD: they are adjacent to a transit stop. Generally, in these areas, suburban land use prevails, and there are limited cycling or pedestrian facilities (Cervero 2004; Renne 2009). This study demonstrates how the combination of characteristics required for a true TOD contributes to home price resilience when compared to the lack of features in TADs.
TOD and Home Values
Previously developed hedonic models demonstrate that homebuyers are willing to pay for homes in TODs (Handy et al. 2008; Belden, Russonello, and Stewart 2003). Earlier research examined how an individual feature of TOD, such as land use mix or easy access to transit, contributed to higher housing prices (Armstrong and Rodriguez 2006; Song and Knaap 2003; Duncan 2011). More recent work illustrates the importance of combining multiple features to make TODs effective and more desirable; some studies suggest that proximity to transit stations, enhanced pedestrian facilities, and urban design are required to generate higher-priced housing units (Bartholomew and Ewing 2011). Walkability, high density, mixed-use development, and access to high-quality transit are indispensable in making TODs effective and making the housing units in TOD areas attractive for homebuyers (Cervero 2004; Dittmar, Belzer, and Autler 2004; Duncan 2011).
However, some hedonic models indicate that the negative externalities of transit stations may offset or outweigh the benefits of TODs. Bowes and Ihlanfeldt (2001) found that adjacency to transit stations is considered undesirable in the city of Atlanta due to noise and perceived safety issues. Properties located within a quarter-mile buffer of transit stations are valued at 19 percent less than similar properties located three miles away from stations. The same phenomenon has been observed in San Jose, California (Landis, Guhathakurta, and Zhang 1994); Phoenix, Arizona (Atkinson-Palombo 2010); and Minneapolis–St. Paul, Minnesota (Goetz et al. 2010). In sum, the existing literature suggests there is demand for homes in TODs, but this demand can sometimes be offset by the “disamenity” of proximity to transit stations.
TOD and Housing Value Resilience
Urban resilience is defined as the ability of human settlements to withstand and to recover quickly from hazards (UN-Habitat n.d.). Resilience refers to reducing risks and damage from shocks or disasters and the ability to quickly bounce back to a stable state. We define property value resilience as a property’s ability to maintain and recover its value during and after an economic recession. More resilient properties should experience less value depreciation as a result of a recession and return to their original property values faster in the postrecession period. This definition of home price resilience is used by other scholars and is sometimes referred to as “housing recovery” (Raymond, Wang, and Immergluck 2016). Housing value recovery is affected by the before- and after-recession home values because the original home values influence the change rate and the trajectory of home values after the recession. Understanding how values of homes change through economic downturns allows researchers to identify what social or built environment characteristics contribute to home price resilience.
In the limited number of studies that examined which factors might affect housing price resilience during a recession, results were inconclusive. Concas (2013) examined whether properties located near limited-access roadways were more resilient during and after exogenous market downturns. In this case, highway network improvements in Tampa and Miami, Florida, had a positive effect on housing value resilience in the aftermath of the Great Recession. Raymond, Wang, and Immergluck (2016) used zip code–level home value data from 2001 to 2014 to measure the predictive value of demographic characteristics on recovery rates after the recession. They suggested that social characteristics (e.g., race) have a substantial impact on neighborhood recovery. Dong (2015) used repeated sale records to examine whether new urbanist development patterns contributed to more resilient housing values in Portland, Oregon, and found that walkability and density both had significant and positive effects on housing value resilience. These results reflect consumer preference for properties located in new urbanist neighborhoods, even after the recession, which might indicate a preference shift for certain properties. Such a shift requires further examination.
Research Hypothesis
It remains unclear whether the recent shift in housing demand for more walkable and mixed-use neighborhoods helps offset the perceived negative externality of transit stations. This research contributes to our understanding of this phenomenon by examining how being located in a TOD area (rather than a TAD area) plays a role in housing value resilience. This research tests the following hypothesis: TODs, when compared to TADs, contribute more to maintaining housing prices during the recession and facilitating housing price recovery afterwards.
The hypothesis can also be interpreted in the following way: When compared to car-oriented built environments, well-designed transit and pedestrian accommodations near transit stations contribute more to maintaining and recovering housing prices through the recession.
Research Design
Study Area
This research has been conducted using data from the city of Atlanta, Georgia. Atlanta is located in the southeastern region of the United States. Public transportation in the city is operated by the Metropolitan Atlanta Rapid Transit Authority (MARTA). MARTA’s TOD projects began in the 1980s and include Arts Center and Lenox Mall stations. More recent improvements began in 2000; there is one active TOD initiative in the city at the Edgewood/Candler Park station. There has been little change in the built environment surrounding MARTA stations in the city during the past decade.
The literature characterizes TODs using three built environment features: (1) being adjacent to a transit stop, (2) providing pedestrian access to the transit station, and (3) having supportive land uses. We define TOD areas using three corresponding metrics: distance to a rail station, walkability, and land use mix. Distance to a rail station is measured by network distance from every property in the data pool to its nearest MARTA station.
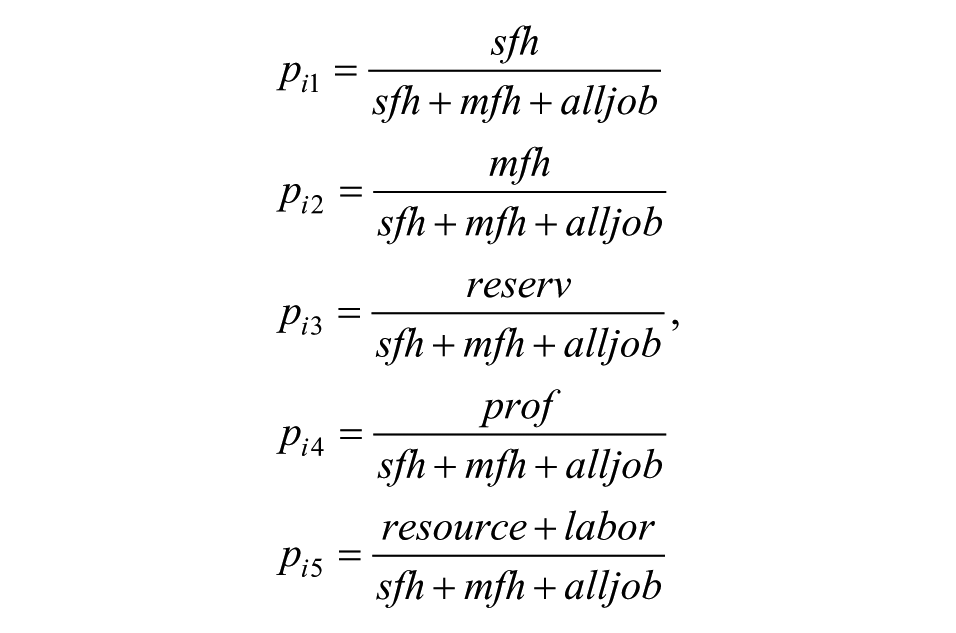
Land use mix is measured using an entropy index in this study. Using data from the 2011 Longitudinal Employer-Household Dynamic data set, Traffic Analysis Zone–level land use entropy indexes were developed to capture land use diversification, using equation 1. The higher the index, the more balanced the land use is in the given study unit. The calculated entropy index ranges from 0.42 to 0.93, as shown in Figure 1.a.
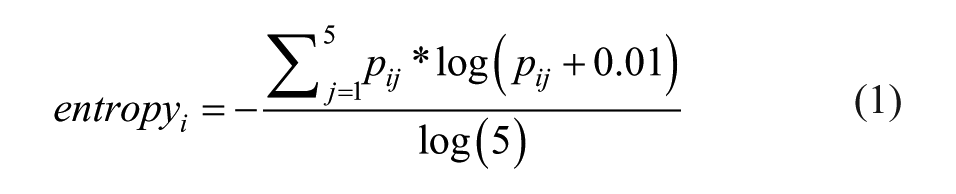
where
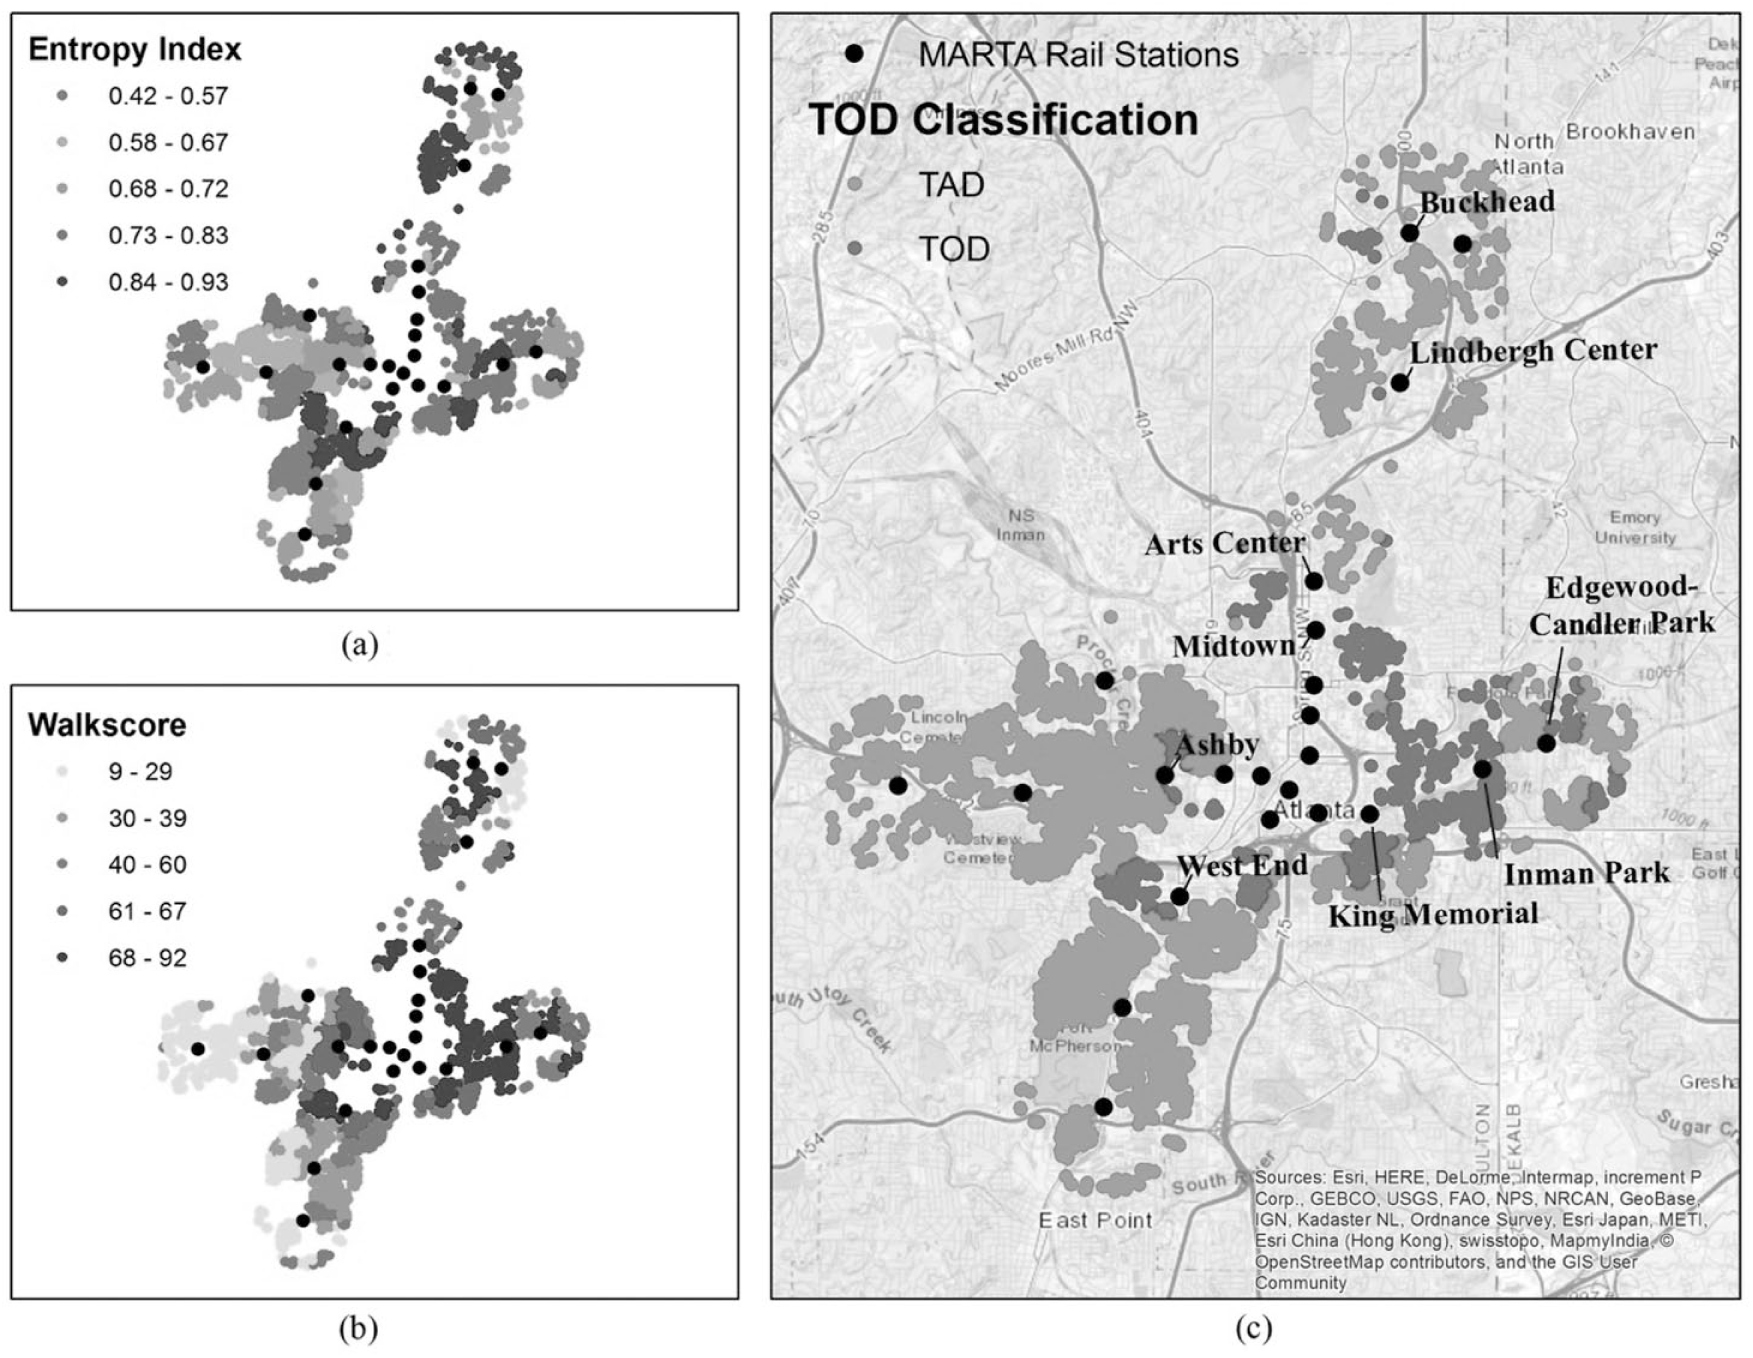
(a) Entropy index, (b) walkscore, (c) transit-oriented development classification.
Walkability is defined by each property’s Walkscore, acquired using Walkscore’s Application Programming Interface. Walkscore is a patented index that describes the walking environment of specified locations. Based on the company’s methodology documentation, the proposed score captures the accessibility of various retail and recreational destinations as well as the general density of the neighborhood (Walk Score 2017). The data obtained via Walkscore’s Application Programming Interface service is always the most updated. The Walkscore data used in this study were collected in 2015, and longitudinal Walkscore data are not available for our study area. However, the city of Atlanta has not built or invested in TOD projects since 2006, so the 2015 data should be an appropriate measure of walkability during the study period. The collected Walkscore values range from 9 to 92, indicating a significant diversification in the built environment, as shown in Figure 1.b.
Given the three calculated metrics, a TOD area in this research is defined as any area in the city of Atlanta that
1) is located within a mile of a MARTA station (adjacent to transit),
2) has a Walkscore equal to or greater than 70 (good walking environment defined by Walkscore), and
3) has a land use entropy index equal to or greater than 0.65 (good land use mix according to the distribution).
Though 0.25- or 0.50-mile buffers are more commonly used to define TODs, some studies have demonstrated that the range of radii play a small role in predicting transit ridership (Guerra, Cervero, and Tischler 2012; Canepa 2007). We conducted sensitivity tests to examine whether 0.50- or 1.00-mile TOD buffers lead to different model results. The results are analyzed in the Sensitivity Tests section.
Figures 1.a and 1.b display the spatial distribution of land use entropy indexes and Walkscores in the study area, and Figure 1.c displays all the identified TOD properties as blue dots, based on the three criteria. The results show properties near Buckhead, Arts Center, Midtown, King Memorial, Inman Park, Edgewood-Candler Park, West End, Ashby, and Lindbergh stations are classified as TOD properties. The majority of homes near Lindbergh are condos and apartments, which were not included this study and are not shown on the map. We defined TAD properties as those that were also within one mile of a transit station but lacked the appropriate land use entropy values and facilities for walking and biking. TADs are shown as red dots in Figure 1.c.
Study Time Periods and Unit of Analysis
The values of more resilient properties should experience less depreciation as a result of the recession and recover quicker in the postrecession period. We collected single-family property sale records listed on Zillow for properties in TOD and TAD areas from peak (June 2006–June 2007), bottom (June 2011–June 2013), and recovery (May 2014–May 2016) time periods. Questionable sale records with unrealistic housing features, including extremely high or low prices per square foot, were excluded from our data. Records with missing values for any of the independent variables were also removed.
The property value trend, as shown in Figure 2, suggests that home values in TODs and TADs varied through the recession. During the peak time of 2006 to 2007, the property values in TODs and TADs were similar. The value, however, declined significantly after the recession in TADs, while it leveled off (even increased slightly) in the TODs. TAD prices recovered to the before-recession level in 2016, while TOD prices doubled the average before-recession price. The final data set contains 5,065 properties with 9,610 transaction records across the three time periods.
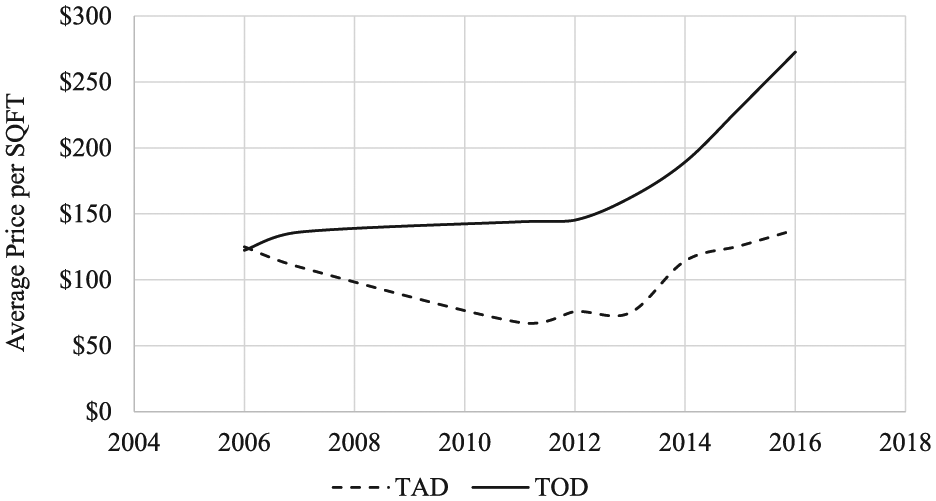
Average property price per square foot in transit-oriented development and transit-adjacent development.
The transaction record is the unit of analysis; that is, each row in the data set represents one property transaction, and a property may not be found in each time period. Some studies have used repeated sales of the same properties to determine factors that correlate with housing value changes (Dong 2015). This approach is not used for two reasons: (1) the repeated sales records tend to be biased toward properties that are more frequently transacted (i.e., only properties that have been sold in all the three time periods would be included in the models), and (2) there are only 324 properties transacted in all time periods, leading to a very small sample size.
Model Design
We developed two hedonic price models to examine the effect of TOD on housing price resilience through the recession. Model 1 incorporates the sales records in either the peak or the bottom time period to examine the effect of TOD on maintaining housing prices during an economic downturn. Model 2 includes the sale records in either the peak or the recovery period to identify whether TOD affects properties’ ability to regain value after a recession. Two models are developed because one simple cross-sectional hedonic model cannot reveal the impact of TOD on property values across the three time periods. The two proposed models have similar structures, as shown in equation 2.

where
The three dummy variables, the TOD dummy, the time period dummy, and the interaction dummy, are the three independent variables of interest. Interpreting the estimated coefficients of the three dummy variables together allows us to draw conclusions about TOD’s effect on home value resilience.
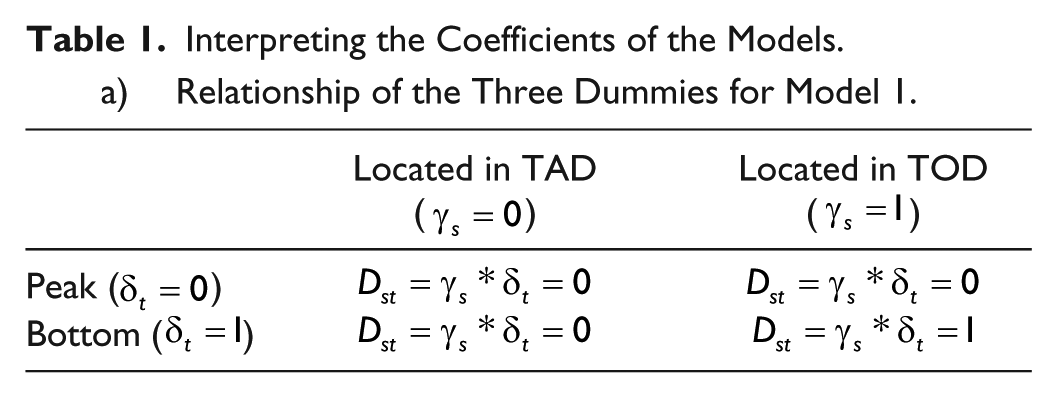
The relationship of the three dummy variables in model 1 is illustrated in Table 1. Interpreting the estimated coefficients corresponding to the three dummies requires careful consideration, as the interpretation differs from the traditional way of interpreting coefficients. Table 1.a shows the four possible combinations of the three dummy variables: the TOD dummy
Interpreting the Coefficients of the Models.
a) Relationship of the Three Dummies for Model 1.
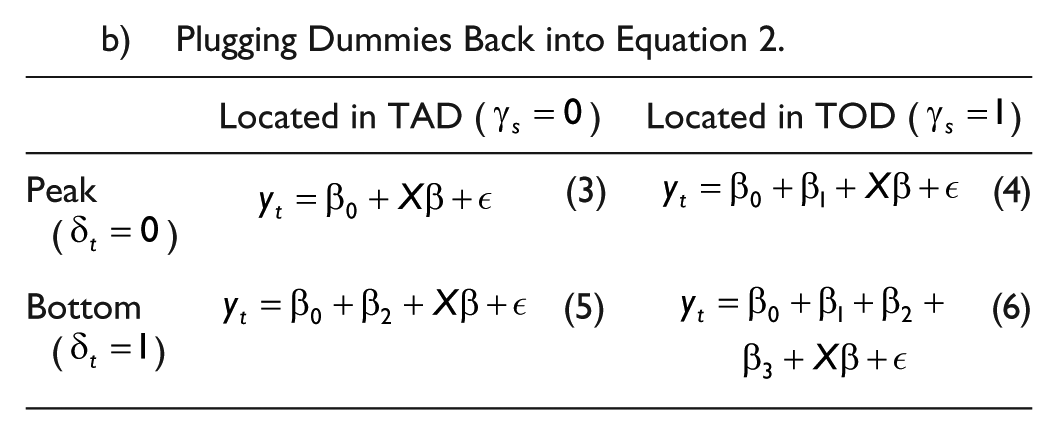
b) Plugging Dummies Back into Equation 2.
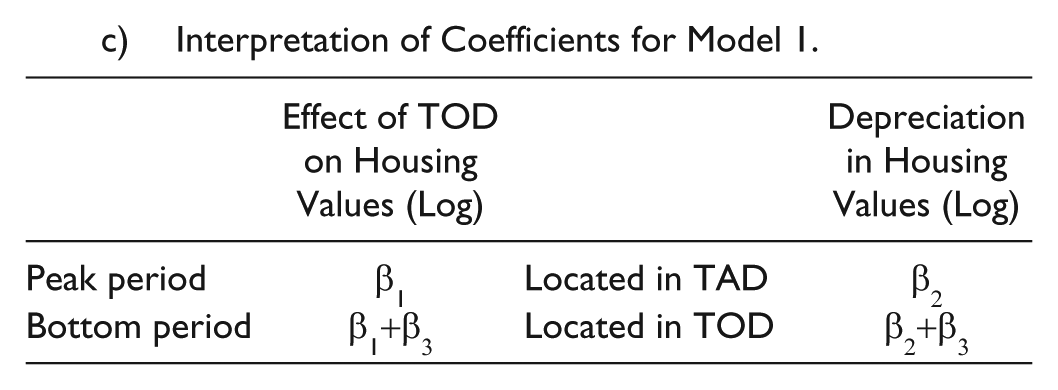
c) Interpretation of Coefficients for Model 1.
d) Interpretation of Coefficients for Model Two.
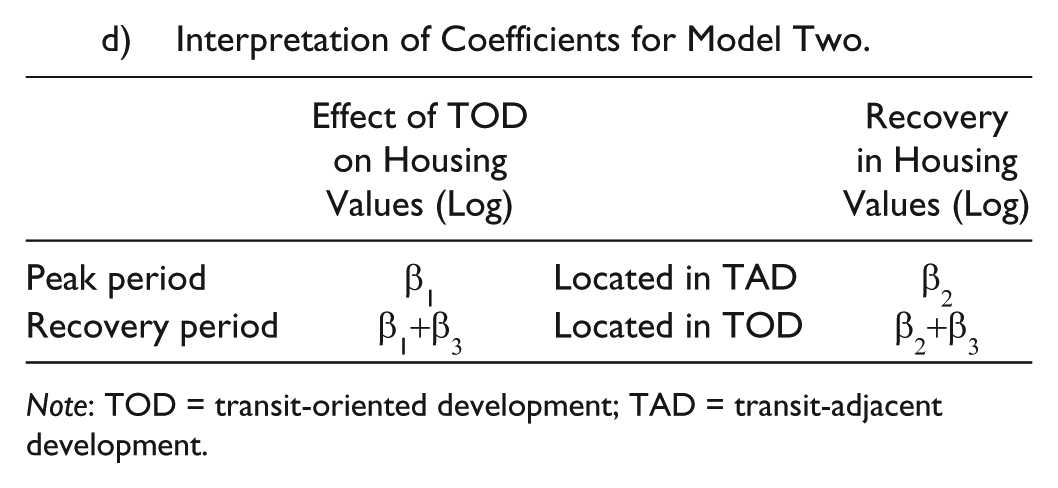
Note: TOD = transit-oriented development; TAD = transit-adjacent development.
The depreciation of housing values in TAD areas can be estimated by comparing equations from the TAD column in Table 1.b. By subtracting equation 5 from equation 3 in Table 1.b,
The distribution of housing prices often involves significant spatial autocorrelation that impairs the efficiency and validity of simple linear regression and requires spatial econometric techniques to develop valid hedonic price models (Basu and Thibodeau 1998; Cohen and Coughlin 2008; Raymond, Wang, and Immergluck 2016). Ordinary least square models, with the configuration shown in equation 2, were developed, and the Moran’s I statistics of the residuals were significant, indicating that spatial autocorrelation exists in the property value data for the Atlanta area. To address the issue of spatial autocorrelation, we used a spatial lag model that incorporates a spatially lagged dependent variable, indicating the value of an observed dependent variable is affected by its neighboring observations. In other words, the property value of one housing unit is influenced by the market values of its neighbors. Because the Lagrange multiplier from the spatial error model is larger than the spatial lag model, the spatial lag model is used (Anselin, Syabri, and Kho 2006), and the spatial hedonic pricing model used in this study is noted in equation 7:

where
Explanatory Variables
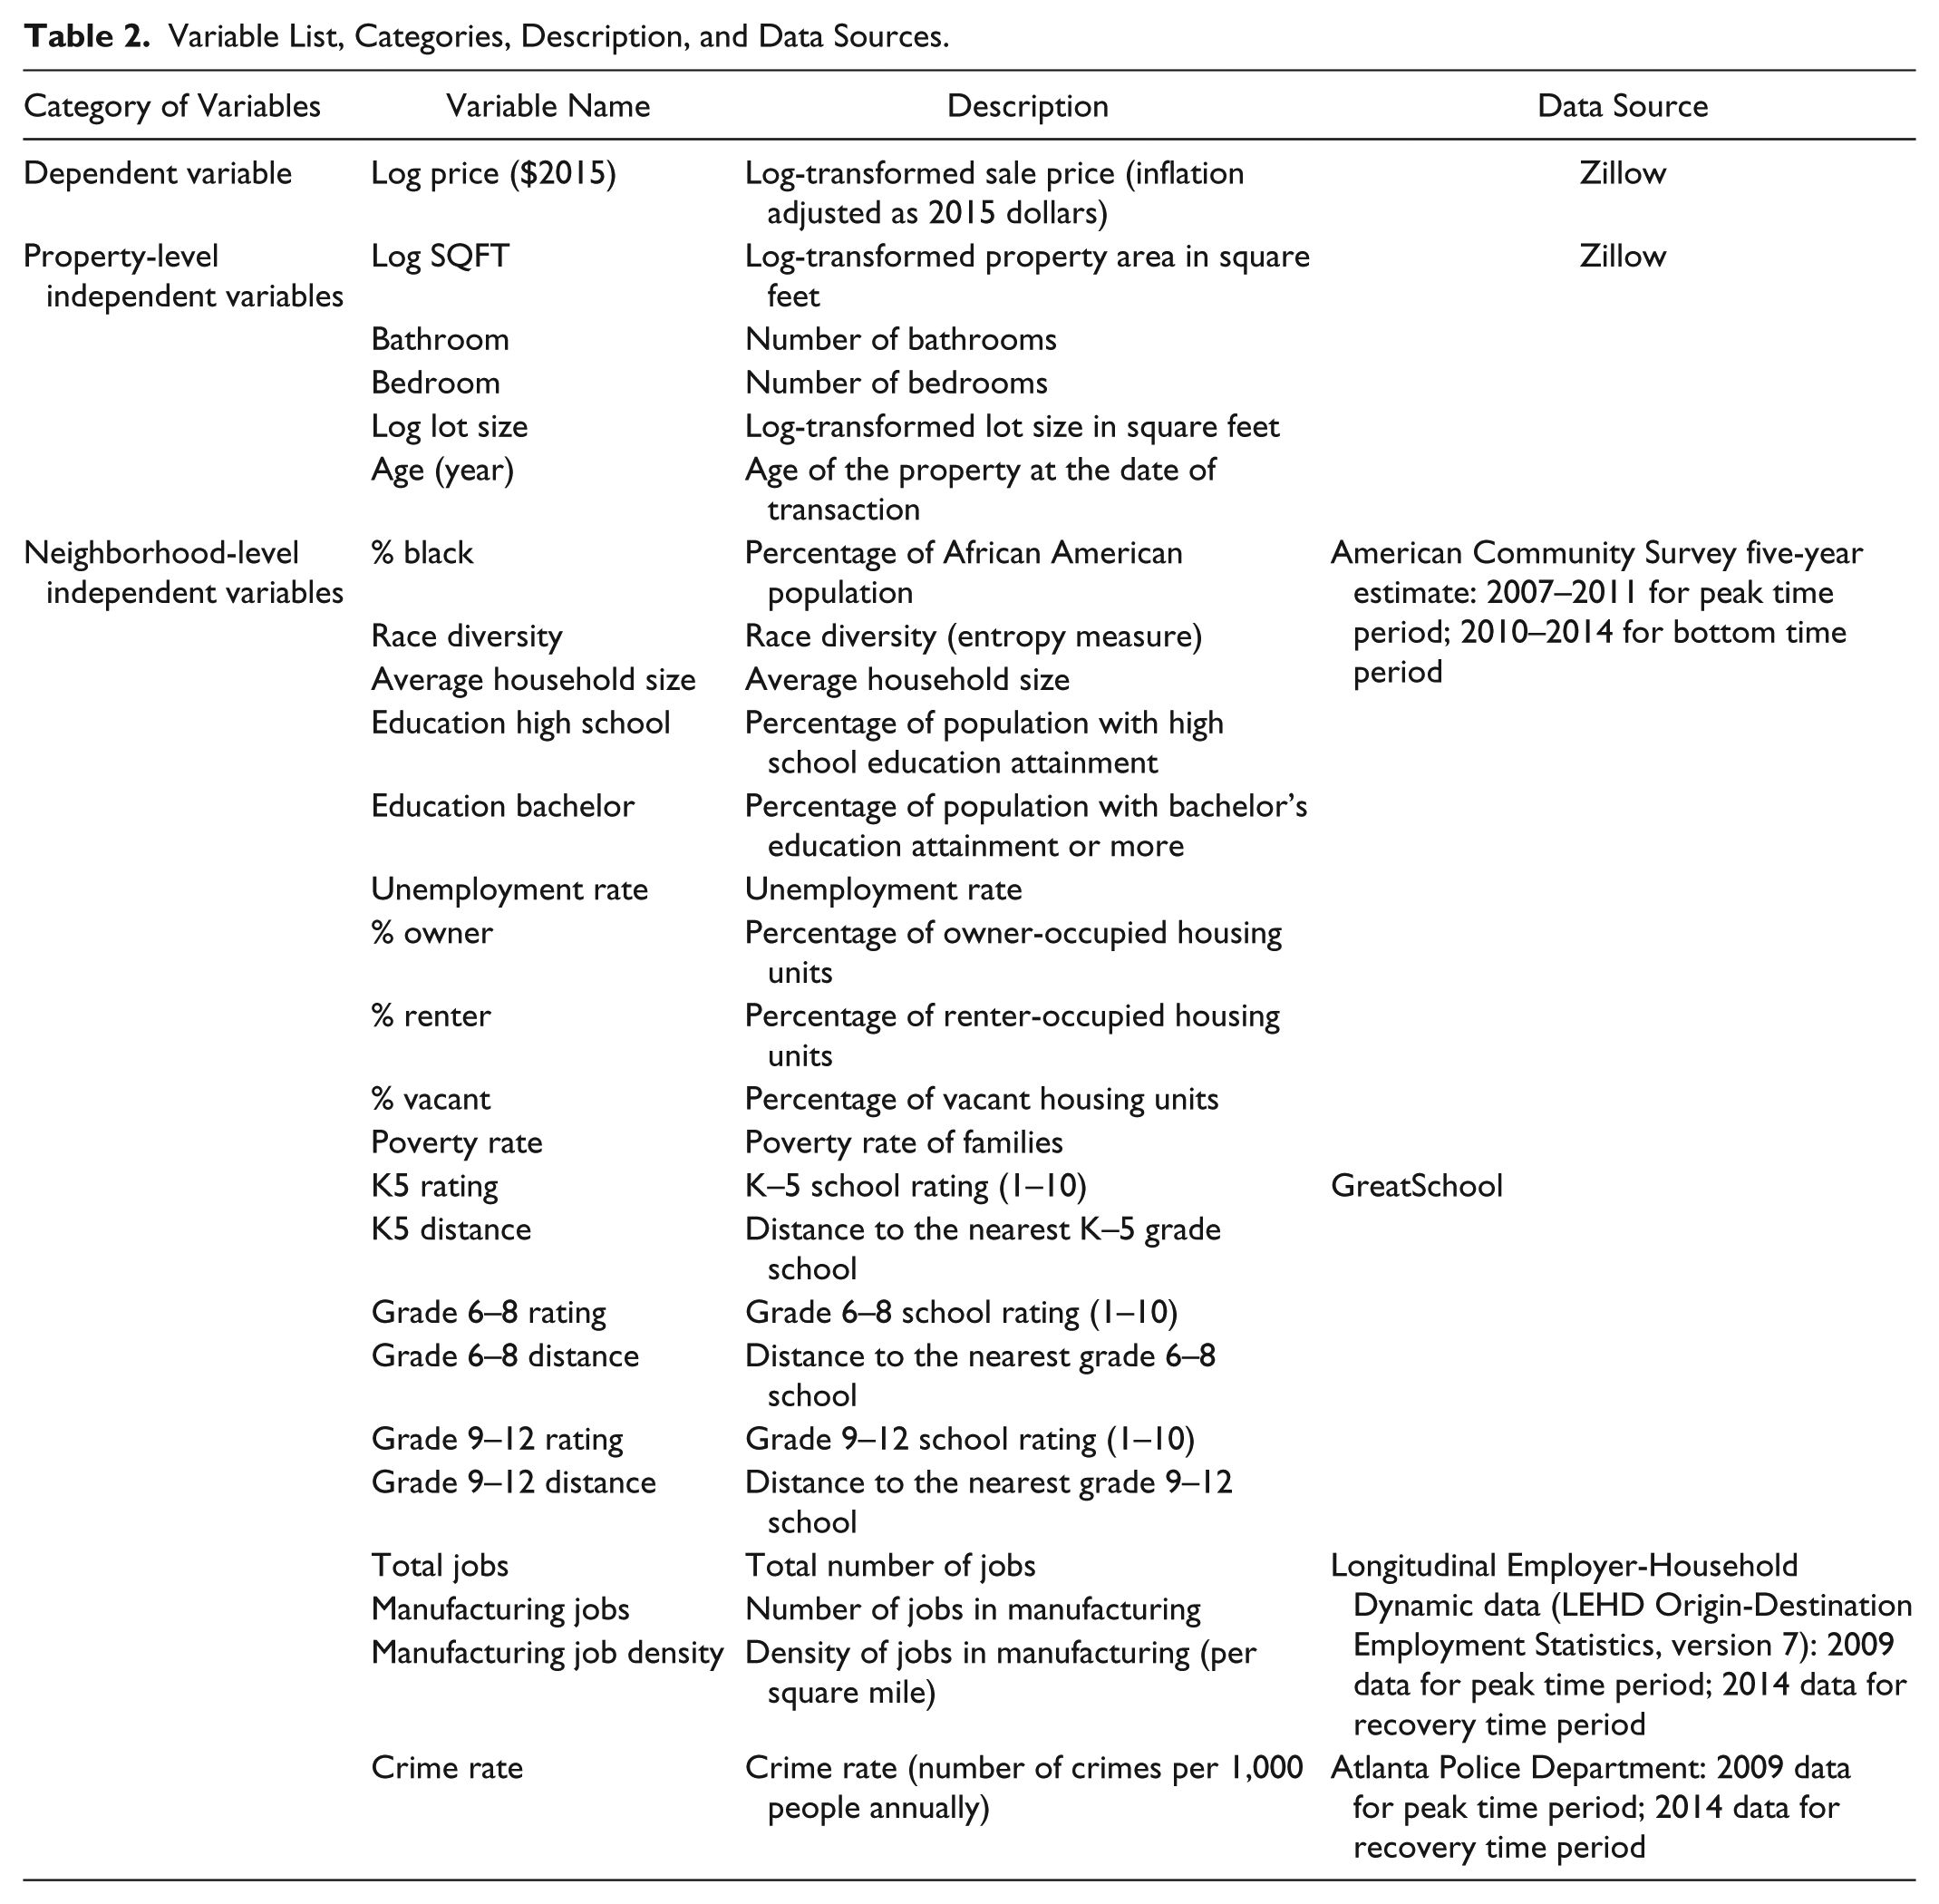
In addition to the economic environment and TOD attributes, other property and neighborhood variables are found to be significantly associated with home sale prices based on hedonic studies. Sirmans, Macpherson, and Zietz (2005) identified the top twenty factors significantly related to housing prices, most of which are house-specific characteristics like lot size, square footage, and number of bathrooms/bedrooms. Many locational or neighborhood variables are also closely associated with home sale values, such as the proximity to the central business district or local job centers (Bartholomew and Ewing 2011; Song and Knaap 2003), access to transportation facilities (Bowes and Ihlanfeldt 2001; Golub, Guhathakurta, and Sollapuram 2012; Seo, Golub, and Kuby 2014; Welch, Gehrke, and Wang 2016), and school district quality (Goodman and Thibodeau 2003). The dependent variable is log-transformed sale price, adjusted to 2015 dollars. In addition to TOD and recession-related variables that are at the core of the research, we include multiple property-level factors and neighborhood-level factors, as suggested by the literature. The complete list of explanation variables and their data sources is presented in Table 2.
Variable List, Categories, Description, and Data Sources.
Model Results
Descriptive Statistics of Significant Variables
Two spatial lag models are developed using the independent variables listed in Table 2. Model 1 examines the effect of TOD on maintaining housing prices during the recession, and model 2 estimates the effect of TOD on value recovery after the recession. Insignificant variables were removed from further analysis. We also excluded highly correlated built environment variables to avoid multicollinearity. The descriptive statistics of the significant variables included in the developed models are shown in Table 3. We standardized the continuous variables, such as age and median household income, before developing the models, to avoid extremely small estimated coefficients. There are 4,632 observations (property sale records) in model 1 and 4,976 observations in model 2.
Descriptive Statistics of Variables in Model 1 and Model 2.
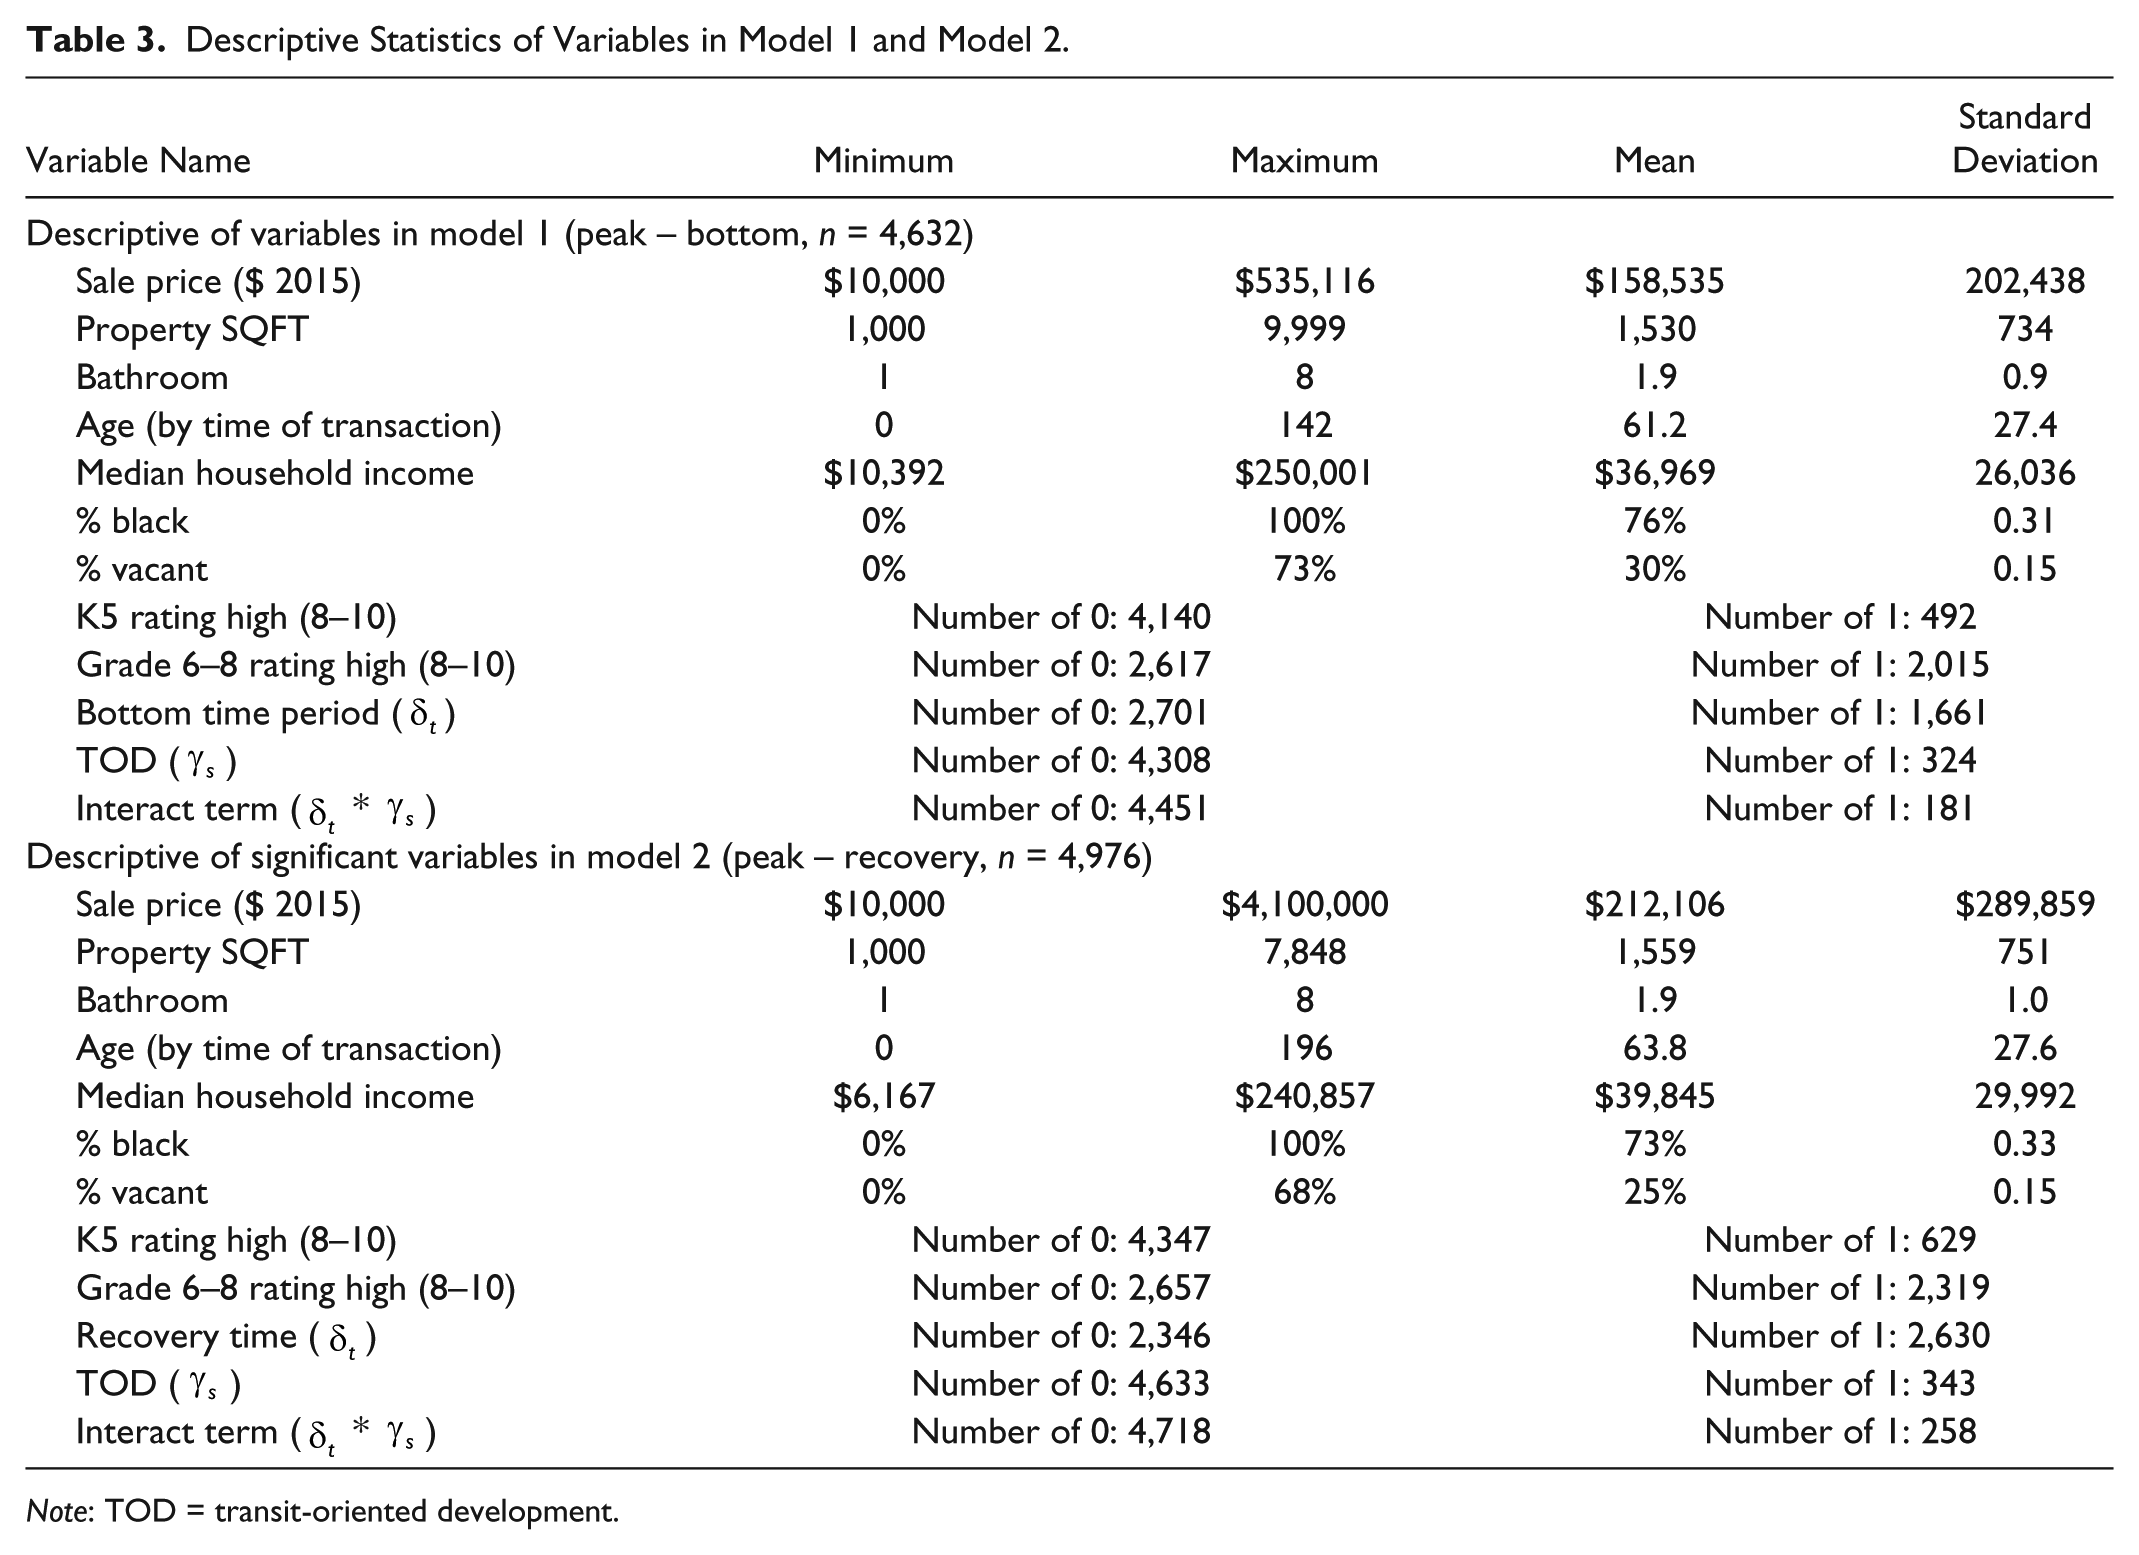
Note: TOD = transit-oriented development.
Spatial Regression Results and Interpretation
The results of Models 1 and 2 are presented in Table 4. In both models, the three dummy variables have significant coefficients, indicating their statistically significant effects on housing sale prices in Atlanta during and after the recession. Similar sets of explanatory variables, including the property-level variables of the area, number of bathrooms, age of the property, lot size, and neighborhood-level variables such as percentage of African American population, percentage of vacant housing units, and rating of schools, are also significant. The R-squared values of the two models are .46 and .60, respectively, indicating the majority of variations in property values are captured in the models.
Model Results Summary.
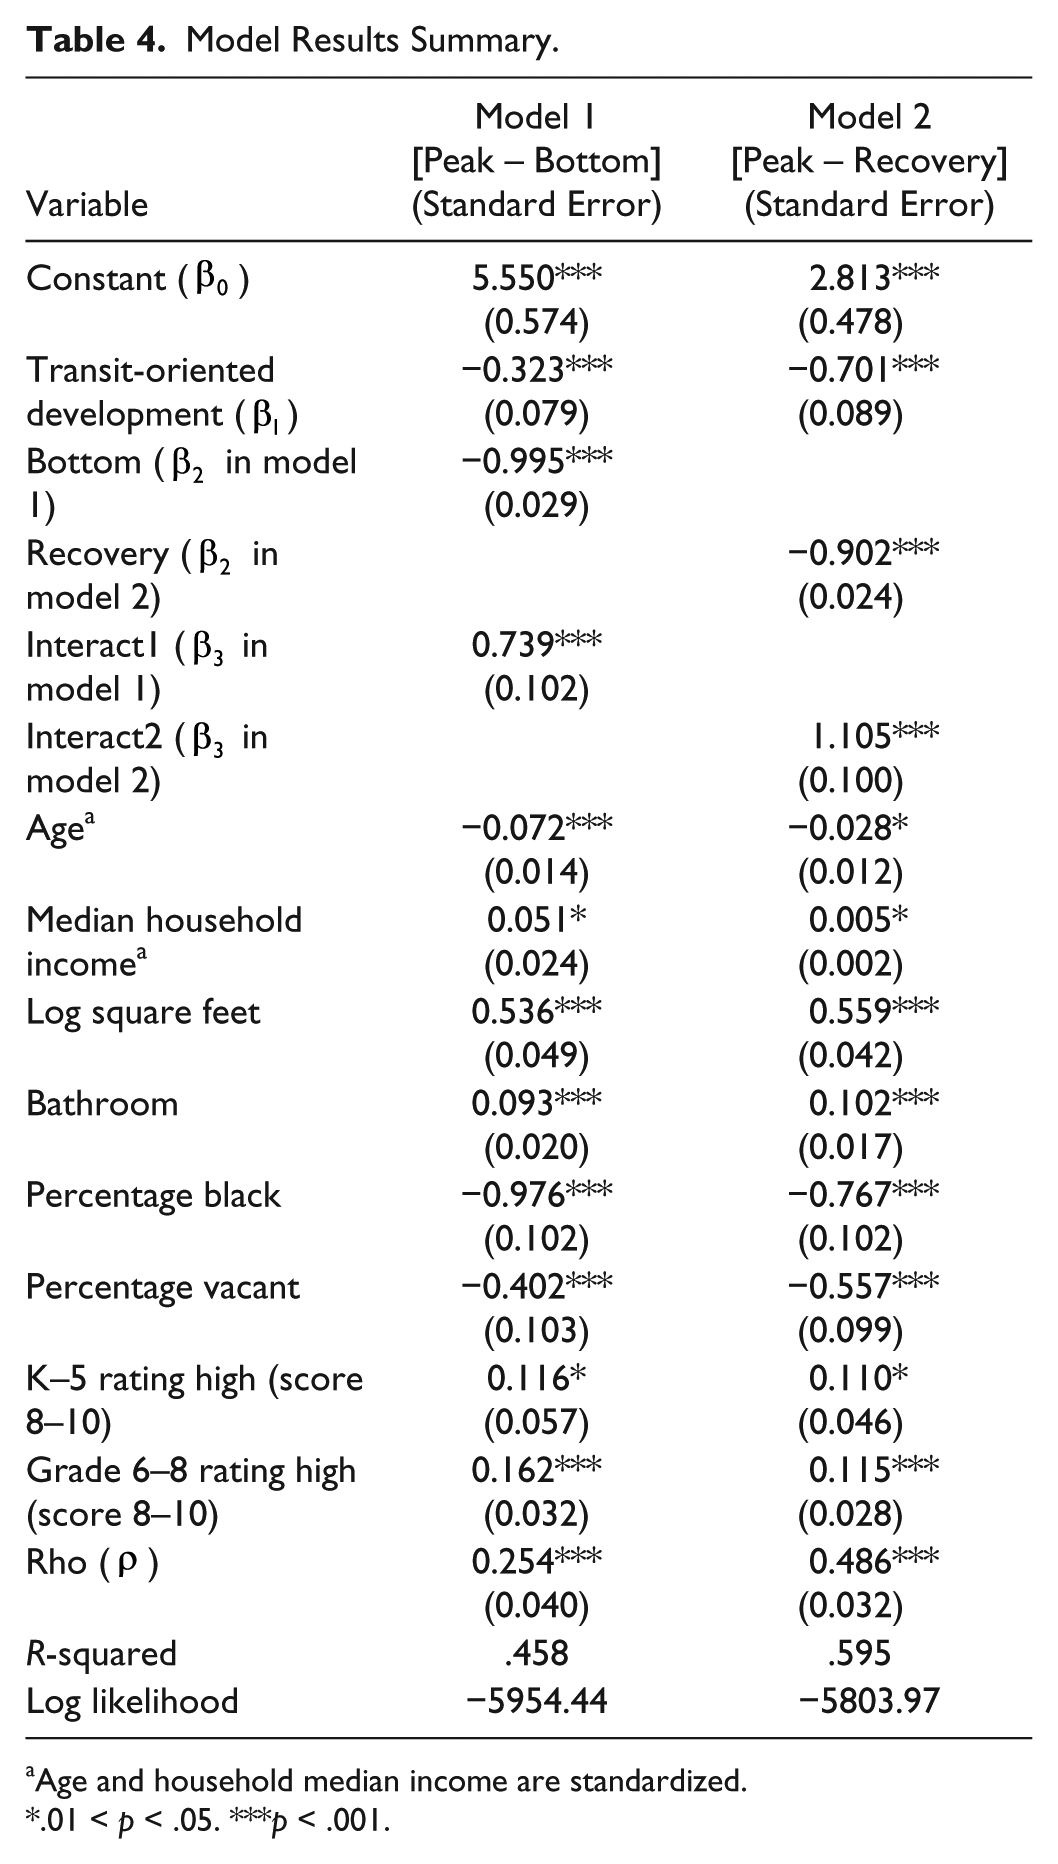
Age and household median income are standardized.
.01 < p < .05. ***p < .001.
The estimated coefficients for all the variables (excluding the dummy ones) are consistent with existing literature. The coefficients (
The model coefficients for the three dummy variables support the hypothesis that housing values in TODs are more resilient compared to values in TADs. The interpretations of the coefficients of dummy variables in model 1 are summarized in Table 5, following the rules from Tables 1.c and 1.d. Because we used the exponent of the estimated coefficients as the dependent variable (the log-transformed sold value of properties), the estimated results should be interpreted as a percentage change rather than an absolute change. The results indicate that controlling for other factors, before the economic recession (2006–2008), TOD home values were, on average, 27.6 percent lower than TAD home values, despite higher average school ratings and lower vacancy rates in these TOD areas. However, during the recession, the TOD properties were valued, on average, 51.6 percent higher than their TAD peers. Although the price per square foot in TODs and TADs was similar, as illustrated in Figure 2, these discrepancies illustrate that homebuyers were less willing to pay to live in TOD areas prerecession. In other words, families preferred cul-de-sac neighborhoods near transit stations before the recession. This conclusion is consistent with a previous study conducted in Atlanta (Bowes and Ihlanfeldt 2001). These results show that from the peak to the bottom time period, TAD property values fell more than 60 percent in their sale prices while TOD values fell by only 22.6 percent, holding all other factors constant.
Interpretation of the Coefficients of Focus Variables in Model 1 and Model 2.
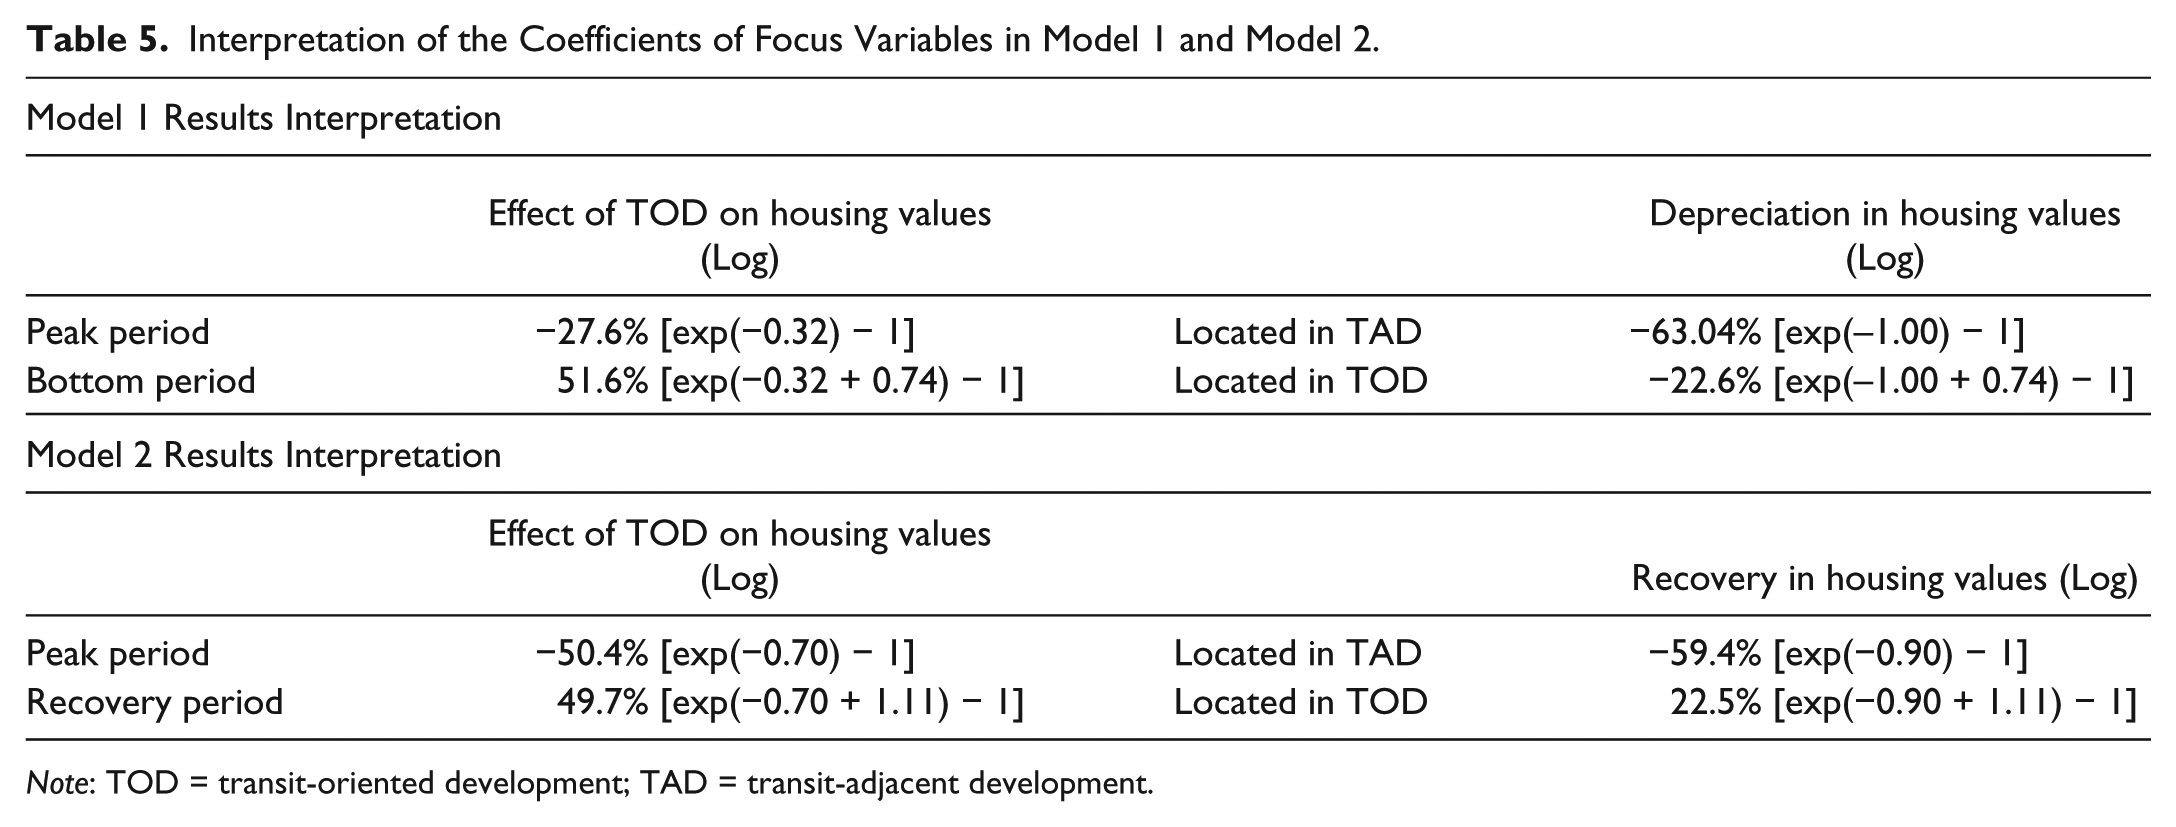
Note: TOD = transit-oriented development; TAD = transit-adjacent development.
The results of model 1 support our hypothesis that walkable and mixed-use built environments around transit stations help maintain property values during an economic recession. The results show that the recent increased demand for new urbanist neighborhoods helps to offset the negative externalities near transit stations and stabilizes home values in TOD areas compared to TAD areas.
The interpretation of model 2, shown in Table 5, also supports our hypothesis that properties located in pedestrian-friendly neighborhoods around transit stations experience faster housing price recovery. Sale prices of TAD properties were valued approximately 59.4 percent lower than sale prices of similar TAD properties before the recession. While Figure 2 shows that TAD property value per square foot fully recovered to the prerecession level, these results suggest that willingness to pay for properties in TADs is actually lower, all things being equal. The data are misleading because despite the appearance of fully recovered property values in TADs, the properties sold in the recovery time period are newer than properties sold during the peak and are located in higher-income neighborhoods. In contrast, the sale price of TOD properties not only fully recovered but exceeded average prerecession prices by approximately 22.5 percent, after controlling for all property- and neighborhood-level characteristics. The results suggest that TOD property values are 49.7 percent higher (for the past two years) than similar TAD property values.
Model Diagnosis
Almost all of the diagnostics of spatial dependence were statistically significant, requiring us to use a spatial lag model. We also developed spatial error models and compared their Akaike information criterion values to the spatial lag models’ Akaike information criterion values. The spatial lag models performed better, and when we calculated Moran’s I statistics to examine whether a spatial autocorrelation problem existed in the residuals of the two spatial models, the results indicated that the models successfully addressed the spatial autocorrelation in the data. The Moran’s I of the two models are −0.009 and −0.012. These values are very close to zero, indicating that the models have successfully addressed the spatial autocorrelation issue presented in the data.
Sensitivity Tests
We addressed the discrepancy in TOD boundaries, as put forth in previous literature, by conducting sensitivity tests. We developed three sets of models assuming radii of 0.50, 0.75, and 1.00 mile from transit stations and developed models 1 and 2 for each of the three assumptions. The results of the three sets of models, shown in Table 6, suggest that the buffer size has a small impact on the final results. The three dummy variables of interest, including the TOD dummy, the time period dummy, and the interaction dummy, are consistently significant with similar magnitudes across all models. When the buffer is narrowed down to 0.50 mile, some variables become insignificant, possibly due to smaller sample sizes of TOD properties and reduced variations in explanatory variables, especially the block group-level medium income, property age, and school quality. Nevertheless, the estimated coefficients of the three dummy variables are similar to the estimates in other models. The sensitivity test demonstrates the robustness of our findings, regardless of TOD buffer size, and supports the use of a 1.00-mile buffer from transit stations for defining TODs in this study.
Sensitivity Tests Results.
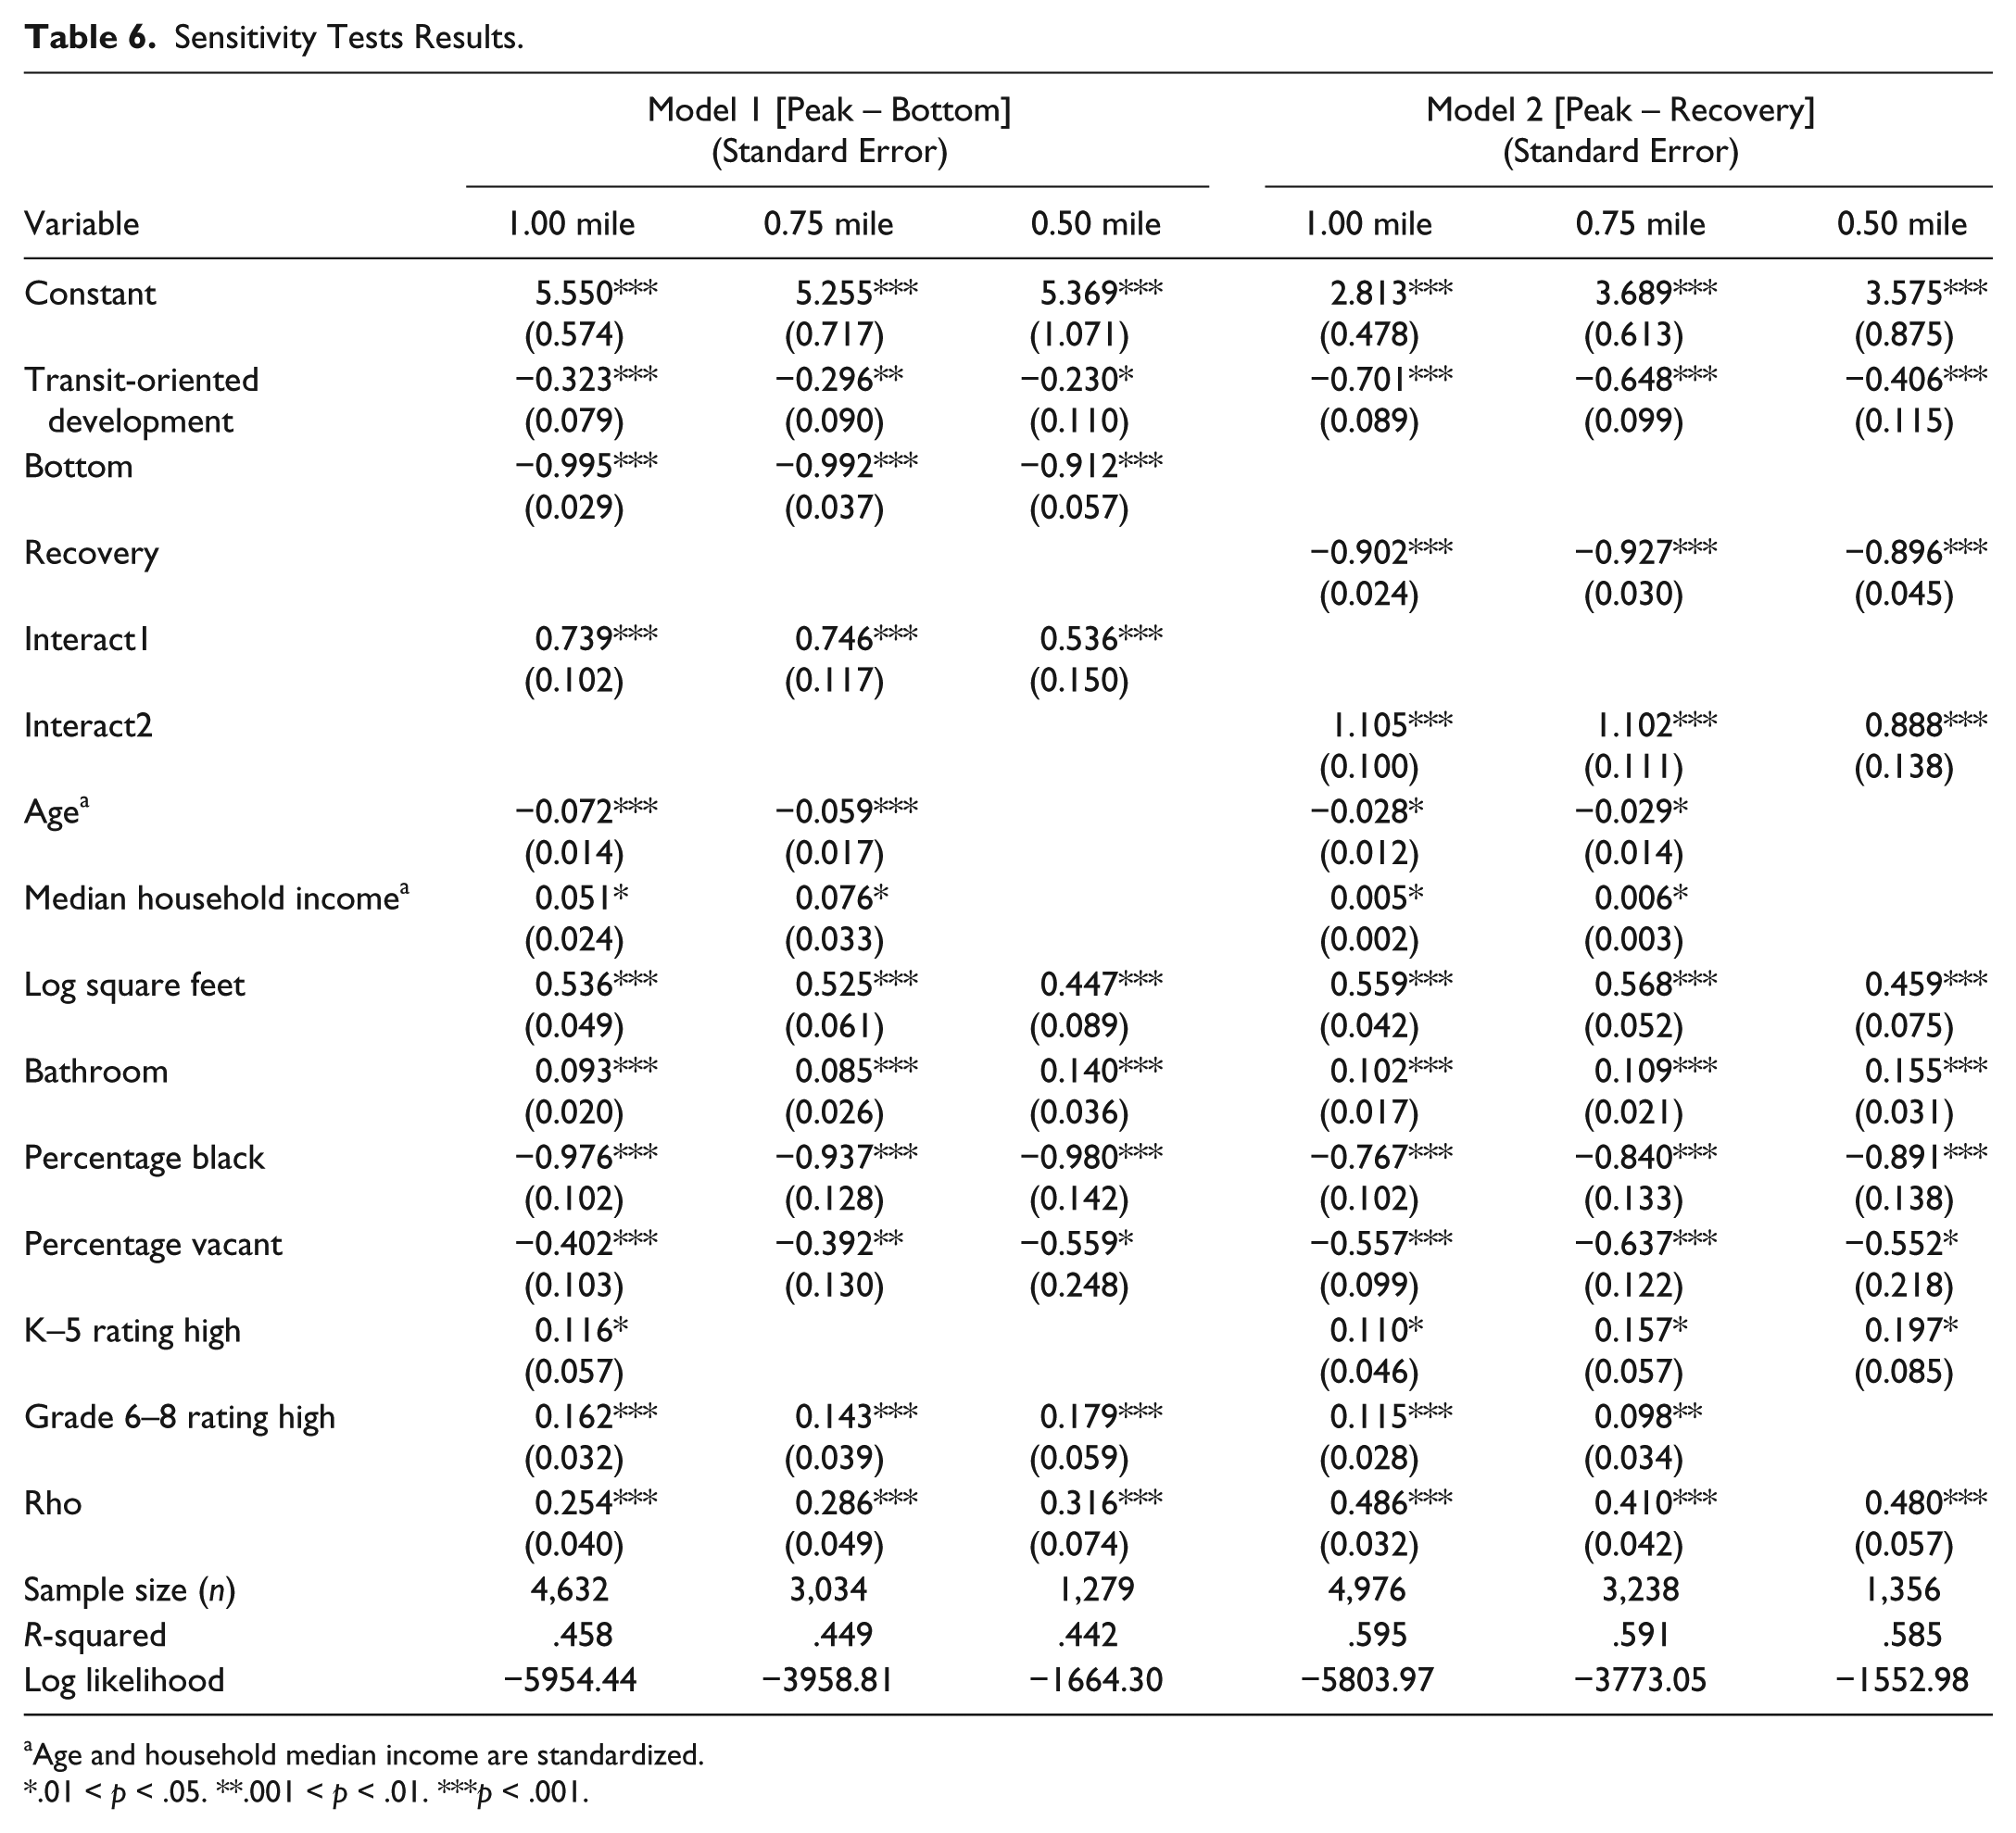
Age and household median income are standardized.
.01 < p < .05. **.001 < p < .01. ***p < .001.
Discussion
In this study, we developed spatial lag hedonic models to evaluate people’s willingness to pay for walkable and mixed-use neighborhoods near transit stations in the city of Atlanta during and after the Great Recession. Several findings from our analysis are worth further discussion.
Supportive Land Use and Home Values
The findings of this research suggest the important role that supportive land use around transit stations can play in maintaining home values. Properties in TOD and TAD areas present completely different trajectories of home sale prices before, during, and after the economic recession. This finding is consistent with recent work that demonstrates positive effects of supportive land use patterns and well-designed new urbanist neighborhood amenities on housing values (Bartholomew and Ewing 2011).
The positive interaction between home prices and supportive land uses is intuitive: the area around West End MARTA station demonstrates this relationship. As shown in Figure 3, the west side of the station has direct access to the surrounding neighborhood and includes commercial and multifamily land uses, while the east side of the station is partially blocked from the neighborhood by an arterial road, large industrial land uses, and a rail corridor. In this study, the majority of the west side is defined as TOD, and the east side is classified as TAD. Our modeling results suggest that homebuyers demonstrated higher willingness to pay for areas like the west side versus the east side. The growing preference for TOD neighborhoods and characteristics represents a rising demand for better accessibility to alternative travel modes. This preference leads to more resilient home values in TOD areas.
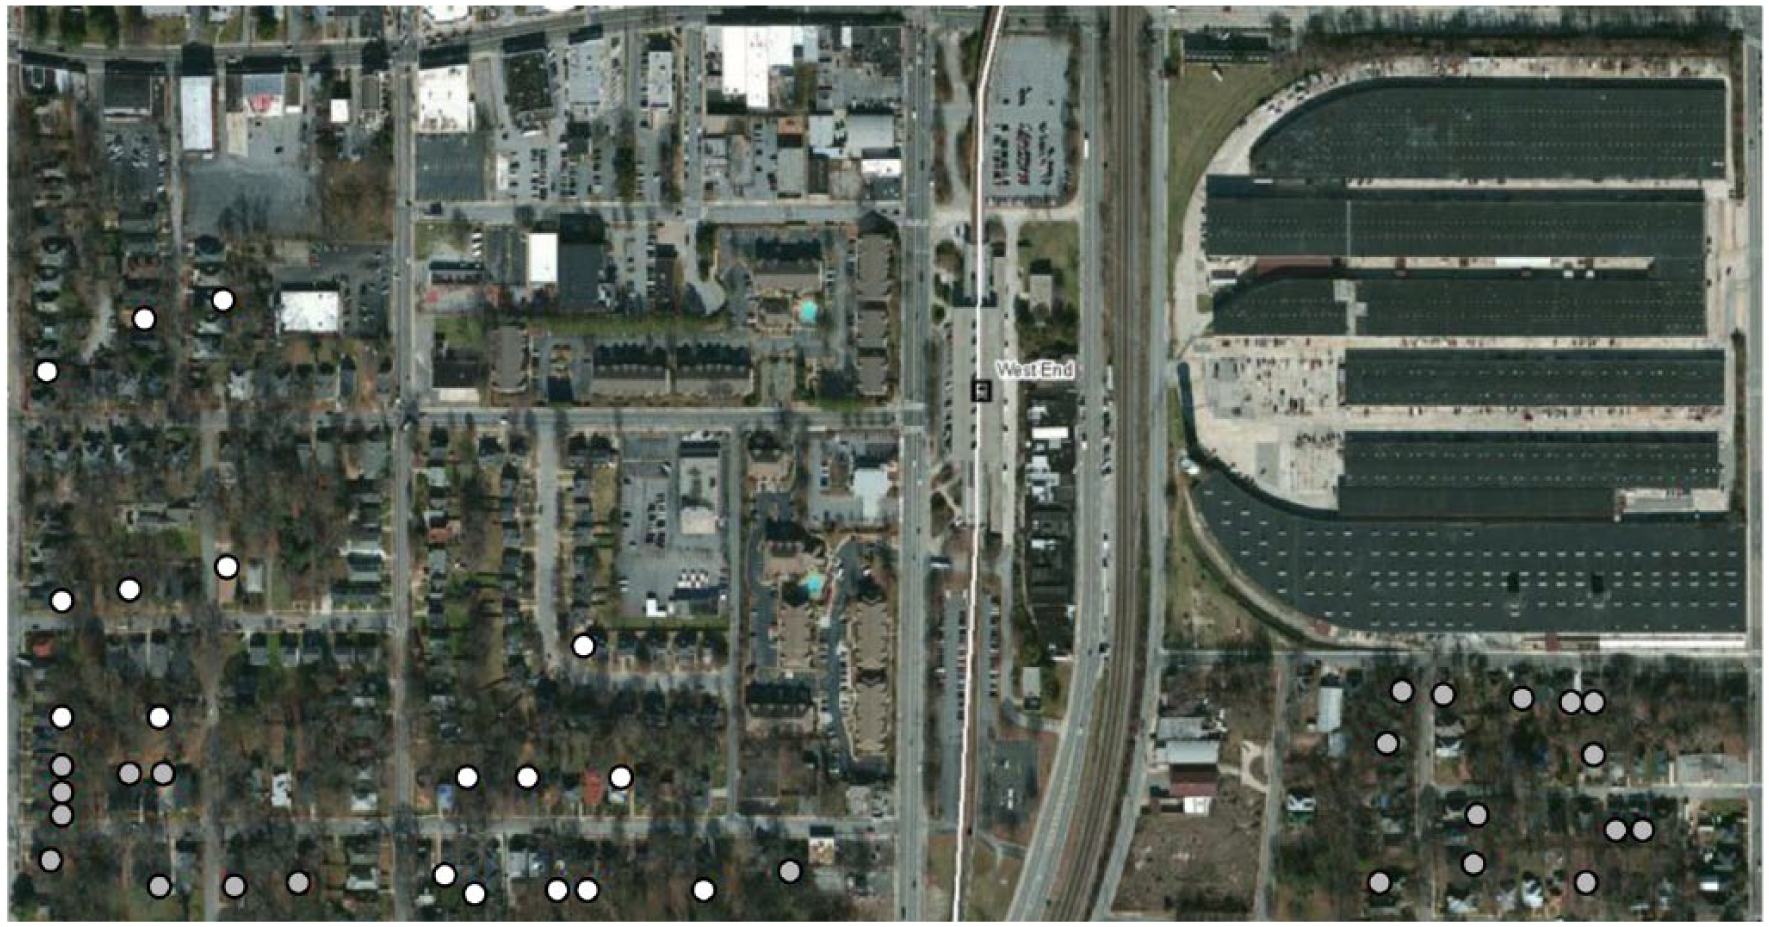
The West End Metropolitan Atlanta Rapid Transit Authority station in Atlanta (white = transit-oriented development properties; gray = transit-adjacent development properties. Background: ESRI Map Service 2016 world imagery).
A Growing Demand for New Urbanist Neighborhoods
The modeling results also suggest that there is a growing demand for properties located in new urbanist neighborhoods around transit stations, compared to properties in car-oriented neighborhoods. Before the recession, property values in TOD areas were significantly lower than those in TAD areas, possibly because of the perceived crime and noise around transit stations. In more recent years, the demand for neighborhoods with new urbanist features continues to increase, which is represented by the slower decline of TOD property values during the recession and faster value appreciation after the recession. This phenomenon implies a shift in the perceived value of TOD and suggests that TODs are becoming more desirable for homebuyers. Given that TOD projects were mostly halted during the recession, there may be a mismatch in the supply and demand of TOD housing units.
Transit operators, land use and housing planners, and real estate developers should design policies and regulations to address this gap. Several studies have identified zoning codes as key barriers to TOD implementation: for example, the existing Atlanta zoning ordinance is not TOD supportive. Planners should update zoning for areas adjacent to MARTA train stations and bus stops to support compact development around transit facilities, to meet the market demand for TOD housing units, and to promote transit use.
Capturing and Sustaining TOD’s Value
Although TODs generally require substantial private and public capital, the findings of this research suggest that there is a substantial time-lagged return on this investment. The debate about the extent to which TOD can change travel behavior, increase home values, and guarantee returns on investments has been discussed in the literature. In addition, some studies have examined the time frame during which these benefits can be revealed. As suggested by our findings, TOD properties used to be valued less than TAD properties, but the past decade or so has demonstrated a return on investment from earlier TOD projects. Regarding transit-oriented land value capture policies, it is important to consider this time-lagged positive effect of TOD on property values. While this research has not measured the effect of TOD-supportive policies, the findings reveal the great potential of capitalizing on the growing value of TOD properties to support transit usage, development of compact and mixed-use development, and affordable housing development near transit stations.
Conclusions
This research finds that TOD property values in the city of Atlanta were more resilient during the recent recession when compared to TAD property values. This conclusion was supported by analyzing the transaction records of single-family homes during three time periods between 2006 and 2016. The prices of residential properties in TOD areas dropped less during the economic downturn and recovered faster in the postrecession period compared to their counterparts in TAD areas. Key differences between TOD and TAD areas included pedestrian-friendly built environment characteristics, such as walkability, and land use mix. Other property- and neighborhood-level variables were controlled for, and spatial autocorrelation was addressed in the model. The sensitivity test demonstrated that the findings are quite robust when compared across different sizes of TOD buffers. This evidence indicates that TOD plays a consistently significant and positive role in home value resilience in the city of Atlanta.
The increase in demand for TOD properties can help promote TOD initiatives, but it also can present challenges to providing affordable housing in TOD areas. There is a growing need for planners to work closely with transit agencies and various governments to advocate for TOD-friendly and inclusive zoning ordinances and other development incentives to ensure equitable and affordable TOD designs in the future.
Scholars and practitioners who want to generalize the findings in this study to other areas are advised to note a few limitations. First, since this study focuses on comparing properties in TOD areas to those in TAD areas, transit-absent areas are not considered in the study. Another comparative study that examines property values in all three types of neighborhoods could generate insights on the separate effects of a transit station, supportive development patterns, and auto-oriented community design schemes. Moreover, it is assumed that TOD and TAD status did not change between the beginning and end of the Great Recession (2006–2016) or at least that the gap in TOD-ness between the two groups of residential properties in this study did not change. This limitation is due, in part, to the availability of Walkscore data. In addition, this study does not consider TOD a policy intervention during the study period from 2006 to 2016. Instead, this study focused on how the properties that were already located in TOD areas performed differently from those in TAD areas. Given these limitations, we cannot suggest that the correlation found here implies causation. As a next step, a pseudo-experimental research design should be used to estimate whether designation and treatment of TOD may affect the resilience of property values and how much.
Despite these limitations, the findings of this research have important policy and practical implications. The supportive land use and built environment patterns around transit stations have made a difference in home values in TODs. Though it is unclear whether the recent growing demand for properties in TOD areas is a result of a changing perception of the value of TOD or a lagged effect of early TOD investments, the findings suggest the great potential to capture and leverage the value of TOD to promote more sustainable urban development. Policies that incentivize TOD investments and leverage potential return on investment to promote transit usage and affordable housing development should be encouraged. Planning practice should update zoning ordinances to encourage built environment characteristics supportive of TOD.
Footnotes
Acknowledgements
We thank the editor and three reviewers for their thoughtful comments and recommendations to significantly improve the quality of the original manuscript.
Declaration of Conflicting Interests
The author(s) declared no potential conflicts of interest with respect to the research, authorship, and/or publication of this article.
Funding
The author(s) received no financial support for the research, authorship, and/or publication of this article.