
Abstract
We explore the potential for cities to develop urban heat management plans to moderate rising temperatures and to lessen the impact of extreme heat on human health. Specifically, we model the impacts of heat management strategies, including tree planting and other green infrastructure, cool roofing and paving, and a reduction in waste heat emissions from buildings and vehicles, on estimated heat-related mortality across Louisville, Kentucky. Our assessment finds a combination of urban heat management strategies to lessen summer temperatures by as much as 10°F on hot days and to reduce estimated heat-related mortality by more than 20 percent.
Introduction
Among the numerous anticipated impacts of climate change on human health in U.S. cities, extreme heat is both the highest likelihood weather-related event and the weather-related event for which the greatest increase in mortality is projected (Intergovernmental Panel on Climate Change 2014; U.S. Global Change Research Program [USGCRP] 2016). Recent studies assessing the change in annual heat-related mortality attributed to rising temperatures estimate more than 20,000 additional heat-related deaths in cities of the United States by the end of the 21st century (USGCRP 2016; Voorhees et al. 2011). While an ongoing shift in regional climates toward higher temperatures is projected to decrease cold-related deaths, the net change in annual mortality by 2100 is found to range between 3,000 and 10,000 additional temperature-related deaths (USGCRP 2016). Heat-related deaths across U.S. cities are estimated to total more than 1,300 deaths per year, on average, a number exceeding any other weather-related causes of death, such as hurricanes, tornadoes, and winter storms (Bobb et al. 2014; Kalkstein et al. 2011). Extreme heat is presently and will likely remain the most significant climate-related health threat confronting large urban populations of the United States (USGCRP 2016).
At present, the extent of adaptation planning for rising temperatures underway in cities within or outside of the United States remains limited. While many municipal and/or state governments identify extreme heat as a weather-related hazard in all-hazard emergency response plans, the associated response strategies tend to focus on heat warning systems and other short-term responses only triggered at the time of an extreme event. In contrast to emergency response plans for heat wave events, which are short term in nature and emphasize adaptive behaviors during periods of extreme heat, we define urban heat management as an ongoing function of municipal governments designed to physically reduce the intensity and duration of heat exposure both during and outside of periods of extreme heat (Stone et al. 2013). In this sense, urban heat management is one element of climate adaptation planning for rising temperatures, which is focused on reducing population sensitivity to and enhancing adaptive capacity for coping with heat, in addition to limiting exposure through physical changes to the built environment of cities.
In this paper, we evaluate the potential for comprehensive urban heat management strategies, including tree planting and other green infrastructure, the use of highly reflective or “cool” materials, and the implementation of building and transportation energy efficiency programs, to reduce warm season (May-September) temperatures and heat-related deaths in Louisville, Kentucky. Found by Stone, Vargo, and Habeeb (2012) to have the most rapidly growing urban heat island (UHI) in the United States—the widely observed phenomenon through which cities exhibit higher temperatures than proximate rural areas—and estimated to have a metropolitan population of about 1.2 million, Louisville serves as an ideal test-bed for assessing the potential benefits of urban heat management planning as a basis for lessening the health risk of rising temperatures resulting from both global (e.g., rising greenhouse gas concentrations) and local (e.g., deforestation) drivers of climate change in a large U.S. city. The outcome of this study finds metro-wide enhancements in vegetative cover and cool materials, combined with reductions in waste heat emissions through improved energy efficiency, to measurably lower warm season temperatures and to reduce estimated heat-related mortality by more than 20 percent.
Managing Heat through Urban Design
The design of urban landscapes has the potential to either elevate or moderate temperatures in cities. As demonstrated from the earliest studies of the UHI effect, more vegetative zones of urbanized areas have been found through numerous studies to exhibit temperatures between about 2°F and 10°F (1.1°C and 5.6°C) lower than sparsely vegetated zones typically situated at the city center (Stone 2012). More recent work, employing both observational and modeling approaches, finds a range of vegetative cover, including tree canopy, grass, and agricultural covers, to moderate urban temperatures, with the greatest cooling effects most often observed at night (Bowler et al. 2010; Coutts et al. 2013; Gober et al. 2010; Jenerette et al. 2007; Phelan et al. 2015; Shashua-Bar, Pearlmutter, and Erell 2009; Stone et al. 2014). Construction materials designed to reflect away incoming solar radiation, including highly reflective roofing coatings and shingles, as well as some paving materials, have also been found to measurably reduce both land surface and near-surface air temperatures, with the greatest cooling effects typically observed during the day when solar insolation is maximized (Jacobson et al. 2012; Jung and Yoon 2011; Zhou and Shepherd 2010). A smaller number of studies finds reductions in waste heat emissions from buildings and vehicles to further lower urban temperatures (Fan and Sailor 2004; Hart and Sailor 2009; Salamanca et al. 2014).
Less commonly studied in the literature on urban heat management is the extent to which measured or modeled reductions in air temperature through UHI-mitigation can be associated with reductions in heat-related illness. We contend that an assessment of heat injury and mortality among the urban population, in addition to variations in temperature across a city, is needed to most effectively inform heat adaptation plans. Specifically, urban policy makers and public health officials require information on where heat risk is greatest within cities and to what extent UHI-mitigation strategies can lessen the risk of heat injury and mortality. Such an assessment must account not only for the intensity of heat exposure across urban areas but also for the location of sensitive populations, as it is the combination of heat exposure, population sensitivity, and individual coping ability (i.e., adaptive capacity) that drives heat-health outcomes.
While numerous studies in the public health literature have assessed the impact of extreme heat on health (Bouchama & Knochel 2002; Kovats and Hajat 2008; Luber and McGeehin 2008), only a handful of studies have attempted to measure the potential benefits of urban heat management for lessening heat-related illness. Through a study of observed heat-related deaths, neighborhood characteristics (e.g., vegetative cover), and socioeconomic conditions in Phoenix, Arizona, Harlan et al. (2013) found the likelihood of heat-related mortality to increase as the extent of vegetative cover declined across metropolitan neighborhoods. Boumans et al. (2014) modeled the impact of varying extents of urban vegetation, among other variables, on estimated heat-related mortality in Austin, Texas, under different global-scale climate change scenarios. Through a modeling scenario in which tree canopy is increased by fixed proportions (e.g., doubled in urban zones), the authors found measurable but modest reductions in estimated heat deaths, holding local population and global climate characteristics constant. Likewise, Chen et al. (2014) modeled the effects of a doubling of urban tree canopy on temperatures and heat-related mortality in Melbourne, Australia, under current climate conditions and projected regional temperatures for 2030 and 2050. This study found an expansion of tree canopy in the downtown district between 15 and 33 percent to be associated with reductions in estimated heat-related mortality between 5 and 28 percent, accounting for both ambient and building-interior exposures to heat (Chen et al. 2014).
If municipal governments are to develop urban heat adaptation plans, they will need to employ a wider range of strategies than vegetation enhancement alone, particularly if situated in hot and arid climates. Also needed is a better understanding of how extensively tree canopy or cool materials could be expanded over time through the adoption of established urban policies, such as cool roofing ordinances or minimum green cover standards, as opposed to a hypothetical doubling of tree canopy, which may not be feasible. To this end, Stone et al. (2014) assessed the potential for specific municipal policies to increase tree canopy and cool materials across three large U.S. cities (Atlanta, Philadelphia, and Phoenix) and then estimated the benefits of these changes for local temperatures and heat-related mortality. This study found the combination of vegetative and high albedo building strategies, including cool paving and roofing, to offset projected increases in heat deaths by 2050 in Atlanta, Philadelphia, and Phoenix by 40 to 99 percent (Stone et al. 2014).
In this study, we build upon prior research through developing a neighborhood-based indicator of air temperature and humidity, and through the assessment of both land cover (e.g., vegetation and cool materials) and energy efficiency heat management strategies. We further make use of health data specific to Louisville, Kentucky, as opposed to average estimators of heat risk derived from multiple cities.
Assessing Heat Risk within Cities
Perhaps the single greatest impediment to assessing heat risk in urban areas is the availability of regularly and reliably measured air temperature for only a handful of locations, and often in locations distant from population centers, such as airports. If heat risk is to be reliably measured across urban areas, it is important to know both how the location of sensitive populations (e.g., the very old or very young) and the pattern of heat exposure varies from neighborhood to neighborhood. As temperature, humidity, and other meteorological variables are typically measured at only a limited number of locations in large U.S. cities, other means of assessing heat exposure at the neighborhood level, where differential land cover conditions can contribute to significant variations in temperature relative to a small number of weather stations, are needed.
Most commonly, researchers have employed remotely sensed land surface temperature (LST) as a proxy for near-surface air temperature (Jenerette et al. 2007; Liu and Zhang 2011; Yuan and Bauer 2007). We find this approach potentially problematic in two respects. First, LST has not been established in the public health literature as a driver of human health impacts; rather, the epidemiological literature on human heat risk has demonstrated a statistical association between near-surface air temperature and heat-related health outcomes. As such, it is generally unknown if variations in LST exhibit a strong association with variations in heat injury or mortality. Second, recent studies comparing observed or modeled air temperature data to LST have not found a strong correlation. Through a statistical analysis correlating satellite-derived surface temperature from Moderate Resolution Imaging Spectroradiometer (MODIS) imagery with weather station observations, two recent papers found R-square values of less than .5, suggesting that many urban zones exhibiting high LST may not be exhibiting high air temperatures and vice versa (Ho et al. 2016; Kloog et al. 2012). If municipal governments and other organizations are to target heat management interventions to neighborhoods of high heat risk, it is important that reliable data on the exposure to high air temperatures be employed in risk assessment studies.
In this study, we made use of a regional climate model, the Weather Research and Forecasting (WRF) model (version 3.4), to estimate near-surface air temperatures, humidity, and other meteorological variables across the Louisville Metro region for a 5-month period (May through September) in the summer of 2012. The WRF regional climate model offers several advantages to an assessment of urban heat risk. First, it enables near-surface air temperature and humidity (at height of 2 m) to be estimated at a gridded level across a large region. We ran WRF for every 480 m by 480 m zone (capturing about six city blocks) across the Louisville Metro region, increasing the number of unique temperature and humidity estimates from two (at regional weather stations) to approximately 5,000 equally spaced locations across the Louisville study region. The use of a regional climate model, therefore, allowed air temperature variability across distinct neighborhoods to be estimated.
Second, the use of a regional climate model enables air temperature to be estimated continuously and at a high temporal resolution—generating hourly estimates in our study—throughout an entire warm season or year. In contrast to satellite-derived LST, which is limited to fixed observation periods and subject to atmospheric interference, such as extensive cloud formation, a regional climate model provides output for all time periods of interest. While such a climate model can be run for a historical or future period, in selecting a historically hot summer for Louisville in this study (2012), we were able to examine a period that is representative of what are likely to be typical summer temperatures in the future. The selection of a historical period further enabled the regional climate model estimates of meteorological variables to be compared with the limited set of weather station observations available for the summer of 2012. In comparing WRF temperature and humidity estimates for the grid cells in which two Louisville regional airports are located, we found model temperatures to fall within 0.3°F (0.17°C) or less, on average, of weather station observations during the 2012 warm season—suggesting a high level of agreement between modeled and observed temperatures. Over the 2012 warm season in Louisville (May through September), average daily high temperatures ranged from 82.4°F to 95.5°F and average daily minimum temperatures ranged from 62.7°F to 73.4°F (http://ndcd.noaa.gov).
A final advantage of regional climate models over satellite-derived land surface temperature or even directly monitored air temperature data is the utility of these models for scenario assessments of different heat management strategies. The development of a regional climate system model, once validated with historical weather observations, enables the behavior of the climate system to be explored in response to different land cover and energy use scenarios.
Methods: Urban Heat Management Scenarios
For this study, we compared modeled air temperature and relative humidity variables across the Louisville Metro area for the summer of 2012 to four additional scenarios through which regional vegetation was increased; the extent of highly reflective surface paving and roofing materials was increased; the regional magnitude of waste heat emissions from power plants, buildings, and vehicles was reduced; and all of these heat management strategies were combined. Each of these scenarios is described in turn, followed by a description of our approach to estimating heat-related mortality under each scenario.
Current Conditions
The Current Conditions scenario modeled temperature and humidity in response to current day development patterns. As such, the mix of surface paving, roofing materials, tree canopy, grass, and other land cover characteristics found in each grid cell match as closely as possible the current day development patterns. To estimate the area of these land cover characteristics per grid cell, we make use of parcel and roadway information provided by the Louisville / Jefferson County Information Consortium (LOJIC). LOJIC maintains very detailed and high-quality geographic information on all impervious surfaces throughout the county, including roadway areas by type (neighborhood streets vs. highways), building areas by type (residential buildings vs. commercial buildings), and other types of surface paving, including parking lots, sidewalks, and driveway areas. To classify the non-impervious components of county land use, we make use of satellite-measured land use information obtained from the U.S. Geological Survey (USGS). Classes of land cover obtained from the USGS database include tree canopy, grass, shrubs, cropland, pastureland, barren land, water, and wetland areas. The availability of data on both impervious and non-impervious land use conditions across the Louisville Metro area enables the estimation of the percent coverage of each of 15 classes of land cover within each grid cell, which may then be used to drive the WRF climate model. As discussed above, the Current Conditions scenario was first used to validate the climate model based on temperature observations from regional weather stations.
Greening Scenario
Through the Greening scenario, the area of tree canopy and grass was increased by grid cell in the WRF model to assess the potential benefits of increased vegetative cover for heat exposure. To direct where new tree canopy and grass areas should be targeted, the study assumed two new land use policies to be in place in the region. The first was a new zoning tool referred to as a “green area ratio.” Recently adopted in several U.S. cities including Seattle, Washington, and Washington, DC, a green area ratio policy sets minimum green cover targets for all residential, commercial, and industrial parcels that may be met through a wide range of landscaping techniques, such as planting trees, maintaining traditional lawn areas, and installing rain gardens or green roofs, among other options (District of Columbia Municipal Register 2016; Seattle Municipal Code 2018).
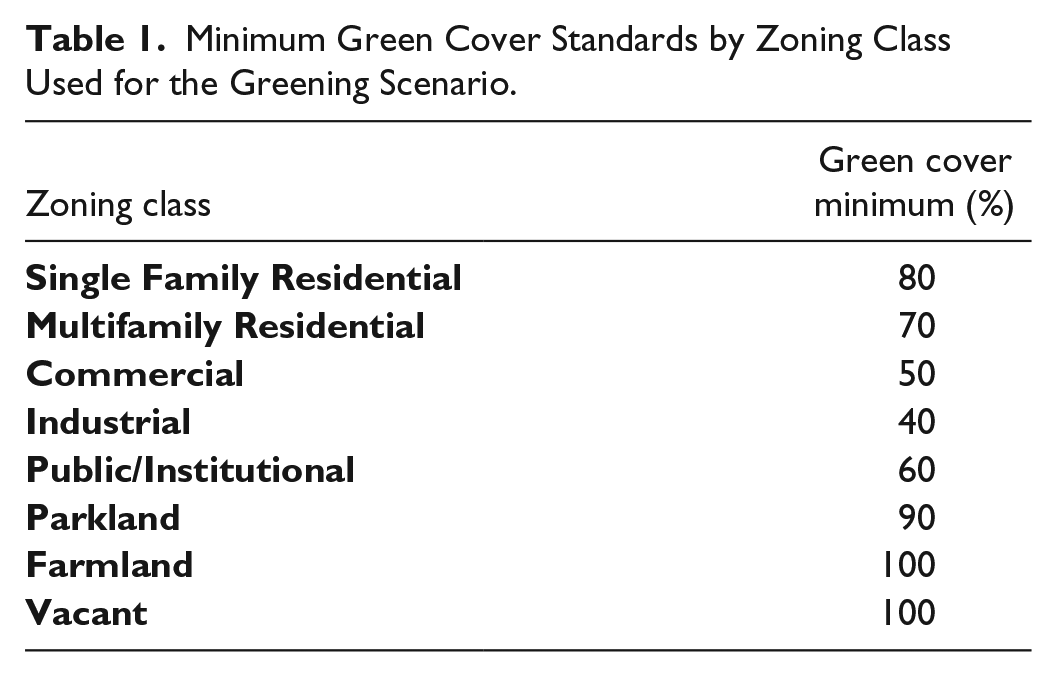
To tailor a set of minimum green cover standards, we first estimated the average green cover by zoning class across Louisville and then adopted green area targets that would have the effect of increasing green cover in the most densely developed zones. Table 1 presents the minimum green cover targets by zoning class. Based on these targets, tree canopy and grass area was added to any grid cell in which a minimum green cover standard, based on the mix and area of zoning classes found within the grid cell, is not met. We further assumed minimum tree cover standards by roadway type to be in place, ranging from 20 percent for arterials to 50 percent for residential streets—targets that were developed in concert with the City of Louisville Office of Sustainability, based on an assessment of current conditions and feasibility.
Minimum Green Cover Standards by Zoning Class Used for the Greening Scenario.
The second new land use policy assumed to be in place in the Louisville Metro region was a limitation on the area of barren land per parcel. Examples of barren land include construction sites, poorly maintained residential lawn areas, and nonvegetated vacant parcels. As barren land is mostly denuded of vegetation, its exposed soil can contribute to elevated solar absorption and sensible heating much in the same way a roadway or parking lot elevates local temperatures. Given the relatively low cost of converting barren soil to a grass land cover, we assumed through the Greening scenario that 80 percent of the barren land across the city could be converted to grass through the adoption of a barren land management program.
Cool Materials Scenario
Roads, parking lots, and building roofs account for a large percentage of the total surface area in Louisville. On average, grid cells in the city’s central business district (CBD) neighborhood are more than 65 percent impervious, with the remainder typically occupied by grass, trees, barren land, and water. Through the Cool Materials scenario, the reflectivity or “albedo” of roofing and surface paving was increased in the WRF model to reduce the quantity of sunlight absorbed by these materials and reemitted as sensible heat. Surface albedos are measured on a scale of 0 to 1.0, with values of 1.0 having the reflectivity of a mirror. Dark materials with high surface roughness, such as new black asphalt roofing shingle, exhibit albedos as low as 0.05. To model the effects of enhanced albedo, we assumed all commercial roofs to exhibit an albedo of 0.88, all residential roofs to exhibit an albedo of 0.65, and all roads to exhibit an albedo of 0.44 (consistent with concrete)—values achievable with commercially available roofing and paving materials designed to be highly reflective (Middel, Chhetri, and Quay 2015).
A second thermal property of impervious materials—the emissivity, or efficiency with which absorbed solar energy is reemitted as sensible heat—was also increased through this scenario to reduce material temperatures. High emissivity materials quickly release absorbed solar energy, reducing the quantity of solar energy that is retained by these materials and thus lowering temperatures. Thermal emissivity is also measured on a scale of 0 to 10, with higher values associated with a more rapid release of absorbed solar energy. Through the Cool Materials scenario, we increased the emissivity of all roofs, both commercial and residential, only marginally from 0.88 to 0.91, as high emissivity roofing products are less commonly available.
Energy Efficiency Scenario
As cars, trucks, and building heating and cooling systems consume less energy over time with technological improvements, the quantity of waste heat emitted per mile driven or per unit of indoor climate control falls as well, lowering the release of heat energy to the ambient air through vehicle tailpipes and air conditioning compressors. Through the Energy Efficiency scenario, the average quantity of waste heat emitted from vehicles and buildings was reduced by a fixed percentage responsive to ongoing and anticipated improvements in energy efficiency. In response to federal and state policies, vehicle fuel and building energy consumption in Kentucky have fallen over a recent five-year period by 5 and 4 percent, respectively (U.S. Energy Information Administration [USEIA] 2015). If these trends continue over the next few decades, a period in which energy improvements are projected to accelerate, vehicle fuel and building energy consumption in Kentucky may fall by 25 and 20 percent, respectively. For the Energy Efficiency climate model scenario, we assumed reductions in vehicle fuel consumption of 35 percent and building energy consumption of 30 percent, reflecting only a modest increase over projected trends for Kentucky over the next few decades (USEIA 2015).
Combined Strategies Scenario
The final heat management scenario carried out for this study entailed the combination of the Greening, Cool Materials, and Energy Efficiency scenarios. While each heat management strategy is expected to yield temperature reductions, on average, when applied as a stand-alone strategy, prior work suggests that the combination of strategies will achieve the most significant reductions in regional temperatures (Rosenzweig et al. 2006; Stone et al. 2014).
Methods: Estimating Heat-Related Mortality
To evaluate potential health benefits resulting from the heat management scenarios, we estimate the number of heat-related deaths over the summer of 2012 through the use of an exposure-response function associating temperature with daily mortality. Commonly employed in public health assessments for a wide range of environmental exposures, exposure-response functions for temperature have been developed for many cities and regions worldwide based on the observed association between temperature and daily or seasonal morality. For this study, we make use of an exposure-response function for heat-related mortality derived from temperature and mortality data collected in Louisville between 1985 and 2009 and analyzed with data from a global sample of large cities by Gasparrini et al. (2015).
To estimate daily heat-related mortality over the summer of 2012, we combined baseline rates of mortality from all causes with Louisville-specific relative risks of heat mortality and U.S. Census population estimates allocated to each ½ km2 (approx.) grid cell in the region. We made use of the U.S. Environmental Protection Agency Benefits Mapping and Analysis (BenMAP) program (http://www.epa.gov/benmap)—an online tool supportive of environmental health modeling applications—to allocate 2010 U.S. Census population counts to the WRF model’s 480 m grid. Baseline all-cause mortality rates were obtained for Louisville from the U.S. Centers for Disease Control and Prevention’s Wide-ranging ONline Database for Epidemiologic Research (CDC-WONDER) for the summers of 2010 to 2013, averaged to daily rates, and multiplied by grid cell populations to derive an estimate of daily all-cause mortality for each grid cell in the Louisville Metro region.
The daily mortality attributable to heat exposure under each scenario was then estimated through the following equation (based on Steenland and Armstrong 2006):
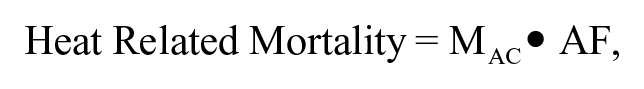
where MAC is the average daily mortality from all causes per grid cell and AF is the attributable fraction of deaths due to temperature, computed as (RR – 1)/RR, where RR is the relative risk of death at a given temperature (°F).
Employing this equation, the number of heat-related deaths per day was estimated for each grid cell across the study area. As the heat management scenarios modify daily temperatures in different zones of Louisville, the estimated number of heat-related deaths will change as well. Importantly, the number of heat-related deaths in any area of the region will be a product not only of the corresponding neighborhood temperature but also of the population composition of the neighborhood. Neighborhoods consisting of larger populations, or of a disproportionate number of sensitive individuals (e.g., the elderly), are more likely to have a higher number of heat-related deaths than neighborhoods with lower populations, assuming the same degree of temperature change in both areas. On average, the attributable fraction of daily deaths due to warm season temperatures across Louisville as a whole is 0.47 percent (Gasparrini et al. 2015).
Results: Temperature and Heat-Related Mortality in Louisville
The first step in the study approach was to map the distribution of near-surface air temperature across the Louisville Metro region during the 2012 warm season. Figure 1 presents the average daily high and low air temperatures across Louisville as estimated by WRF for May through September of 2012 under the Current Conditions scenario. Reported for each ½ km2 (approx.) grid cell across the modeling domain, the spatial pattern of air temperatures adheres well to an expected urban heat island structure, in which temperatures in proximity to the CBD and in the heavily industrialized southwestern quadrant of the region along the Ohio River were found to be elevated, with temperatures then tapering off toward more rural areas to the east and south. The daily maximum UHI intensity (the difference between the highest and lowest temperatures in Figure 1A) was found to average 5°F during the summer of 2012, with a more pronounced daily minimum UHI intensity (Figure 1B) of 13°F. Also consistent with theory and prior observations (Du and Li 2017; Hathway and Sharples 2012), the Ohio River was found to be among the coolest features during the day and among the warmest features during the night, when air temperatures drop more rapidly than the temperature of the river’s surface. As noted above, WRF results in proximity to regional airport weather stations were found to perform well.
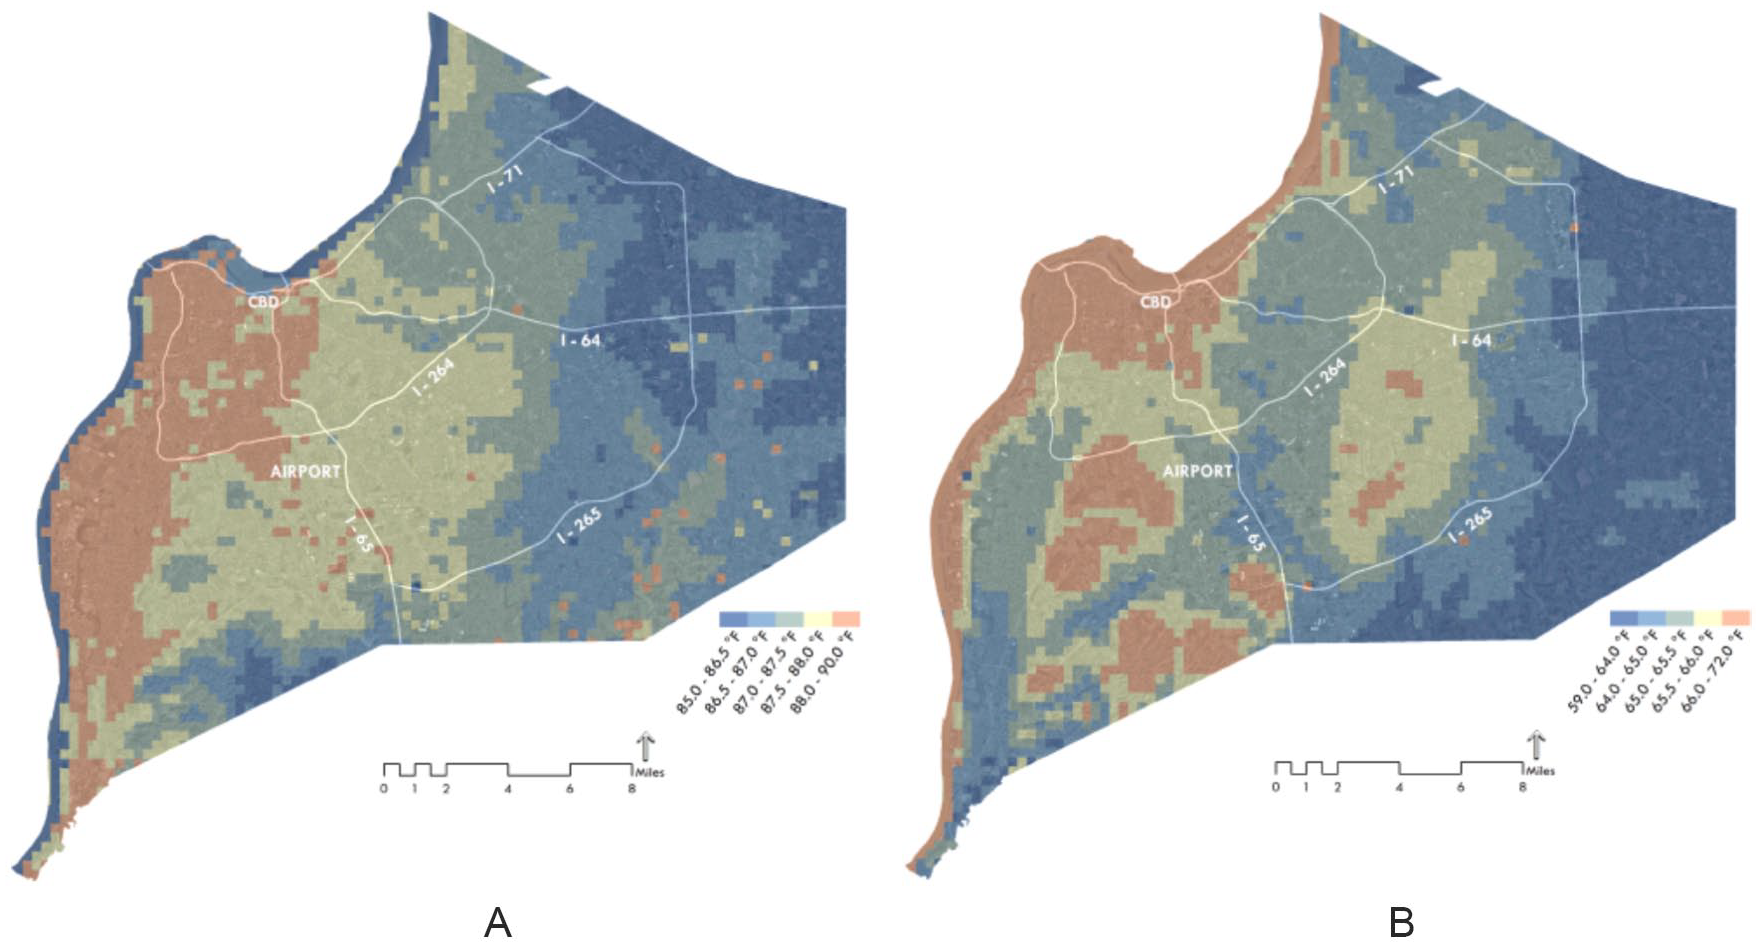
Average warm season (May through September 2012) daily (A) high and (B) low temperatures (°F).
As illustrated in Figure 2, heat management strategies were found to have a significant cooling effect on the Louisville Metro region. A combination of vegetation strategies, cool materials, and energy efficiency programs—the Combined Strategies scenario—was found to yield reductions in warm season average daily high and low temperatures in excess of 2°F in some zones across the region. For single hot days, reductions in high and low temperatures in excess of 5°F were found, suggesting the potential to reduce the UHI effect by 50 percent or more in heavily developed zones. The modeled heat management scenarios were found to yield an increase in warm season temperatures in less than 1 percent of grid cells, with extent of warming ranging from 0.6°F to 2.8°F and found largely outside of densely settled areas.
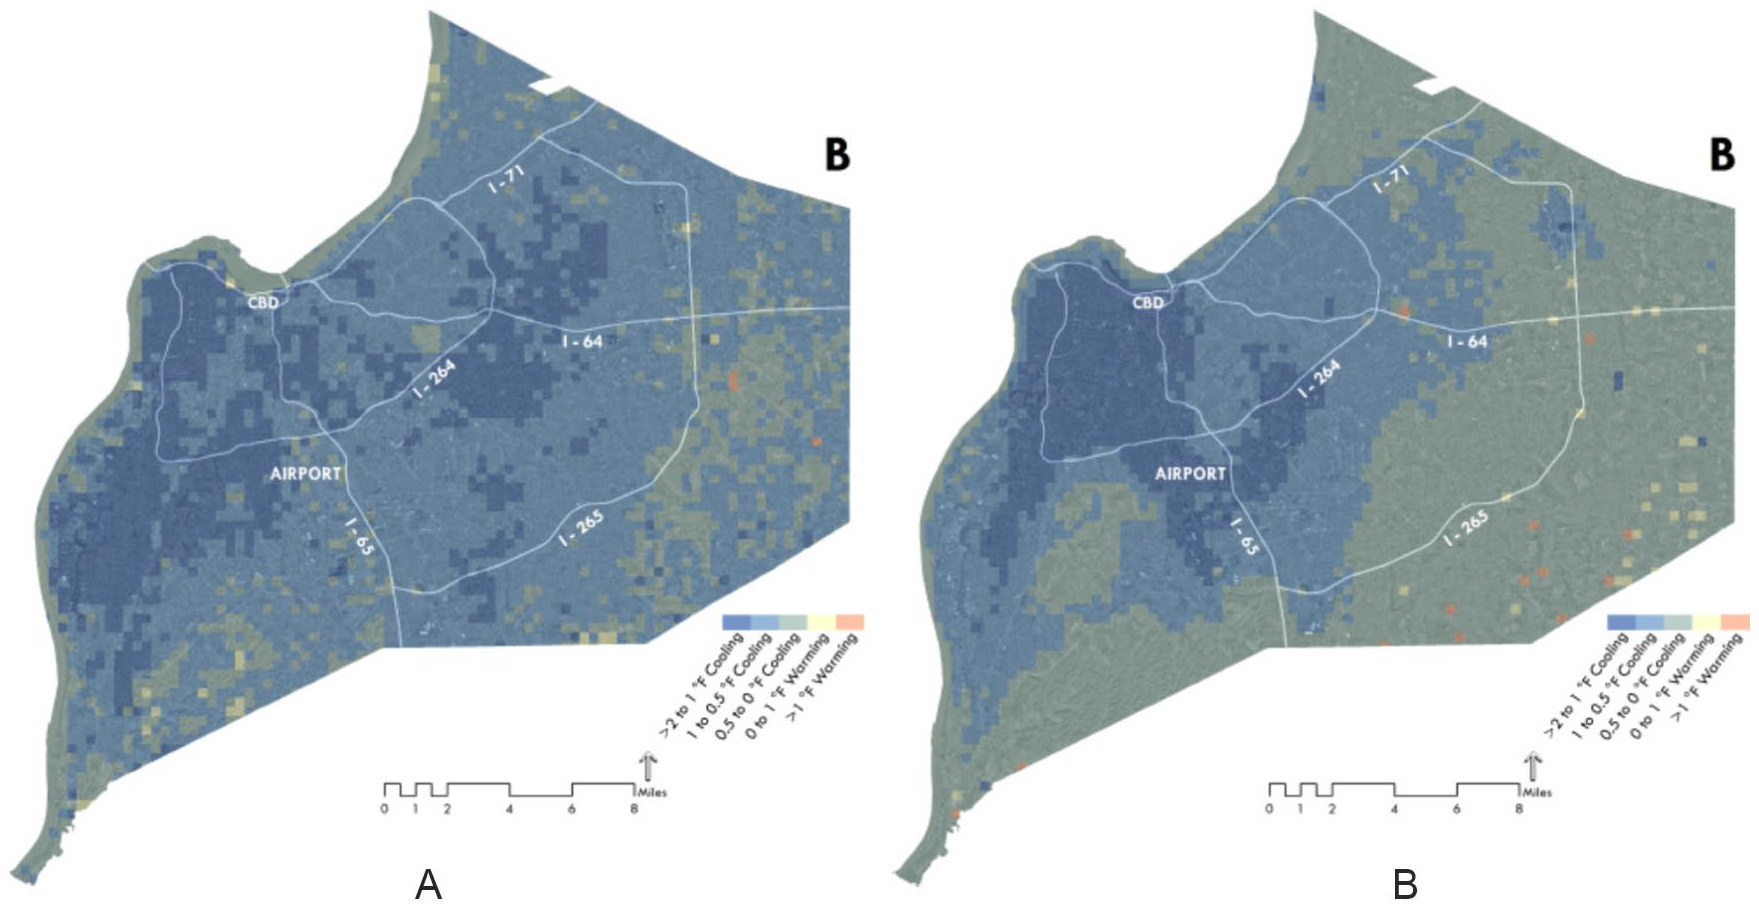
Change in warm season (May through September 2012) daily (A) high and (B) low temperatures under Combined Strategies scenario relative to Current Conditions (°F).
The second step in our approach was to estimate heat-related mortality associated with the temperature trends estimated for the summer of 2012 and each of the four heat management scenarios. As described above, we estimate heat-related mortality through the use of a heat exposure-response function derived from health surveillance data recording the number of deaths per day in Louisville. Applying this approach to the summer of 2012, we estimated that 86 additional deaths occurred between May and September of that year due to heat exposure. It is important to highlight that some portion of these deaths can be attributed to elevated temperatures produced by the city’s heat island, while the remainder would have occurred from regional temperature patterns—such as heat waves—that were experienced in both urban and rural locations in the region. As such, we estimated the “UHI-attributable” heat mortality by measuring the difference in temperature between rural and urban areas within the metro region and employing this temperature difference in the heat exposure-response function. Specifically, we first estimated the number of deaths that would have occurred if temperatures across the Louisville study area had been equal to those in proximate rural areas, and then subtracted this number from our estimate of heat-related deaths associated with the Current Conditions scenario, through which the influence of the urban heat island is reflected. Adopting this approach, we found the UHI-attributable heat mortality in Louisville over the 2012 warm season to be 53 additional deaths.
Figure 3 maps the distribution of UHI-attributable heat mortality across the urban core neighborhoods of Louisville. Categorized into low, medium, and high levels of mortality, each grid cell is coded based on how many of the UHI-attributable heat deaths estimated for the full region are allocated to the grid cell, based on the grid cell population and warm season average temperature. The resulting pattern follows closely the distribution of population density in Louisville, with areas found to be disproportionately hot or to capture a disproportionate share of the elderly population to exhibit higher levels of UHI-attributable heat mortality. Figure 3 finds relatively higher density and lower income neighborhoods to the west of the CBD, such as the Portland and Shawnee neighborhoods, to be associated with higher heat mortality than less dense and higher income districts to the east, such as the Crescent Hill and Saint Matthews neighborhoods.
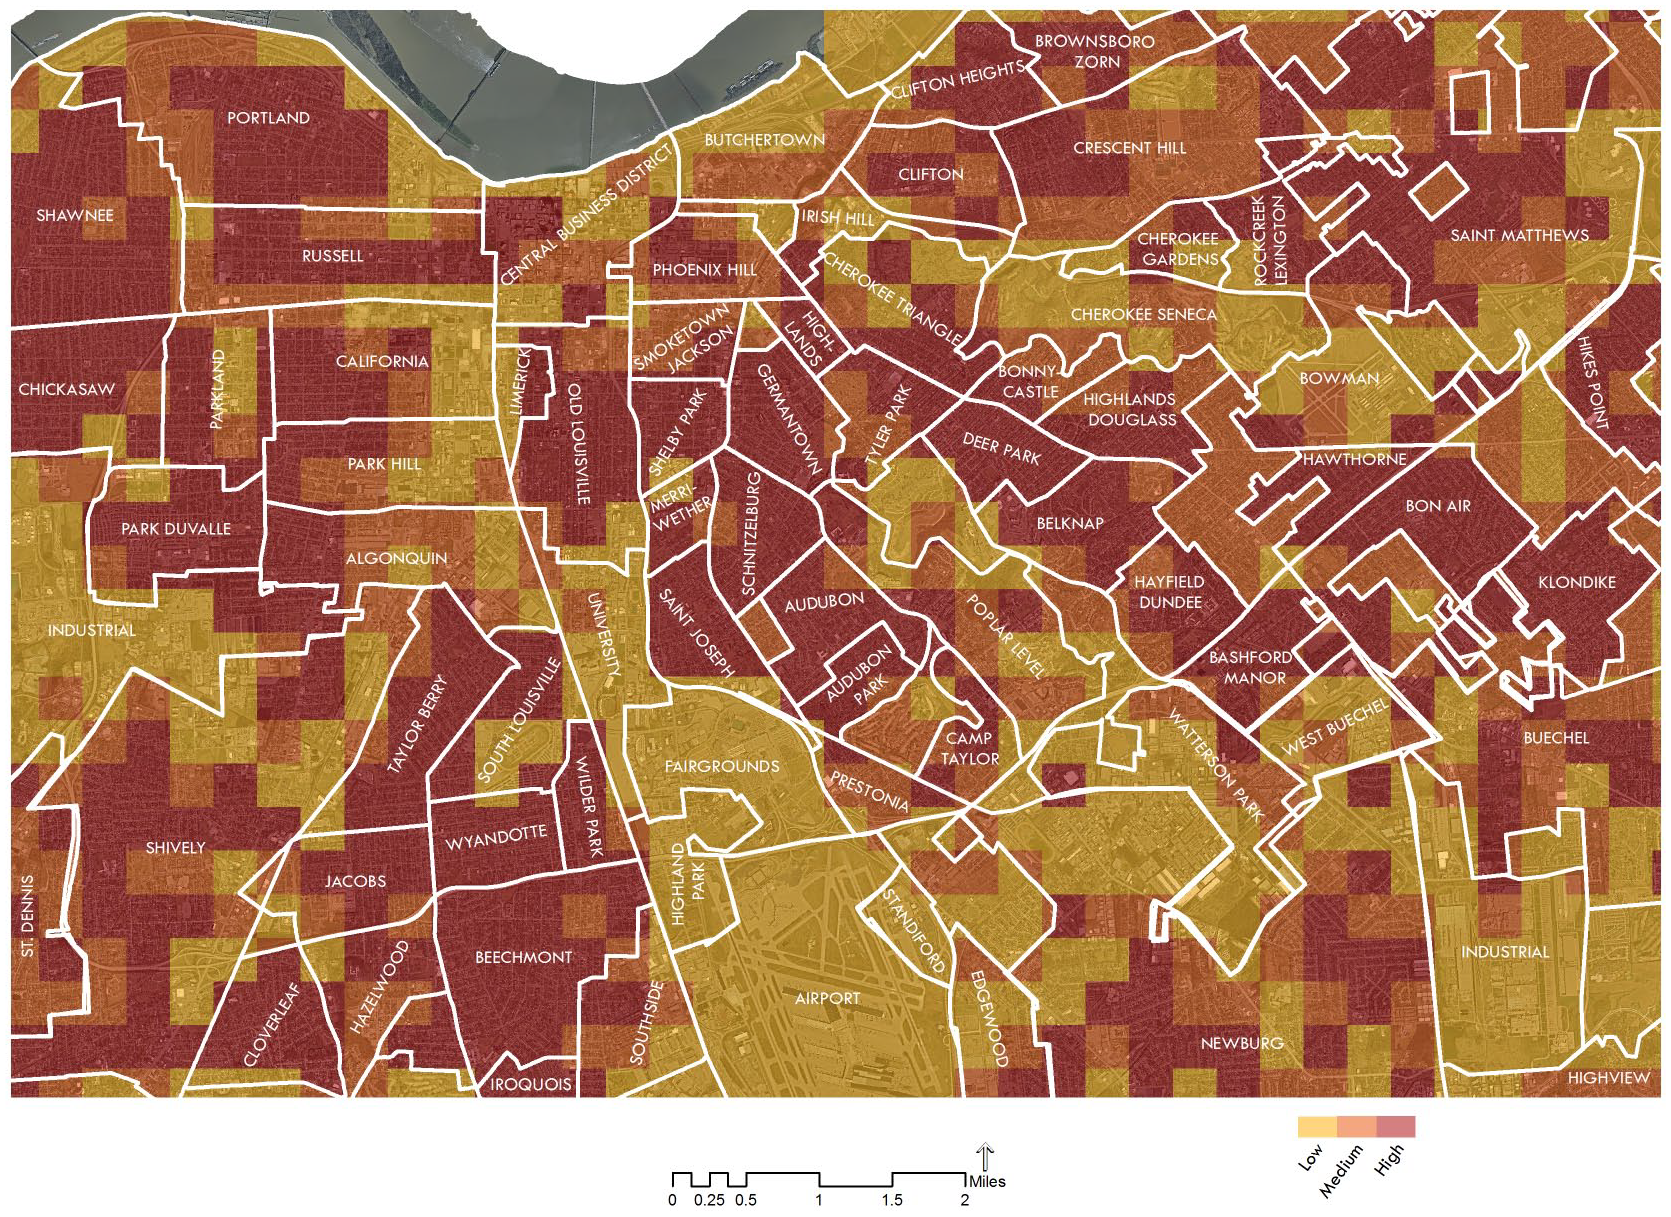
Distribution of estimated UHI-attributable heat mortality in Louisville urban core neighborhoods by grid cell during May to September of 2012.
The final step in our approach was to estimate the change in UHI-attributable heat mortality resulting from the adoption of urban heat management strategies. The Combined Strategies scenario was found to reduce estimated UHI-attributable heat mortality over the 2012 warm season from 53 to 42 deaths, a reduction of more than 20 percent across the full region, and of more than 22 percent in the urban core neighborhoods. Figure 4 maps the distribution of avoided UHI-attributable heat mortality (the reduction in deaths due to heat management) across the urban core neighborhoods, finding the benefits of urban heat management to be greatest in the zones associated with the areas of highest estimated heat mortality. As discussed in the concluding section of this article, the development of such heat-health impact maps enables targeted interventions to minimize heat-related mortality in large urban environments subject to rising temperatures through ongoing climate change.
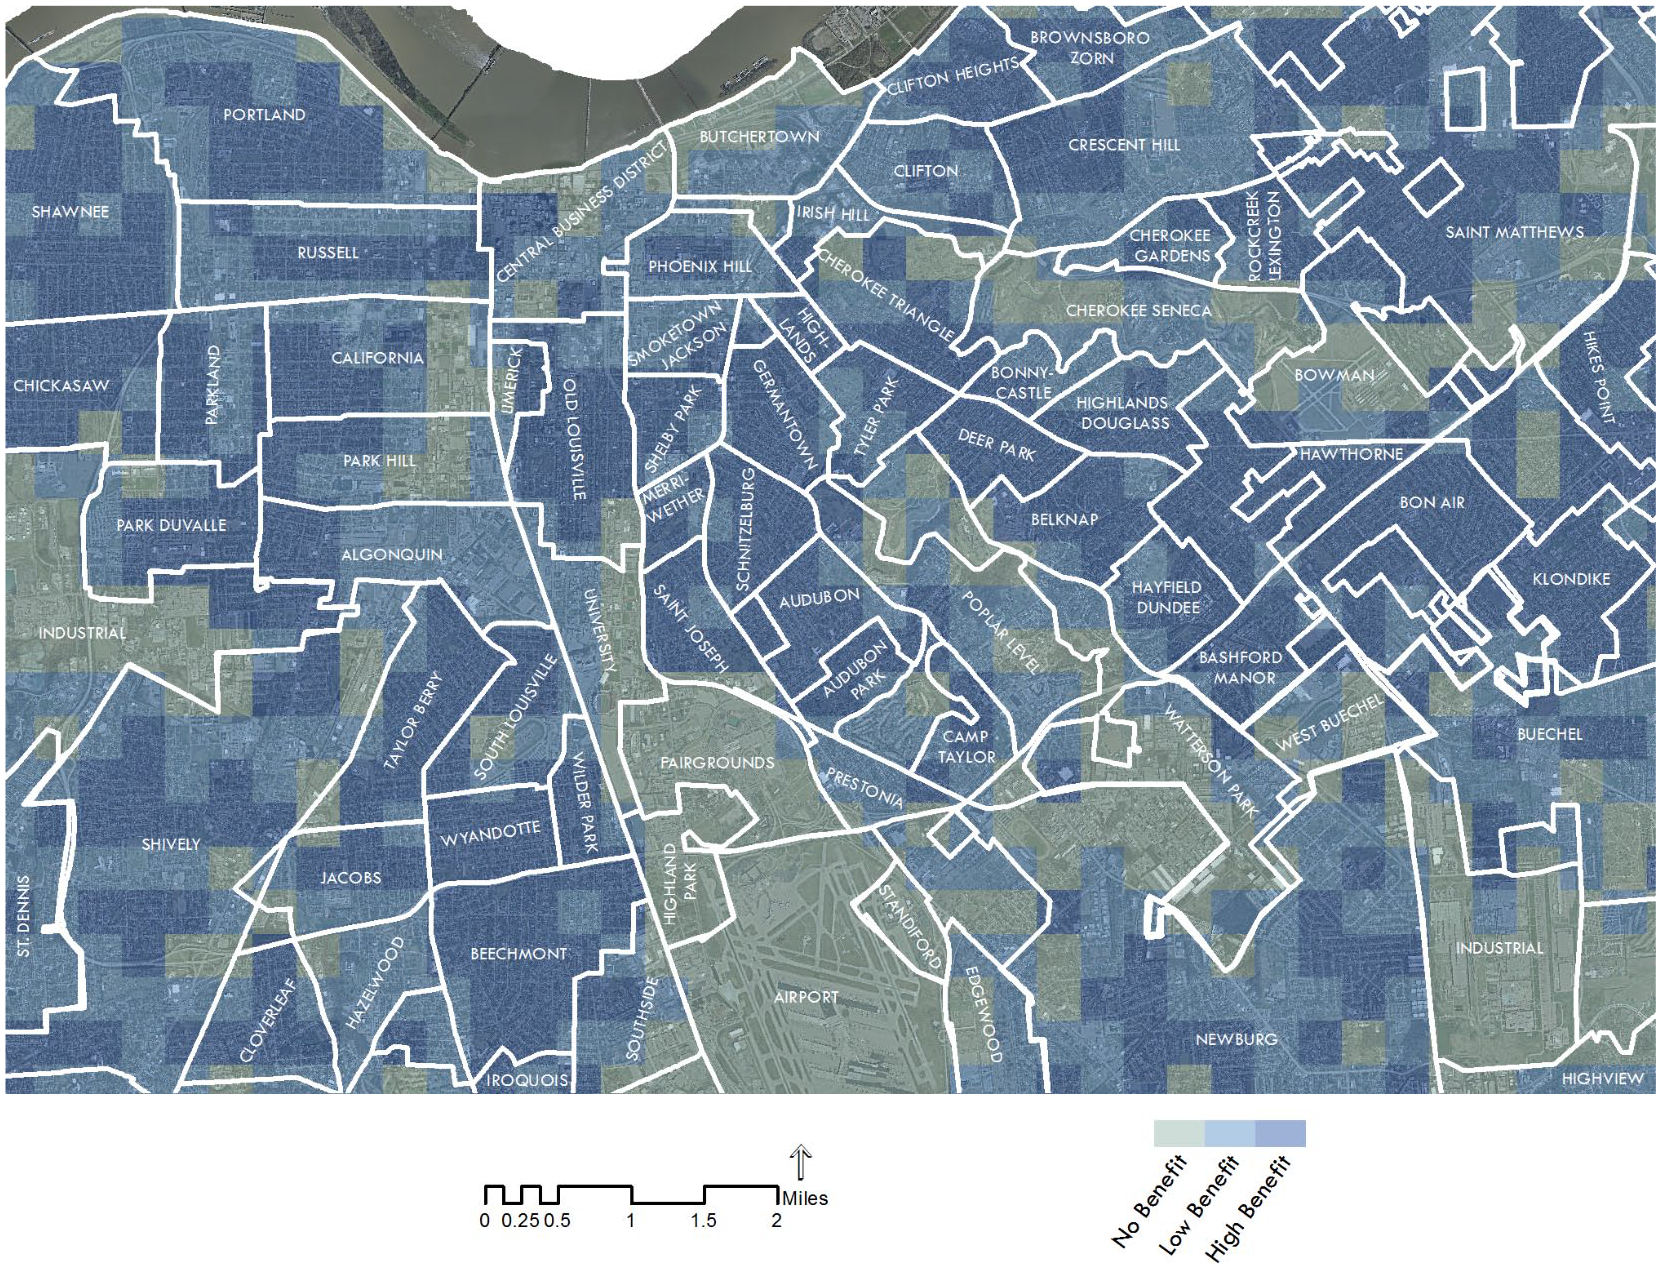
Distribution of avoided UHI-attributable heat mortality in Louisville urban core neighborhoods by grid cell during May to September of 2012.
An Emerging Framework for Heat Adaptation Planning
If municipal and state governments are to effectively respond to the growing threat of extreme heat to urban populations, they will need to broaden policies and programs beyond short-term hazard mitigation plans triggered only at the time of an extreme heat event. While improved forecasting, heat warning systems, the provision of cooling centers, and the direction of assistance to vulnerable residents have all proven effective policies in reducing heat mortality in the aftermath of deadly events, such as the 1995 Chicago and the 2003 European heat waves (Robine et al. 2007; Semenza et al. 1996), there is a risk of heat-related mortality throughout the warm season, both during and outside of extreme heat events. In addition to enhanced emergency response planning, local and state governments can lessen the health risk of rising temperatures through land use and urban design practices responsive to heat, as well as through energy efficiency programs designed to lessen waste heat emissions from buildings and vehicles.
To this policy end, our study of urban heat management and health in Louisville yields important insights for planning practice. The first of these is that widely used regional climate modeling and health impact estimation tools are now supportive of neighborhood-scale assessments of human heat risk. In contrast to heat vulnerability indices, which map proxies of heat risk, such as the area of impervious or vegetative cover per neighborhood, heat exposure-response functions derived from local mortality surveillance data enable city-specific assessments of current and projected heat mortality, providing a more reliable basis for the targeting of heat adaptation strategies.
Our assessment in Louisville clearly illustrates the importance of targeting heat adaptation strategies, such as tree planting and cool materials, to zones of the highest likely health impact, as opposed to sparsely populated industrial zones that are found to exhibit high temperatures. While heat mitigation in sparsely populated industrial zones may yield limited cooling benefits for other zones within the city, the most effective interventions will be targeted to areas of high population or employment densities. The scale of our assessment further supports the development of neighborhood-specific policy recommendations. Table 2 presents specific targets for tree planting, new cool roofing, and new cool paving strategies for a sampling of urban core neighborhoods in Louisville, enabling city planners, nonprofit organizations, and neighborhood associations to assess the cost of specific programs and undertake near- to medium-term actions to promote heat adaptation.
Urban Heat Management Strategies by Louisville Urban Core Neighborhood.
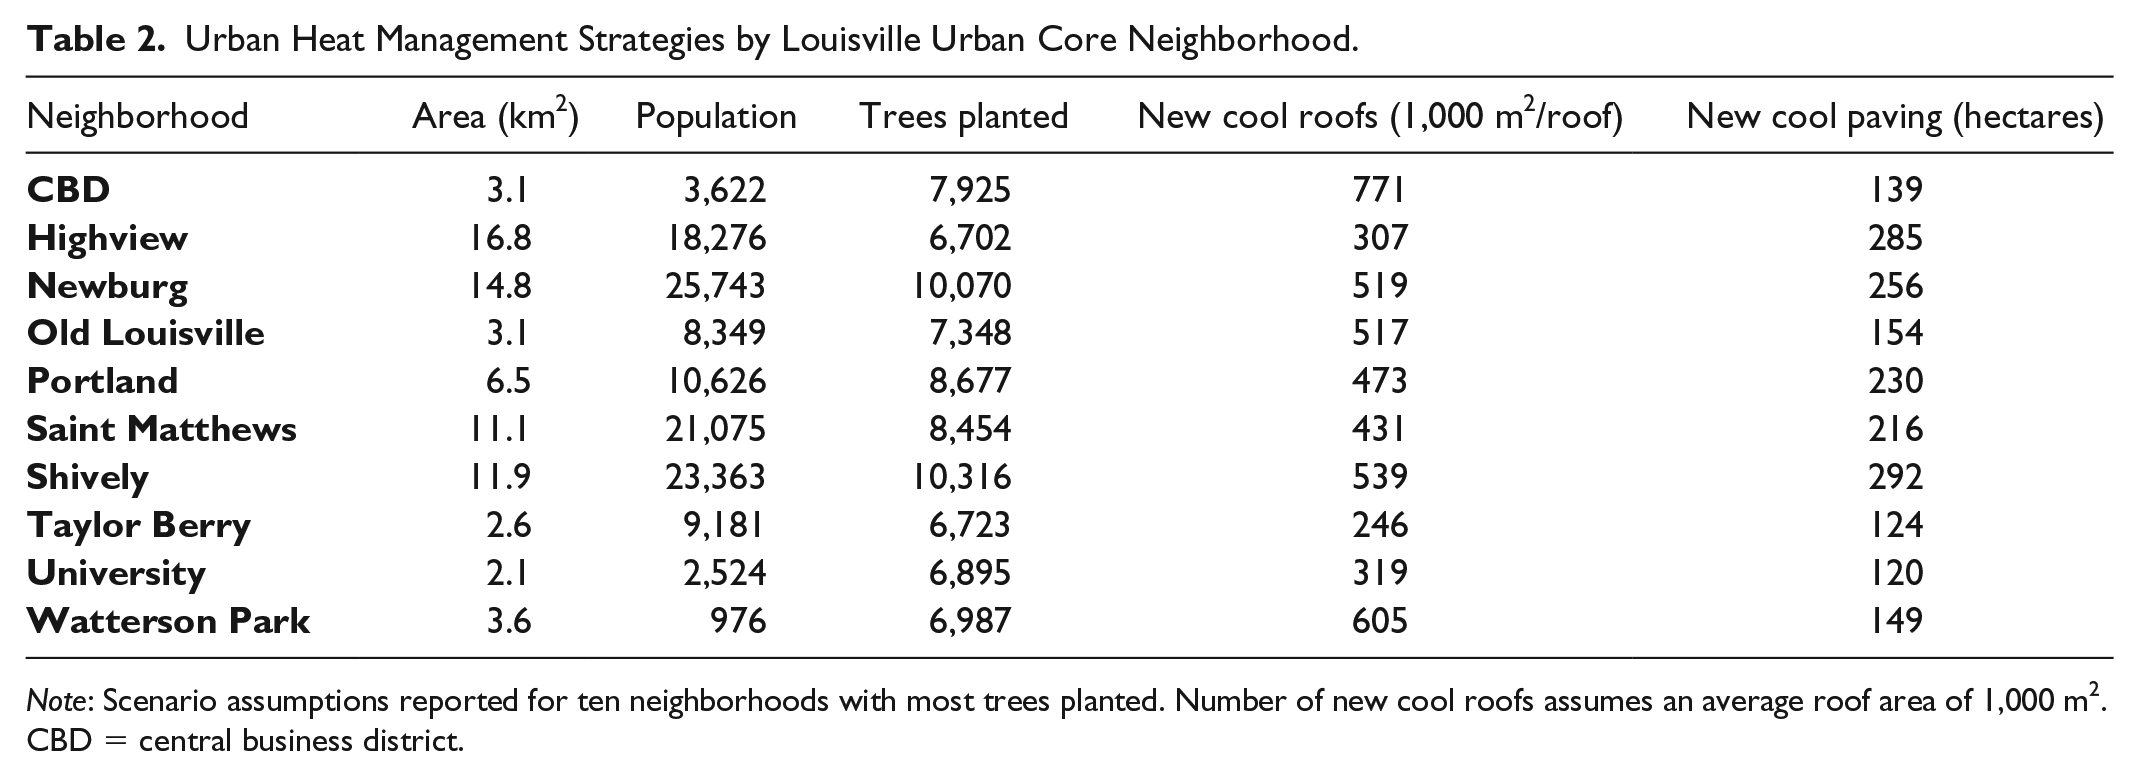
Note: Scenario assumptions reported for ten neighborhoods with most trees planted. Number of new cool roofs assumes an average roof area of 1,000 m2. CBD = central business district.
We find greening strategies to yield the greatest health benefits when accounting for the area of heat mitigating material. On average, each additional square meter of tree canopy or grass added across Louisville was found to yield temperature reductions 1.2 times greater than each square meter of reflective roofing or paving. However, the specific development policies modeled through our scenario assessment were found to convert a larger total area to new cool materials than to new vegetation. This outcome reflects the greater feasibility of converting streets, parking lots, and building roofs to cool materials than to grass or overlying tree canopy. For example, while an entire parking lot feasibly can be resurfaced with cool materials, even the most ambitious tree planting regulations are unlikely to fully shade a parking lot. As more total land area was converted to cool materials than to new vegetation, the city-wide temperature and health benefits of the Cool Materials scenario were found to be greater than the benefits of the Greening scenario.
Of the three stand-alone heat adaptation strategies evaluated, energy efficiency programs were found to have the least beneficial effects in terms of reduced temperatures and avoided heat mortality. Projected reductions in building and vehicle energy consumption of 30 and 35 percent, respectively, were found to lower average warm season daily high temperatures by 0.5°F or less throughout most of Louisville, much less than found under the Greening or Cool Materials scenarios. We attribute this result to the lower responsiveness of urban heat islands to waste heat emissions, as found in prior work (Hart and Sailor 2009), and to a relatively modest set of assumptions pertaining to how energy efficiency may improve over time. In contrast to vegetative and cool materials strategies, which are fully within the regulatory purview of municipal governments, energy efficiency standards are more commonly determined at the state and federal levels, limiting the extent to which historical rates of efficiency improvements, which provide the basis for this scenario, have changed. Nonetheless, of the three adaptation approaches considered, waste heat management is the most compatible with climate change mitigation policies designed to lessen greenhouse gas emissions. As such, energy efficiency programs are well suited to heat adaptation efforts in large cities and provide an important bridge between local and global climate change management programs.
A key limitation of the heat adaptation framework examined in this article is its reliance on regional climate model output to drive a health impact function. The Weather Research and Forecasting model requires specialized knowledge to run, as well as access to extensive computing capacity—two resources that may not be available to a municipal planning office or public health department. Similar to regional traffic demand or air quality modeling exercises that are often contracted out by local or regional governments to consultants, a comprehensive assessment of current and future heat exposure across a metropolitan area may require that city governments partner with academic institutions or a private consulting firm equipped to develop climate-related datasets and forecasts (Plumer 2018). Given the wide array of health and urban infrastructure impacts posed by climate change, we contend that all major cities should be commissioning regionally downscaled climate projections to inform adaptation planning for heat management, stormwater and flood management, and regional energy demand, as well as the maintenance of climate-sensitive infrastructure. While only one U.S. city to date—New York—has convened its own climate change scientific panel to develop a regionally focused set of climate projections, others have partnered with consultants for this purpose (New York City Panel on Climate Change 2015).
For municipal governments interested in developing district-level estimates of heat-related mortality and/or morbidity without the expense of running a regional climate model, two alternative approaches to measuring and mapping local temperatures are available. The first of these is publicly available datasets of interpolated air temperature for the continental United States. The Daymet and Parameter-elevation Relationships on Independent Slopes Model (PRISM) datasets record at a high resolution (1 km2 or less) daily interpolated near-surface air temperature for all urban areas of the continental United States (Daly et al. 2008; Thornton et al. 2018). Modeled from the limited number of weather stations found within metropolitan areas, and statistically adjusted for elevation and dominant land cover type, the precision of these interpolated air temperature estimates is directly responsive to the density of weather observations within an urban area. The availability of a uniformly gridded set of daily maximum, minimum, and average temperatures enables the use of these estimates to drive a health impact function associating daily heat-related mortality with air temperature. The reliability of heat-related mortality or morbidity outcomes would be expected to vary with the density of weather observations stations used for the interpolation of air temperatures.
A second alternative for estimating air temperatures across different zones of a city is through the establishment of a uniformly distributed network of small temperature and humidity sensors. Such sensors, often referred to as “HOBOs” after the most widely used commercially available sensor, are compact in size, are easily mounted on telephone poles or lampposts, and can be selected for manual or wireless data retrieval. Relatively inexpensive at between $200 and $400 per sensor, HOBOs provide the most reliable means of monitoring heat exposure in urban environments and, similar to interpolated temperature data, can be substituted for the modeled climate data used in this study to estimate heat-related mortality. Programs such as Baltimore’s B’more Cool initiative have partnered with citizen engagement and science organizations to construct and deploy low-cost temperature sensors across urban areas (Baltimore Office of Sustainability 2018). Partnerships between the city and local institutions could gather high-resolution temperature data while simultaneously providing outreach and educational opportunities on the risks of heat exposure and strategies to enhance personal resilience.
While both of these alternatives would enable local planners or public health officials to develop their own estimates of neighborhood-scale heat mortality and morbidity, an important drawback of these approaches to measuring air temperature relative to a regional climate model is the inability to perform scenario modeling of specific heat management strategies. For cities interested in directly assessing the neighborhood-scale climate and health benefits of a tree planting campaign or a cool roofing ordinance, for example, only the use of a regional climate modeling tool would support such scenario assessments.
In this article, we have presented an early framework for assessing and responding to the threat of extreme heat at the neighborhood level across Louisville, Kentucky, one of the most rapidly warming cities in the United States. We find measurable and significant reductions in heat-related mortality to be achievable through the expansion of vegetation and cool materials across a metropolitan area, with reductions in waste heat emissions found to yield more modest benefits.
The need for large cities to undertake expansive and comprehensive climate change adaptation programs to protect their populations is widely and urgently apparent. Confronted with a growing array of threats to critical infrastructure and human health, ranging from more frequent extreme weather events, to unprecedented wildfires, to the geographic expansion of infectious disease agents with a warming climate, city planning and public health officials increasingly will be tasked with the responsibility of enhancing climate resilience in the design and management of cities. It is our view that central to this responsibility is the need for a new class of plans—climate adaptation plans—responsive to a range of intensifying hazards, with extreme heat at the forefront of emerging health threats in large cities.
Footnotes
Acknowledgements
We would further like to acknowledge the contributions of Dr. Peng Liu to the climate modeling performed for this study.
Declaration of Conflicting Interests
The author(s) declared no potential conflicts of interest with respect to the research, authorship, and/or publication of this article.
Funding
The author(s) disclosed receipt of the following financial support for the research, authorship, and/or publication of this article: This study was made possible by a grant from the Office of Sustainability, City of Louisville.